bed-material entrainment potential, roaring fork river at basalt
TRANSCRIPT

U.S. GEOLOGICAL SURVEY
Water-Resources Investigations Report
Bed-Material Entrainment Potential, Roaring Fork River at Basalt, Colorado
By John G. Elliott
Denver, Colorado2002
02–4223
Prepared in cooperation with the TOWN OF BASALT, COLORADO

U.S. DEPARTMENT OF THE INTERIORGALE A. NORTON, Secretary
U.S. GEOLOGICAL SURVEY
Charles G. Groat, Director
The use of firm, trade, and brand names in this report is for identification purposes only and doesnot constitute endorsement by the U.S. Geological Survey.
For additional information write to: Copies of this report can be purchased
U.S. Geological SurveyInformation ServicesBox 25286Denver Federal CenterDenver, CO 80225
from:
District Chief U.S. Geological Survey Box 25046, Mail Stop 415 Denver Federal Center Denver, CO 80225–0046

Cover photograph:
Roaring Fork River at Basalt, Colorado
Aerial photograph taken November 8, 2000Discharge approximately 290 cubic feet per second
Aerial photograph supplied by the Matrix Design Group, Denver, Colorado
CONTENTS
Abstract.................................................................................................................................................................................. 1Introduction............................................................................................................................................................................ 2
Purpose and Scope....................................................................................................................................................... 4Acknowledgments ....................................................................................................................................................... 4Study Area ................................................................................................................................................................... 4Previous Investigations ................................................................................................................................................ 5Study Methods ............................................................................................................................................................. 5
Bed-Material Entrainment Estimation................................................................................................................................... 11Water-Surface Profiles and Hydraulic Geometry ........................................................................................................ 11
HEC–RAS Calculations..................................................................................................................................... 11Additional Water-Surface Profiles ..................................................................................................................... 12Hydraulic Geometry .......................................................................................................................................... 15
Bed-Material Characteristics ....................................................................................................................................... 15Sampling Sites ................................................................................................................................................... 15Size Analysis ..................................................................................................................................................... 15
Flood-Generated Shear Stress and Entrainment Potential........................................................................................... 15Shear Stress Estimation ..................................................................................................................................... 15Critical Shear Stress........................................................................................................................................... 19Entrainment Potential ........................................................................................................................................ 21
Analysis ....................................................................................................................................................................... 21Summary................................................................................................................................................................................ 28References Cited.................................................................................................................................................................... 31
FIGURES
1. Map showing location of study area and the Roaring Fork River study reach at Basalt, Colorado.......................... 32A–2D. Aerial photographs showing the:
2A. Study reach taken November 8, 2000, showing the Roaring Fork River at a flow of approximately 290 cubic feet per second, cross-section and sediment-sampling sites, and the edge of water at 1,260 cubic feet per second ............................................................................................................................... 6
2B. Study reach taken November 8, 2000, showing the Roaring Fork River at a flow of approximately 290 cubic feet per second, cross-section and sediment-sampling sites, and the edge of water at 1,260 cubic feet per second ............................................................................................................................... 7
2C. Study reach taken November 8, 2000, showing the Roaring Fork River at a flow of approximately 290 cubic feet per second, cross-section and sediment-sampling sites, and the edge of water at 1,260 cubic feet per second ............................................................................................................................... 8
2D. Study reach taken November 8, 2000, showing the Roaring Fork River at a flow of approximately 290 cubic feet per second, cross-section and sediment-sampling sites, and the edge of water at 1,260 cubic feet per second ............................................................................................................................... 9
3. Cross section 6, approximately 675 feet downstream from Highway 82 Upper Bypass Bridge, showing surveyed and simulated water-surface elevations for several streamflows ....................... 10
4A–4D. Longitudinal profiles of the:4A. Roaring Fork River at Basalt, Colorado, showing simulated water-surface profiles for various floods,
the water-surface profile surveyed June 2001, and cross-section locations. ..................................................... 134B. Roaring Fork River at Basalt, Colorado, showing simulated water-surface profiles for various floods,
the water-surface profile surveyed June 2001, and cross-section locations. ..................................................... 134C. Roaring Fork River at Basalt, Colorado, showing simulated water-surface profiles for various floods,
the water-surface profile surveyed June 2001, and cross-section locations. ..................................................... 144D. Roaring Fork River at Basalt, Colorado, showing simulated water-surface profiles for various floods,
the water-surface profile surveyed June 2001, and cross-section locations. ..................................................... 14
CONTENTS III

5. Cross section showing cross-channel shear-stress distribution and mean shear stress for the 100-year flood and the bar-inundating flow, Roaring Fork River at Basalt, cross section 6 ............................................................. 19
6. Graph showing downstream mean shear-stress distribution on the streambed at various discharges and critical shear stress for sediment on the streambed at cross sections 2 through 19 .................................................. 20
7. Graphs showing entrainment potential of the streambed, thalweg, and alluvial bars at the (A) bar-inundatingdischarge, (B) 10-year flood, (C) 50-year flood, and (D) 100-year flood, Roaring Fork River at Basalt ................ 22
TABLES
1. Hydraulic geometry from selected cross sections in the Roaring Fork River study reach ..................................... 162. Sediment-size characteristics of the streambed, alluvial bars, and streambanks of the Roaring Fork River
at Basalt ................................................................................................................................................................... 25
CONVERSION FACTORS, VERTICAL DATUM, AND ABBREVIATIONS
Sea level: In this report "sea level" refers to the National Geodetic Vertical Datum of 1929—a geodetic datum derived from a general adjustment of the first-order level nets of the United States and Canada, formerly called Sea Level Datum of 1929
Multiply By To obtain
millimeter (mm) 0.03937 inchmeter (m) 3.281 foot (ft)
kilograms per square meter (kg/m2) 0.2048 pounds per square foot (lb/ft2)newtons per square meter (N/m2) 0.02088 pounds per square foot (lb/ft2)newtons per cubic meter (N/m3) 0.006365 pounds per cubic foot (lb/ft3)
foot (ft) 0.3048 meter (m)mile 1.609 kilometers (km)acre 4,047 square meter (m2)
square mile (mi2) 2.590 square kilometers (km2)cubic foot per second (ft3/s) 0.02832 cubic meter per second (m3/s)
acre-foot (acre-ft) 1,233 cubic meter (m3)ton, short 0.9072 megagram (Mg)
IV CONTENTS
Bed-Material Entrainment Potential, Roaring Fork River at Basalt, Colorado
By John G. Elliott
Abstract
The Roaring Fork River at Basalt, Colo-rado, has a frequently mobile streambed composed of gravel, cobbles, and boulders. Recent urban and highway development on the flood plain, earlier attempts to realign and confine the channel, and flow obstructions such as bridge openings and piers have altered the hydrology, hydraulics, sediment transport, and sediment deposition areas of the Roaring Fork. Entrainment and deposition of coarse sediment on the streambed and in large alluvial bars have reduced the flood-conveying capacity of the river. Previous engineering studies have identified flood-prone areas and hazards related to inunda-tion and high streamflow velocity, but those studies have not evaluated the potential response of the channel to discharges that entrain the coarse streambed. This study builds upon the results of earlier flood studies and identifies some potential areas of concern associated with bed-material entrainment.
Cross-section surveys and simulated water-surface elevations from a previously run HEC–RAS model were used to calculate the boundary shear stress on the mean streambed, in the thalweg, and on the tops of adjacent alluvial bars for four reference streamflows. Sediment-size characteristics were determined for surficial mate-rial on the streambed, on large alluvial bars, and on a streambank. The median particle size (d50) for the streambed samples was 165 millimeters and for the alluvial bars and bank samples was 107 millimeters.
Shear stresses generated by the 10-, 50-, and 100-year floods, and by a more common flow
that just inundated most of the alluvial bars in the study reach were calculated at 14 of the cross sections used in the Roaring Fork River HEC–RAS model. The Shields equation was used with a Shields parameter of 0.030 to estimate the crit-ical shear stress for entrainment of the median sediment particle size on the mean streambed, in the thalweg, and on adjacent alluvial bar surfaces at the 14 cross sections.
Sediment-entrainment potential for a specific geomorphic surface was expressed as the ratio of the flood-generated boundary shear stress to the critical shear stress (τ o/τ c) with respect to two threshold conditions. The partial entrainment threshold (τ o/τ c=1) is the condition where the mean boundary shear stress (τ o) equals the crit-ical shear stress for the median particle size (τ c) at that cross section. At this threshold discharge, the d50 particle size becomes entrained, but move-ment of d50-size particles may be limited to a few individual particles or in a small area of the stre-ambed surface. The complete entrainment threshold (τ o/τ c=2) is the condition where τ o is twice the critical shear stress for the median particle size, the condition where complete or widespread mobilization of the d50 particle-size fraction is anticipated.
Entrainment potential for a specific refer-ence streamflow varied greatly in the downstream direction. At some cross sections, the bed or bar material was mobile, whereas at other cross sections, the bed or bar material was immobile for the same discharge. The significance of down-stream variability is that sediment entrained at one cross section may be transported into, but not through, a cross section farther downstream, a
Abstract 1

situation resulting in sediment deposition and possibly progressive aggradation and loss of channel conveyance.
Little or no sediment in the d50-size range is likely to be entrained or transported through much of the study reach by the bar-inundating stream-flow. However, the entrainment potential at this discharge increases abruptly to more than twice the critical value, then decreases abruptly, at a series of cross sections located downstream from the Emma and Midland Avenue Bridges. Median particle-size sediment is mobile at most cross sections in the study reach during the 10-year flood; however, the bed material is immobile at cross sections just upstream from the Upper Bypass and Midland Avenue Bridges. A similar situation exists upstream from all three bridges in the study reach for the 50- and 100-year floods. Anecdotal evidence and aerial photographs from 1987, 1997, and 2000 indicate streambed aggra-dation or alluvial bar formation upstream from each bridge.
The reach downstream from the Upper Bypass Bridge was characterized by a consis-tently moderate to high entrainment potential at the 10-, 50-, and 100-year floods. Moderate to high entrainment potential in this reach may be a relict condition from a late-19th century effort to straighten the channel, an action that conse-quently steepened the channel as well. The poten-tial for bed-material entrainment at all simulated flood discharges in this reach could indicate that this reach is an efficient transporter of supplied sediment. The river reach between the confluence of the Fryingpan River and the Midland Avenue Bridge is hydraulically complex, geomorphically dynamic, and not well represented by the HEC–RAS one-dimensional streamflow model used in this study. Aerial photography and anecdotal evidence indicate this reach recently has been an area of streambed deposition.
Entrainment estimates in this report are limited by the precision and availability of data that were used to calculate shear stresses under the discharge scenarios. The location and spacing of cross sections, the resolution of channel geom-
etry from widely spaced surveyed points, and the model-generated water-surface slopes from the HEC–RAS model are relatively insensitive to the scale and scope of this investigation, the main flood-conveying channel where entrainable sedi-ment is stored. Additional sediment measure-ments or onsite observation of sediment entrainment would allow calculation of the Shields parameter, rather than an estimate. More topographic detail of the streambed and channel in some reaches would allow more precise esti-mates of shear stress and sediment-entrainment potential.
INTRODUCTION
The town of Basalt, Colorado, is located at the confluence of the Fryingpan River with the Roaring Fork River in Eagle and Pitkin Counties (fig. 1). The Roaring Fork River is a single-thread, high-gradient, cobble/boulder-bed river that presents a natural hazard to the town, nearby residential structures, several bridges and roadways, and the municipal waste-treat-ment facility. The hazard originates from high velocity snowmelt runoff and a high bedload-transport rate that cause intermittent channel realignment as well as scour and deposition of coarse-grain bars and islands. Recent urban, highway, and recreational development on the flood plain, earlier attempts to realign and confine the Roaring Fork channel with retaining walls and levees, and flow obstructions such as bridge open-ings and piers have altered the hydraulics, sediment transport, and sediment deposition in the river at Basalt.
Gravel-, cobble-, and boulder-size bed material is transported almost annually in the Roaring Fork River. Deposition of this coarse sediment on the streambed and in large alluvial bars has reduced the flood-conveying capacity of the river at the Upper Bypass Bridge, through Basalt, and downstream from the Fryingpan River confluence. In addition, sedimen-tation may have diminished fish habitat in the study reach and affected the function of an irrigation intake structure (Dave Konchan, Town of Basalt, oral commun., 2000). Sediment must be mechanically removed from the Upper Bypass Bridge and other reaches annually to maintain channel conveyance.
2 Bed-Material Entrainment Potential, Roaring Fork River at Basalt, Colorado

INTRODUCTION 3
Fryi
ngpa
n
Roar
ing
Fork
River
River
Fork
Roaring
Sopris
Creek
Riv
er
SUPP
LY
HO
ME
HOME
SUPPLY
DIT
CH
DIT
CH
Trea
tmen
tPo
nd
Ced
ar B
rook
Lak
e
1/2
0 0.5
1 K
ILO
ME
TE
R
1 M
ILE
NA
TIO
NA
L G
EO
DE
TIC
VE
RT
ICA
L D
AT
UM
OF
1929
107°
00'
107°
02'3
0"10
7°05
'39
°22
'30
"
39°2
0'
Bas
e fr
om
U.S
. Geo
log
ical
Su
rvey
Bas
alt
1:24
000,
196
1, p
ho
tore
vise
d 1
987
Ad
dit
ion
al r
evis
ion
fro
mM
atri
x D
esig
n G
rou
p, D
enve
r, C
olo
rad
o
Hig
hw
ay 8
2
Em
ma
Ro
ad
Mid
lan
d A
ven
ue
Bri
dg
e Em
ma
Bri
dg
e
Old
Hig
hway
82
Highway
82
Highway
82
Up
per
Byp
ass
Bri
dg
e
Low
er B
ypas
sB
rid
ge
New
Beg
in S
tud
y R
each
En
d S
tud
y R
each
Bas
alt
Win
go
Em
ma
EA
GL
E C
O
PIT
KIN
CO
EA
GL
E C
O
PIT
KIN
CO
6800
6800
6800
6800
6800
Ark
ansa
s
SouthPlat
te
Riv
er
Riv
erR
ioG
rand
e
Col
orad
o
Gun
niso
n
River
Riv
er
Den
ver
Pueb
lo
Stu
dy
area
Gra
nd J
unct
ion
Fig
ure
1. L
ocat
ion
of s
tudy
are
a an
d th
e R
oarin
g F
ork
Riv
er s
tudy
rea
ch a
t Bas
alt,
Col
orad
o.

Purpose and Scope
The Town of Basalt is considering several strate-gies to mitigate or accommodate high water and sedi-ment discharges, including continued dredging, revised flood-plain zoning, and reconfiguring the channel cross section and sinuosity. Previous studies have identified flood-prone areas and hazards related to inundation and high streamflow velocity, but the studies have not evaluated response of the channel and the streambed to discharges that entrain, or result in movement of, coarse streambed sediment. This report quantifies the potential for sediment scour or deposi-tion at specific locations in the Roaring Fork River and will enable the Town of Basalt to better assess hazards related to changes in floodflow conveyance and allo-cate resources in response to immediate or long-term channel degradation or aggradation. This report also addresses potential flood-conveyance problems and hazards to life and property associated with bed- material movement.
In this report:1. A previously surveyed reach of the Roaring Fork
River is reevaluated for the purpose of estimating bed-material entrainment potential. The reach begins just upstream from the Upper Bypass Bridge and extends approximately 1 mile down-stream. The study reach includes the confluence of the Fryingpan River and three bridges.
2. Bed-material particle-size distributions at several locations in the study reaches where entrainment or deposition potentially could occur are deter-mined.
3. Bed-material entrainment potential from the channel and adjacent alluvial bars, if present, are estimated at several previously surveyed cross sections for several flood-discharge scenarios.
Acknowledgments
The author wishes to acknowledge Dave Konchan (formerly of the Town of Basalt) for his over-view of the problem and for assistance in sediment measurements. Mark Beckler (Sopris Engineering) supplied earlier digital survey files of the Roaring Fork River and provided survey control-point coordinates used to rectify the recent U.S. Geological Survey (USGS) channel survey. Robert Krehbiel (Matrix Design Group, Inc.) provided the rectified 2000 aerial
photography and the HEC–RAS model output that was a critical component of the entrainment potential anal-ysis. Rick McLaughlin (McLaughlin Water Engineers, Inc.) provided results of previous hydrologic investiga-tions and the 1987 and 1997 aerial photographs. Paul Kinzel and Stevan Gyetvai (USGS) assisted with the 2001 water-surface survey, and Stevan Gyetvai used a geographical information system (GIS) to prepare composite images of the aerial photography and survey and sample-location information. Finally, the author sincerely appreciates the interest and coopera-tion of numerous landowners along the Roaring Fork River and their permission for access to the river.
Study Area
The Roaring Fork River emerges from a confined valley at Wingo onto a 1-mile-wide valley, approximately 2 miles upstream from Basalt. The valley width decreases to about 0.3 mile near the old town of Emma, approximately 1 mile downstream from the confluence of the Fryingpan River (fig. 1). Aerial photographs reveal several paleochannel posi-tions, or that the river formerly had a multithread channel across the wide valley floor near Basalt. Some of these paleochannels are used as irrigation ditches, and others periodically convey floodflows not contained by the main channel. The gradient of the Roaring Fork River increases from about 0.008 ft/ft in the confined valley upstream from Wingo to about 0.014 ft/ft through most of the wide valley and into the town of Basalt. The Roaring Fork gradient then decreases to about 0.008 ft/ft immediately downstream from the Fryingpan River confluence in Basalt. The Fryingpan River gradient is about 0.015 ft/ft at its mouth in Basalt.
Streamflow in the Roaring Fork River upstream from the Fryingpan River confluence is largely unreg-ulated except for a transmountain diversion through the Twin Lakes tunnel above Aspen and local irriga-tion diversions. Daily discharge records have been collected on the Roaring Fork at two nearby USGS streamflow-gaging stations: station 09073400 Roaring Fork River near Aspen (1964 to present, drainage area 108 mi2), approximately 17 miles upstream from Basalt, and station 09081000 Roaring Fork River near Emma (1998 to present, drainage area approximately 853 mi2), approximately 2.5 miles downstream from Basalt. Daily discharge records have been collected on
4 Bed-Material Entrainment Potential, Roaring Fork River at Basalt, Colorado

the Fryingpan River at station 09080400 Fryingpan River near Ruedi (1964 to present, drainage area 238 mi2), 12.5 miles upstream from Basalt (Crowfoot and others, 2000).
The Fryingpan River drainage area at the confluence is approximately twice the Roaring Fork drainage area upstream from the Fryingpan River confluence at Basalt; however, flood peaks on the Fryingpan River have been attenuated by Ruedi Reser-voir since 1968. Streamflow regulation on the Fryingpan River may have affected sediment transport and deposition at and downstream from the confluence with the Roaring Fork River in Basalt. A segment of the Roaring Fork River in Basalt was straightened during railroad construction in the 19th century. This reduction in sinuosity and the resulting steeper river gradient facilitate the entrainment and transport of coarse streambed material. Areas of sediment deposi-tion in the form of large alluvial bars composed of gravel, cobbles, and some boulders are present throughout the study reach (fig. 2).
Several feet of vertical aggradation by deposi-tion of cobble- and boulder-size material have occurred under the Upper Bypass Bridge since 1995 (Dave Konchan, Town of Basalt, oral commun., 2000). The streambed elevation immediately downstream from the Fryingpan River confluence appears to be at the approximate elevation of the former flood plain, a surface now occupied by mobile homes, businesses, and multistory residences. A levee and a gabion retaining wall have been constructed to help prevent flooding in these areas. These and another levee upstream from the Upper Bypass Bridge complicate estimations of flood hydraulics.
Previous Investigations
Several engineering studies have been done by Federal agencies or commissioned by the Town of Basalt to determine flood-plain hydraulic conditions. Some of the previous studies have acknowledged the significance of floods with respect to streambed scour, aggradation, and channel realignment; however, none of the studies quantified sediment entrainment, trans-port, and deposition processes.
The first detailed hydraulic studies with surveyed cross sections were done in 1976 and 1978 by the consulting firm of Wright-McLaughlin Engi-neers for the Colorado Water Conservation Board. The
Federal Emergency Management Agency (FEMA) studied and mapped flood-prone areas along the Roaring Fork River in Basalt in 1979, 1980, and 1987 (McLaughlin Water Engineers, Inc., 2000).
Numerous changes occurred in the Roaring Fork River channel between the late 1980's and the middle 1990's, including ongoing urban development, channel adjustments from a large flood in 1995, and the construction of the Highway 82 Upper Bypass Bridge beginning in 1987 and the Midland Avenue Bridge beginning in 1997. The July 1995 flood was estimated to have had a recurrence of 14 years at the Roaring Fork River near Aspen streamflow gage (09073400) and a recurrence of 28 years at the Roaring Fork at Glenwood Springs gage (09085000). Recognizing the potential effect of these changes on flood-prone areas, FEMA commissioned another study in 1997 to rede-fine the 100-year flood plain. The 1997 study used several channel cross sections in the study reach and the HEC–RAS one-dimensional hydraulic model, and recalculated flood-hazard areas for the Roaring Fork River channel and flood plain. Results of the 1997 study, with additional modifications, are summarized in a report by McLaughlin Water Engineers, Inc. (2000). Output from the HEC–RAS model and subse-quent flood studies, including cross-section locations, flood-plain and channel topography, and water-surface profiles for floods of 10-, 50-, 100-, and 500-year recurrence intervals, were compiled by Matrix Design Group, Inc. (2000).
One noteworthy observation from earlier studies indicated that some flood discharge might be carried by a paleochannel that bifurcated just upstream from the Upper Bypass Bridge (figs. 1 and 2). This stream-flow divergence occurred during the flood of 1957, a flood estimated to have a recurrence interval of approximately 60 years at the Glenwood Springs streamflow-gaging station (09085000) (U.S. Inter-agency Advisory Committee on Water Data, 1982). Floodwater carried by the paleochannel in 1957 inun-dated agricultural land south of Basalt. This area subsequently has been developed with retail and resi-dential structures south of the realigned Highway 82.
Study Methods
Onsite evaluations were made of 18 channel cross sections (cross sections 2 through 19) used in the HEC–RAS model (Matrix Design Group, Inc., 2000)
INTRODUCTION 5

6 Bed-Material Entrainment Potential, Roaring Fork River at Basalt, Colorado
XSXS–2(9
8) 98)
XSXS– 3 3
( (96) 96)
XSXS– 4 4 ( (9
4)94)
XSXS 5 5 ( (9
0)90)
–
Sedi
men
t m
easu
rem
ents
Cro
ss s
ecti
on
Wat
ers
edge
sur
veye
d Ju
ne 7
, 200
1.D
isch
arge
app
roxi
mat
ely
1,26
0
Roa
ring
For
k R
iver
at
Roa
ring
For
k R
iver
at
Bas
alt,
Col
orad
oB
asal
t, C
olor
ado
Aer
ial P
hoto
Aer
ial P
hoto
grap
hgr
aph
take
n N
ovem
ber
8, 2
000
tak
en N
ovem
ber
8, 2
000
Dis
char
ge a
ppro
xim
atel
yD
isch
arge
app
roxi
mat
ely
290
cubi
c fe
et p
er s
econ
d29
0 cu
bic
feet
per
sec
ond
EX
PLA
NA
TIO
N
cubi
c fe
et p
er s
econ
d
Roarin
g For
k Rive
r
0 050
100
ME
TE
RS
400
FEE
T20
030
010
0
Fig
ure
2A
. Aer
ial p
hoto
grap
hs o
f the
stu
dy r
each
take
n N
ovem
ber
8, 2
000,
sho
win
g th
e R
oarin
g F
ork
Riv
er a
t a fl
ow o
f app
roxi
mat
ely
290
cubi
c fe
et p
er s
econ
d, c
ross
-se
ctio
n an
d se
dim
ent-
sam
plin
g si
tes,
and
the
edge
of w
ater
at 1
,260
cub
ic fe
et p
er s
econ
d.

INTRODUCTION 7
XS
XS–
6 (8(8
8. 8.6) 6)
XS
XS–
7 7 (8(8
8. 8.5) 5)
XS
XS–
8 8
(8(86. 6.
5) 5)
Sedi
men
t m
easu
rem
ents
Cro
ss s
ecti
on
Wat
ers
edge
sur
veye
d Ju
ne 7
, 200
1.D
isch
arge
app
roxi
mat
ely
1,26
0
Roa
ring
For
k R
iver
at
Roa
ring
For
k R
iver
at
Bas
alt,
Col
orad
oB
asal
t, C
olor
ado
Aer
ial P
hoto
Aer
ial P
hoto
grap
hgr
aph
take
n N
ovem
ber
8, 2
000
tak
en N
ovem
ber
8, 2
000
Dis
char
ge a
ppro
xim
atel
yD
isch
arge
app
roxi
mat
ely
290
cubi
c fe
et p
er s
econ
d29
0 cu
bic
feet
per
sec
ond
EX
PLA
NA
TIO
N
cubi
c fe
et p
er s
econ
d
Roar
ing
Fork
Rive
r
Roar
ing
Fork
Rive
r
0 050
100
ME
TE
RS
400
FEE
T20
030
010
0
Fig
ure
2B
. Aer
ial p
hoto
grap
hs o
f the
stu
dy r
each
take
n N
ovem
ber
8, 2
000,
sho
win
g th
e R
oarin
g F
ork
Riv
er a
t a fl
ow o
f app
roxi
mat
ely
290
cubi
c fe
et p
er s
econ
d, c
ross
-se
ctio
n an
d se
dim
ent-
sam
plin
g si
tes,
and
the
edge
of w
ater
at 1
,260
cub
ic fe
et p
er s
econ
d.

8 Bed-Material Entrainment Potential, Roaring Fork River at Basalt, Colorado
XS XS–9 (86.4)86.4)
XSXS– 10 10 ( (
85.
85.6) 6)
XSXS– 11 11 ( (
83.
83.6) 6)
Roa
ring
For
k R
iver
at
Roa
ring
For
k R
iver
at
Bas
alt,
Col
orad
oB
asal
t, C
olor
ado
Aer
ial P
hoto
grap
h ta
ken
Nov
embe
r 8,
200
0A
eria
l Pho
togr
aph
take
n N
ovem
ber
8, 2
000
Dis
char
ge a
ppro
xim
atel
yD
isch
arge
app
roxi
mat
ely
290
cubi
c fe
et p
er s
econ
d29
0 cu
bic
feet
per
sec
ond
Sedi
men
t m
easu
rem
ents
Cro
ss s
ecti
on
Wat
ers
edge
sur
veye
d Ju
ne 7
, 200
1.D
isch
arge
app
roxi
mat
ely
1,26
0
EX
PLA
NA
TIO
N
cubi
c fe
et p
er s
econ
d
Roarin
g For
k Rive
r
Roarin
g For
k Rive
r
0 050
100
ME
TE
RS
400
FEE
T20
030
010
0
Fig
ure
2C
. Aer
ial p
hoto
grap
hs o
f the
stu
dy r
each
take
n N
ovem
ber
8, 2
000,
sho
win
g th
e R
oarin
g F
ork
Riv
er a
t a fl
ow o
f app
roxi
mat
ely
290
cubi
c fe
et p
er s
econ
d, c
ross
-se
ctio
n an
d se
dim
ent-
sam
plin
g si
tes,
and
the
edge
of w
ater
at 1
,260
cub
ic fe
et p
er s
econ
d.
INTRODUCTION 9
XS XS–14 4 ( (80. 80.5) 5)
XS XS– 15 15 ( (78. 78.0) 0)
XS XS– 1616 (76. 76.65) 65)
XSXS– 1717
((
76.
76.3
8) 38)
XS
XS–
1818
76.
76.2
) 2)
XS XS– 1919
(76.
76.1) 1)
XS XS– 1313 (81. 81.0) 0)
XS XS– 1212 (83. 83.0) 0)
Roa
ring
For
k R
iver
at
Roa
ring
For
k R
iver
at
Bas
alt,
Col
orad
oB
asal
t, C
olor
ado
Aer
ial P
hoto
Aer
ial P
hoto
grap
hgr
aph
take
n N
ovem
ber
8, 2
000
tak
en N
ovem
ber
8, 2
000
Dis
char
ge a
ppro
xim
atel
yD
isch
arge
app
roxi
mat
ely
290
cubi
c fe
et p
er s
econ
d29
0 cu
bic
feet
per
sec
ond
Roarin
g For
k Rive
r
Roarin
g For
k Rive
r
Sedi
men
t m
easu
rem
ents
Cro
ss s
ecti
on
Wat
ers
edge
sur
veye
d Ju
ne 7
, 200
1.D
isch
arge
app
roxi
mat
ely
1,26
0
EX
PLA
NA
TIO
N
cubi
c fe
et p
er s
econ
d
0 050
100
ME
TE
RS
400
FEE
T20
030
010
0
Fig
ure
2D
. Aer
ial p
hoto
grap
hs o
f the
stu
dy r
each
take
n N
ovem
ber
8, 2
000,
sho
win
g th
e R
oarin
g F
ork
Riv
er a
t a fl
ow o
f app
roxi
mat
ely
290
cubi
c fe
et p
er s
econ
d, c
ross
-se
ctio
n an
d se
dim
ent-
sam
plin
g si
tes,
and
the
edge
of w
ater
at 1
,260
cub
ic fe
et p
er s
econ
d.

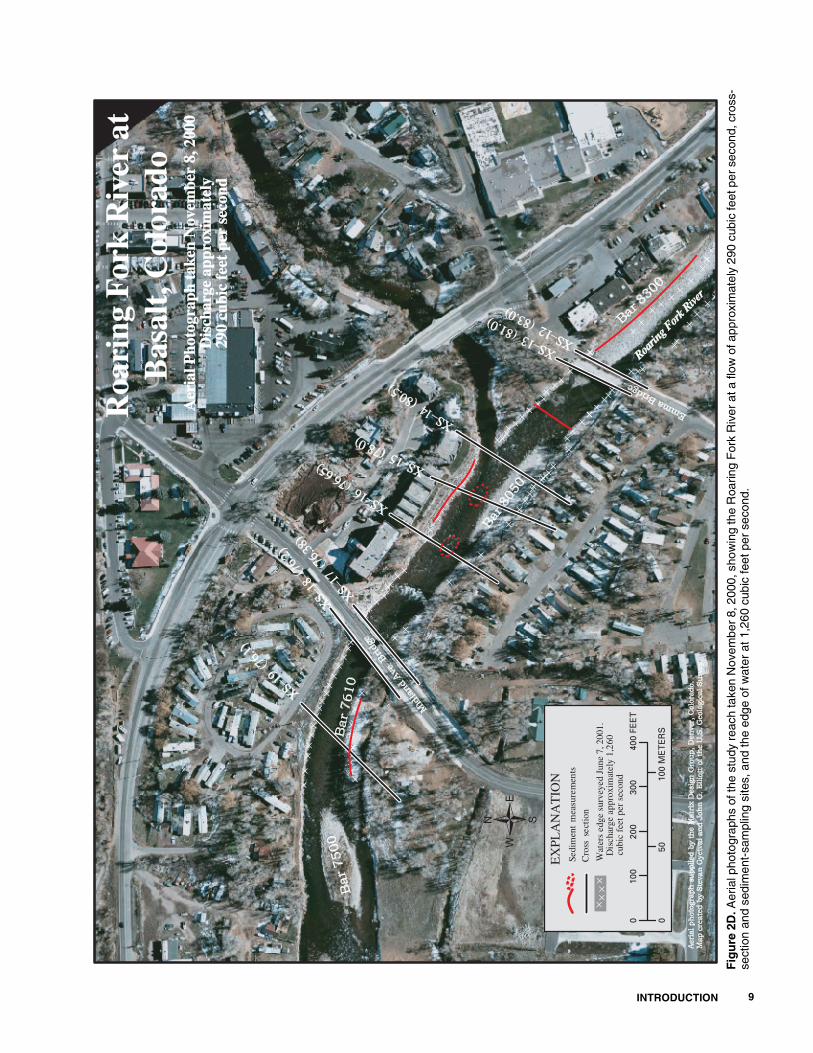
of the study reach (fig. 2). Most of these cross sections were surveyed in October 1998 and April 1999 (Mark Beckler, Sopris Engineering, oral commun., 2001); however, some cross sections were extrapolated from a digital topographic model (DTM). Four cross sections were excluded from the entrainment analyses because it was determined that the hydraulics at those locations were complicated by bridge contractions or piers or that channel geometry extrapolation from the DTM was unreliable (cross sections 4, 5, 12, and 17).
Water-surface elevations from the HEC–RAS model output were used to compute water-surface slope between the cross sections and to compute the hydraulic geometry at each cross section for four refer-ence streamflows: the 10-, 50-, and 100-year floods and a more common streamflow that just inundated the high point of alluvial bars (fig. 3). Earlier flood-plain studies had suggested that up to about 43 percent of the 100-year flood discharge might be carried by a paleochannel that bifurcated just upstream from the Upper Bypass Bridge (fig. 2A) (Dave Konchan, Town
of Basalt, oral commun., 2000). However, the HEC-RAS scenario used in this study assumed that all floodflows up to and including the 100-year flood were prevented from entering the paleochannel by a levee and were contained in the main channel and on the adjacent alluvial bars, terraces, and flood plain.
The maximum elevation of alluvial bars were identified in some of the Matrix Design Group, Inc., cross-section surveys made in 1998 and 1999; at other cross sections, the maximum elevations of alluvial bars were estimated by visual interpretation of the plotted streambed-surface profile. Alluvial bars were absent at three cross sections at the time cross sections were surveyed in 1998–99 (cross sections 2, 10, and 13). At cross section 14, alluvial bar 8050 had been reshaped considerably and shifted leftward between the time of the survey and the onsite assessment in 2000 (fig. 2). Consequently, entrainment-potential assessments were not made for alluvial bars at cross sections 2, 10, 13, and 14.
10 Bed-Material Entrainment Potential, Roaring Fork River at Basalt, Colorado
6,610
6,615
6,620
6,625
6,630
6,635
6,640
100-year flood, 9,400 cubic feet per second
50-year flood, 8,500 cubic feet per second
10-year flood, 6,100 cubic feet per second
Bar-inundating flow
2001 water surface, 1,260 cubic feet per second
1998 streambed surface
Bar 8860
South Terrace
HORIZONTAL DISTANCE, IN FEET
ELE
VA
TIO
N A
BO
VE
SE
A L
EV
EL,
IN F
EE
T
Old Highway 82
980 1,000 1,020 1,040 1,060 1,080 1,100 1,120 1,140 1,160 1,180 1,200 1,220 1,240
EXPLANATION
Figure 3. Cross section 6, approximately 675 feet downstream from Highway 82 Upper Bypass Bridge, showing surveyed and simulated water-surface elevations for several streamflows.

Bed-material measurements were made by the USGS using standard methods to determine particle-size characteristics of the channel and, if present, of the alluvial bars (Wolman, 1954) at 14 cross sections in the Roaring Fork River. Wolman "pebble counts" were made in a linear traverse of the channel cross section where the channel was wadeable in late November 2000. In unwadeable sections, pebble counts of the streambed were made in a random manner at one-footstep intervals in shallower areas where it was safe to wade. Pebble counts on alluvial bars and along one bank were made in a linear traverse parallel to the edge of water. Bed-material subsurface measurements were not made. Sediment-size charac-teristics calculated from the bed-material measure-ments were used to determine the critical shear stress for sediment entrainment.
The critical shear stress for entrainment of the existing sediment at 14 cross sections was compared to the boundary shear stress generated by the 10-, 50-, and 100-year floods and by a more common stream-flow that just inundated the high point of the alluvial bars in the study reach. Critical shear stress and entrainment for the 500-year flood were not evaluated because the incremental increase in water-surface elevation above that of the 100-year flood was small. Boundary shear stress in the mean cross section and at specific points along the cross section were computed with depth and slope from the cross-section surveys and HEC–RAS simulated water-surface elevations for each of the four reference streamflows.
Entrainment estimates were made for the Roaring Fork River by using the method developed by Elliott and Hammack (1999 and 2000) for the Gunnison River in Black Canyon National Park. In the Black Canyon study, existing sediment-size character-istics were used with HEC–RAS streamflow model output to determine the flood discharges necessary to entrain surficial sediment from alluvial surfaces where it was desirable to scour and obliterate encroaching riparian vegetation. In the Roaring Fork study, existing sediment-size characteristics and HEC–RAS stream-flow model output were used to evaluate the potential for existing alluvial deposits to become mobile under a range of flood-discharge scenarios.
This study used the output from the earlier HEC–RAS one-dimensional streamflow model (Matrix Design Group, Inc., 2000). No new floodflow routing calculations were made. The study examined floodflow conditions only in the existing main channel
between the laterally confining terraces and levees. It assumed all floodflows were conveyed by the main channel through downtown Basalt and that no flow occurred through the paleochannel bifurcation just upstream from the Upper Bypass Bridge. Also, the study looked only at free-flowing subreaches of the river and excluded cross sections where the hydraulics computations were excessively complicated by bridge contractions and piers.
BED-MATERIAL ENTRAINMENT ESTIMATION
Bed-material entrainment estimates were made on the basis of existing sediment properties at several locations in the study area and on the anticipated local hydraulic conditions associated with the four reference streamflows.
Water-Surface Profiles and Hydraulic Geometry
The local hydraulic conditions for each refer-ence streamflow were estimated with surveyed or extrapolated channel cross sections and with simulated water-surface elevations generated with the HEC–RAS one-dimensional streamflow model.
HEC-RAS Calculations
One-dimensional water-surface profile models such as HEC–RAS (Hydrologic Engineering Center, 1997) are used to estimate water-surface elevations, streamflow depths, and hydraulic conditions in river channels and adjacent flood plains. The HEC–RAS model uses surveyed cross sections of the river channel and the adjacent flood plain and terraces. One-dimensional modeling is appropriate where stream-flow is uniform (velocity is relatively constant in both magnitude and direction between adjacent cross sections), but one-dimensional model output becomes less reliable in the vicinity of bridge piers and contrac-tions if streamflow becomes nonuniform and critical. A two- or multi-dimensional water-surface profile model is more appropriate for complex hydraulic conditions such as when streamflow becomes nonuni-form and critical; however, two- and multi-dimen-sional modeling was beyond the scope of this study.
BED-MATERIAL ENTRAINMENT ESTIMATION 11

HEC–RAS model output was provided by Matrix Design Group, Inc., (2000) and is used in this study to calculate water-surface slopes and hydraulic geometry variables for the 10-year, 50-year, and 100-year floods. The 500-year flood was modeled but was not used in subsequent analyses because the incre-mental increase in water-surface elevation above that of the 100-year flood was small. The HEC–RAS simu-lations assumed all flood discharge passed through the study reach. Earlier flood-inundation studies had determined that the discharges associated with the 10-year, 50-year, and 100-year floods had the following magnitudes in the study reach (Robert Krehbiel, Matrix Design Group, Inc., oral commun., 2001):
Regional flood-frequency equations derived from an analysis of the magnitude and frequency of Colorado floods indicate that these discharge estimates for the 10-year, 50-year, and 100-year floods may be too large (Vaill, 2000); however, computation of revised flood magnitudes is beyond the scope of this report. Consequently, the flood magnitudes provided by Matrix Design Group, Inc. (2000) will be used hereafter.
Water-surface slopes for the 10-year, 50-year, and 100-year floods were calculated from the water-surface-elevation differences between adjacent surveyed or extrapolated cross sections (fig. 4). Slopes assigned to the various cross sections were the slopes of the subreach immediately downstream from the cross section.
Additional Water-Surface Profiles
The HEC–RAS model simulated water-surface elevations only for streamflow greater than or equal to the 10-year flood. Anecdotal and onsite evidence indi-cate that bedload transport commonly occurs at streamflows with less than a 10-year recurrence. Therefore, lesser streamflows may be significant in
redistributing bed-material sediments in the study reach. The upper surface of point bars or other alluvial bars often correlates with the water surface of the bankfull discharge (Williams, 1978) or of a discharge that is significant in transporting bed-material sedi-ment. The bankfull discharge is the most significant discharge in maintenance of the channel form in many streams (Wolman and Miller, 1960; Andrews, 1984). The study reach has several alluvial bars that are indic-ative of recent sediment entrainment (fig. 2A–D). Many of these bars are inundated simultaneously by a streamflow of approximately 3,000 ft3/s, measured at the gaging station downstream from the Fryingpan River confluence (Dave Konchan, Town of Basalt, oral commun., 2000). The "bar-inundating discharge" upstream from the Fryingpan River confluence is approximately 2,500 ft3/s. Based on this anecdotal observation and other studies (Jarrett and England, 2002), the elevation of the alluvial bar tops may be considered a surrogate for the water surface of a specific discharge, with an associated recurrence, common to several subreaches in the study area. A water-surface profile for the bar-inundating discharge was estimated from alluvial-bar surfaces expressed in the cross-section surveys (fig. 4A–D). A recurrence interval could not be estimated for the 3,000-ft3/s discharge because the streamflow record at the Emma gaging station, established in 1998, is too brief to calculate floodflow frequency statistics.
In addition to the water-surface elevations simu-lated by the HEC–RAS model and the estimated bar-inundating water-surface profile, another survey was made by the USGS in June 2001 at a discharge of approximately 1,260 ft3/s to determine the water-surface elevation representative of a low- to interme-diate-streamflow condition (fig. 4A–D). A comparison of water-surface profiles in figure 4D reveals that the surveyed 1,260-ft3/s water-surface elevation is lower than the estimated bar-top elevations at cross sections 12, 13, 17, 18, and 19. This relation is logical if the assumption is correct that the alluvial bars in the study reach were formed by a discharge of 3,000 ft3/s or greater. However, the 1,260-ft3/s water-surface eleva-tion is higher than the estimated bar-top elevations at cross sections 14, 15, and 16 (Bar 8050, fig. 2D). Possible explanations for this apparent contradiction could be that (1) local channel-geometry adjustments may have occurred in this subreach between the dates of the cross-section surveys (April 1999) and the water-surface survey (June 2001), or (2) alluvial bars
Recurrence interval
Discharge upstream from
Fryingpan River (cubic feet per
second)
Dischargedownstream from Fryingpan River (cubic feet per
second)
10-year flood 6,100 7,100
50-year flood 8,500 9,400
100-year flood 9,400 10,400
12 Bed-Material Entrainment Potential, Roaring Fork River at Basalt, Colorado

BED-MATERIAL ENTRAINMENT ESTIMATION 13
6,615
6,620
6,630
6,625
6,635
6,640
6,645
6,650
32,400 32,600 32,800 33,000 33,200 33,400 33,600 33,800 34,000
UPSTREAM CHANNEL DISTANCE FROM GARFIELD/EAGLE COUNTY LINE, IN FEET
ELE
VA
TIO
N A
BO
VE
SE
A L
EV
EL,
IN F
EE
T
100-Year flood
50-Year flood
10-Year flood
Bar-inundating flow
Surveyed 1,260 cubic feet per second
Streambed
Cross section with entrainment estimate Cross section without entrainment estimate
Upp
erB
ypas
sB
ridge
EXPLANATION
2
5 4
4
3
2
EXPLANATION
6,600
6,605
6,610
6,615
6,620
6,625
6,630
6,635
31,000 31,200 31,400 31,600 31,800 32,000 32,200 32,400 32,600
UPSTREAM CHANNEL DISTANCE FROM GARFIELD/EAGLE COUNTY LINE, IN FEET
7
9
6 Cross section with entrainment estimate 4 Cross section without entrainment estimate
8
6
ELE
VA
TIO
N A
BO
VE
SE
A L
EV
EL,
IN F
EE
T
100-Year flood
50-Year flood
10-Year flood
Bar-inundating flow
Surveyed 1,260 cubic feet per second
Streambed
Figure 4A. Longitudinal profile of the Roaring Fork River at Basalt, Colorado, showing simulated water-surface profiles for various floods, the water-surface profile surveyed June 2001, and cross-section locations. Corresponds to stream segment shown in figure 2A.
Figure 4B. Longitudinal profile of the Roaring Fork River at Basalt, Colorado, showing simulated water-surface profiles for various floods, the water-surface profile surveyed June 2001, and cross-section locations. Corresponds to stream segment shown in figure 2B.

14 Bed-Material Entrainment Potential, Roaring Fork River at Basalt, Colorado
EXPLANATION
6,585
6,590
6,595
6,600
6,605
6,610
6,615
6,620
29,800 30,000 30,200 30,400 30,600 30,800 31,000 31,200 31,400
UPSTREAM CHANNEL DISTANCE FROM GARFIELD/EAGLE COUNTY LINE, IN FEET
10
9
9 Cross section with entrainment estimate 4 Cross section without entrainment estimate
11ELE
VA
TIO
N A
BO
VE
SE
A L
EV
EL,
IN F
EE
T
100-Year flood
50-Year flood
10-Year flood
Bar-inundating flow
Surveyed 1,260 cubic feet per second
Streambed
EXPLANATION
6,570
6,575
6,580
6,585
6,590
6,595
6,600
6,605
28,600 28,800 29,000 29,200 29,400 29,600 29,800 30,000 30,200
UPSTREAM CHANNEL DISTANCE FROM GARFIELD/EAGLE COUNTY LINE, IN FEET
13
141516
1719
12
18
11
ELE
VA
TIO
N A
BO
VE
SE
A L
EV
EL,
IN F
EE
T
100-Year flood
50-Year flood
10-Year flood
Bar-inundating flow
Surveyed 1,260 cubic feet per second
Streambed
11 Cross section with entrainment estimate 12 Cross section without entrainment estimate
Mid
land
Brid
ge
Em
ma
Brid
geFigure 4C. Longitudinal profile of the Roaring Fork River at Basalt, Colorado, showing simulated water-surface profiles for various floods, the water-surface profile surveyed June 2001, and cross-section locations. Corresponds to stream segment shown in figure 2C.
Figure 4D. Longitudinal profile of the Roaring Fork River at Basalt, Colorado, showing simulated water-surface profiles for various floods, the water-surface profile surveyed June 2001, and cross-section locations. Corresponds to stream segment shown in figure 2D.

in the study reach are formed by multiple discharge magnitudes rather than by a single discharge common to all.
Hydraulic Geometry
Hydraulic geometry variables (cross-section area, mean depth, mean shear stress, and shear stress at a point) were calculated from the surveyed or extrapo-lated cross sections and the HEC–RAS water-surface elevations (fig. 3). These values and other information are presented in table 1.
Bed-Material Characteristics
Sediment-entrainment potential for a specific flood or runoff event is partly determined by the size characteristics of the material composing the streambed, alluvial bars, and streambanks. Bed- material characteristics were determined from onsite measurements at several locations in the study reach.
Sampling Sites
Sediment-size characteristics, including the median particle size (d50), were determined for surfi-cial streambed material, large alluvial bars adjacent to the low-flow channel, and one streambank using the Wolman (1954) method. Subsurface sediment size was not determined. The median sediment-particle size (d50), the standard deviation of the d50, and the geometric standard deviation were determined at 16 sites in the study reach (table 2).
Measurements of the streambed and one stream-bank were made in November 2000 when streamflow was very low. Measurements of alluvial bars were made in May and October 2001. Streambed measure-ments were made by traversing the low-flow channel from the left edge of water to the right edge of water and generally represent the coarsest material in the river channel. This material is inundated year round. The alluvial bars and banks are deposits that are inun-dated by relatively frequently occurring streamflows but are subaerially exposed for most of the year. The streambed in the low-flow channel at most cross sections in the study reach is composed of cobble-size (64- to 256-mm diameter) and boulder-size (greater than 256-mm diameter) material. The alluvial bars and banks are composed of slightly finer material in the
gravel-size (4- to 64-mm diameter), cobble-size, and occasionally boulder-size range.
Size Analysis
The median sediment-particle size of the streambed samples ranged from 128 to 202 mm and averaged 165 mm (table 2). The geometric standard deviation is a nondimensional measure of the degree of sorting and is defined as the square root of the ratio of the 84th-percentile particle size to the 16th-percen-tile particle size (Vanoni, 1975, p. 36). For streambed samples, the geometric standard deviation ranged from 1.78 to 2.62.
The median sediment-particle size of the allu-vial bars and one bank ranged from 32 to 182 mm and averaged 107 mm. The geometric standard deviation for most alluvial bar deposits ranged from 2.08 to 2.93. Two samples had very high geometric standard deviations. Bar 8650 had a geometric standard devia-tion of 24.13, indicating a very poorly sorted deposit. Bar 8650 was largely composed of cobble-size mate-rial (64- to 256-mm diameter) but had an extensive veneer of sandy material (less than 2-mm diameter), possibly deposited by a flow subsequent to the flow that deposited the cobble-size material. The one bank sample, Bank.7800, had a geometric standard devia-tion of 7.24, indicating poor sorting. The sorting char-acteristics of this bank might reflect a recent mechanical reworking of the bank material during channel stabilization activity.
Flood-Generated Shear Stress and Entrainment Potential
Sediment entrainment, or movement, in stream channels is partly a function of the boundary shear stress, a tangential stress created by flowing water acting on sediment particles resting on the streambed or other inundated alluvial surfaces. Entrainment potential for sediment on a specific geomorphic surface is estimated by the relation between flood-generated shear stress and the critical shear stress of the sediment particles, the shear stress at which general movement of sediment begins.
Shear Stress Estimation
Shear stress is proportional to the square of streamflow velocity and is most accurately determined
BED-MATERIAL ENTRAINMENT ESTIMATION 15

Table 1. Hydraulic geometry from selected cross sections in the Roaring Fork River study reach
[Upstream distance measured in channel from Garfield–Eagle County line; Matrix reference number from previously published report (Matrix Design Group, Inc., 2000); na, no alluvial bar, not applicable; cross sections 6, 7, 8, 9, 10, 11, 14, 15, 16, 18, surveyed; cross sections 2, 3, 13, 19 extrapolated from digital topographic model; lb/ft2, pound per square foot]
Cross-section number
Matrixreference number
Upstream distance
(ft)
Cross-section area
(ft2)
Meandepth
(ft)
Water-surface slope(ft/ft)
Meanstreambed
shear stress (lb/ft2)
Thalweg shear stress
(lb/ft2)
Bar-top shear stress
(lb/ft2)
Bar-inundating discharge
2 98 33,910 297.20 1.97 0.0197 2.42 4.14 na
3 96 33,259 170.14 0.99 0.0077 0.48 1.77 0.00
6 88.6 32,382 420.95 2.79 0.0099 1.72 3.58 0.00
7 88.5 31,997 403.43 2.56 0.0111 1.77 4.84 0.00
8 86.5 31,507 364.83 2.17 0.0139 1.88 6.09 0.00
9 86.4 31,045 335.15 2.39 0.0157 2.35 3.63 0.00
10 85.6 30,824 150.99 1.50 0.0105 0.98 2.06 na
11 83.6 30,144 210.39 2.35 0.0107 1.57 2.73 0.00
13 81 29,709 293.10 2.76 0.0218 3.75 5.60 na
14 80.5 29,449 226.00 1.50 0.0078 0.73 1.85 0.00
15 78 29,359 215.63 1.69 0.0056 0.59 1.27 0.00
16 76.65 29,219 269.23 2.28 0.0025 0.36 0.70 0.00
18 76.2 28,885 573.45 4.16 0.0121 3.14 4.27 na
19 76.1 28,778 320.02 2.36 0.0131 1.93 4.10 0.00
10-year flood
2 98 33,910 717.74 2.97 0.0155 2.87 4.82 na
3 96 33,259 1,031.97 4.59 0.0039 1.12 1.57 1.05
6 88.6 32,382 579.15 3.35 0.0117 2.44 5.82 1.59
7 88.5 31,997 752.87 2.97 0.0115 2.13 6.09 1.08
8 86.5 31,507 588.26 3.42 0.0128 2.73 6.65 1.05
9 86.4 31,045 602.56 3.67 0.0097 2.22 3.35 1.10
10 85.6 30,824 492.01 4.35 0.0111 3.02 4.36 na
11 83.6 30,144 465.67 4.95 0.0060 1.85 2.57 1.04
13 81 29,709 518.40 4.66 0.0117 3.40 4.53 na
14 80.5 29,449 1,022.27 5.66 0.0078 2.76 4.15 2.29
15 78 29,359 913.50 5.74 0.0074 2.65 3.85 2.17
16 76.65 29,219 847.25 6.01 0.0002 0.082 0.12 0.06
18 76.2 28,885 623.60 4.42 0.0082 2.26 3.55 na
19 76.1 28,778 562.29 3.85 0.0095 2.28 3.98 1.01
16 Bed-Material Entrainment Potential, Roaring Fork River at Basalt, Colorado
50-year flood
2 98 33,910 858.57 3.52 0.0149 3.28 5.17 na
3 96 33,259 1,264.81 5.29 0.0031 1.02 1.44 1.03
6 88.6 32,382 729.07 4.10 0.0124 3.17 6.82 2.34
7 88.5 31,997 900.63 3.54 0.0108 2.38 6.11 1.40
8 86.5 31,507 751.33 4.31 0.0128 3.44 7.40 1.80
9 86.4 31,045 762.78 4.47 0.0107 2.99 4.33 1.86
10 85.6 30,824 575.90 5.05 0.0110 3.47 4.83 na
11 83.6 30,144 542.92 5.71 0.0043 1.53 2.06 0.97
13 81 29,709 753.99 6.32 0.0159 6.27 8.16 na
14 80.5 29,449 1,190.19 6.46 0.0086 3.47 5.06 3.02
15 78 29,359 1,048.04 6.50 0.0100 4.06 5.73 3.46
16 76.65 29,219 912.99 6.43 0.0004 0.18 0.26 0.14
18 76.2 28,885 769.18 4.37 0.0107 2.92 5.19 na
19 76.1 28,778 644.34 4.34 0.0097 2.63 4.41 1.37
100-year flood
2 98 33,910 897.90 3.67 0.0145 3.32 5.18 na
3 96 33,259 1,362.66 5.52 0.0028 0.96 1.37 1.00
6 88.6 32,382 782.95 4.34 0.0128 3.46 7.28 2.66
7 88.5 31,997 938.87 3.68 0.0103 2.37 5.93 1.43
8 86.5 31,507 812.98 4.63 0.0129 3.73 7.74 2.09
9 86.4 31,045 811.19 4.70 0.0109 3.20 4.60 2.08
10 85.6 30,824 603.53 5.29 0.0109 3.60 4.96 na
11 83.6 30,144 569.82 5.94 0.0042 1.56 2.09 1.01
13 81 29,709 797.62 6.66 0.0159 6.61 8.52 na
14 80.5 29,449 1,257.81 6.81 0.0088 3.74 5.38 3.29
15 78 29,359 1,105.03 6.81 0.0111 4.72 6.60 4.09
16 76.65 29,219 941.16 6.58 0.0006 0.23 0.34 0.18
18 76.2 28,885 874.16 4.86 0.0147 4.45 7.67 na
19 76.1 28,778 669.79 4.48 0.0097 2.71 4.51 1.48
Table 1. Hydraulic geometry from selected cross sections in the Roaring Fork River study reach—Continued
[Upstream distance measured in channel from Garfield–Eagle County line; Matrix reference number from previously published report (Matrix Design Group, Inc., 2000); na, no alluvial bar, not applicable; cross sections 6, 7, 8, 9, 10, 11, 14, 15, 16, 18, surveyed; cross sections 2, 3, 13, 19 extrapolated from digital topographic model; lb/ft2, pound per square foot]
Cross-section number
Matrixreference number
Upstream distance
(ft)
Cross-section area
(ft2)
Meandepth
(ft)
Water-surface slope(ft/ft)
Meanstreambed
shear stress (lb/ft2)
Thalweg shear stress
(lb/ft2)
Bar-top shear stress
(lb/ft2)
BED-MATERIAL ENTRAINMENT ESTIMATION 17

18 Bed-Material Entrainment Potential, Roaring Fork River at Basalt, Colorado
Tab
le 2
. Sed
imen
t-si
ze c
hara
cter
istic
s of
the
stre
ambe
d, a
lluvi
al b
ars,
and
str
eam
bank
s of
the
Roa
ring
For
k R
iver
at B
asal
t
[XC
han;
ent
ire
stre
ambe
d sa
mpl
ed; R
Cha
n, r
ight
por
tion
of
stre
ambe
d sa
mpl
ed; L
Cha
n, le
ft p
orti
on o
f st
ream
bed
sam
pled
; loc
atio
n is
ups
trea
m d
ista
nce
from
Gar
fiel
d–E
agle
Cou
nty
line
; geo
met
ric
stan
-da
rd d
evia
tion
= s
quar
e ro
ot o
f th
e ra
tio
of th
e 84
th p
erce
ntil
e si
ze to
the
16th
per
cent
ile
size
; cri
tica
l she
ar s
tres
s fo
r th
e m
edia
n se
dim
ent s
ize
calc
ulat
ed w
ith
equa
tion
2 a
nd a
Shi
elds
par
amet
er o
f 0.
030;
N
ovem
ber
30, 2
000,
dis
char
ge a
ppro
xim
atel
y 28
0 ft
3 /s;
May
16–
17, 2
001,
dis
char
ge a
ppro
xim
atel
y 1,
200
ft3 /s
; Oct
ober
8, 2
001,
dis
char
ge a
ppro
xim
atel
y 39
5 ft
3 /s; f
t, fe
et; m
m, m
illi
met
er; l
b/ft
2 , pou
nd p
er
squa
re f
oot;
mm
ddyy
, mon
th/d
ay/y
ear;
ft3 /s
, cub
ic f
eet p
er s
econ
d; m
, met
er; %
, per
cent
]
Sam
ple
co
de
Lo
cati
on
, u
pst
ream
d
ista
nce
(ft)
Ap
plic
able
to
cr
oss
sec
tio
n, b
ar,
or
ban
k
16th
p
erce
nti
le
size
(mm
)
Med
ian
se
dim
ent
size
(mm
)
84th
p
erce
nti
le
size
(mm
)
Sta
nd
ard
d
evia
tio
n
(mm
)
Geo
met
ric
stan
dar
d
dev
iati
on
Cri
tica
l sh
ear
stre
ss
(lb
/ft2 )
Dat
e sa
mp
led
(m
md
dyy)
Rem
arks
Stre
ambe
d
XC
han.
3345
033
,450
XS
–280
202
376
135
2.17
2.05
11/3
0/00
Sam
pled
left
edg
e of
wat
er to
righ
t ed
ge o
f w
ater
XC
han.
9600
33,2
59X
S–3
7515
232
911
52.
091.
5511
/30/
00S
ampl
ed le
ft e
dge
of w
ater
to ri
ght
edge
of
wat
er
RC
han.
3310
033
,100
XS
–650
200
340
129
2.62
2.03
11/3
0/00
Cha
nnel
unw
adea
ble
on le
ft,
sam
pled
rig
ht
XC
han.
8360
30,2
00X
S–1
191
162
287
106
1.78
1.64
11/3
0/00
Sam
pled
left
edg
e of
wat
er to
righ
t ed
ge o
f w
ater
XC
han.
2965
029
,650
XS
–13,
14
5714
528
010
42.
211.
4711
/29/
00S
ampl
ed le
ft e
dge
of w
ater
to ri
ght
edge
of
wat
er
LC
han.
7800
29,3
59X
S–1
581
168
270
901.
821.
7011
/29/
00C
hann
el u
nwad
eabl
e on
rig
ht,
sam
pled
left
LC
han.
7665
29,2
19X
S–1
6, 1
8, 1
952
128
230
812.
091.
3011
/29/
00C
hann
el u
nwad
eabl
e on
rig
ht,
sam
pled
left
Mea
n of
str
eam
bed
165
1.68
Allu
vial
bar
s an
d ba
nks
Bar
.960
033
,500
Bar
.960
0, X
S–3
5613
826
010
12.
161.
3905
/16/
011–
2 m
fro
m r
ight
edg
e of
wat
er
Bar
.940
033
,100
Bar
.940
024
6615
076
2.48
0.66
05/1
6/01
2 m
fro
m r
ight
edg
e of
wat
er,
abov
e U
pper
Byp
ass
Bri
dge
Bar
.886
032
,400
Bar
.886
0, X
S–6
3089
241
952.
840.
9010
/08/
010.
5–1
m f
rom
rig
ht e
dge
of w
ater
Bar
.885
032
,000
Bar
.885
0, X
S–7
832
6959
2.93
0.33
05/1
7/01
1–5
m f
rom
rig
ht e
dge
of w
ater
Bar
.865
031
,500
Bar
.865
0, X
S–8
0.3
4814
676
24.1
30.
4905
/17/
013–
6 m
fro
m le
ft e
dge
of w
ater
, 21
% o
f ob
serv
atio
ns s
and
Bar
.864
031
,100
Bar
.864
0, X
S–9
,10
5616
029
612
42.
311.
6210
/08/
011
m f
rom
rig
ht e
dge
of w
ater
Bar
.830
029
,950
Bar
.830
0, X
S–1
170
182
322
122
2.14
1.85
05/1
7/01
2–4
m f
rom
rig
ht e
dge
of w
ater
, ab
ove
Em
ma
Bri
dge
Ban
k.78
0029
,350
Ban
k.78
00,
XS
–14,
155
172
273
142
7.24
1.75
11/3
0/00
1 m
fro
m r
ight
edg
e of
wat
er,
abov
e M
idla
nd A
venu
e B
ridg
e
Bar
.761
028
,800
Bar
.761
0, X
S–1
930
7613
056
2.08
0.77
05/1
7/01
1–3
m f
rom
left
edg
e of
wat
er
Mea
n of
allu
vial
bar
s an
d ba
nks
107
1.08

by measurements of velocity vectors in downstream, lateral, and vertical directions. When velocity data are unavailable, mean boundary shear stress in a channel cross section commonly is approximated by the rela-tion between boundary shear stress, flow depth, and energy gradient, given by the duBoys equation (Chow, 1959, p. 168):
(1)
where
τ o is the mean boundary shear stress, in newtons per square meter;
γ is the specific weight of water (9,807 N/m3); D is the mean flow depth, in meters; and S is the energy gradient, in meter per meter; water-
surface slope is often used as a substitute.
Mean boundary shear stress in equation 1 (newtons per square meter) is converted to English units (pounds per square foot) by multiplying by 0.02088.
Because flow depth and water-surface slope vary with increasing or decreasing discharge, so too does the mean boundary shear stress. The assumptions for using equation 1 are (1) the channel cross section has a regular, or trapezoidal, shape and width at least 10 times greater than its depth, (2) streamflow is steady (there is a continuity of discharge from cross section to cross section in the reach), and (3) stream-flow is uniform (velocity is constant in both magnitude and direction through the reach). Application of equa-tion 1 is inappropriate in channel sections where there is a strong lateral variation in acceleration or where abrupt, local changes in streambed gradient occur, such as at bridge contractions and around bridge piers.
The channel in the study reach was not trape-zoidal, although at most cross sections a single, domi-nant channel conveyed most of the streamflow of nonflood events. All cross sections examined in this study had an active channel width at least 16 times the mean flow depth of the active channel. Alluvial point bars and alternate bars were common in the study reach (fig. 2). The presence of alternate bars in the channel caused some diversion of flow around the bars in small chute channels, but this was considered to be insignificant in the shear stress calculations. The bar-inundating streamflow was the discharge at which the
associated water surface just inundated the highest surface on the alternate bars. The bar-inundating streamflow was entirely conveyed by the active channel.
Streamflow of the 10-, 50-, and 100-year floods was conveyed by the active channel, adjacent flood-plain surfaces (fig. 3), and, at some cross sections, by formerly active channel segments known as paleo-channels (fig. 2C, between XS–10 and XS-11). Shear stress for this analysis was calculated only for the active channel and adjacent flood-plain surfaces. Although paleochannels and some flood-plain areas on the distal side of levees were inundated by flood-flows, these areas were not included in the shear-stress or bed-material entrainment potential analyses. Streamflow upstream and downstream from the Fryingpan River confluence was assumed to be steady and, other than at the confluence of the Fryingpan River, there were no significant local inflows to either reach. Infiltration losses were assumed to be insignificant.
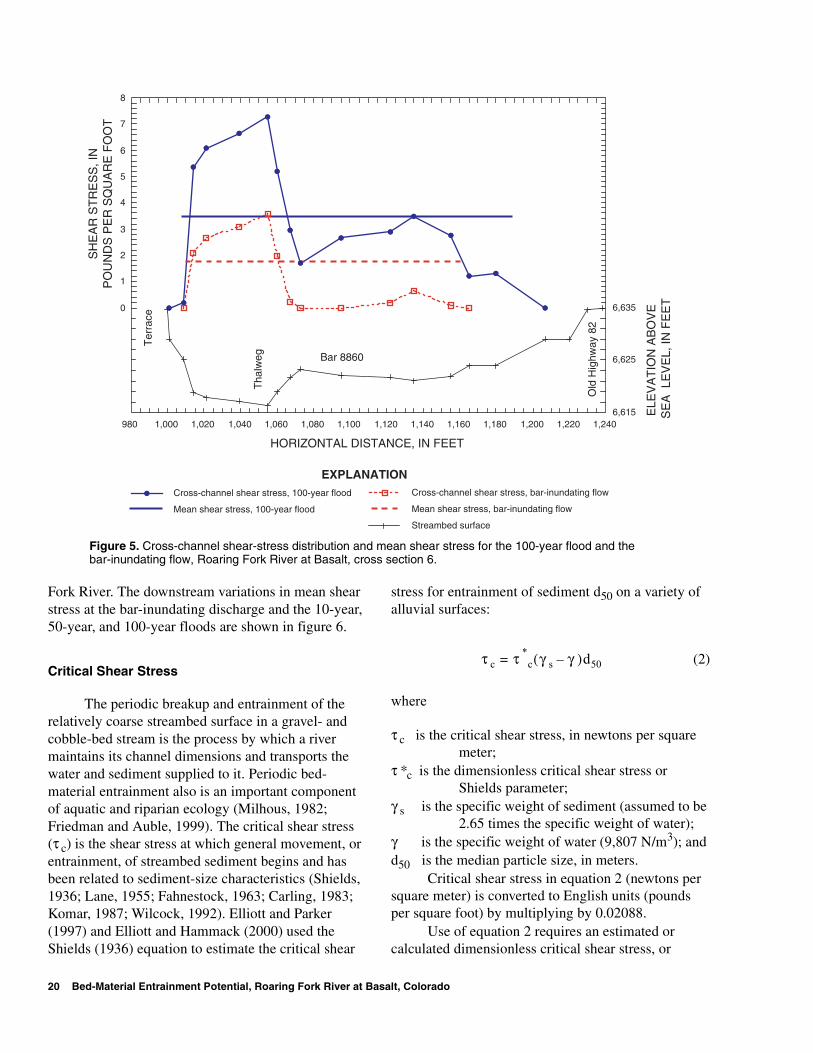
Most natural streams do not completely satisfy the assumptions for equation 1, and the boundary shear stress associated with any specific discharge is nonuniformly distributed across the channel. Lateral and downstream variations in cross-section morphology and variations in slope and energy gradient with discharge result in a wide range of boundary shear stresses and, consequently, produce spatially variable conditions for sediment entrainment, sorting, and deposition. Streamflow depths at specific points along each cross section were substituted for the cross-section mean flow depth (D) in equation 1 to examine the relative effects of different discharges at deeper and shallower locations within the study reach (Elliott and Hammack, 1999). Using water-surface elevation output from the HEC–RAS model, shear stresses associated with the 10-year, 50-year, and 100-year floods were calculated for the mean streambed (using the mean depth in the channel) and for the thalweg and alluvial bar tops (using point depths). In addition, shear stress associated with the bar-inundating discharge was calculated for the mean streambed and the thalweg. Cross-section geometry, the variation in cross-channel shear-stress distribution, and the mean shear stress for the 100-year flood and the bar-inundating discharge are shown for a typical cross section in figure 5.
Shear stress on the streambed also is highly vari-able from cross section to cross section in the Roaring
τ o γ DS=
BED-MATERIAL ENTRAINMENT ESTIMATION 19
EXPLANATION
0
1
2
3
4
5
6
7
8
980 1,000 1,020 1,040 1,060 1,080 1,100 1,120 1,140 1,160 1,180 1,200 1,220 1,240
HORIZONTAL DISTANCE, IN FEET
6,615
6,625
6,635
Cross-channel shear stress, 100-year flood
Mean shear stress, 100-year flood
Cross-channel shear stress, bar-inundating flow
Mean shear stress, bar-inundating flow
Streambed surface
Bar 8860
Ter
race
Tha
lweg
Old
Hig
hway
82
SH
EA
R S
TR
ES
S, I
NP
OU
ND
S P
ER
SQ
UA
RE
FO
OT
ELE
VA
TIO
N A
BO
VE
S
EA
LE
VE
L, IN
FE
ET
Figure 5. Cross-channel shear-stress distribution and mean shear stress for the 100-year flood and the bar-inundating flow, Roaring Fork River at Basalt, cross section 6.
Fork River. The downstream variations in mean shear stress at the bar-inundating discharge and the 10-year, 50-year, and 100-year floods are shown in figure 6.
Critical Shear Stress
The periodic breakup and entrainment of the relatively coarse streambed surface in a gravel- and cobble-bed stream is the process by which a river maintains its channel dimensions and transports the water and sediment supplied to it. Periodic bed- material entrainment also is an important component of aquatic and riparian ecology (Milhous, 1982; Friedman and Auble, 1999). The critical shear stress (τ c) is the shear stress at which general movement, or entrainment, of streambed sediment begins and has been related to sediment-size characteristics (Shields, 1936; Lane, 1955; Fahnestock, 1963; Carling, 1983; Komar, 1987; Wilcock, 1992). Elliott and Parker (1997) and Elliott and Hammack (2000) used the Shields (1936) equation to estimate the critical shear
stress for entrainment of sediment d50 on a variety of alluvial surfaces:
(2)
where
τ c is the critical shear stress, in newtons per square meter;
τ *c is the dimensionless critical shear stress or Shields parameter;
γ s is the specific weight of sediment (assumed to be 2.65 times the specific weight of water);
γ is the specific weight of water (9,807 N/m3); and d50 is the median particle size, in meters.
Critical shear stress in equation 2 (newtons per square meter) is converted to English units (pounds per square foot) by multiplying by 0.02088.
Use of equation 2 requires an estimated or calculated dimensionless critical shear stress, or
τ c τ *c γ s γ–( )= d50
20 Bed-Material Entrainment Potential, Roaring Fork River at Basalt, Colorado
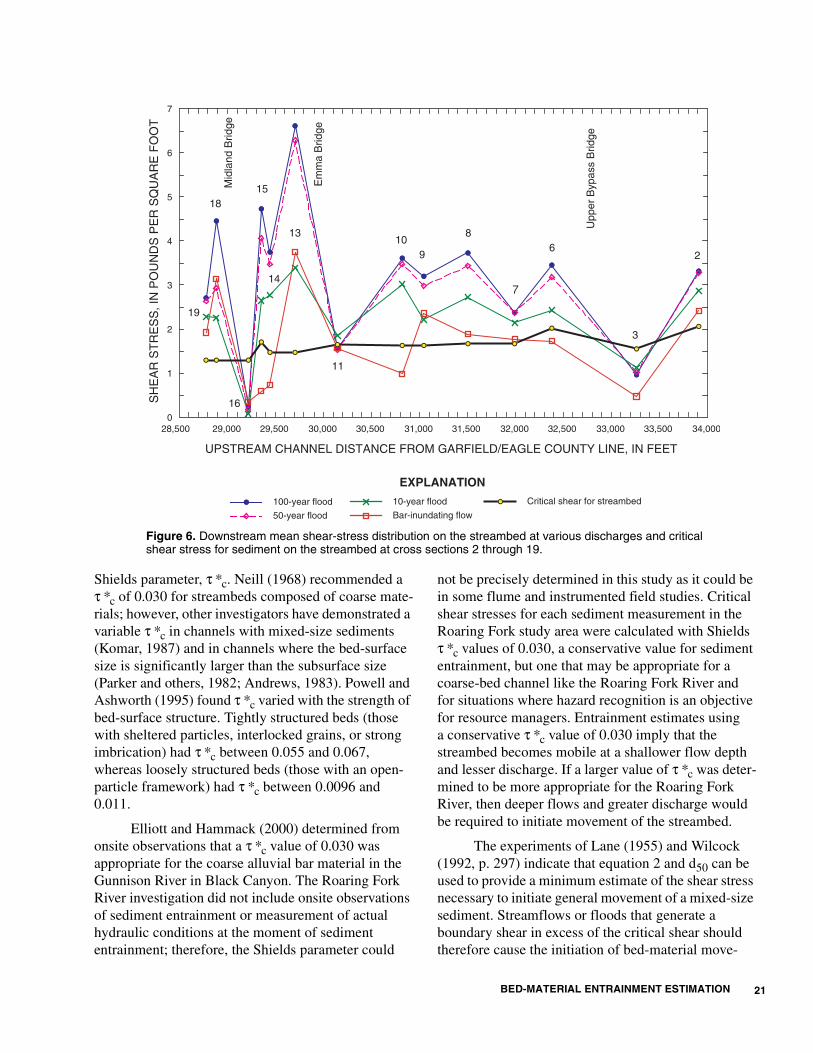
EXPLANATION
0
1
2
3
4
5
6
7
28,500 29,000 29,500 30,000 30,500 31,000 31,500 32,000 32,500 33,000 33,500 34,000
UPSTREAM CHANNEL DISTANCE FROM GARFIELD/EAGLE COUNTY LINE, IN FEET
SH
EA
R S
TR
ES
S, I
N P
OU
ND
S P
ER
SQ
UA
RE
FO
OT
100-year flood
50-year flood
10-year flood
Bar-inundating flow
Critical shear for streambed
2
3
7
8
11
13
14
15
16
18
19
69
10M
idla
nd B
ridge
Em
ma
Brid
ge
Upp
er B
ypas
s B
ridge
Figure 6. Downstream mean shear-stress distribution on the streambed at various discharges and critical shear stress for sediment on the streambed at cross sections 2 through 19.
Shields parameter, τ *c. Neill (1968) recommended a τ *c of 0.030 for streambeds composed of coarse mate-rials; however, other investigators have demonstrated a variable τ *c in channels with mixed-size sediments (Komar, 1987) and in channels where the bed-surface size is significantly larger than the subsurface size (Parker and others, 1982; Andrews, 1983). Powell and Ashworth (1995) found τ *c varied with the strength of bed-surface structure. Tightly structured beds (those with sheltered particles, interlocked grains, or strong imbrication) had τ *c between 0.055 and 0.067, whereas loosely structured beds (those with an open-particle framework) had τ *c between 0.0096 and 0.011.
Elliott and Hammack (2000) determined from onsite observations that a τ *c value of 0.030 was appropriate for the coarse alluvial bar material in the Gunnison River in Black Canyon. The Roaring Fork River investigation did not include onsite observations of sediment entrainment or measurement of actual hydraulic conditions at the moment of sediment entrainment; therefore, the Shields parameter could
not be precisely determined in this study as it could be in some flume and instrumented field studies. Critical shear stresses for each sediment measurement in the Roaring Fork study area were calculated with Shields τ *c values of 0.030, a conservative value for sediment entrainment, but one that may be appropriate for a coarse-bed channel like the Roaring Fork River and for situations where hazard recognition is an objective for resource managers. Entrainment estimates using a conservative τ *c value of 0.030 imply that the streambed becomes mobile at a shallower flow depth and lesser discharge. If a larger value of τ *c was deter-mined to be more appropriate for the Roaring Fork River, then deeper flows and greater discharge would be required to initiate movement of the streambed.
The experiments of Lane (1955) and Wilcock (1992, p. 297) indicate that equation 2 and d50 can be used to provide a minimum estimate of the shear stress necessary to initiate general movement of a mixed-size sediment. Streamflows or floods that generate a boundary shear in excess of the critical shear should therefore cause the initiation of bed-material move-
BED-MATERIAL ENTRAINMENT ESTIMATION 21

ment. Over a period of time, and if great enough, the excess shear stress will result in bedload transport and, possibly, channel adjustments.
When the boundary shear stresses associated with a range of discharges, τ o, are compared to the critical shear stress, τ c, for the d50 of the sediment, it is possible to evaluate the sediment-entrainment poten-tial of each discharge with respect to the streambed in general or of a particular geomorphic surface or loca-tion on a cross section (Elliott and Hammack, 1999 and 2000). The critical shear stress associated with sediment entrainment (eq. 2) is, at best, a minimum estimate of the critical discharge because only a small area of the entire surface or only a few particles of the d50 size may be entrained by the critical discharge (Lisle and others, 1993; Milhous, 1982). Wilcock and McArdell (1993) observed that complete mobilization of a size fraction, such as d50 , occurred at roughly twice the shear stress necessary to initiate movement of individual particles in that size fraction.
Entrainment Potential
Once the critical shear stress (τ c) has been iden-tified for the sediment on a specific alluvial surface, the critical discharge (the minimum streamflow required to entrain sediment d50) can be estimated by equating τ c with the boundary shear stress (τ o) and using the relation between shear stress and discharge at a specific cross-section location. Sediment-entrain-ment potential for a specific geomorphic surface can be expressed as the ratio of flood-generated boundary shear stress to the critical shear stress (τ o/τ c). The τ o/τ c ratio integrates several geomorphic and sedi-ment variables (flow depth, energy gradient or water-surface slope, median sediment-particle size, critical shear stress) and is applicable over a wide range of variable values. When calculated for a range of discharges at several cross sections in a river reach, the τ o/τ c ratio facilitates site-to-site comparison of entrainment potential and provides a method to eval-uate the relative effects of different hypothetical flood discharges (Elliott and Hammack, 2000).
Entrainment potential was calculated for the four reference streamflows at 14 of the 18 cross sections in the 1-mile study reach of the Roaring Fork River (fig. 2). The entrainment potential at each cross section for a specific reference streamflow can be viewed in a downstream perspective. Figure 7A–D shows the entrainment potential for the channel
thalweg (calculated from the greatest depth at each cross section), the mean streambed (calculated with the mean depth at each cross section), and the tops of the alluvial bars, if present and if inundated (calculated with the flow depth over the highest point on the bar).
Two entrainment threshold lines are plotted in figure 7A–D. The partial entrainment threshold (τ o/τ c=1) (solid horizontal line in fig. 7) is the condi-tion where the mean boundary, or at-a-point, shear stress (τ o) just equals the critical shear stress for the median particle size (τ c) at that cross section. At this threshold streamflow, the d50 particle size becomes entrained, but movement of d50-size particles may be limited to a few particles and in a limited area of the streambed. The complete entrainment threshold (τ o/τ c=2) (dashed horizontal line in fig. 7) is the condition where τ o is twice the critical shear stress for the median particle size, the condition where Wilcock and McArdell (1993) observed complete or wide-spread mobilization of a particle-size fraction such as the d50. In most locations, τ o increases with discharge (eq. 1), whereas τ c is relatively constant for a given sediment d50 (fig. 6). The ratio of τ o/τ c generally increases with discharge, although the rate of change and the value of τ o/τ c vary with channel configura-tion, local energy gradient, and local sediment size. Entrainment is anticipated and the critical discharge is attained when τ o/τ c exceeds a threshold value of 1.0 (or 2.0 for complete mobilization); but as figure 7A–D illustrates, the critical discharge is not identical for similar geomorphic surfaces at different cross sections.
Analysis
This study investigates the entrainment, or movement, of sediment on the streambed and assumes that it is an indicator of the tendency for a river reach to transport or deposit sediment under a specific streamflow scenario. Entrainment estimates such as these are not surrogates for bedload-transport measurements or estimates; however, entrainment esti-mates can be used to assess the anticipated behavior of a river during floods of different magnitudes.
A stream channel in a "steady state" of equilib-rium has a relatively constant cross-section geometry, downstream gradient, and planform pattern over time (Schumm, 1977, p. 96–100). Such a channel is consid-ered stable because, even though the channel will gradually shift its location through the flood plain, it
22 Bed-Material Entrainment Potential, Roaring Fork River at Basalt, Colorado

BED-MATERIAL ENTRAINMENT ESTIMATION 23
EXPLANATION
0
1
2
3
4
5
6
28,500 29,000 29,500 30,000 30,500 31,000 31,500 32,000 32,500 33,000 33,500 34,000
UPSTREAM CHANNEL DISTANCE FROM GARFIELD/EAGLE COUNTY LINE, IN FEET
Thalweg with bar-inundating flow
Mean streambed with bar-inundating flow
Bar tops are at the water surface
Complete entrainment threshold ( =2 )
Partial entrainment threshold Cross section
2
3
7
8
8
11
13
14
1516
18
19
RA
TIO
OF
FLO
OD
SH
EA
R T
O C
RIT
ICA
L S
HE
AR
FO
R d
(
/
)50
oc
( / )o c
( / )o c ( = )o
o
c
c
A
Mid
land
Brid
ge
Em
ma
Brid
ge
Upp
er B
ypas
s B
ridge
Some sediment moving
No sediment moving
Muchsediment moving
6
910
EXPLANATION
0
1
2
3
4
5
6
28,500 29,000 29,500 30,000 30,500 31,000 31,500 32,000 32,500 33,000 33,500 34,000
Thalweg with 10-year flood
Mean streambed with 10-year flood
Bar tops with 10-year flood
2
3
7
8
1113
14
15
16
18
19
Much
6
9
10
UPSTREAM CHANNEL DISTANCE FROM GARFIELD/EAGLE COUNTY LINE, IN FEET
8
RA
TIO
OF
FLO
OD
SH
EA
R T
O C
RIT
ICA
L S
HE
AR
FO
R d
(
/
)50
oc
B
Complete entrainment threshold ( =2 )
Partial entrainment threshold Cross section
( = )o
o
c
c( / )o c
( / )o c
( / )o c
Mid
land
Brid
ge
Em
ma
Brid
ge
Upp
er B
ypas
s B
ridge
sediment moving
Some sediment moving
No sediment moving
Figure 7. Entrainment potential (τ o/τ c) of the streambed, thalweg, and alluvial bars at the (A) bar-inundating discharge, (B) 10-year flood, (C) 50-year flood, and (D) 100-year flood, Roaring Fork River at Basalt.

24 Bed-Material Entrainment Potential, Roaring Fork River at Basalt, Colorado
EXPLANATION
0
1
2
3
4
5
6
28,500 29,000 29,500 30,000 30,500 31,000 31,500 32,000 32,500 33,000 33,500 34,000
Thalweg with 50-year flood
Mean streambed with 50-year flood
Bar tops with 50-year flood
2
3
7
8
11
13
14
15
16
18
19
Upp
er B
ypas
s B
ridge
Em
ma
Brid
ge
Mid
land
Brid
ge
Much sediment moving
Some sediment moving
No sediment moving
6
910
UPSTREAM CHANNEL DISTANCE FROM GARFIELD/EAGLE COUNTY LINE, IN FEET
8
RA
TIO
OF
FLO
OD
SH
EA
R T
O C
RIT
ICA
L S
HE
AR
FO
R d
(
/
)50
oc
C
Complete entrainment threshold ( =2 )
Partial entrainment threshold Cross section
( = )o
o
c
c( / )o c
( / )o c
( / )o c
EXPLANATION
0
1
2
3
4
5
6
28,500 29,000 29,500 30,000 30,500 31,000 31,500 32,000 32,500 33,000 33,500 34,000
Thalweg with 100-year flood
Mean streambed with 100-year flood
Bar tops with 100-year flood
2
3
7
8
11
13
14
15
16
18
19
Upp
er B
ypas
s B
ridge
Em
ma
Brid
ge
Mid
land
Brid
ge
Much sediment moving
Some sediment moving
No sediment moving
6
9
10
UPSTREAM CHANNEL DISTANCE FROM GARFIELD/EAGLE COUNTY LINE, IN FEET
8
RA
TIO
OF
FLO
OD
SH
EA
R T
O C
RIT
ICA
L S
HE
AR
FO
R d
(
/
)50
oc
D
Complete entrainment threshold ( =2 )
Partial entrainment threshold Cross section
( = )o
o
c
c( / )o c( / )o c
( / )o c
Figure 7. Entrainment potential (τ o/τ c) of the streambed, thalweg, and alluvial bars at the (A) bar-inundating discharge, (B) 10-year flood, (C) 50-year flood, and (D) 100-year flood, Roaring Fork River at Basalt—Continued.
will maintain its average cross-section area, width, depth, and pattern (sinuosity and bend radius of curva-ture). An equilibrium, or stable, channel has a form (fluvial geomorphology) that enables it to transport the water and sediment supplied to it without progressive, unidirectional aggradation or degradation (Leopold and others, 1964, p. 266–268). Channel segments in disequilibrium tend to have a fluvial geomorphology that reflects an imbalance between streamflow and sediment transport. Excess shear stress in alluvial channels can be associated with vertical or horizontal erosion (streambed scour or bank erosion). Deficient shear stress can be associated with channel aggrada-tion.
Channel modifications by humans can cause a relatively stable channel to become unstable. For example, channel straightening by cutting off or short-ening meander bends will steepen the flow path and increase shear stress on the streambed, often resulting in a degraded or incised channel. Constriction of the channel width, such as at a bridge crossing, can impound floodflows and create backwater areas. Back-water areas upstream from channel constrictions are associated with decreased flow velocity, water-surface slope, and shear stress, conditions that contribute to channel aggradation. Streamflow velocity and bed shear stress can increase at, and downstream from, a constriction and cause streambed scour in the channel. Large-scale eddies also can form downstream from a constriction, possibly resulting in lateral erosion of nonresistant streambanks and redeposition of sediment in the low-velocity areas of the eddy.
The mean shear stress on the Roaring Fork streambed at any reference streamflow is highly vari-able from cross section to cross section (fig. 6); however, the median sediment size of the streambed ranged from 128 to 202 mm (table 2), and the critical shear stress necessary to entrain the bed material fell within the relatively narrow range of 1.30 to 2.05 lb/ft2 (fig. 6). Consequently, the plots in figure 7A–D show great downstream variability in entrainment potential at any reference streamflow. At some cross sections, the bed or bar material is mobile (τ o/τ c plots above the threshold line), whereas at other cross sections, the bed or bar material is immobile (τ o/τ c plots below the threshold line) for the same discharge. The signifi-cance of the downstream variability is that sediment entrained at one cross section may be unable to move at a cross section farther downstream, a situation
resulting in deposition and possibly aggradation over a period of time.
The entrainment plot for the mean streambed during a bar-inundating streamflow (fig. 7A, solid line) indicates that little or no sediment in the d50-size range is likely to be entrained or transported through much of the study reach. However, the entrainment potential increases abruptly to more than twice the critical value (τ o/τ c greater than 2.0) at cross sections 13 and 18, then decreases just downstream. Cross sections 13 and 18 are located on the downstream faces of the Emma and Midland Avenue Bridges (fig. 2D), where the HEC–RAS-simulated water-surface slope steepens significantly. The abrupt increase in entrainment potential indicates that d50-size material is moving at cross sections 13 and 18 (d50 = 145 and 128 mm, respectively, table 2). Of significance in this channel subreach is the indication that d50-size material is not being entrained immedi-ately downstream from both bridges at cross sections 14, 15, 16, and 19 (d50-range 128 to 168 mm) by the same discharge. This spatial variation could indicate that sediment removed from the streambed at cross sections 13 and 18 is being deposited at the down-stream cross sections over time, possibly aggrading the channel and reducing flood conveyance by decreasing the channel area. Sediment is more mobile in the thalweg (fig. 7A, short-dashed red line) than on the mean streambed (solid red line) because flow depths are greatest over the thalweg. No sediment is moving on the highest alluvial bar surfaces (square symbols) because, by definition, they are not inun-dated by this discharge.
The entrainment plot for the mean streambed during a 10-year flood (fig. 7B, solid line) indicates that some sediment is moving at most cross sections in the study reach. Exceptions are at cross sections 3 and 16, where mean streambed shear stress is less than the critical shear stress for entrainment of the d50-size material. Because these cross sections are downstream from cross sections where some entrainment is occur-ring, there is a potential for aggradation over time. One noteworthy change in entrainment potential between the bar-inundating discharge and the 10-year flood is that the entrainment potential decreased at cross section 18. This decrease in the entrainment potential is a reflection of the decrease in water-surface slope downstream from cross section 18 as discharge increased (fig. 4, table 1). As with the bar-inundating discharge scenario, sediment is more mobile in the
BED-MATERIAL ENTRAINMENT ESTIMATION 25

thalweg (short-dashed red line) than on the mean streambed (solid red line), and entrainment-potential trends tend to mirror those of the mean streambed. All of the large, unvegetated alluvial bars visible in figure 2 are inundated by the 10-year flood (fig. 3), and sediment composing some of those bars is becoming entrained at this discharge (fig. 7B, square symbols).
The entrainment plot for the mean streambed during a 50-year flood (fig. 7C, solid black line) indi-cates that some sediment is moving at most cross sections in the study reach. Exceptions are at cross sections 3, 16, and possibly 11, where mean streambed shear stress is less than the critical shear stress for entrainment of the d50-size material. The entrainment potential at cross section 11 is slightly less for the 50-year flood than for the 10-year flood because the net effect of a decrease in water-surface slope outweighs the effect of an increase in mean flow depth (table 1). The entrainment potential downstream from the Emma Bridge (cross sections 13, 14, and 15) is great because of an increase in water-surface slope. The low value for entrainment potential at cross section 16 indicates potential aggradation during the 50-year flood. Sediment on most alluvial bars is poten-tially entrainable by the 50-year flood; however, sedi-ment on the alluvial bars at cross sections 3, 11, and 16 does not appear to be mobile (fig. 7C, square symbols). Depending on the size of sediment trans-ported from upstream and onto these surfaces, the allu-vial bars at cross sections 3, 11, and 16 could be depositional sites during a 50-year flood.
The entrainment plots for the mean streambed (solid blue line) and for alluvial bars (square symbols) during a 100-year flood (fig. 7D) are similar to those of the 50-year flood (fig. 7C). At most cross sections, there is little increase in flow depth between the 50- and 100-year floods (fig. 3), and the water-surface slopes show little change (fig. 4, table 1). One change from the 50-year flood to the 100-year flood is an abrupt increase in entrainment potential at cross section 18, downstream from the Midland Avenue Bridge, where the HEC–RAS-simulated slope has increased.
An examination of the entrainment-potential plots for all four discharge scenarios (fig. 7A–D) reveals some characteristics or trends common to all scenarios. The ratio of τ o/τ c at cross section 3 never exceeded the partial entrainment threshold of 1.0, indi-cating no movement of d50-size sediment (152 mm) at
this location. Because the streambed d50 upstream at cross section 2 (202 mm) is partially mobile (1.0 < τ o/τ c< 2.0) for all discharge scenarios, it might be expected from this analysis that material entrained from the vicinity of cross section 2 would be depos-ited in the vicinity of cross section 3. Anecdotal evidence (Dave Konchan, Town of Basalt, oral commun., 2000), onsite observation, and the aerial photograph taken in November 2000 (fig. 2A) indicate that the channel segment between cross section 3 and the Upper Bypass Bridge is a location of periodic streambed aggradation. The alluvial bar (Bar 9600) in figure 2A has become larger since an aerial photo-graph was taken in 1987 (McLaughlin Water Engi-neers, Inc., 2000). From a channel maintenance and management perspective, the river segment upstream from the Upper Bypass Bridge has been, and could continue to be, an area of concern due to aggradation and loss of channel conveyance. Aggradation here likely is due to the backwater effects of the Upper Bypass Bridge, which causes a decrease in water-surface slope upstream, and partly is due to the channel curvature at Bar 9600 (fig. 2A), which dissi-pates streamflow energy and contributes to a loss of competence (that is, a decrease in the maximum particle size the channel can transport).
The ratio of τ o/τ c for the mean streambed at cross sections 6, 7, 8, and 9 is near to, or exceeds, the partial mobility threshold (τ o/τ c = 1.0) for all simu-lated streamflows (fig. 7A–D). The entrainment poten-tial for the deeper thalweg part of the channel is well above the complete entrainment threshold (τ o/τ c = 2.0) at these cross sections also. The reach including cross sections 6, 7, 8, and 9 is slightly sinuous (fig. 2B), but this reach was artificially straightened during railroad construction in the late 19th century (Dave Konchan, Town of Basalt, oral commun., 2000). The consistently moderate to high entrainment potential in this reach may be a relict condition from the earlier effort to straighten the channel, an action that conse-quently steepened the channel as well. The probability of bed-material entrainment at all simulated discharges in this formerly straightened reach could indicate that the reach is an efficient transporter of supplied sedi-ment, assuming that the supplied sediment has a particle size comparable to the sediment measured at these cross sections and alluvial bars (table 2).
A channel avulsion, or cutoff, of a meander between cross sections 10 and 11 occurred sometime between 1987 and 1997 (fig. 2C). The effect of this
26 Bed-Material Entrainment Potential, Roaring Fork River at Basalt, Colorado
cutoff was to shorten the flow path and steepen the slope between cross sections 10 and 11. All simulated reference streamflows between these cross sections are laterally confined by a terrace on the north; however, the abandoned channel segment on the south has a sufficiently low relief to convey a portion of the discharge of the 10-, 50-, and 100-year floods. The significance of this condition is that bed material of the main channel is potentially entrainable from cross section 10 at the flows equal to or greater than the 10-year flood (figs. 7B, 7C, and 7D), and the main channel here may function as an efficient transporter of supplied bedload similar to the reach immediately upstream (cross sections 6 through 9). The channel segment in the meander bend abandoned after 1987 is filled with gravel- and cobble-size sediment, indi-cating that flood discharges may transport coarse sedi-ment into but not through this side channel. The entrainment potential at cross section 11 is much less than at cross section 10 for the 10-, 50-, and 100-year floods (figs. 7B, 7C, and 7D) because the streambed sediment is slightly coarser at cross section 11 than cross section 10 (table 2) and because the water-surface slope also is less (table 1, fig. 4D) due to the backwater effects of the Emma Bridge. Deposition of sediment in the vicinity of Bar 8300 may be a result of the decrease in shear stress downstream from cross section 11 (fig. 2C).
The potential effect of channel constrictions caused by the three bridges in Basalt is apparent in the longitudinal water-surface profiles (figs. 4A and 4D), the plot of downstream mean shear stress (fig. 6), and the entrainment potential plots (figs. 7A, 7B, 7C, and 7D). The narrow bridge openings and the abutments create a backwater area for flows equal to and larger than the 10-year flood. The alignment of piers acute to the flow direction and trapped woody debris beneath the Upper Bypass Bridge also may contribute to the backwater effect here, but this is not accounted for in the HEC-RAS one-dimensional flow model. Based on the estimated bar-inundating water-surface profile and the 1,260 ft3/s surveyed profile, the backwater effects of lower discharges may be less significant (figs. 4A and 4D). The entrainment-potential plots suggest that the streambed is immobile for all reference stream-flows at cross sections 3 and 16, upstream from the Upper Bypass and Midland Avenue Bridges, and immobile to only partly mobile at cross section 11, upstream from the Emma Bridge (fig. 7A–D). Bar 9600, downstream from cross section 3 (fig. 2A), and
Bar 8300, downstream from cross section 11, are depositional features that may have been enhanced by the backwater effects of the Upper Bypass and Emma Bridges.
Aerial photographs, surveyed channel cross sections, and anecdotal evidence indicate the river reach between the confluence of the Fryingpan River and the Midland Avenue Bridge recently has been an area of streambed deposition and reworking. This reach is hydraulically complex, geomorphically dynamic, and not well represented by the HEC–RAS one-dimensional streamflow model; however, aerial photographs from 1987, 1997, and 2000 indicate active sediment reworking in the reach. Bar 8050, now connected to the left bank at cross sections 14 and 15 (fig. 2D), was a midchannel bar in 1997. This bar was attached to the right bank upstream from the Fryingpan confluence and extended downstream from the present location of cross section 16 (fig. 2D) in the 1987 aerial photograph (McLaughlin Water Engineers, Inc., 2000).
The analysis of bed-material entrainment potential in this study is dependent on the resolution of previous surveys and the representativeness of streamflow modeling. The HEC–RAS one-dimen-sional model output from the 1997 FEMA study (McLaughlin Water Engineers, Inc., 2000) is adequate for flood-plain mapping and an understanding of general flood-related hazards over a broad area including the Town of Basalt. However, the location and spacing of cross sections, the resolution of channel geometry from surveyed points, and the model-gener-ated water-surface slopes are relatively insensitive to the scale and scope of this investigation, the main flood-conveying channel where much entrainable sediment is stored. More topographic detail of the streambed and channel and more closely spaced cross sections in some subreaches would allow more precise estimates of variation in shear stress and sediment entrainment potential. The 1,260-ft3/s water-surface profile from 2001 (fig. 4) reveals subtle variations in flow depth and water-surface slope, whereas the HEC–RAS water-surface profiles derived from single points at widely spaced cross sections do not.
The water-surface profile for the bar-inundating discharge was extrapolated from cross-section survey data that sometimes were not annotated. In these situa-tions, the bar tops were identified by a visual interpre-tation of the cross-section plot. When compared to the surveyed water surface at 1,260 ft3/s, a discharge that
BED-MATERIAL ENTRAINMENT ESTIMATION 27

did not inundate the major alluvial bars (fig. 2), the extrapolated bar tops sometimes were lower than the surveyed water surface (fig. 4). This could be because some of the surveyed surfaces were incorrectly identi-fied as bar tops. Other possible explanations for this apparent contradiction could be that local channel-geometry and bar-topography adjustments have occurred between the time of the cross-section surveys (October 1998 and April 1999) and the time of the water-surface survey (June 2001) or that alluvial bars in the study reach are formed by multiple discharges rather than by a single discharge common to all.
Regional flood-frequency equations derived from an analysis of the magnitude and frequency of Colorado floods (Vaill, 2000) indicate that the FEMA discharge estimates (Matrix Design Group, Inc., 2000) used in this study for the 10-, 50-, and 100-year floods may be too large. Published magnitude-frequency esti-mates for Colorado streams have been overestimated by as much as 35 percent when compared to Log Pearson III analysis of long-term gaging-station records (Jarrett, 1993). The significance of overesti-mating the discharge and the water-surface elevation, for example, for a flood of a 10-year recurrence, is that the entrainment estimates for the 10-year flood presented in this report may occur less frequently than an average of once in 10 years. The computation of revised flood magnitudes is beyond the scope of this report but could improve the accuracy of inundation and sediment-transport estimates in future studies.
Another shortcoming of this study is that streamflows between the bar-inundating discharge (approximately 3,000 ft3/s downstream from the Fryingpan River) and the 10-year flood (7,100 ft3/s downstream from the Fryingpan River) were not surveyed or simulated. This broad range of discharges is relatively common in the Roaring Fork River and includes the bankfull discharge, a frequently occurring streamflow shown by Andrews (1984) to be a signifi-cant transporter of bedload in Colorado mountain gravel-bed rivers. Frequent and widespread entrain-ment and transportation of bedload can result in adjustments in channel cross-section properties. Therefore, a comprehensive assessment of bed mate-rial entrainment potential should include additional computations within this important discharge range.
This study identifies cross sections or channel subreaches where bed-material entrainment potential is highly variable relative to the entrainment potential immediately upstream or downstream—for example,
in the subreaches just upstream from each of the three bridges. A persistent tendency for entrainment at all reference streamflows might indicate a similar tendency to transport sediment supplied from upstream or to scour the local bed material. Conversely, a persistent tendency for there to be no entrainment at any reference streamflow might indi-cate a higher probability for the bed to become armored, or immobile, or for the bed to aggrade and for flood conveyance to be reduced. Understanding the likely response of the streambed to a range of discharges will allow resource managers to identify channel subreaches where erosion-mitigation efforts or channel-clearing activities may be needed during or immediately after the recession of a flood. Identifica-tion of the geomorphic factors that lead to a high or low probability of sediment entrainment (slope, flow depth, sediment-size characteristics, and so forth) also is critical to proper design of channel modifications, such as cross-section changes, sinuosity and gradient changes, and the like.
Future studies to improve understanding of sedi-ment-related issues in the Roaring Fork could include refinement of shear stress calculations through appli-cation of a multidimensional streamflow model (McDonald and others, 2001). Such a model would produce more accurate shear stress estimates and would compute shear stress over a greater area of the streambed, as compared to the calculations of this study, which are limited to only 14 widely spaced cross sections. Sediment-entrainment-potential calcu-lations give only an indication of what the geomorphic response to floods could be. More accurate forecasts of channel adjustments resulting from sediment redis-tribution could be made through use of sediment- transport functions linked to a multidimensional flow model.
SUMMARY
The Roaring Fork River is a single-thread, high-gradient, cobble/boulder-bed river that presents a natural hazard from high-velocity snowmelt runoff, flood inundation, and a high bedload-transport rate that cause intermittent channel realignment, streambed scour, and deposition of coarse-grain bars and islands. Recent urban, highway, and recreational development on the flood plain, earlier attempts to realign and confine the Roaring Fork channel with retaining walls
28 Bed-Material Entrainment Potential, Roaring Fork River at Basalt, Colorado

and levees, and flow obstructions such as bridge open-ings and piers have altered the hydraulics, sediment entrainment, sediment transport, and sediment deposi-tion in the river at Basalt. Gravel, cobble, and boulder bed material is transported almost annually in the Roaring Fork River, and deposition of this coarse sedi-ment on the streambed and in large bars has reduced the flood-conveying capacity of the river. In addition, sedimentation may have diminished fish habitat in the reach and affected the function of an irrigation intake structure. Previous studies have identified flood-prone areas and hazards related to inundation and high streamflow velocity, but those studies have not evalu-ated response of the channel to discharges that entrain the coarse streambed. This study builds upon the results of earlier flood studies and addresses potential problems associated with bed-material entrainment.
Sediment entrainment estimates were made at several locations along the Roaring Fork River for four reference streamflows: the bar-inundating streamflow, and the 10-, 50-, and 100-year floods. The bar-inun-dating streamflow is approximately 2,500 ft3/s upstream from the Fryingpan River confluence and approximately 3,000 ft3/s downstream from the confluence. The 10-year flood is approximately 6,100 ft3/s upstream from the confluence and approxi-mately 7,100 ft3/s downstream from the confluence. The 50-year flood is approximately 8,500 ft3/s upstream from the confluence and approximately 9,400 ft3/s downstream from the confluence. The 100-year flood is approximately 9,400 ft3/s upstream from the confluence and approximately 10,400 ft3/s downstream from the confluence. Regional flood-frequency equations derived from an analysis of the magnitude and frequency of Colorado floods indicate that the discharge estimates for the 10-year, 50-year, and 100-year floods may be too large; however, computation of revised flood magnitudes is beyond the scope of this report. Consequently, the flood magni-tudes provided by Matrix Design Group, Inc. (2001) were used.
Sediment entrainment in stream channels is partly a function of the boundary shear stress (τ o) acting on sediment particles resting on or in the streambed or other inundated alluvial surfaces, and partly a function of the critical shear stress (τ c) of the sediment. Shear stress in the Roaring Fork River was calculated at 14 previously surveyed cross sections using the duBoys equation for the four reference streamflows. Shear stress was calculated for the active
channel using the mean streamflow depth, and for the thalweg and adjacent alluvial-bar surfaces using at-a-point depths determined from cross-section surveys and simulated water-surface elevations used in a previous HEC–RAS model.
The critical shear stress (τ c) is the shear stress at which general movement, or entrainment, of streambed sediment begins and has been related to sediment-size characteristics. Sediment-size character-istics, including the median particle size (d50), were determined for surficial material on the streambed of the low-flow channel, on large alluvial bars adjacent to the low-flow channel, and on one streambank using the Wolman method. Subsurface-sediment size was not determined. The mean of the d50 for seven streambed samples was 165 mm, the mean of the d50 for nine alluvial bar and bank samples was 107 mm. The bed and most bar deposits were relatively well sorted, a result of fluvial reworking.
The Shields equation was used to estimate the critical shear stress for entrainment of sediment d50 on the mean streambed, as well as on the thalweg or deepest point in the channel, and on adjacent alluvial bar surfaces, if present. The critical shear stresses for each sediment measurement in the Roaring Fork study area were calculated with Shields τ *c values of 0.030, a conservative value for sediment entrainment but one that may be appropriate for a coarse-bed channel like the Roaring Fork River and for situations where hazard recognition is an objective for resource managers. Entrainment estimates using a conservative τ *c value of 0.030 imply that the streambed becomes mobile at a shallower flow depth and lesser discharge than at a larger τ *c value. If a larger value of τ *c was determined to be more appropriate for the Roaring Fork River, then deeper flows and greater discharge would be required to initiate movement of the streambed.
Sediment-entrainment potential for a specific geomorphic surface can be expressed as the ratio of boundary shear stress to the critical shear stress (τ o/τ c) of sediment on that surface. The partial entrainment threshold (τ o/τ c=1) is the condition where the boundary shear stress (τ o) just equals the critical shear stress for the median particle size (τ c). At this threshold streamflow, the d50 particle size becomes entrained, but movement of d50-size particles is limited to a few individual particles and to a limited area of the cross section. The complete entrainment threshold (τ o/τ c=2) is the condition where τ o is twice
SUMMARY 29

the critical shear stress for the median particle size, the condition where complete or widespread mobilization of the d50 particle-size fraction occurs.
The τ o/τ c ratio integrates several geomorphic and sediment variables (flow depth, energy gradient or water-surface slope, median sediment-particle size, critical shear stress) and is applicable over a wide range of variable values. When calculated for a range of discharges at several cross sections in a river reach, the τ o/τ c ratio facilitates site-to-site comparison of entrainment potential and provides a method to eval-uate the relative effects of different hypothetical flood discharges. Downstream variability in τ o/τ c might indicate that sediment entrained at one cross section may be unable to move at a cross section farther down-stream, a situation resulting in deposition and possibly aggradation and loss of channel conveyance over a period of time.
The entrainment plot for the mean streambed during a bar-inundating streamflow indicates that little or no sediment in the d50-size range is likely to be entrained or transported through much of the study reach. However, the entrainment potential increases abruptly to more than twice the critical value (τ o/τ c greater than 2) at cross sections 13 and 18 (the down-stream faces of the Emma and Midland Avenue Bridges), then decreases just downstream. The abrupt increase and decrease in entrainment potential indi-cates that d50-size material is moving at cross sections 13 and 18 but that the d50-size material is not being entrained immediately downstream from both bridges at cross sections 14, 15, 16, and 19. This spatial varia-tion could indicate that sediment removed from the streambed at cross sections 13 and 18 is being depos-ited at the downstream cross sections over time, possibly aggrading the channel and reducing flood-conveyance by decreasing the channel area.
The entrainment plot for the mean streambed during a 10-year flood indicates that some sediment is moving at most cross sections in the study reach. Exceptions are at cross sections 3 and 16, where mean streambed shear stress is less than the critical shear stress for entrainment of the d50-size material. Because these cross sections are downstream from cross sections where some entrainment is occurring, there is a potential for aggradation over time.
The entrainment plots for the mean streambed during a 50- or 100-year flood indicate that some sedi-ment is moving at most cross sections in the study reach. Exceptions are at cross sections 3, 16, and
possibly 11, where mean streambed shear stresses are less than the critical shear stress for entrainment of the d50-size material. The entrainment potential down-stream from the Emma Bridge (at cross sections 13, 14, and 15) is great because of an increase in depth and in water-surface slope. The low value for entrainment potential at cross section 16 indicates potential aggra-dation during the 50- and 100-year floods. Sediment on most alluvial bars is potentially entrainable by the 50- and 100-year floods; however, sediment on the alluvial bars at cross sections 3, 11, and 16 does not appear to be mobile. Depending on the size of sedi-ment transported from upstream and onto these surfaces, the alluvial bars at cross sections 3, 11, and 16 could be depositional sites even during the largest of the simulated floods.
The ratio of τ o/τ c at cross section 3 never exceeds the partial entrainment threshold of 1.0, indicating no probable movement of d50-size sediment at this location. Because the streambed d50 upstream at cross section 2 is coarser and is partially mobile (1.0 < τ o/τ c< 2.0) for all discharge scenarios, it might be expected from this analysis that material entrained from the vicinity of cross section 2 would be deposited in the vicinity of cross section 3. Anecdotal evidence, onsite observation, and the aerial photograph taken in November 2000 indicate that the channel segment between cross section 3 and the Upper Bypass Bridge is a location of periodic streambed aggradation and could continue to be an area of concern due to aggra-dation and loss of channel conveyance. Aggradation here likely is due to the backwater effects of the Upper Bypass Bridge and partly due to the channel curvature at Bar 9600.
The consistently moderate to high entrainment potential in the reach including cross sections 6, 7, 8, and 9 may be a relict condition from a 19th century effort to straighten the channel, an action that conse-quently steepened the channel as well. The probability of bed-material entrainment at all simulated discharges in this reach could indicate that the reach is an efficient transporter of supplied sediment.
A channel avulsion of the meander between cross sections 10 and 11 occurred sometime between 1987 and 1997. The effect of this cutoff was to shorten the flow path and steepen the slope between cross sections 10 and 11. Bed material in the main channel is potentially entrainable from cross section 10 at the flows equal to or greater than the 10-year flood, and the main channel here may function as an efficient
30 Bed-Material Entrainment Potential, Roaring Fork River at Basalt, Colorado
transporter of supplied bedload similar to the reach immediately upstream (cross sections 6 through 9). The channel segment in the meander bend abandoned after 1987 is filled with gravel- and cobble-size sedi-ment, indicating that flood discharges may transport coarse sediment into but not through this side channel.
The entrainment potential at cross section 11 is much less than at cross section 10 for the 10-, 50-, and 100-year floods because the streambed sediment is slightly coarser at cross section 11 than at cross section 10 and because the water-surface slope is less due to the backwater effects of the Emma Bridge. Deposition of sediment in the vicinity of Bar 8300 may be a result of the decrease in water-surface slope and shear stress downstream from cross section 11.
Channel constrictions at the three bridges in Basalt create backwater areas of impounded water during the simulated 10-, 50-, and 100-year floods. The alignment of piers acute to the flow direction and trapped woody debris beneath the Upper Bypass Bridge also may contribute to the backwater effect here, but this is not accounted for in the HEC–RAS one-dimensional flow model. The entrainment- potential plots indicate that the streambed is immobile for all simulated streamflows at cross sections 3 and 16, upstream from the Upper Bypass and Midland Avenue Bridges, and immobile to only partly mobile at cross section 11, upstream from the Emma Bridge. Bar 9600, downstream from cross section 3, and Bar 8300, downstream from cross section 11, are deposi-tional features that may have been enhanced by the backwater effects of the Upper Bypass and Emma Bridges.
The entrainment estimates of this study are limited by the precision and availability of data that were used to calculate shear stress under the discharge scenarios. The location and spacing of cross sections, the resolution of channel geometry from surveyed points, and the model-generated water-surface slopes are relatively insensitive to the scale and scope of this investigation, the main flood-conveying channel where entrainable sediment is stored. More topographic detail of the streambed and channel and more closely spaced cross sections in some subreaches would allow more precise estimates of shear stress and sediment-entrainment potential. The river reach between the confluence of the Fryingpan River and the Midland Avenue Bridge is hydraulically complex, geomorphi-cally dynamic, and not well represented by the HEC–RAS one-dimensional streamflow model. Anecdotal
evidence and aerial photography indicate this reach recently has been an area of streambed deposition. Bar 8050 now is connected to the left bank at cross sections 14 and 15 but was a midchannel bar in 1997 and was attached to the right bank upstream from the Fryingpan River confluence in the 1987 aerial photo-graph.
The HEC–RAS-generated water-surface profiles used in this study were simulated using channel topog-raphy surveyed in 1998 and 1999, whereas sediment characteristics were measured in 2000 and 2001. It is possible that local channel-geometry adjustments occurred at some locations between the dates of surveying and sediment measurements. The discharges between the bar-inundating flow (approximately 3,000 ft3/s) and the 10-year flood (6,100 or 7,100 ft3/s) were not surveyed or simulated. This broad range of discharges is relatively common in the Roaring Fork River and includes the bankfull discharge, shown to be a significant transporter of bedload in Colorado moun-tain gravel-bed rivers.
The FEMA discharge estimates used in this study for the 10-, 50-, and 100-year floods may be too large. The significance of overestimating the discharge and the water-surface elevation for a flood of specific recurrence is that the entrainment estimates in this report may occur less frequently than the stated flood recurrences imply. Sediment-entrainment potential calculations give only an indication of what the geomorphic response to floods could be. More accu-rate forecasts of channel adjustments resulting from sediment redistribution could be made by using a multidimensional streamflow model and sediment-transport functions.
REFERENCES CITED
Andrews, E.D., 1983, Entrainment of gravel from naturally sorted riverbed material: Geological Society of America Bulletin, v. 94, p. 1225–1231.
Andrews, E.D., 1984, Bed-material entrainment and hydraulic geometry of gravel-bed rivers in Colorado: Geological Society of America Bulletin, v. 95, p. 371–378.
Carling, P.A., 1983, Threshold of coarse sediment transport in broad and narrow natural streams: Earth Surface Processes, v. 8, p. 1–18.
Chow, V.T., 1959, Open-channel hydraulics: New York, McGraw-Hill, Inc., 680 p.
REFERENCES CITED 31

Crowfoot, R.M., Unruh, J.W., Boulger, R.W., and O’Neill, G.B., 2000, Water resources data, Colorado, water year 2000, Volume 2, Colorado River Basin: U.S. Geolog-ical Survey Water-Data Report CO–00–2, 596 p.
Elliott, J.G., and Hammack, L.A., 1999, Geomorphic and sedimentologic characteristics of alluvial reaches in the Black Canyon of the Gunnison National Monu-ment, Colorado: U.S. Geological Survey Water-Resources Investigations Report 99–4082, 67 p.
Elliott, J.G., and Hammack, L.A., 2000, Entrainment of riparian gravel and cobbles in an alluvial reach of a regulated river: Regulated Rivers—Research and Management, v. 16, no. 1, p. 37–50.
Elliott, J.G., and Parker, R.S., 1997, Altered streamflow and sediment entrainment in the Gunnison Gorge: Journal of the American Water Resources Association, v. 33, no. 5, October 1997, p. 1041–1054.
Fahnestock, R.K., 1963, Morphology and hydrology of a glacial stream—White River, Mount Rainier, Wash-ington: U.S. Geological Survey Professional Paper 442–A, p. 1–70.
Friedman, J.M., and Auble, G.T., 1999, Mortality of riparian Box Elder from sediment mobilization and extended inundation: Regulated Rivers—Research and Management, v. 15, no. 5, p. 463–476.
Hydrologic Engineering Center, 1997, HEC-RAS River analysis system—Program user’s manual, version 2.0: U.S. Army Corps of Engineers, variously paged.
Jarrett, R.D., 1993, Flood elevation limits in the Rocky Mountains: Engineering Hydrology Symposium, Hydraulics Division of the American Society of Civil Engineers, San Francisco, July 25–30, 1993, p. 180–185.
Jarrett, R.D., and England, J.F., 2002, Reliability of paleo-stage indicators for paleoflood studies—Ancient floods, modern hazards; Principles and applications of paleoflood hydrology: American Geophysical Union, Water Science and Application series, v. 5, p. 91–109.
Komar, P.D., 1987, Selective gravel entrainment and the empirical evaluation of flow competence: Sedimen-tology, v. 34, p. 1165–1176.
Lane, E.W., 1955, Design of stable channels: Transactions, American Society of Civil Engineers, v. 120, no. 2776, p. 1234–1279.
Leopold, L.B., Wolman, M.G., and Miller, J.P., 1964, Fluvial processes in geomorphology: San Francisco, W.H. Freeman and Co., 522 p.
Lisle, T.E., Iseya, F., and Ikeda, H., 1993, Response of a channel with alternate bars to a decrease in supply of mixed-size bed load—A flume experiment: Water Resources Research, v. 29, no. 11, p. 3623–3629.
Matrix Design Group, Inc., 2000, Floodplain information report, Roaring Fork River, Town of Basalt, Colorado:
Matrix Design Group, Inc., Denver, Colo., July 24, 2000, 16 p. with numerous tables and figures.
McDonald, R.R., Bennett, J.P., and Nelson, J.M., 2001, The USGS multi-dimensional surface-water modeling system: Proceedings, 7th Federal Interagency Sedi-mentation Conference, Reno, Nev., March 25–29, 2001, CD-ROM, p. I–161–167.
McLaughlin Water Engineers, Inc., 2000, Evaluation of the Roaring Fork River Reach II for the Town of Basalt: Denver, Colo., May 2000, 28 p.
Milhous, R.T., 1982, Effect of sediment transport and flow regulation on the ecology of gravel-bed rivers, in Hey, R.D., Bathhurst, J.C., and Thorne, C.R., eds., Gravel-bed rivers: Chichester, England, John Wiley and Sons, Limited, p. 819–842.
Neill, C.R., 1968, A re-examination of the beginning of movement for coarse granular bed materials: Walling-ford, United Kingdom, Hydraulics Research Station, report no. INT 68, 37 p.
Parker, Gary, Klingman, P.C., and McLean, D.G., 1982, Bedload and size distribution in paved gravel-bed streams: American Society of Civil Engineers, Journal of the Hydraulics Division, v. 108, no. HY4, p. 544–571.
Powell, D.M., and Ashworth, P.J., 1995, Spatial pattern of flow competence and bed load transport in a divided gravel bed river: Water Resources Research, v. 31, no. 3, p. 741–752.
Schumm, S.A., 1977, The fluvial system: New York, John Wiley and Sons, 338 p.
Shields, A., 1936, Application of similarity principles and turbulence research to bedload movement, translated from Anwendung der Aehnlichkeitsmechanik und der Turbulenzforschung auf die Geschiebewegung: Mittei-lung Preussischen Versuchanstalt für Wasserbau und Schiffbau, Berlin, No. 26, by W.P. Ott and J.C. van Uchelen, California Institute of Technology Hydro-dynamics, Pasadena, Calif., Report No. 167, 43 p.
U.S. Interagency Advisory Committee on Water Data, 1982, Guidelines for determining flood-flow frequency: Reston, Va., U.S. Geological Survey, Office of Water Data Coordination, Bulletin 17B of the Hydrology Subcommittee, 183 p.
Vaill, J.E., 2000, Analysis of the magnitude and frequency of floods in Colorado: U.S. Geological Survey Water-Resources Investigations Report 99–4190, 35 p.
Vanoni, V.A., 1975, Sedimentation engineering: American Society of Civil Engineering, Manuals and Reports on Engineering Practice No. 54, 745 p.
Wilcock, P.R., 1992, Flow competence—A criticism of a classic concept: Earth Surface Processes and Land-forms, v. 17, p. 289–298.
32 Bed-Material Entrainment Potential, Roaring Fork River at Basalt, Colorado

Wilcock, P.R., and McArdell, B.W., 1993, Surface-based fractional transport rates—Mobilization thresholds and partial transport of a sand-gravel sediment: Water Resources Research, v. 29, no. 4, p. 1297–1312.
Williams, G.P., 1978, Bank-full discharge of rivers: Water Resources Research, v. 14, no. 6, p. 1141–1154.
Wolman, M.G., 1954, A method of sampling coarse river-bed material: American Geophysical Union Transac-tions, v. 35, p. 951–956.
Wolman, M.G., and Miller, J.P., 1960, Magnitude and frequency of forces in geomorphic process: Journal of Geology, v. 68, no. 1, p. 54–74.
REFERENCES CITED 33