bedside end tidal co2 as a screening tool to exclude
TRANSCRIPT

1
Bedside end tidal CO2 as a screening tool to exclude pulmonary embolism
Anna R. Hemnes, MD1, Alexander L. Newman, BA1, Benjamin Rosenbaum, MD2, Tyler W. Barrett, MD3, Chuan Zhou, PhD4, Todd W. Rice, MD, MSc1,
John H. Newman, MD1
1. Division of Allergy, Pulmonary and Critical Care Medicine, Vanderbilt University School of Medicine, Nashville, TN. 2. Division of Neurosurgery, Cleveland Clinic, Cleveland, OH, 3. Department of Emergency Medicine, Vanderbilt University School of Medicine, Nashville, TN. 4. Department of
Pediatrics, University of Washington, Seattle, WA
Keywords: pulmonary embolism, end tidal carbon dioxide, Wells score, prediction model, sensitivity and specificity Correspondence and reprints: Anna R. Hemnes, MD T1218 Medical Center North 1161 21st Ave South Nashville, TN 37232 615-322-3412 [email protected]
. Published on August 28, 2009 as doi: 10.1183/09031936.00084709ERJ Express
Copyright 2009 by the European Respiratory Society.

2
ABSTRACT: Background: End tidal CO2 (ETCO2) is a surrogate for dead space ventilation
that may be useful in evaluation of pulmonary embolism (PE). We aimed to
define the optimal ETCO2 level to exclude PE in patients evaluated for possible
thromboembolism.
Methods: 298 patients were enrolled over six months at a single academic
center. ETCO2 was measured within 24 hours of contrast enhanced helical CT,
lower extremity duplex or ventilation/perfusion scan. Performance characteristics
were measured by comparing test results with clinical diagnosis of PE.
Results: PE was diagnosed in 39 patients (13%). Mean ETCO2 in healthy
volunteers was not different from ETCO2 in patients without PE (36.3 ± 2.8, SD
mmHg vs. 35.5 ±6.8 mmHg). ETCO2 in patients with PE was 30.5 ± 5.5 mmHg
(p<0.001 versus no PE group). End tidal CO2 of ≥ 36 mmHg had optimal
sensitivity and specificity (87.2 and 53.0%) with a negative predictive value of
96.6% (92.3-98.5 95% CI). This increased to 97.6% (93.2-99.2 95% CI) when
combined with Wells score <4.
Conclusion: ETCO2 of ≥ 36mmHg may reliably exclude PE. Accuracy is
augmented by combination with Wells score. ETCO2 should be prospectively
compared to D dimer in accuracy and simplicity to exclude PE.

3
Introduction Pulmonary embolism (PE) is a common concern in the evaluation of diverse
clinical presentations including chest pain, dyspnea and hypoxemia[1]. Extensive
diagnostic evaluation, including contrast enhanced helical computed tomography
(CT), is frequently undertaken, despite a relatively low incidence of disease [2].
In addition to the cost of these studies, the risks of contrast and radiation
exposure add to the burden of evaluation [3, 4].
Diagnostic algorithms to simplify testing procedures in PE diagnosis have been
explored, most combining D dimer testing and CT angiography [5, 6]. D dimer
testing requires venipuncture and time for test performance [1, 5]. CT
angiography use in PE diagnosis has increased markedly [2]. As a low
percentage of CT angiograms demonstrate PE [2, 7, 8], concern has been raised
contrast and radiation risk [4, 9]. Clinical prediction rules, including the Wells
score, have also been proposed [6, 10] which have the advantage of
instantaneous results, avoidance of invasive procedures, and low risk and cost.
Thus there is a need for safer, more accurate and readily available diagnostic
testing for PE.
End tidal partial pressure of CO2 (ETCO2) is a physiological surrogate for
vascular obstruction from PE. Pulmonary thromboembolism results in dead
space ventilation and therefore prevents meaningful gas exchange in the
subtended lung unit, yielding an alveolar CO2 content as low as zero mmHg. As

4
a result, carbon dioxide content measured at end expiration, which represents
admixture of all alveolar gas, drops in proportion to dead space ventilation.
While there are many potential etiologies of increased dead space ventilation, e.g
advanced chronic obstructive pulmonary disease, these diseases are usually
easily identified. Increased dead space ventilation is not associated with
common clinical conditions that can present similarly to PE, e.g. unstable angina,
gastroesophageal reflux. Dead space measurement and arterial-alveolar carbon
dioxide tension gradient have been studied in the evaluation of PE [11-14], but
the utility of end tidal CO2 measurement alone in diagnosis of PE is not known.
ETCO2 is safe, non-invasive, inexpensive, and rapidly done at the bedside,
whereas dead space measurement requires collection of exhaled gas and
alveolar-arterial gradient requires arterial blood gas sampling.
As a proof of concept study, we measured ETCO2 in a large cohort of patients
undergoing evaluation for PE without controlling clinical care or management.
We hypothesized that ETCO2 would be reduced in patients with PE and that a
normal measurement would have a high negative predictive value to exclude PE.
Methods
Study Design:
This was a prospective, single center study designed to investigate the potential
role of ETCO2 in the diagnosis of PE. The Vanderbilt University Medical Center
Institutional Review Board approved the study.

5
Setting and Population:
All patients ≥18 years of age who were seen in the Emergency Department or
inpatient wards at an academic university hospital from October 2007 to April
2008 were screened electronically for a computer order for contrasted chest
helical CT, ventilation-perfusion lung scan, pulmonary angiogram or lower
extremity Duplex evaluation. Patients meeting screening criteria were
approached for consent to undergo end tidal CO2 determination within 24 hours
of study order placement. Exclusion criteria were inability to consent, pregnancy,
known hypercarbic respiratory failure, mechanical ventilation, face mask oxygen
or more than 5L/minute nasal cannula oxygen or known neuromuscular disease.
Patients who presented for evaluation more than once could be enrolled multiple
times (n=5, two studies each).
Measurements:
After informed consent, ETCO2 was measured by a trained single tester, blinded
to diagnosis (ALN), using the Nellcor NPB 75 handheld capnograph
(Miallinckrodt:Nellcor, St. Louis, MO) [15]. The device is calibrated to ± 2 mmHg
up to 38mmHg and ± 0.08% for every 1 mmHg over 40mmHg. We modified the
apparatus by inserting the uptake cannula into a plastic tube that, when placed in
the mouth, allowed patients to tidally breathe while CO2 was measured (shown
in Figure 1). Patients were instructed to breathe normally and were tested for
five breaths in either a supine or seated position. Nostrils were not clipped shut.

6
ETCO2 for each breath and respiratory rate were measured. The capnometer
was validated every two weeks at two levels of CO2 using a Medical Graphics
exercise machine calibrated to zero and 5.6% CO2. Patient charts were analyzed
for demographic data including comorbid conditions and thromboembolic risks,
self-reported race/ethnicity (categorized into Hispanic, African-American,
Caucasian, or other) results of serum chemistries, blood counts,
ventilation/perfusion lung scan, CT (Brilliance CT 64 Channel, Phillips,
Amsterdam, The Netherlands), pulmonary angiography, and venous duplex
exams. Wells score [6] was assigned by a single physician (ARH), blinded from
final diagnosis, from data obtained at the time that diagnostic tests were ordered.
Plasma D dimer testing (STA LIATEST, Diagnostica Stago, Parsippany, NJ[16])
was performed at the discretion of the treating physician. Patients with D dimer
testing alone for PE were not included in this study because of the risk of false
positive D dimer tests.
Criteria for diagnosis of PE
PE was defined by published consensus criteria [1] including positive contrast-
enhanced CT, intermediate or high probability ventilation perfusion lung scan (as
described in PIOPED I [17]) combined with high pretest probability, or positive
lower extremity duplex examination with a high clinical suspicion for PE.
Validation of ETCO2 measurement in Normal Controls

7
To ensure accuracy and reproducibility, and to standardize the modified sensing
device, and discover stability of ETCO2 measurements over time in healthy
individuals, we measured ETCO2 for five breaths in 24 healthy volunteers (mean
age 40.0 (12.0), 10/24 male) on three different days. Additionally, we measured
ETCO2 with different FiO2 delivered by nasal cannula up to 5 lpm and found no
difference (data not shown).
Statistical Analysis:
Based on our hospital’s experience and previous work [8, 18], we assumed a
15% positive rate of diagnostic tests for patients undergoing PE evaluation.
Given this diagnostic rate and a standard deviation of 2.8 mmHg in ETCO2
measurements in normal volunteers, a sample size calculation determined that
300 patients would be required to detect a difference in ETCO2 of 1.3 mmHg
between groups with 80% power at an alpha level of 0.05. This sample size
would allow detection of a difference of 9% in sensitivity compared to the Wells
score <4[6]. Continuous variables are reported as mean (standard deviation)
and analyzed using Student’s t-test or Wilcoxon Rank Sum testing. Categorical
variables are reported as percentages and were analyzed using Fisher’s Exact
test. Receiver Operating Characteristic (ROC) curves with area under the curve
(AUC) were used for determining the optimal ETCO2 to discriminate between
patients with and without PE. All p-values are two-tailed and values ≤ 0.05 were
considered significant. Data analyses were done using both R version 2.7.1 and
SPSS (Version 15.0; Chicago, IL, USA).

8
Results
Study Patients
A total of 335 patients were screened and approached for entry into the trial.
Twenty patients did not consent. Of the 315 patients in whom ETCO2 was
measured, 17 patients were excluded after enrollment (two were found to be
pregnant and 15 did not have any imaging studies) (Figure 2). Of the remaining
298 patients included in the final analysis, 39 were diagnosed with PE (34
positive helical CT, three intermediate or high probability ventilation perfusion
scans with high clinical suspicion, two positive lower extremity duplex
examination with high clinical suspicion). Five patients were enrolled twice. One
hundred eighty patients were enrolled from the Emergency Department with 21
PEs and 118 were inpatients with 18 PEs.
Demographic characteristics of the group as a whole and the sub-categories of
those with and without PE are shown in Table 1. There was no difference in
age, gender, ethnicity, smoking status or presence or absence of medical
comorbidities in the two groups. The group with PE was significantly enriched for
the presence of one or more risk factors for venous thromboembolic disease than
the no PE group (p<0.001). The group without PE had a range of diagnoses from
no cause identified (n=44,17%), pulmonary disease such as COPD, asthma or
lung cancer (n=84, 32%), and cardiac disease (n=48, 19%) to musculoskeletal
9
disease, neuromuscular disease, and deep venous thrombosis without PE which
made up the remainder.
Clinical Presentation
Patients with PE were less likely than those without PE to undergo chest CT
imaging for chest pain alone (p=0.01 PE vs. No PE groups, Table 2), however
there were no significant differences in the other indications for chest imaging
between the two groups. The mean Wells score was 4.3 ± 2.5 in the group with
PE and 1.7 ± 1.9 (p<0.001) in the no PE group. Five of 39 patients with PE had
a Wells score ≤ 2.0. Fourteen percent of CTs in the emergency department were
positive for PE and 17% of CTs ordered as an inpatient were positive for PE.
97/298 patients had serum D dimer measured, of these 47 were negative (0 PEs)
and 48 positive (4 PEs).
Validation of ETCO2 and consistency of ETCO2 method in healthy volunteers
In normal volunteers, mean ETCO2 was 36.3 ± 2.8 mmHg (95% CI 35.1-37.4,
Table 3). There were no significant differences among the five measured breaths
each day or among the mean ETCO2s in an individual over the three separate
days. Age and gender did not affect ETCO2.
ETCO2 in Patients
There was no significant difference in ETCO2 between normal controls and the
no PE group (36.3 ±2.8 vs. 35.5 ± 6.8 mmHg respectively, p=0.56, Figure 3).

10
The group with PE had a significantly lower ETCO2 (30.5 ± 5.5 mmHg vs.
healthy volunteers, p<0.001), which was also significant compared with the no
PE group (P<0.001). Mean ETCO2 was not different in the two D dimer groups
(35.3 ± 5.9 mmHg D dimer positive vs. 36.1 ± 5.2 in D dimer negative groups,
p=0.35). There were no adverse events related to ETCO2 measurement.
Sensitivity and Specificity of ETCO2 in the diagnosis of PE
A ROC curve demonstrating the ability of ETCO2 to discriminate between
patients with and without PE and the corresponding sensitivities and specificities
are shown in Figure 3 (AUC=0.739). In order to avoid the most unnecessary
procedures in the diagnosis of PE while maintaining optimal sensitivity for
diagnosis, we chose a cut off of 36 mmHg for further analysis of the
characteristics of this test. At this cut off, the negative predictive value was
96.6% (95% CI 92.3-98.5, Table 4).
When patients with ETCO2 ≥ 36 mmHg but < 44 mmHg (2.78 SD above normal)
were analyzed, there was an increase in negative predictive value to 97.6% (95%
CI 93.2-99.2). We found a negative predictive value for Wells score < 4 of 93.8%
(95% CI 89.9-96.2) in this population. In combining the Wells score < 4 with the
ETCO2 ≥ 36 mmHg without restriction on maximum ETCO2, the negative
predictive value again rose to 97.6% (95% CI 93.2-99.2.
Conclusions and Discussion:

11
In this preliminary study we show that a safe, simple, inexpensive, bedside test
for ETCO2 has a high negative predictive value in excluding PE and that the
ETCO2 in combination with the Wells Score improves negative predictive value
to a very high level of accuracy.
The D-dimer has been studied extensively in the exclusion of PE and its value in
exclusion of low risk patients for further diagnostic evaluation is well established
[1]. Despite a high negative predictive value in low risk patients [19] D dimer has
a highly variable sensitivity [20] and its interpretation can be confusing with
multiple commercially available tests and cut-off values [19]. Most importantly,
D-dimer testing requires venipuncture and time for transport, measurement and
reporting which may increase total healthcare expenditure. A more rapidly
available test would enhance speed of decision-making.
Dead space fraction (Vd/Vt), measured by comparing total exhaled partial
pressure CO2 (PCO2) with arterial partial pressure CO2 (PaCO2), has previously
been shown to be abnormal in PE and Vd/Vt in combination with D-dimer testing
is effective at ruling out PE [11-13, 21]. However, the requirement of specialized
equipment and an arterial puncture limit its widespread adaptation. ETCO2,
measured only with the handheld capnograph already in use at many hospitals,
is a surrogate for dead space measurement.

12
We examined various cut off levels of ETCO2 to determine optimal sensitivity
and specificity of this test. Using a cut off of ≥ 36mmHg, we were able to achieve
a negative predictive value of 96.6%, which is similar to that reported with d-
dimer testing [19]. There was a small improvement after excluding patients with
an ETCO2 significantly outside of the range of normal, but we felt this would
confuse clinical decision-making without a concomitantly large improvement in
test characteristics. The addition of the Wells score < 4 to the ETCO2
measurement similarly numerically improved our testing characteristics without
adding further confusion about patient exclusions. Importantly, we did find that
at the lower levels of ETCO2, there was a substantial increase in specificity for
PE. This improved specificity at lower ETCO2 levels is a marked contrast with D
dimer, with results that are either positive or negative.
In our study group, 166 subjects had an ETCO2 >36 mmHg and would not have
undergone further testing if that were used as the sole criterion for ruling out PE.
Of these 166 subjects, 20 had a Wells score of 4.0 or higher. Thus, in our study,
146/298 (49%) of subjects would have been spared further evaluation for PE
using these criteria. Three of 39 PEs would be missed in our study using these
criteria. All three of these patients were discovered to have hypoventilation after
further evaluation during the hospitalization (morbid obesity, chronic narcotic use
and interstitial lung disease).

13
The importance of sparing these diagnostic procedures is not trivial. In our
cohort, 226 patients (76%) underwent diagnostic CT scanning. The long-term
risks of exposure to radiation from chest CT scanning are a concern [4, 9, 22,
23]. The typical contrast-enhanced chest CT for PE evaluation delivers
approximately 20 mSv of radiation [4, 24]. This dose from a single CT
approaches the 40 mSv widely thought of as a dangerous limit from historical
data [4, 22, 24]. In our study alone, five people were enrolled twice in our six-
month study. While there is debate about the “safe limit” of radiation exposure,
the American College of Radiology has called for controlling unnecessary
radiation exposure [23]. The monetary savings from preventing unnecessary CT
studies is also potentially substantial. At a cost per study of $1739 [25], patients
in our study underwent a total of 226 contrast enhanced helical chest CTs, 120 of
which could potentially be spared saving $208, 680.
Our study included both inpatients and patients in the Emergency Department to
capture the complete population perceived to be at risk for PE. Because patients
who underwent only D-dimer testing were not included, we may have increased
the pre-test probability for PE in our cohort. Despite this potential bias, ETCO2
was similar in the normal controls and the group without PE, suggesting that
physiologically the group without PE was similar to normals. Too few patients
had PEs in the group with D dimer data to allow a meaningful direct comparison
with ETCO2. While our CT positivity rate for PE was lower than some prior
published reports[7, 8, 26], it is similar to other publications in the literature and

14
may represent local practice patterns[21, 27]. The ETCO2 would likely be
abnormal in conditions affecting metabolic activity or carbon dioxide excretion
such as pregnancy, end-stage chronic obstructive lung disease or advanced
neuromuscular disease; therefore we excluded patients known to have these
conditions from participation totaling fewer than 10 patients. Thyroid disease at
its extremes may affect ETCO2 results, but this is often not known at initial
evaluation, thus we did not exclude these patients. ETCO2 cannot distinguish
between type of pulmonary arterial obstruction such as acute PE, chronic
thromboembolic disease or tumor emboli. No CT angiograms showed changes
typical for chronic thromboembolic pulmonary hypertension.
We have shown that a cheap, simple, readily available, non-invasive test of
ETCO2 combined with a bedside prediction tool may be useful to exclude PE in
patients without pregnancy or advanced lung or neuromuscular disease. Further
study is needed to directly compare ETCO2 with D dimer in the evaluation of PE
and in sparing costly and potentially risky radiation exposure.
Literature Cited
1. Tapson VF. Acute pulmonary embolism. N Engl J Med 2008: 358(10): 1037-1052. 2. DeMonaco NA, Dang Q, Kapoor WN, Ragni MV. Pulmonary embolism incidence is increasing with use of spiral computed tomography. Am J Med 2008: 121(7): 611-617. 3. Parfrey PS, Griffiths SM, Barrett BJ, Paul MD, Genge M, Withers J, Farid N, McManamon PJ. Contrast material-induced renal failure in patients with diabetes mellitus, renal insufficiency, or both. A prospective controlled study. N Engl J Med 1989: 320(3): 143-149.
15
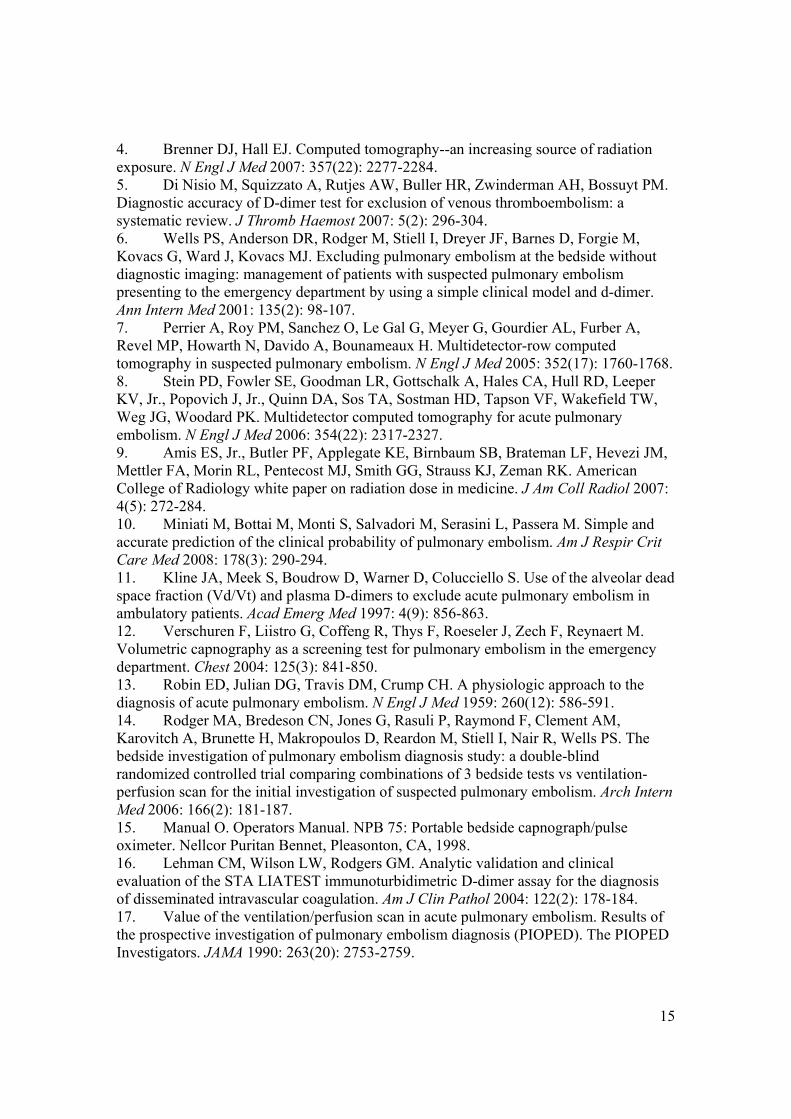
4. Brenner DJ, Hall EJ. Computed tomography--an increasing source of radiation exposure. N Engl J Med 2007: 357(22): 2277-2284. 5. Di Nisio M, Squizzato A, Rutjes AW, Buller HR, Zwinderman AH, Bossuyt PM. Diagnostic accuracy of D-dimer test for exclusion of venous thromboembolism: a systematic review. J Thromb Haemost 2007: 5(2): 296-304. 6. Wells PS, Anderson DR, Rodger M, Stiell I, Dreyer JF, Barnes D, Forgie M, Kovacs G, Ward J, Kovacs MJ. Excluding pulmonary embolism at the bedside without diagnostic imaging: management of patients with suspected pulmonary embolism presenting to the emergency department by using a simple clinical model and d-dimer. Ann Intern Med 2001: 135(2): 98-107. 7. Perrier A, Roy PM, Sanchez O, Le Gal G, Meyer G, Gourdier AL, Furber A, Revel MP, Howarth N, Davido A, Bounameaux H. Multidetector-row computed tomography in suspected pulmonary embolism. N Engl J Med 2005: 352(17): 1760-1768. 8. Stein PD, Fowler SE, Goodman LR, Gottschalk A, Hales CA, Hull RD, Leeper KV, Jr., Popovich J, Jr., Quinn DA, Sos TA, Sostman HD, Tapson VF, Wakefield TW, Weg JG, Woodard PK. Multidetector computed tomography for acute pulmonary embolism. N Engl J Med 2006: 354(22): 2317-2327. 9. Amis ES, Jr., Butler PF, Applegate KE, Birnbaum SB, Brateman LF, Hevezi JM, Mettler FA, Morin RL, Pentecost MJ, Smith GG, Strauss KJ, Zeman RK. American College of Radiology white paper on radiation dose in medicine. J Am Coll Radiol 2007: 4(5): 272-284. 10. Miniati M, Bottai M, Monti S, Salvadori M, Serasini L, Passera M. Simple and accurate prediction of the clinical probability of pulmonary embolism. Am J Respir Crit Care Med 2008: 178(3): 290-294. 11. Kline JA, Meek S, Boudrow D, Warner D, Colucciello S. Use of the alveolar dead space fraction (Vd/Vt) and plasma D-dimers to exclude acute pulmonary embolism in ambulatory patients. Acad Emerg Med 1997: 4(9): 856-863. 12. Verschuren F, Liistro G, Coffeng R, Thys F, Roeseler J, Zech F, Reynaert M. Volumetric capnography as a screening test for pulmonary embolism in the emergency department. Chest 2004: 125(3): 841-850. 13. Robin ED, Julian DG, Travis DM, Crump CH. A physiologic approach to the diagnosis of acute pulmonary embolism. N Engl J Med 1959: 260(12): 586-591. 14. Rodger MA, Bredeson CN, Jones G, Rasuli P, Raymond F, Clement AM, Karovitch A, Brunette H, Makropoulos D, Reardon M, Stiell I, Nair R, Wells PS. The bedside investigation of pulmonary embolism diagnosis study: a double-blind randomized controlled trial comparing combinations of 3 bedside tests vs ventilation-perfusion scan for the initial investigation of suspected pulmonary embolism. Arch Intern Med 2006: 166(2): 181-187. 15. Manual O. Operators Manual. NPB 75: Portable bedside capnograph/pulse oximeter. Nellcor Puritan Bennet, Pleasonton, CA, 1998. 16. Lehman CM, Wilson LW, Rodgers GM. Analytic validation and clinical evaluation of the STA LIATEST immunoturbidimetric D-dimer assay for the diagnosis of disseminated intravascular coagulation. Am J Clin Pathol 2004: 122(2): 178-184. 17. Value of the ventilation/perfusion scan in acute pulmonary embolism. Results of the prospective investigation of pulmonary embolism diagnosis (PIOPED). The PIOPED Investigators. JAMA 1990: 263(20): 2753-2759.

16
18. Kline JA, Israel EG, Michelson EA, O'Neil BJ, Plewa MC, Portelli DC. Diagnostic accuracy of a bedside D-dimer assay and alveolar dead-space measurement for rapid exclusion of pulmonary embolism: a multicenter study. JAMA 2001: 285(6): 761-768. 19. Stein PD, Hull RD, Patel KC, Olson RE, Ghali WA, Brant R, Biel RK, Bharadia V, Kalra NK. D-dimer for the exclusion of acute venous thrombosis and pulmonary embolism: a systematic review. Ann Intern Med 2004: 140(8): 589-602. 20. Siragusa S, Terulla V, Pirrelli S, Porta C, Falaschi F, Anastasio R, Guarnone R, Scarabelli M, Odero A, Bressan MA. A rapid D-dimer assay in patients presenting at the emergency room with suspected acute venous thrombosis: accuracy and relation to clinical variables. Haematologica 2001: 86(8): 856-861. 21. Anderson DR, Kovacs MJ, Dennie C, Kovacs G, Stiell I, Dreyer J, McCarron B, Pleasance S, Burton E, Cartier Y, Wells PS. Use of spiral computed tomography contrast angiography and ultrasonography to exclude the diagnosis of pulmonary embolism in the emergency department. J Emerg Med 2005: 29(4): 399-404. 22. Strzelczyk JJ, Damilakis J, Marx MV, Macura KJ. Facts and controversies about radiation exposure, part 2: low-level exposures and cancer risk. J Am Coll Radiol 2007: 4(1): 32-39. 23. Strzelczyk JJ, Damilakis J, Marx MV, Macura KJ. Facts and controversies about radiation exposure, part 1: controlling unnecessary radiation exposures. J Am Coll Radiol 2006: 3(12): 924-931. 24. Coche E, Vynckier S, Octave-Prignot M. Pulmonary embolism: radiation dose with multi-detector row CT and digital angiography for diagnosis. Radiology 2006: 240(3): 690-697. 25. Stein PD, Woodard PK, Weg JG, Wakefield TW, Tapson VF, Sostman HD, Sos TA, Quinn DA, Leeper KV, Jr., Hull RD, Hales CA, Gottschalk A, Goodman LR, Fowler SE, Buckley JD. Diagnostic pathways in acute pulmonary embolism: recommendations of the PIOPED II Investigators. Radiology 2007: 242(1): 15-21. 26. van Belle A, Buller HR, Huisman MV, Huisman PM, Kaasjager K, Kamphuisen PW, Kramer MH, Kruip MJ, Kwakkel-van Erp JM, Leebeek FW, Nijkeuter M, Prins MH, Sohne M, Tick LW. Effectiveness of managing suspected pulmonary embolism using an algorithm combining clinical probability, D-dimer testing, and computed tomography. JAMA 2006: 295(2): 172-179. 27. Yap KS, Kalff V, Turlakow A, Kelly MJ. A prospective reassessment of the utility of the Wells score in identifying pulmonary embolism. Med J Aust 2007: 187(6): 333-336.

17
Figure Legends Figure 1. ETCO2 sensor. Photo of modified sensor for ETCO2 detection. The
modified sensor is 5 cm long with a diameter of 1 cm.
Figure 2. Study flow diagram.

18
Figure 3. Top. ETCO2 in normal volunteers, patients without PE and
patients with PE. Mean ETCO2 ± SD in healthy volunteers, patients without PE
(no PE) and patients with PE (PE). * p<0.001 vs. healthy volunteers and no PE
group. Below. ETCO2 performance characteristics PE diagnosis. On the left
is the receiver operator characteristics curve for ETCO2 in the diagnosis of PE
and the corresponding sensitivities and specificities to a given ETCO2
measurement are shown on the right.

19

20
Tables Table 1. Demographics
All (n=298)
No PE (n=259)
PE (n=39)
p Value
Age (yrs) 52.1 ± 17.2 51.0 ± 17.1 59.5 ± 16.1 0.004 Gender (% female) 53 54 46 0.36 Race (%, n=294)
White African-American Other
72 25 3
72 25 3
77 23 0
Smoking (%, n=290) Never Current Past
53 32 15
53 33 14
54 24 22
0.39
Comorbidities (%) None Diabetes Hypertension Diabetes+hypertension Cancer Chronic lung disease Other
33 3 25 13 13 6 7
33 2
25 14 12 7 7
31 10 23 8
15 3
10
0.17
PE Risk Factors (%) None Post-operative Cancer Post-partum Immobilized Previous DVT/PE Multiple Other
62 4 13 1 3 8 8 1
68 4
12 1 2 7 4 0
18 5
18 0 8
13 33 5
<0.001
Data are presented as mean ± SD unless otherwise stated, n=298 unless otherwise stated, p values are for No PE vs. PE groups.

21
Table 2. Presenting Features of Study Enrollees
All (n=298)
No PE (n=259)
PE (n=39)
p Value
Indication for PE evaluation (%)
Chest pain Hypoxemia Dyspnea Hemoptysis Fever Chest pain and dyspnea Limb swelling/pain Miscellaneous
35 1 25 0 6 9
4 20
37 0 24 0 6 8
4 21
23 5
31 3 5
15
3 15
0.01
Wells score 2.0 ± 2.1 1.7 ± 1.9 4.3 ± 2.5 <0.001 Heart rate (bpm) 86.2 ± 17.1 86.0 ± 17.1 87.8 ± 15.0 0.42 Systolic blood pressure (mmHg)
125.3 ± 20.7 126.3 ± 21.0 118.7 ± 17.0 0.02
Diastolic blood pressure (mmHg)
72.2 ± 14.5 72.5 ± 15.0 70.4 ± 10.5 0.37
Respiratory rate (bpm)
17.2 ± 6.2 17.0 ± 6.3 18.6 ± 5.6 0.09
Oxygen saturation (%)
96.6 ± 2.6 96.6 ± 2.6 96.4 ± 2.3 0.39
Supplemental oxygen(%)
26 24 44 0.01
Data are presented as mean ± SD unless otherwise stated, n=298 unless otherwise stated, p values are for No PE vs. PE groups

22
Table 3. ETCO2 in normal individuals over 5 separate days Age (yrs) 40.0 ± 12.0 Female no. 14 Smoking no.
Never Past Current
20 4 0
ETCO2 by breath (Day 1) (mmHg)
Breath 1 Breath 2 Breath 3 Breath 4 Breath 5
36.7 ± 3.0 36.3 ± 2.9 36.7 ± 3.0 37.1 ± 3.5 37.3 ± 3.6
p=0.21
ETCO2 by day (mmHg) Day 1 Day 2 Day 3
36.6 ± 3.0 36.6 ± 3.8 35.6 ± 3.6
p=0.25
Overall mean ETCO2 (mmHg) 36.4 ± 2.8 Data are presented as mean ± SD, n=24

23
Table 4. Test performance characteristics
Sensitivity (%, 95% CI)
Specificity (%, 95% CI)
Positive Predictive
Value (%, 95% CI)
Negative Predictive
Value (%, 95% CI)
ETCO2 <36 All Comers
87.2 (73.3-94.4)
53.0 (47.0-58.8)
21.1 (15.5-28.1)
96.6 (92.3-98.5)
ETCO2 <36, excluding >44
91.9 (78.7-97.2)
49.0 (42.8-55.2)
21.1 (15.5-28.1)
97.6 (93.2-99.2)
Wells Score ≥4
61.5 (45.9-75.1)
83.3 (78.4-87.3)
34.8 (24.6-46.6)
93.8 (89.9-96.2)
ETCO2 <36 All Comers + Wells Score ≥ 4
92.3 (79.7-97.3)
45.2 (39.4-51.1)
19.6 (14.5-25.9)
97.6 (93.2-99.2)

24