beech ridge energy wind project habitat … · • construction – predict construction noise...
TRANSCRIPT

BEECH RIDGE ENERGY WIND PROJECT Habitat Conservation Plan FINAL ENVIRONMENTAL IMPACT STATEMENT
September 2013 U.S. FISH AND WILDLIFE SERVICE
Appendix C: Acoustical Reports for Beech Ridge Wind Project
Report C-1. Acoustical Study of Proposed Beech Ridge Wind Farm, Greenbrier County, WV (Acentech 2006)
Report C-2. Acoustical Study of Proposed Expansion/Modification of Beech Ridge Wind Farm, Greenbrier County, WV (Acentech 2011)

Acentech Report No. 359R
Acoustical Study of ProposedBeech Ridge Wind FarmGreenbrier County, WV
May 2006
James D. BarnesBrian W. DonaldJoseph HorescoJonah Sacks
Submitted by:
Acentech Incorporated33 Moulton StreetCambridge, MA 02138
Prepared for:
Invenergy Wind LLC3460 Olney-Laytonsville RoadOlney, MD 20832
Report No. 359R Acentech Incorporated
ii
Table of Contents
Page
List of Figures and Tables ............................................................................................................ iii
1. Introduction ..............................................................................................................................1
2. Description of Proposed Facility and Site................................................................................1
3. Guidelines for Noise Studies....................................................................................................2
4. Preconstruction Ambient Sound Measurements ......................................................................2
5. Construction Sound Estimates and Mitigation Measures ........................................................4
6. Operation Sound Estimates and Mitigation Measures .............................................................5
7. Noise Impact Assessment ........................................................................................................6
Appendix A – Sound in Lay Terms........................................................................................... A-1

Report No. 359R Acentech Incorporated
iii
List of Figures and Tables
Figure 1. Area Map with Proposed Beech Ridge Wind Farm Showing Turbine Locations andOne Mile and Five-Mile Buffer Zones.
Figure 2. Area Map with Community Sound Monitoring Locations 1 through 6 and AverageMeasured Existing Ambient Day-Night Sound Levels (Ldn) during September –October 2005 Sound Survey.
Figure 3. View of Location 1 (Town of Duo).
Figure 4. View of Church near Location 1 (Town of Duo).
Figure 5. View of Location 2 (Little Beech Knob).
Figure 6. Close-in View of Location 2 (Little Beech Knob).
Figure 7. View of Location 3 (Hunting Cabins).
Figure 8. View of Cabin near Location 3 (Hunting Cabins).
Figure 9. View of Location 4 (Home South of B Turbine Line).
Figure 10. View of Location 5 (Flynn’s Creek).
Figure 11. View of Location 6 (Leonard/Cordova).
Figure 12. View of Road near Location 6 (Leonard/Cordova).
Figure 13. Hourly Leq A-Weighted Existing Ambient Sound Levels Measured at Location 1(Town of Duo) during 27 September – 5 October 2005.
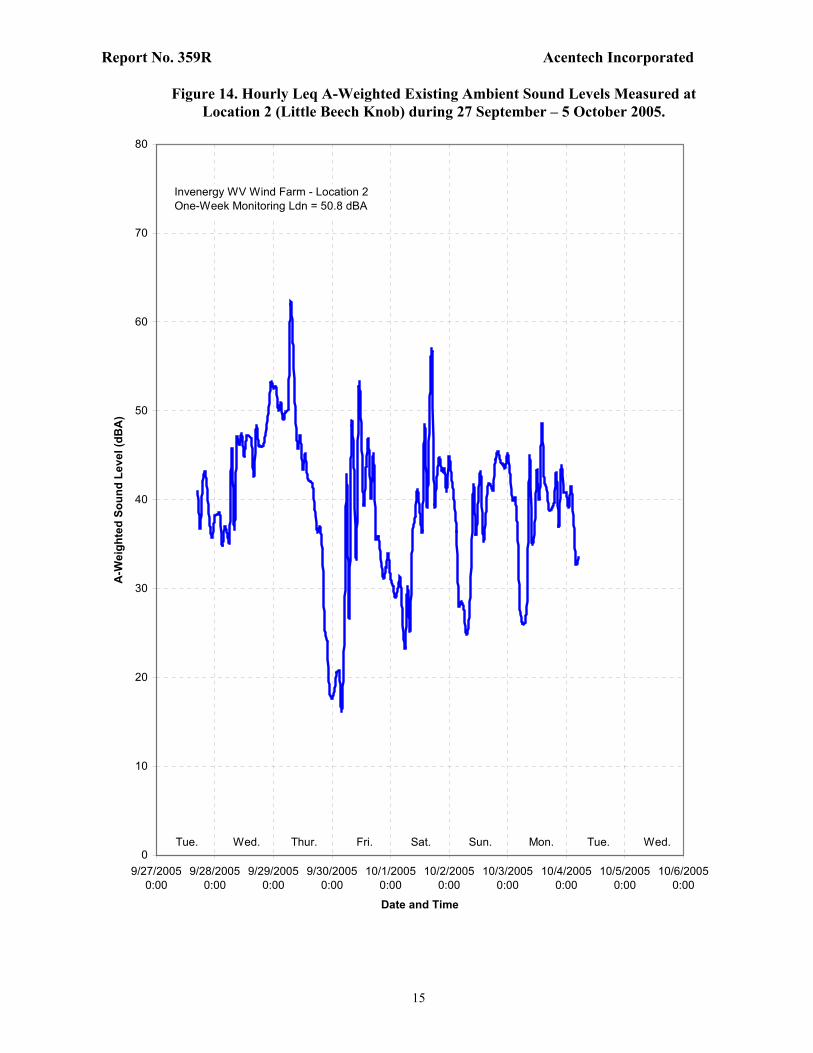
Figure 14. Hourly Leq A-Weighted Existing Ambient Sound Levels Measured at Location 2(Little Beech Knob) during 27 September – 5 October 2005.
Figure 15. Hourly Leq A-Weighted Existing Ambient Sound Levels Measured at Location 3(Hunting Cabins) during 27 September – 5 October 2005.
Figure 16. Hourly Leq A-Weighted Existing Ambient Sound Levels Measured at Location 4(Home South of B-Turbine Line) during 27 September – 5 October 2005.
Figure 17. Hourly Leq A-Weighted Existing Ambient Sound Levels Measured at Location 5(Flynn’s Creek) during 27 September – 5 October 2005.
Figure 18. Hourly Leq A-Weighted Existing Ambient Sound Levels Measured at Location 6(Leonard/Cordova) during 27 September – 5 October 2005.

Report No. 359R Acentech Incorporated
iv
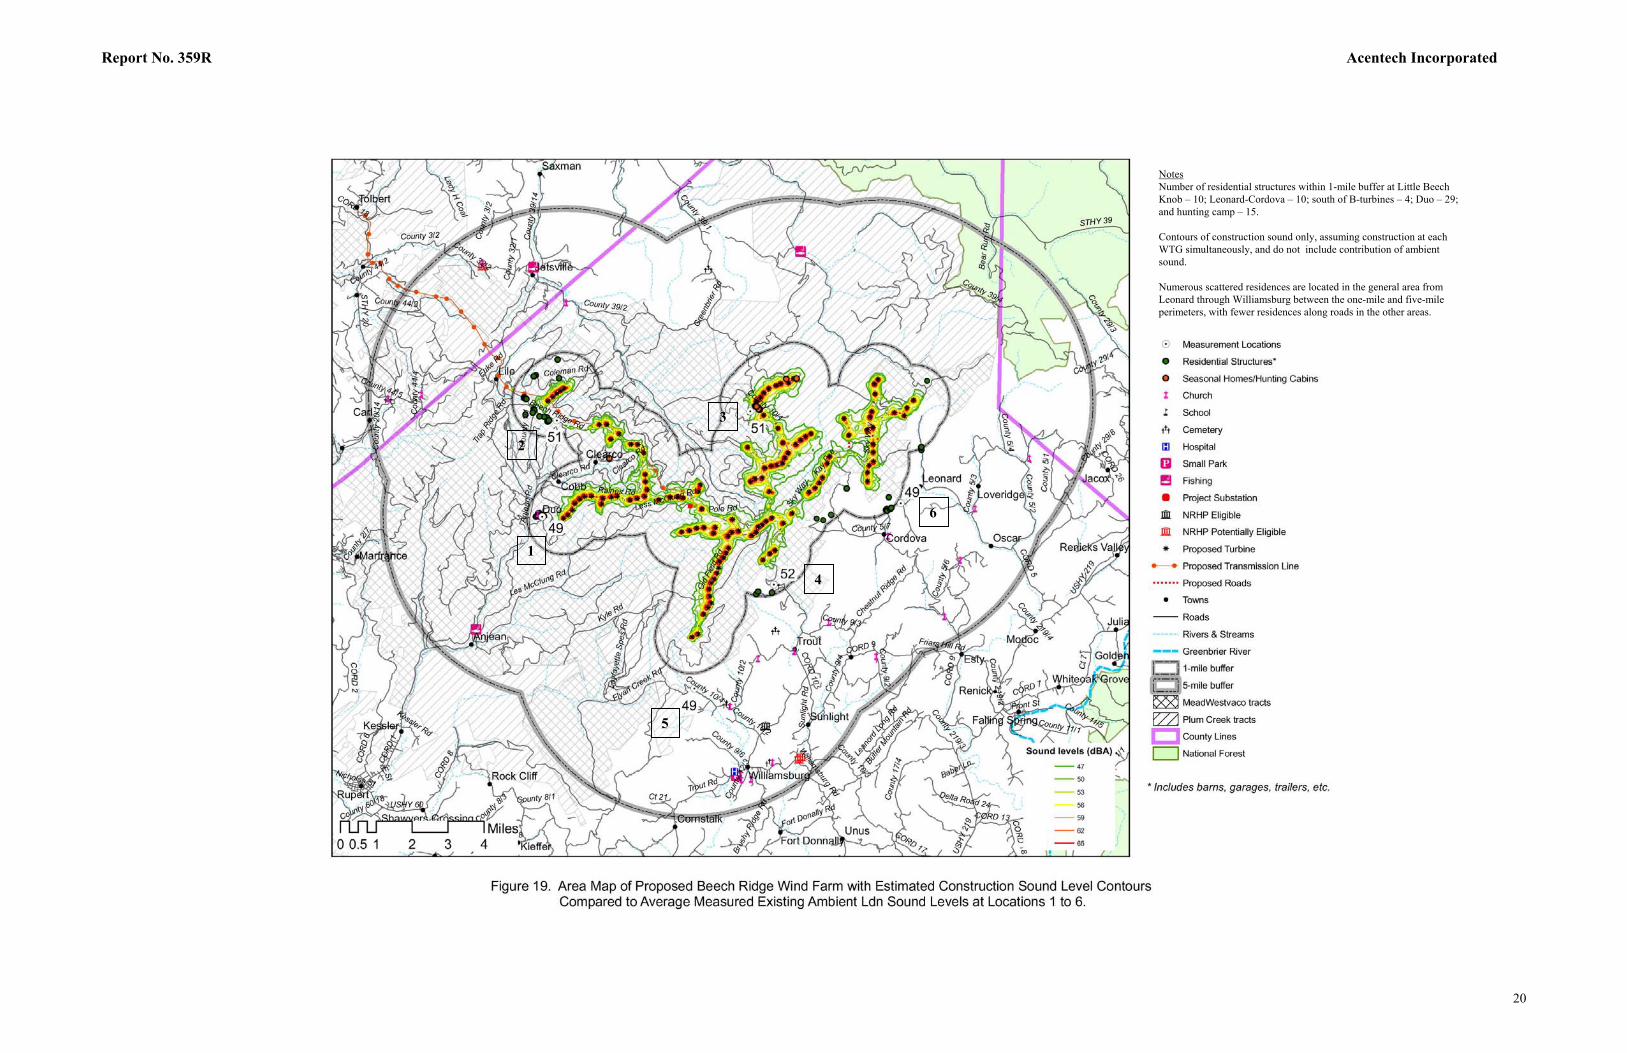
Figure 19. Area Map of Proposed Beech Ridge Wind Farm with Estimated Construction SoundLevel Contours (Average Day-Night Sound Levels, dBA, during Phase 1 Construction)Compared to Average Measured Existing Ambient Ldn Sound Levels at Locations 1 to6.
Figure 20. Area Map of Proposed Beech Ridge Wind Farm with Estimated Operation Sound LevelContours Compared to Average Measured Existing Ambient Ldn Sound Levels atLocations 1 to 6.
Figure 21. Area Map of Proposed Beech Ridge Wind Farm with Estimated Operation Sound LevelContours Compared to Average Measured Existing Ambient Ldn Sound Levels atLocations 1 to 6. Includes Land Use Classifications.
*************
Table 1. Description of Monitoring Locations for Preconstruction Ambient Sound Survey.
Table 2. Type of Acoustic Instrumentation Used for Ambient Sound Survey during 27September - October 2005.
Table 3. Summary of Monitoring Locations and Ldn Sound Levels (dBA) Measured duringAmbient Sound Survey (27 September - 5 October 2005).
Table 4. Estimated Equivalent Sound Levels (Leq*) of Representative Construction Equipmentat Various Distances.
Table 5. Comparison of Average Measured Ldn Sound Levels during Ambient Sound Surveywith Estimated Ldn Sound Levels for WTG Facility (dBA).

Report No. 359R Acentech Incorporated
1
1. Introduction
Invenergy Wind LLC has proposed to design, construct, and operate a nominal 200 MW wind farm ata mountainous rural site in southeast West Virginia. In support of this project, Invenergy hasrequested that Acentech Incorporated perform an acoustical study of this project and provideinformation for review by the West Virginia Public Service Commission (WVPSC) during the sitepermitting process. To date, Acentech has reviewed the facility and site drawings, equipmentinformation, and the revised noise study guidelines of the WVPSC that were provided to us byInvenergy; toured the project area; conducted sound measurements and observations of the existingambient conditions at representative community locations; and estimated construction and operationsound levels for the facility. This report presents the ambient sound measurements and results of ouracoustical study.
2. Description of Proposed Facility and Site
The proposed wind power project consists of up to 124 General Electric (GE) Model 1.5sle windturbine generators (WTGs) and associated equipment, with each WTG to be mounted on individual80-meter tall towers across 20 miles of ridgelines in Greenbrier County, WV. The associatedequipment includes a 2 MVA transformer at each WTG tower, 34.5kV underground transmissionlines for the electrical collection system, a 34.5/138kV substation with a 200 MVA main transformerand service building, and a 138kv overhead transmission line for connection to the power grid.Figure 1 displays the wind turbine lines (A through J) overlaid on a map of the region.
Each GE Series 1.5sle wind turbine incorporates a horizontal-axis propeller that drives a gearbox andgenerator mounted to the top of an 80-m (260-ft) high tower. A nacelle for weather protection andnoise control encloses the gearbox and generator. The 77-m (250-ft) diameter rotor has three blades,which attach to a hub that contains active blade pitch control; this system provides for peakaerodynamic efficiency over a range of wind conditions. During routine operation, the rotationalspeed of the rotor will range from 10 to 20 revolutions per minute; and at wind speeds below 3.5 m/s(8 mph) and at wind speeds above 25 to 30 m/s (56 to 67 mph), it will not operate. The rated capacityof this unit is 1.5 MW at a wind speed of 12 m/s (27 mph). The WTGs include the following noisecontrol treatments into its design: impact noise insulation of the gearbox and generator, reduced-noisegearbox, reduced-noise nacelle; vibration isolation mounts, and quieted-design rotor blades.
The wind farm is located on the mountain ridges to the north of Rt. 60 and I-64 and south of theMonongahela National Forest, and to the west of Rt. 219, and to the east of Big Clear Creek. Lightlytraveled paved and unpaved roads cross this rural area, which is dotted with scattered homes and

Report No. 359R Acentech Incorporated
2
seasonal hunting cabins, and with several small groups of homes and churches in settlements such asDuo, Leonard, Cordova, Friar’s Hill, Trout, and Williamsburg. The substation will be constructed inthe center of the wind farm with the overhead transmission line running to the northwest from thesubstation out to the external power grid.
3. Guidelines for Noise Studies
The WVPSC Guidelines for Noise Studies for Siting Certificates include:
• Preconstruction – identify land uses and existing ambient sound levels (Ldn) in communitieswithin one mile of the facility.
• Construction – predict construction noise associated with blasting, earthmoving, pile driving,erection, traffic, and equipment installation at the nearest property boundary and within one mileand five miles from the facility. Identify noise sensitive areas within one mile and five miles ofthe facility. The noise sensitive areas include hospitals, schools, residences, cemeteries, parks,and churches. Describe construction equipment, procedure, and potential noise mitigationoptions.
• Operation – predict operation noise and identify land uses and type of structures (residential,commercial, or industrial) within one mile of the facility. Describe equipment and procedures tomitigate potential noise.
Information on the preconstruction ambient, construction, and operation sounds for the facility arepresented in the following sections. Please refer to “Appendix A - Sound in Lay Terms” for a usefuloverview of sound and its measurement.
4. Preconstruction Ambient Sound Measurements
Figure 2 is a map of the project area with an overlay of the proposed turbine sites, land useclassifications, the community sound measurement locations, and the measured day-night soundlevels (Ldn). Table 1 describes the six monitoring locations selected for the ambient survey thatAcentech conducted over a nominal one-week period in late September to early October 2005. Theacoustic environment and nearby land uses were observed at these locations, and they were judgedrepresentative of those at the noise sensitive receptors, such as residences and churches, in thecommunity bordering the project site.

Report No. 359R Acentech Incorporated
3
The weather during the survey was seasonal and ranged from clear to cloudy skies with some rainearly in the survey, calm to windy conditions, and temperatures from about 70ºF during the day downto about 50ºF at night. As Table 1 notes, most of the monitoring locations are near homes or smallgroups of homes and seasonal hunting cabins; and the locations range from 900 ft. (seasonal huntingcabins) to 3200 ft.* and 7800 ft. (year-round homes) from the nearest WTG location. The purpose ofthe survey was to characterize the existing land uses, sound sources, acoustic environment, andspecifically, representative long-term Ldn values in the area. Figures 3 through 12 displayphotographs of the six locations where the A-weighted sound levels were monitored continuouslyduring the survey. The field team also collected short-term measurements and observations duringvisits to each monitoring location. The observed sources typically included wind in trees, localtraffic, birds, insects, aircraft, and a flowing creek. The results of these supplemental short-termmeasurements will be maintained in our project files. Table 2 lists the instruments that wereemployed for the ambient survey.
Figures 13 through 18 display the variations in sound levels that were measured at the six locations.To address the WVPSC Noise Guidelines for Noise Studies, the figures show the Leq sound level foreach hour, and also, indicate the Ldn sound level for the nominal one-week period. As mentionedabove, Appendix A provides an overview on sound and its measurement, and in particular, discussesthe Leq and Ldn descriptors. Please note that Leq sound levels include both the steady backgroundsounds (steady wind in trees or rushing stream) and the short-term intrusive sounds (e.g., bird chirpsor local car passby). Of most significance, the data indicate that the long-term Ldn sound levelsranged from 49 dBA to 52 dBA, with an average value of 50 dBA and a standard deviation of 1.5dBA across the six locations. Table 3 lists the long-term Ldn values measured at each location. Themeasured Ldn values, sound source types, and land uses are relatively uniform across the one-milebuffer area, and the study area contains no dominant existing sound sources that would generatesound contours, for example, a factory or a well-traveled Interstate highway. Therefore, the ambientsound level contours are flat within this area so that no individual contours are shown on Fig. 2, butinstead, individual measured Ldn values are given.
* Homeowners in Little Beech Knob area (Location 2) to participate in project; otherwise, approximate distance to nearest WTG would be one mile.
Report No. 359R Acentech Incorporated
4
5. Construction Noise Estimates and Mitigation Measures
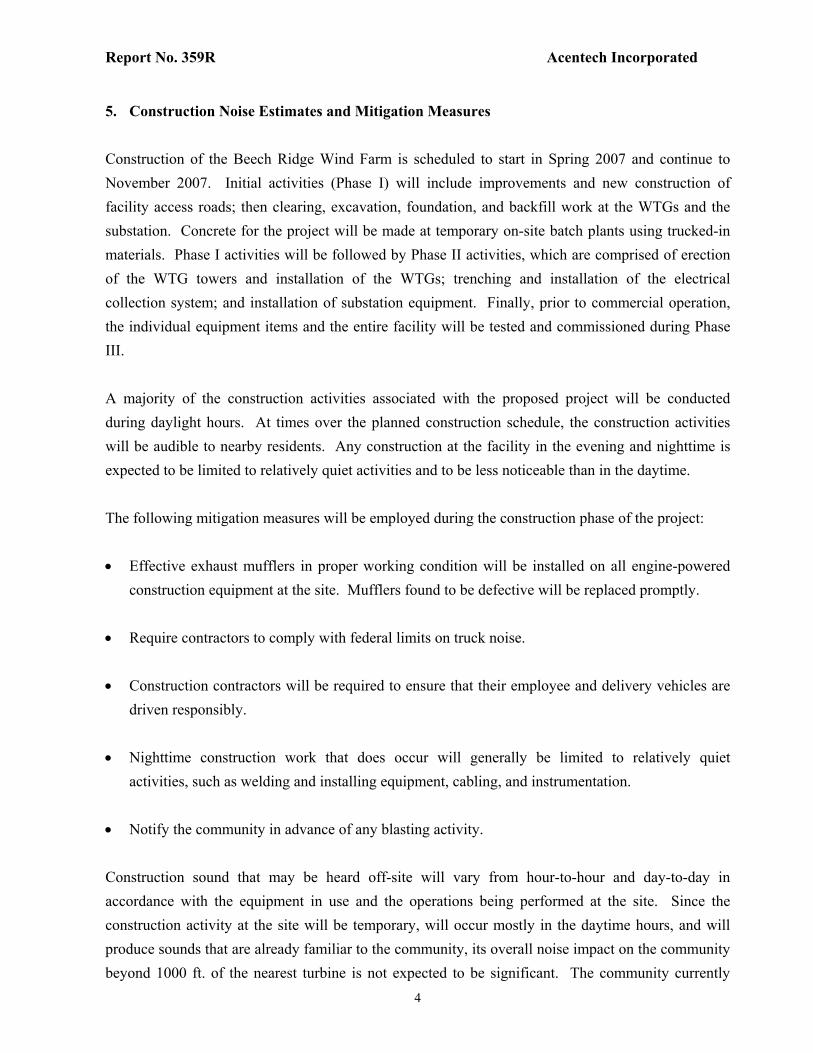
Construction of the Beech Ridge Wind Farm is scheduled to start in Spring 2007 and continue toNovember 2007. Initial activities (Phase I) will include improvements and new construction offacility access roads; then clearing, excavation, foundation, and backfill work at the WTGs and thesubstation. Concrete for the project will be made at temporary on-site batch plants using trucked-inmaterials. Phase I activities will be followed by Phase II activities, which are comprised of erectionof the WTG towers and installation of the WTGs; trenching and installation of the electricalcollection system; and installation of substation equipment. Finally, prior to commercial operation,the individual equipment items and the entire facility will be tested and commissioned during PhaseIII.
A majority of the construction activities associated with the proposed project will be conductedduring daylight hours. At times over the planned construction schedule, the construction activitieswill be audible to nearby residents. Any construction at the facility in the evening and nighttime isexpected to be limited to relatively quiet activities and to be less noticeable than in the daytime.
The following mitigation measures will be employed during the construction phase of the project:
• Effective exhaust mufflers in proper working condition will be installed on all engine-poweredconstruction equipment at the site. Mufflers found to be defective will be replaced promptly.
• Require contractors to comply with federal limits on truck noise.
• Construction contractors will be required to ensure that their employee and delivery vehicles aredriven responsibly.
• Nighttime construction work that does occur will generally be limited to relatively quietactivities, such as welding and installing equipment, cabling, and instrumentation.
• Notify the community in advance of any blasting activity.
Construction sound that may be heard off-site will vary from hour-to-hour and day-to-day inaccordance with the equipment in use and the operations being performed at the site. Since theconstruction activity at the site will be temporary, will occur mostly in the daytime hours, and willproduce sounds that are already familiar to the community, its overall noise impact on the communitybeyond 1000 ft. of the nearest turbine is not expected to be significant. The community currently
Report No. 359R Acentech Incorporated
5
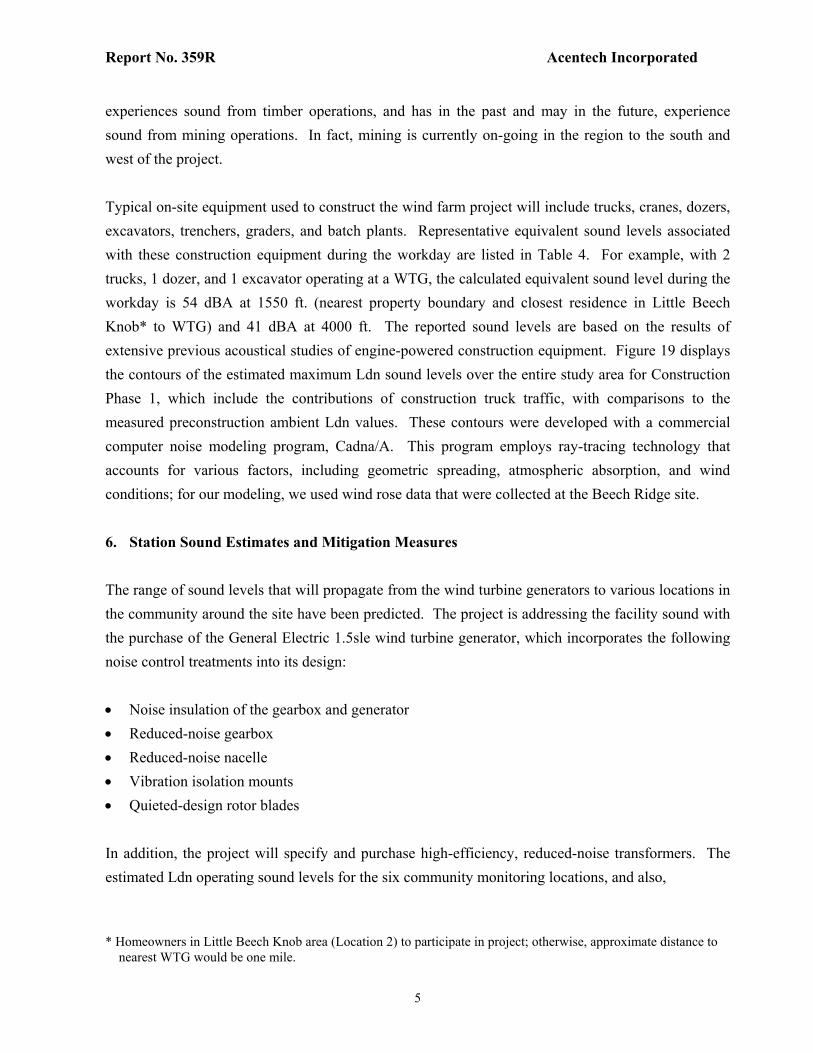
experiences sound from timber operations, and has in the past and may in the future, experiencesound from mining operations. In fact, mining is currently on-going in the region to the south andwest of the project.
Typical on-site equipment used to construct the wind farm project will include trucks, cranes, dozers,excavators, trenchers, graders, and batch plants. Representative equivalent sound levels associatedwith these construction equipment during the workday are listed in Table 4. For example, with 2trucks, 1 dozer, and 1 excavator operating at a WTG, the calculated equivalent sound level during theworkday is 54 dBA at 1550 ft. (nearest property boundary and closest residence in Little BeechKnob* to WTG) and 41 dBA at 4000 ft. The reported sound levels are based on the results ofextensive previous acoustical studies of engine-powered construction equipment. Figure 19 displaysthe contours of the estimated maximum Ldn sound levels over the entire study area for ConstructionPhase 1, which include the contributions of construction truck traffic, with comparisons to themeasured preconstruction ambient Ldn values. These contours were developed with a commercialcomputer noise modeling program, Cadna/A. This program employs ray-tracing technology thataccounts for various factors, including geometric spreading, atmospheric absorption, and windconditions; for our modeling, we used wind rose data that were collected at the Beech Ridge site.
6. Station Sound Estimates and Mitigation Measures
The range of sound levels that will propagate from the wind turbine generators to various locations inthe community around the site have been predicted. The project is addressing the facility sound withthe purchase of the General Electric 1.5sle wind turbine generator, which incorporates the followingnoise control treatments into its design:
• Noise insulation of the gearbox and generator• Reduced-noise gearbox• Reduced-noise nacelle• Vibration isolation mounts• Quieted-design rotor blades
In addition, the project will specify and purchase high-efficiency, reduced-noise transformers. Theestimated Ldn operating sound levels for the six community monitoring locations, and also,
* Homeowners in Little Beech Knob area (Location 2) to participate in project; otherwise, approximate distance to nearest WTG would be one mile.

Report No. 359R Acentech Incorporated
6
Friars Hill, Trout, and Williamsburg, are listed in Table 5. Of added note, Figures 20 and 21 (withoutand with land use classifications, respectively) display the Ldn sound contours for the operatingfacility. The estimated Ldn values and contours for the operating phase were developed with thecomputer noise modeling program, Cadna/A. The estimated values at the community monitoringlocations with year-round residences for the wind farm Ldn sound levels range from 17 dBA to 41dBA*, which compare to the measured preconstruction ambient values of 49 dBA to 52 dBA. Thefacility sound estimates assume maximum sound output of all 124 wind turbine generators, whichoccurs under conditions of maximum rated wind speed (27 mph). Under conditions of reduced windspeeds, the background sound associated with wind in trees would be less; however, the WTG soundemissions would also be less.
The project sound levels are estimated on a time-weighted basis (Ldn) for outdoor locations; forindoor locations, these levels would be reduced by 12 dBA with the windows open and by 24 dBA ormore with the windows closed. Although we judge that the wind farm may be heard at times in thecommunity at distances of 4000 ft. from the project, our measurements and estimates indicate that thelong-term Ldn sound levels of the wind farm will be significantly less than the existing ambient Ldnlevels at that distance for both outdoor and indoor locations.
7. Noise Impact Assessment
As noted in Section 5, the majority of the construction activities associated with the project will beconducted during the daylight hours, and it will vary over time, depending on the equipment in useand the operations being performed at the site. The temporary noise associated with construction ofthe project will be similar to the noise produced during excavation, grading, and steel erectionactivities at many other mid-size building projects, and the current timber and mining activities in theregion.
The project will be available to operate 24-hours per day and seven days per week. It is expected thatroutine operation will produce day-night sound levels in the community that are similar to or lowerthan the measured existing ambient day-night sound levels.
Community residents at 4000 ft. from the project may at times hear sounds associated withconstruction or operation of the project, but the overall impact is not expected to be significant ateither outdoor or indoor locations.
* Homeowners in Little Beech Knob area (Location 2) to participate in project; otherwise, wind farm Ldn sound levels would range up to 39 dBA at year-round community residences in the vicinity of the project.

Report No. 359R Acentech Incorporated
7

Report No. 359R Acentech Incorporated
8
1
5
6
4
3
2
NotesMeasured Ldn sound levels, sound sources, and landuses were relatively uniform within the one-mile bufferzone, resulting in a flat ambient sound contour for thearea.
Number of residential structures within 1-mile buffer atLittle Beech Knob – 10; Leonard-Cordova – 10; southof B-turbines – 4; Duo – 29; and hunting camp – 15.

Report No. 359R Acentech Incorporated
9
Figure 3. View of Location 1 (Town of Duo).
Figure 4. View of Church near Location 1 (Town of Duo).

Report No. 359R Acentech Incorporated
10
Figure 5. View of Location 2 (Little Beech Knob).
Figure 6. Close-in View of Location 2 (Little Beech Knob).

Report No. 359R Acentech Incorporated
11
Figure 7. View of Location 3 (Hunting Cabins).
Figure 8. View of Cabin near Location 3 (Hunting Cabins).

Report No. 359R Acentech Incorporated
12
Figure 9. View of Location 4 (Home South of B Turbine Line).
Figure 10. View of Location 5 (Flynn’s Creek).

Report No. 359R Acentech Incorporated
13
Figure 11. View of Location 6 (Leonard/Cordova).
Figure 12. View of Road near Location 6 (Leonard/Cordova).(short-term measurement taken at road without traffic; long-term monitoring performed away from road)

Report No. 359R Acentech Incorporated
14
Figure 13. Hourly Leq A-Weighted Existing Ambient Sound Levels Measured atLocation 1 (Town of Duo) during 27 September – 5 October 2005.
0
10
20
30
40
50
60
70
80
9/27/20050:00
9/28/20050:00
9/29/20050:00
9/30/20050:00
10/1/20050:00
10/2/20050:00
10/3/20050:00
10/4/20050:00
10/5/20050:00
10/6/20050:00
Date and Time
A-W
eigh
ted
Soun
d Le
vel (
dBA
)
Invenergy WV Wind Farm - Location 1One-Week Monitoring Ldn = 48.8 dBA
Tue. Wed. Thur. Fri. Sat. Sun. Mon. Tue. Wed.
Report No. 359R Acentech Incorporated
15
Figure 14. Hourly Leq A-Weighted Existing Ambient Sound Levels Measured atLocation 2 (Little Beech Knob) during 27 September – 5 October 2005.
0
10
20
30
40
50
60
70
80
9/27/20050:00
9/28/20050:00
9/29/20050:00
9/30/20050:00
10/1/20050:00
10/2/20050:00
10/3/20050:00
10/4/20050:00
10/5/20050:00
10/6/20050:00
Date and Time
A-W
eigh
ted
Soun
d Le
vel (
dBA
)
Invenergy WV Wind Farm - Location 2One-Week Monitoring Ldn = 50.8 dBA
Tue. Wed. Thur. Fri. Sat. Sun. Mon. Tue. Wed.

Report No. 359R Acentech Incorporated
16
Figure 15. Hourly Leq A-Weighted Existing Ambient Sound Levels Measured atLocation 3 (Hunting Cabins) during 27 September – 5 October 2005.
0
10
20
30
40
50
60
70
80
9/27/20050:00
9/28/20050:00
9/29/20050:00
9/30/20050:00
10/1/20050:00
10/2/20050:00
10/3/20050:00
10/4/20050:00
10/5/20050:00
10/6/20050:00
Date and Time
A-W
eigh
ted
Soun
d Le
vel (
dBA
)
Invenergy WV Wind Farm - Location 3One-Week Monitoring Ldn = 51.0 dBA
Tue. Wed. Thur. Fri. Sat. Sun. Mon. Tue. Wed.

Report No. 359R Acentech Incorporated
17
Figure 16. Hourly Leq A-Weighted Existing Ambient Sound Levels Measured atLocation 4 (Home South of B-Turbine Line) during 27 September – 5 October 2005.
0
10
20
30
40
50
60
70
80
9/27/20050:00
9/28/20050:00
9/29/20050:00
9/30/20050:00
10/1/20050:00
10/2/20050:00
10/3/20050:00
10/4/20050:00
10/5/20050:00
10/6/20050:00
Date and Time
A-W
eigh
ted
Soun
d Le
vel (
dBA
)
Invenergy WV Wind Farm - Location 4One-Week Monitoring Ldn = 52.5 dBA
Tue. Wed. Thur. Fri. Sat. Sun. Mon. Tue. Wed.

Report No. 359R Acentech Incorporated
18
Figure 17. Hourly Leq A-Weighted Existing Ambient Sound Levels Measured atLocation 5 (Flynn’s Creek) during 27 September – 5 October 2005.
0
10
20
30
40
50
60
70
80
9/27/20050:00
9/28/20050:00
9/29/20050:00
9/30/20050:00
10/1/20050:00
10/2/20050:00
10/3/20050:00
10/4/20050:00
10/5/20050:00
10/6/20050:00
Date and Time
A-W
eigh
ted
Soun
d Le
vel (
dBA
)
Invenergy WV Wind Farm - Location 5One-Week Monitoring Ldn = 49.1 dBA
Tue. Wed. Thur. Fri. Sat. Sun. Mon. Tue. Wed.

Report No. 359R Acentech Incorporated
19
Figure 18. Hourly Leq A-Weighted Existing Ambient Sound Levels Measured atLocation 6 (Leonard/Cordova) during 27 September – 5 October 2005.
0
10
20
30
40
50
60
70
80
9/27/20050:00
9/28/20050:00
9/29/20050:00
9/30/20050:00
10/1/20050:00
10/2/20050:00
10/3/20050:00
10/4/20050:00
10/5/20050:00
10/6/20050:00
Date and Time
A-W
eigh
ted
Soun
d Le
vel (
dBA
)
Invenergy WV Wind Farm - Location 6One-Week Monitoring Ldn = 48.7 dBA
Tue. Wed. Thur. Fri. Sat. Sun. Mon. Tue. Wed.
Report No. 359R Acentech Incorporated
20
1
5
4
3
2
6
NotesNumber of residential structures within 1-mile buffer at Little BeechKnob – 10; Leonard-Cordova – 10; south of B-turbines – 4; Duo – 29;and hunting camp – 15.
Contours of construction sound only, assuming construction at eachWTG simultaneously, and do not include contribution of ambientsound.
Numerous scattered residences are located in the general area fromLeonard through Williamsburg between the one-mile and five-mileperimeters, with fewer residences along roads in the other areas.

Report No. 359R Acentech Incorporated
21
2
6
5
4
3
1
49
NotesNumber of residential structures within 1-mile buffer at Little BeechKnob – 10; Leonard-Cordova – 10; south of B-turbines – 4; Duo – 29;and hunting camp – 15.
Contours of operation sound only and do not include contribution ofambient sound.
Land use classifications not shown on this figure for clarity; see Figure 21for Operation Sound Level Contours on map with land use classifications.

Report No. 359R Acentech Incorporated
22
2
6
5
4
3
1
NoteNumber of residential structures within 1-mile buffer at Little BeechKnob – 10; Leonard-Cordova – 10; south of B-turbines – 4; Duo – 29;and hunting camp – 15.
Contours of operation sound only and do not include contribution ofambient sound.

Report No. 359R Acentech Incorporated
23
Table 1.Description of Monitoring Locations for Preconstruction Ambient Sound Survey.
Location DescriptionApprox. Dist. (ft.)to Nearest WTG
1 – Town of Duo hamlet with several homes and small church 3600
2 – Little Beech Knob* few rural homes 3200
3 – Hunting Cabins group of seasonal hunting cabins 900
4 – Home South of B-Turbine Line
rural home 4100
5 – Flynn’s Creek scattered rural homes, farms, and church 7800
6 – Leonard/Cordova road between two small settlements 6000
* Homeowners in this area to participate in project; otherwise, approximate distance to nearest WTG would be one mile.

Report No. 359R Acentech Incorporated
24
Table 2.Type of Acoustic Instrumentation Used for Ambient Sound Survey during
27 September - 5 October 2005.
Instrument Type Manufacturer Model
Continuous Sound Level Monitors Rion NL-31 & NL-32
Preamplifiers Rion NH-21
1/2" Microphones Rion UC-53A
Calibrator Bruel & Kjaer 4231
Precision Sound Level Meterand Octave Band Analyzer Rion NA-27
Preamplifier Rion NH-20
1/2" Microphone Rion UC-53A
Calibrator Norsonic 1251

Report No. 359R Acentech Incorporated
25
Table 3.Summary of Monitoring Locations and Ldn Sound Levels (dBA) Measured during
Ambient Sound Survey (27 September - 5 October 2005).
GPS Reading Dist. to Nearest
WTG (ft.)
Ambient
Ldn*
Location
N W Elev. (ft.)
1 – Town of Duo 38° 04.361’ 80° 35.889’ 3444 3600 49
2 – Little Beech Knob** 38° 06.611’ 80° 35.343’ 3990 3200 51
3 – Hunting Cabins 38° 06.911’ 80° 29.196’ 3875 900 51
4 – Home South of B-Turbine Line
38° 02.608’ 80° 28.715’ 3170 4100 52
5 – Flynn’s Creek 38° 00.098’ 80° 31.169’ 2439 7800 49
6 – Leonard/Cordova 38° 04.562’ 80° 24.818’ 2470 6000 49
* Ldn measured over 186 hours at Locations 1 and 3 – 6; and measured over 157 hours at Location 2.
** Homeowners in this area to participate in project; otherwise, approximate distance to nearest WTG would be one mile.
Note that across the six locations, measured average Ldn of 50 dBA with a standard deviation of 1.6 dBA.

Report No. 359R Acentech Incorporated
26
Table 4.Estimated Equivalent Sound Levels (Leq*) of Representative Construction Equipment at
Various Distances.
Construction Sound Levels (dBA)
Equipment 1550 ft. † 4000 ft. 1 mile 5 miles
Phase I – Preparation &Foundation
Blasting 60** 47** 43** 14**
Pile Driving 59** 46** 42** 13**
Dozer 49 36 32 3
Excavator 50 37 33 4
Trencher 50 37 33 4
Grader 48 35 31 2
Roller 45 32 28 <0
Trucks 44 31 27 <0
Batch Plant 41 28 24 <0
Phase II – Erection &Installation
Trucks 44 31 27 <0
Crane 50 37 33 4
Phase III – Test &Commission
Trucks 44 31 27 <0
* Estimated Leq sound levels over a 10-hour daytime shift. 24-hr Ldn would be 4 dBA less than each Leq.
† Estimated sound levels at nearest property boundary and year-round community residence (closest residence in Little Beech Knob to WTG). Homeowners in this area to participate in project; otherwise, approximate distance to nearest WTG would be one mile. Estimated sound levels for a group of temporary residences closer to a WTG (Location 3 – seasonal hunting cabins) would be 6 dBA greater than these levels.
** Estimated values for blasting and pile driving are maximum (Lmax) sound levels, not Leq.
Reference: ESEERCO Power Plant Construction Noise Guide, BBN Report No. 3321, May 1977.

Report No. 359R Acentech Incorporated
27
Table 5.Comparison of Average Measured Ldn Sound Levels during
Ambient Sound Survey with Estimated Ldn Sound Levels for WTG Facility (dBA).
Dist. to Nearest
WTG (ft.)
Average Measured
Ambient Ldn
Estimated Facility
Operation - LdnLocation*
1 – Town of Duo 3600 49 39
2 – Little Beech Knob** 3200 51 41
3 – Hunting Cabins 900 51 52
4 – Home South of B-Turbine Line
4100 52 35
5 – Flynn’s Creek 7800 49 28
6 – Leonard/Cordova 6000 49 34
Trout 15,000 -- 30
Friars Hill 22,000 -- 25
Williamsburg 21,000 -- 17
* Comparisons provided for the actual sound monitoring locations; in some areas, residences are located closer to wind turbines.
** Homeowners in this area to participate in project; otherwise, approximate distance to nearest WTG would be one mile.

Report No. 359R Acentech Incorporated
A-1
Appendix A
Sound in Lay Terms
Sounds we hear come from small pressure oscillations, or sound waves, that travel through the airand actuate our hearing mechanism. These airborne pressure oscillations cause the eardrum andsmall bones of the middle ear to vibrate. These vibrations are transmitted to the fluid-filled cochleaof the inner ear's sensory organ. Sensory hair cells then transduce these vibrations into nerveimpulses that are transmitted to the brain where they are perceived and interpreted.
Noise is often defined as unwanted sound and the degree of disturbance or annoyance of an intrudingnoise depends on various factors including the magnitude and nature of the intruding noise, themagnitude of the background or ambient sound present without the intruding noise, and the nature ofthe activity of people in the area where the noise is heard. For example, people relaxing at homegenerally prefer a quiet environment, while factory employees may be accustomed to relatively highnoise levels when at work.
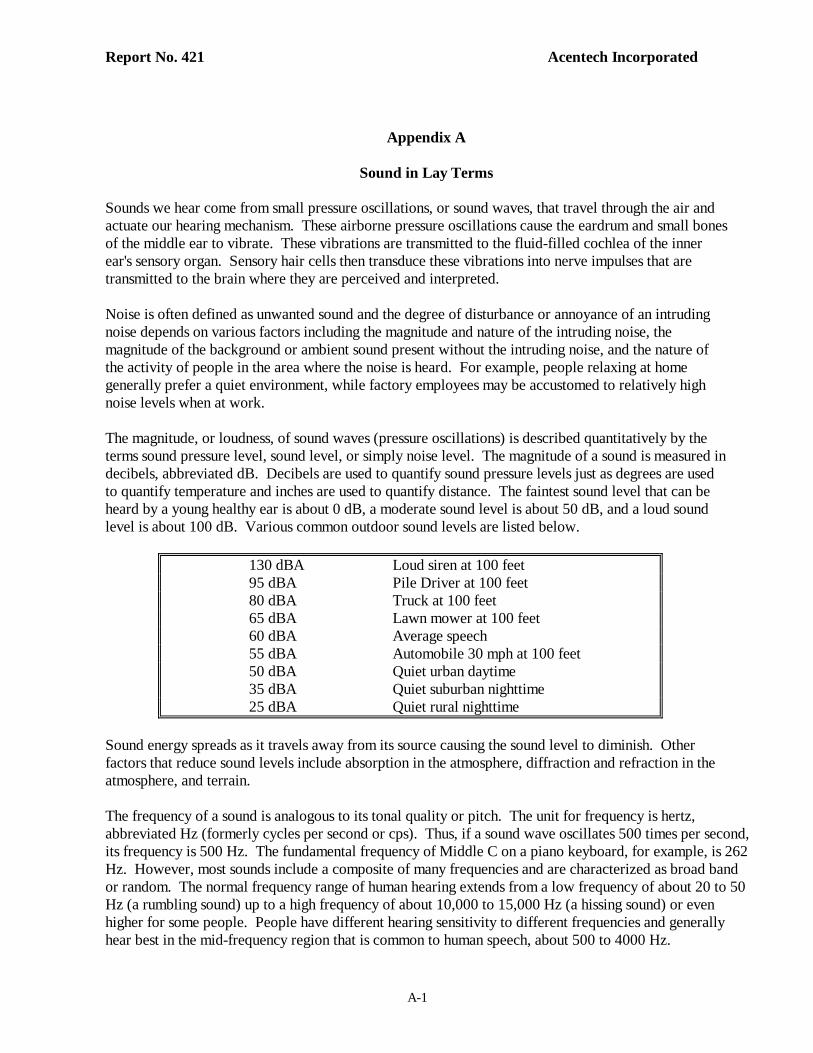
The magnitude, or loudness, of sound waves (pressure oscillations) is described quantitatively by theterms sound pressure level, sound level, or simply noise level. The magnitude of a sound ismeasured in decibels, abbreviated dB. Decibels are used to quantify sound pressure levels just asdegrees are used to quantify temperature and inches are used to quantify distance. The faintest soundlevel that can be heard by a young healthy ear is about 0 dB, a moderate sound level is about 50 dB,and a loud sound level is about 100 dB. Various common outdoor sound levels are listed below.
130 dBA Loud siren at 100 feet95 dBA Pile Driver at 100 feet80 dBA Truck at 100 feet65 dBA Lawn mower at 100 feet60 dBA Average speech55 dBA Automobile 30 mph at 100 feet50 dBA Quiet urban daytime35 dBA Quiet suburban nighttime25 dBA Quiet rural nighttime
Sound energy spreads as it travels away from its source causing the sound level to diminish. Otherfactors that reduce sound levels include absorption in the atmosphere, diffraction and refraction inthe atmosphere, and terrain.
The frequency of a sound is analogous to its tonal quality or pitch. The unit for frequency is hertz,abbreviated Hz (formerly cycles per second or cps). Thus, if a sound wave oscillates 500 times persecond, its frequency is 500 Hz. The fundamental frequency of Middle C on a piano keyboard, forexample, is 262 Hz. However, most sounds include a composite of many frequencies and arecharacterized as broad band or random. The normal frequency range of human hearing extends from alow frequency of about 20 to 50 Hz (a rumbling sound) up to a high frequency of about 10,000 to 15,000Hz (a hissing sound) or even higher for some people. People have different hearing sensitivity todifferent frequencies and generally hear best in the mid-frequency region that is common to humanspeech, about 500 to 4000 Hz.

Report No. 359R Acentech Incorporated
A-2
Appendix A Con’t.
Sound level meters are usually equipped with electronic filters or weighting circuits, such asspecified in standards ANSI S1.4 or IEC 651, for the purpose of simulating the frequency responsecharacteristics of the human ear. The A-weighting filter included with essentially all sound levelmeters is most commonly employed for this purpose because the measured sound level data correlatewell with subjective response to sounds. Sound levels measured using the A-weighting network aredesignated by dBA.
The background or ambient acoustic environment in most communities varies from place to placeand varies with time at any given location due to the composite of many nearby and distant soundsources. The ambient environment includes high sound level single-events such as the passby of anairplane or nearby car, the barking of a dog, thunder, or a siren. The ambient acoustic environmentalso includes relatively steady residual or background sounds caused by sources such as distanttraffic and ventilation equipment. The quantity of the single-event sounds and the amplitude of thebackground sounds are usually least during the late night hours from about midnight to 5:00 am.Indeed, the ambient sound level at a location is related to the amount of human activity in itsvicinity. The amplitude statistics of this rather complex acoustic environment are considered to benon-Gaussian (because of the presence of the lower-level residual background sounds) and non-stationary (because of diurnal and seasonal variations).
At any location, a complete physical description of the ambient acoustic environment might include itssound level at various frequencies, as a function of time. As a first step towards simplifying this multi-dimensional description, it has become common practice to eliminate the frequency variable bymeasuring the A-weighted sound level (dBA), as observed on a standard sound level meter. The A-weighting filter emphasizes the mid-frequency components of sounds to approximate the frequencyresponse of the human ear. A-weighted sound levels correlate well with our perception of most sounds.
To evaluate impacts and report time-varying ambient sound levels it is common practice, using the A-weighted scale, to measure the equivalent sound level and the day-night sound level. The equivalentsound level (Leq) is the level of a steady-state sound that has the same (equivalent) energy as the time-varying sound of interest, taken over a specified time period. Thus, the equivalent sound level is asingle-valued level that expresses the time-averaged total energy of the entire ambient sound energy. Itincludes both the high-level single event sounds and the relatively steady background sounds. The day-night sound level (Ldn) is simply the average equivalent sound for 24-hours after 10 dBA has beenadded to the nighttime sound levels from 10pm to 7am. Adding 10 dBA to the nighttime sound levelsaccounts for people’s expectations that nighttime be a quiet period. Both the equivalent sound level andthe day-night sound levels have been selected by the U.S. Environmental Protection Agency (USEPA) asthe best descriptors to use for the purpose of identifying and evaluating levels of environmental noise.EPA has identified an Ldn level of 55 dBA as protective of the health and welfare of humans. Inaddition, the Federal Energy Regulatory Commission (FERC) employs an Ldn level of 55 dBA as itscriterion during review of proposed projects.
As part of the application process, the West Virginia Public Service Commission (WVPSC) Guidelinesfor Noise Studies for Siting Certificates require a project to submit preconstruction ambient Ldn data andfacility operation Ldn estimates for review in addition to information on construction noise.

Acentech Report No. 421 Acoustical Study of Proposed Expansion/Modification of Beech Ridge Wind Farm Greenbrier County, WV July 2011 James D. Barnes Submitted by: Acentech Incorporated 33 Moulton Street Cambridge, MA 02138 Prepared for: Beech Ridge Energy II LLC c/o Invenergy LLC 51 Monroe Street, Suite 1604 Rockville, MD 20850

Report No. 421 Acentech Incorporated
ii
Table of Contents
Page
List of Figures and Tables ............................................................................................................. iii 1. Introduction .............................................................................................................................. 1 2. Description of Proposed Facility and Site ................................................................................ 1 3. Guidelines for Noise Studies ..................................................................................................... 2 4. Preconstruction Ambient Sound Measurements ........................................................................ 3 5. Construction Sound Estimates and Mitigation Measures ........................................................... 4 6. Operation Sound Estimates and Mitigation Measures ............................................................... 6 7. Noise Impact Assessment .......................................................................................................... 8 Appendix A – Sound in Lay Terms ............................................................................................. A-1

Report No. 421 Acentech Incorporated
iii
List of Figures and Tables Figure 1. Area Map with Proposed Beech Ridge Phase II Wind Farm Showing Turbine Locations
and One Mile and Five-Mile Buffer Zones. Figure 2. Area Map Showing Land Use Classifications with Community Sound Monitoring
Locations 1 through 4 and Average Measured Existing Ambient A-Weighted Day-Night Sound Levels (Ldn, dBA) during 4 – 15 February 2011 Sound Survey.
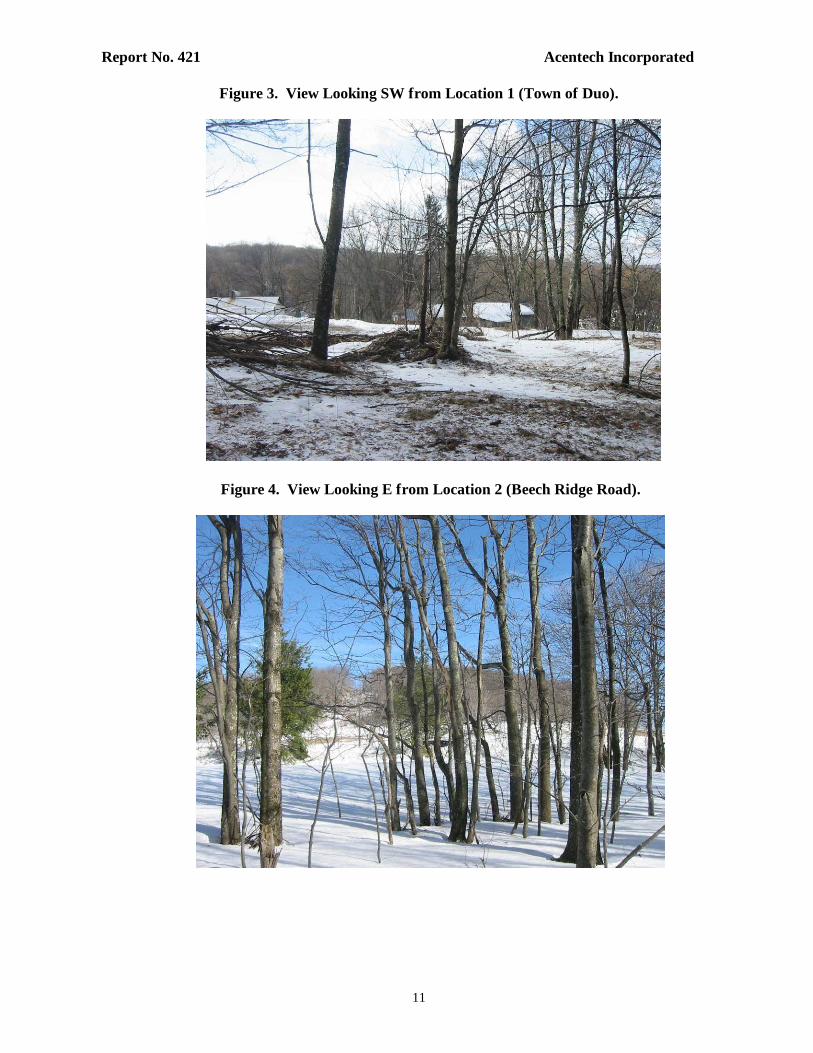
Figure 3. View Looking SW from Location 1 (Town of Duo). Figure 4. View Looking E from Location 2 (Beech Ridge Road). Figure 5. View Looking SE from Location 3 (NW of Project Site). Figure 6. View Looking NE from Location 4 (Town of Quinwood). Figure 7. Leq A-Weighted and C-Weighted Existing Ambient Sound Levels Measured at Location
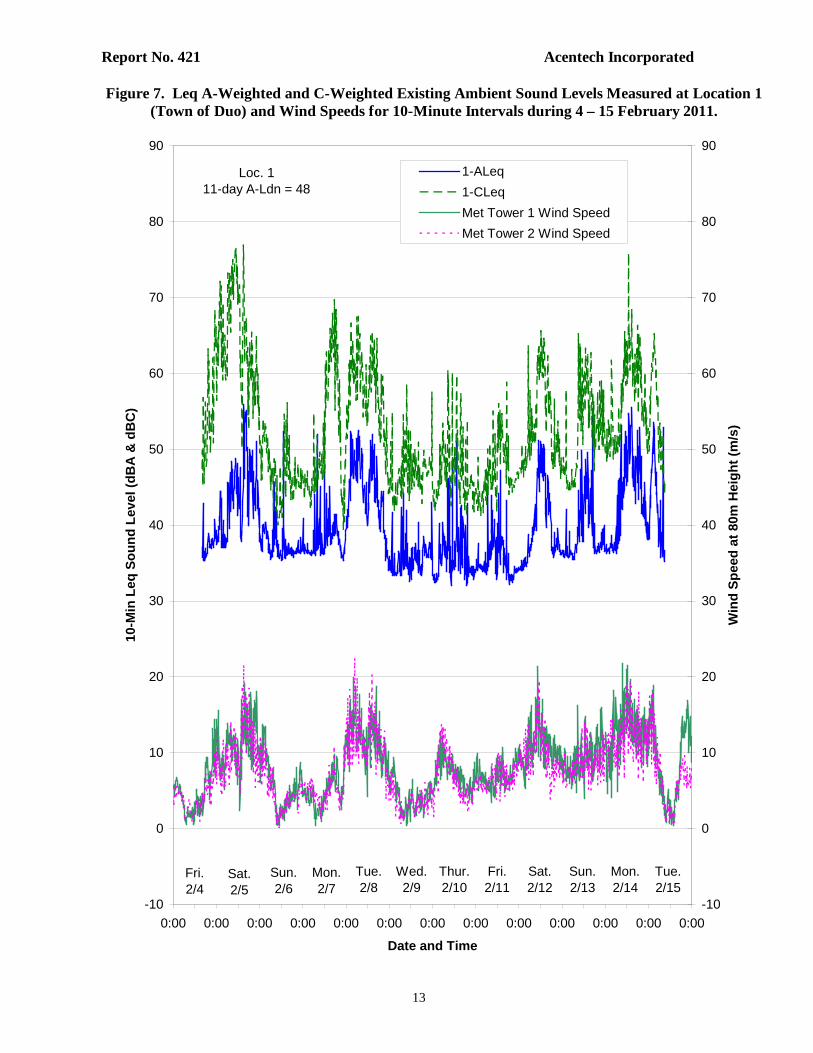
1 (Town of Duo) and Wind Speeds for 10-Minute Intervals during 4 – 15 February 2011. Figure 8. Leq A-Weighted and C-Weighted Existing Ambient Sound Levels Measured at Location
2 (Beech Ridge Road) and Wind Speeds for 10-Minute Intervals during 4 – 15 February 2011.
Figure 9. Leq A-Weighted and C-Weighted Existing Ambient Sound Levels Measured at Location
3 (NW of Project Site) and Wind Speeds for 10-Minute Intervals during 4 – 15 February 2011.
Figure 10. Leq A-Weighted and C-Weighted Existing Ambient Sound Levels Measured at Location
4 (Town of Quinwood) and Wind Speeds for 10-Minute Intervals during 4 – 15 February 2011.
Figure 11. Area Map of Proposed Expansion of Beech Ridge Wind Farm with Estimated
Construction A-Weighted Ldn Sound Level Contours Compared to Average Measured Existing Ambient A-Weighted Ldn Sound Levels (dBA) at Locations 1 to 4.
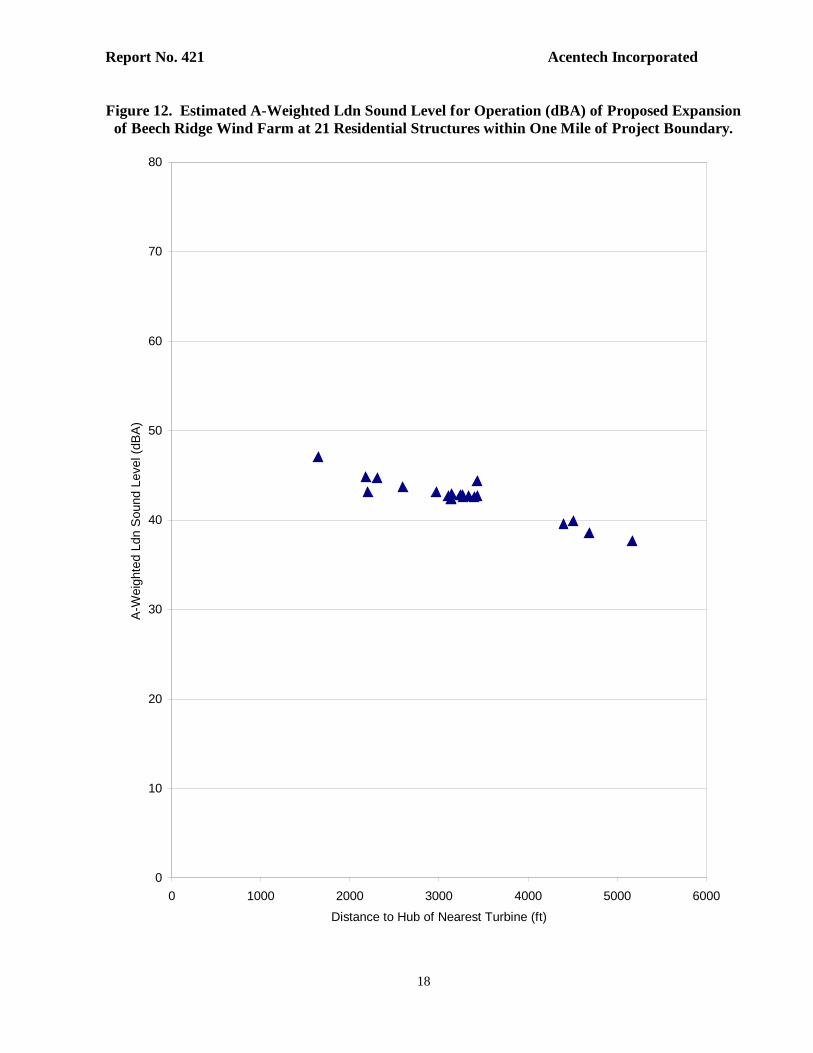
Figure 12. Estimated A-Weighted Ldn Sound Level for Operation (dBA) of Proposed Expansion of
Beech Ridge Wind Farm at 21 Residential Structures within One Mile of Project Boundary.
Figure 13. Area Map of Proposed Expansion of Beech Ridge Wind Farm with Estimated Operation
A-Weighted Ldn Sound Level Contours Compared to Average Measured Existing Ambient A-Weighted Ldn Sound Levels (dBA) at Locations 1 to 4.
List of Figures and Tables Con’t.

Report No. 421 Acentech Incorporated
iv
Figure 14. Area Map of Proposed Expansion of Beech Ridge Wind Farm Showing Land Use Classifications with Estimated Operation A-Weighted Ldn Sound Level Contours Compared to Average Measured Existing Ambient A-Weighted Ldn Sound Levels (dBA) at Locations 1 to 4.
Figure 15. Estimated C-Weighted Ldn Sound Level for Operation (dBC) of Proposed Expansion of
Beech Ridge Wind Farm at 21 Residential Structures within One Mile of Project Boundary.
Figure 16. Area Map of Proposed Expansion of Beech Ridge Wind Farm with Estimated Operation
C-Weighted Ldn Sound Level Contours Compared to Average Measured Existing Ambient C-Weighted Ldn Sound Levels (dBC) at Locations 1 to 4.
************* Table 1. Description of Monitoring Locations for Preconstruction Ambient Sound Survey (4 - 15
February 2011). Table 2. Type of Acoustic Instrumentation Used for Ambient Sound Survey (4 - 15 February
2011). Table 3. Summary of Monitoring Locations and Ldn Sound Levels (dBA) Measured during
Ambient Sound Survey (4 - 15 February 2011). Table 4. Estimated Equivalent Sound Levels (Leq*) of Representative Construction Equipment at
Various Distances. Table 5. Comparison of Average Measured A-Weighted Ldn Sound Levels during Ambient Sound
Survey with Estimated A-Weighted Ldn Sound Levels for WTG Facility (dBA). Table 6. Comparison of Average Measured C-Weighted Ldn Sound Levels during Ambient Sound
Survey with Estimated C-Weighted Ldn Sound Levels for WTG Facility (dBC). Table 7. Estimated A-Weighted and C-Weighted Ldn Sound Levels (dBA and dBC) for WTG
Facility at Residential Structures within One Mile of Expansion Area.

Report No. 421 Acentech Incorporated
1
1. Introduction Beech Ridge Energy LLC has successfully designed, certificated, and constructed a portion of a large-scale wind farm in Greenbrier County, West Virginia consisting of 67 turbines and 100 MW of turbine capacity at a mountainous rural site in the southeast portion of the state. Beech Ridge Energy LLC successfully operates these 67 turbines and now proposes to continue construction of the certificated facility to the west by installing up to 85.5 MW of turbine capacity. At the request of Beech Ridge Energy LLC, Acentech Incorporated has performed an acoustical study of the expansion area and provided information for review by the West Virginia Public Service Commission (WVPSC) for the site permitting process. Acentech has to date reviewed the facility and site drawings, equipment information, and the noise study guidelines of the WVPSC; toured the project area; conducted sound measurements and observations of the existing ambient conditions at representative community locations; and estimated construction and operation sound levels for the facility. This report presents the ambient sound measurements and results of our acoustical study. 2. Description of Proposed Facility and Site The proposed expansion consists of up to 33 General Electric (GE) Model 1.6xle-100 wind turbine generators (WTGs) and associated equipment, with each WTG including its 100-meter diameter rotor to be mounted on individual 100-meter tall towers across about 8 square miles of ridgelines in Greenbrier County, WV. The associated equipment includes a 2 MVA transformer at each WTG tower, and 34.5kV underground transmission lines for the electrical collection system that will connect into the existing 34.5/138kV substation with a 200 MVA main transformer and 138kv overhead transmission line or supplemental substation/transmission line that would connect to the existing project related transmission line. The service center for the existing portion of the wind farm, which is located in the northern section of the proposed expansion area, will also serve the expanded facility. Figure 1 displays the proposed new wind turbines overlaid on a map of the region. The study evaluated 47 potential locations for the 33 turbines, and therefore, included 14 alternate locations. Each GE Model 1.6xle-100 wind turbine incorporates a horizontal-axis propeller that drives a gearbox and generator mounted to the top of a 100-m (328-ft) high tower. A nacelle for weather protection and noise control encloses the gearbox and generator. The 100-m (328-ft) diameter rotor has three blades, which attach to a hub that contains active blade pitch control; this system provides for peak aerodynamic efficiency over a range of wind conditions. During routine operation, the rotational speed of the rotor will range from 9.75 to 16.18 revolutions per minute; and at wind speeds below 3 m/s (6.7 mph) and at wind speeds above 25 to 30 m/s (56 to 67 mph), it will not operate. The rated capacity of

Report No. 421 Acentech Incorporated
2
this unit is 1.6 MW at a wind speed of 11 m/s (24 mph). The WTGs include the following noise control treatments into its design: impact noise insulation of the gearbox and generator, reduced-noise gearbox, reduced-noise nacelle; vibration isolation mounts, and quieted-design rotor blades. The existing wind farm and proposed area are located on the mountain ridges to the north of US Rt. 60 and I-64 and south of the Monongahela National Forest, and to the west of Rt. 219, and to the east of WV Rt. 20. Lightly traveled paved and unpaved roads cross this rural area, which is dotted with scattered homes and seasonal hunting cabins, and with several small groups of homes in settlements such as Duo. The existing substation is located to the east of the proposed expansion area and in the center of the existing wind farm with the overhead transmission line running to the northwest from the substation out to the external power grid. 3. Guidelines for Noise Studies The WVPSC Guidelines for Noise Studies for Siting Certificates include: • Preconstruction – identify land uses and existing ambient sound levels (Ldn) in communities within
one mile of the facility. • Construction – predict construction noise associated with blasting, earthmoving, pile driving,
erection, traffic, and equipment installation at the nearest property boundary and within one mile and five miles from the facility. Identify noise sensitive areas within one mile and five miles of the facility. The noise sensitive areas include hospitals, schools, residences, cemeteries, parks, and churches. Describe construction equipment, procedure, and potential noise mitigation options.
• Operation – predict operation noise and identify land uses and type of structures (residential,
commercial, or industrial) within one mile of the facility. Describe equipment and procedures to mitigate potential noise.
Information on the preconstruction ambient, construction, and operation sounds for the facility are presented in the following sections. Please refer to “Appendix A - Sound in Lay Terms” for a useful overview of sound and its measurement.

Report No. 421 Acentech Incorporated
3
4. Preconstruction Ambient Sound Measurements Figure 2 is a map of the project area with an overlay of the proposed turbine sites, land use classifications, the community sound measurement locations, and the measured day-night sound levels (Ldn). Table 1 describes the four monitoring locations selected for the ambient survey that Acentech conducted over a nominal one-week period in the first half of February 2011. The acoustic environment and nearby land uses were observed at these locations, and they were judged representative of those at the noise sensitive receptors, such as residences and churches, in the community bordering the expansion site. The weather during the survey was seasonal and ranged from clear to cloudy skies with very little snow, calm to windy conditions, and temperatures from about 0ºF to 15ºF during the first half of the survey, and warming to 30ºF to 40ºF near the end of the survey. As Table 1 notes, most of the monitoring locations are in close proximity to nearby homes/seasonal residences or small groups of homes, and the monitoring locations range from 1600 ft. to 10,600 ft. from the nearest proposed new WTG location. The monitoring location in the Town of Duo that is 10,600 ft. from the nearest proposed new WTG is also 3600 ft. from the nearest existing operating wind turbine. The purpose of the ambient survey was to characterize the existing land uses, sound sources, acoustic environment, and specifically, representative long-term Ldn values in the area. Figures 3 through 6 display photographs of the four locations where the A-weighted sound levels were monitored continuously during the survey. The field team also collected short-term measurements and observations during visits to each monitoring location. The observed sources typically included wind in trees, local and distant traffic, dogs, birds, aircraft, distant mining industry, and a flowing creek. The sound of the existing wind facility was observed at the Town of Duo location during one visit before the local wind speed picked up and the associated sound of wind in the trees masked the turbine sound; in general, the wind was from the southwest and the Duo location was typically crosswind/downwind of the nearest turbines at the time. The average sound levels at the Duo location ranged from 41 dBA to 43 dBA during the time when the wind facility sound was observed, and although the nearest turbines could be heard at times, the field team judged that turbine sound did not significantly influence the average sound levels. As the ambient data below indicate, the long-term Ldn sound level at the Duo location was similar to the Ldn levels measured at the three other community monitoring locations that are much farther from the existing wind facility. Table 2 lists the instruments that were employed for the ambient survey. Figures 6 through 9 display the variations in sound levels that were measured at the four locations. To address the WVPSC Noise Guidelines for Noise Studies, the figures show the Leq sound level for each

Report No. 421 Acentech Incorporated
4
10-minute interval, and also, indicate the Ldn sound level for the nominal one-week period. The figures, in addition, present the wind speeds for each 10-minute interval that were measured at the two nearby meteorological towers operated by Beech Ridge Energy LLC . As mentioned above, Appendix A provides an overview on sound and its measurement, and in particular, discusses the Leq and Ldn descriptors. Please note that Leq sound levels include both the steady background sounds (steady wind in trees, rushing stream, or distant industry) and the short-term intrusive sounds (e.g., dog barks or local car passby). Table 3 lists the long-term Ldn values measured at each location. Of most significance, the data indicate that the long-term Ldn sound levels ranged from 47 dBA to 50 dBA, with an average value of 48 dBA and a standard deviation of 1 dBA across the four locations. The measured Ldn values, sound source types, and land uses are relatively uniform across the study area and the ambient sound level contours are judged to be generally flat within this area. Therefore, Fig. 2 displays the individual measured Ldn values, but no individual contours. 5. Construction Noise Estimates and Mitigation Measures Initial construction activities (Construction Phase I) will include improvements and new construction of facility access roads; then clearing, excavation, foundation, and backfill work at the WTGs and the substation. Concrete for the project will be made at temporary on-site batch plants using trucked-in materials. Phase I activities will be followed by Phase II activities, which are comprised of erection of the WTG towers and installation of the WTGs; trenching and installation of the electrical collection system; and installation of substation equipment. Finally, prior to commercial operation, the individual equipment items and the entire facility will be tested and commissioned during Phase III. A majority of the construction activities associated with the proposed project will be conducted during daylight hours. At times over the planned construction schedule, the construction activities will be audible to nearby residents. Any construction at the facility in the evening and nighttime is expected to be limited to relatively quiet activities and to be less noticeable than in the daytime. The following mitigation measures will be employed during the construction phase of the project: • Effective exhaust mufflers in proper working condition will be installed on all engine-powered
construction equipment at the site. Mufflers found to be defective will be replaced promptly. • Require contractors to comply with federal limits on truck noise.

Report No. 421 Acentech Incorporated
5
• Construction contractors will be required to ensure that their employee and delivery vehicles are driven responsibly.
• Nighttime construction work that does occur will generally be limited to relatively quiet activities,
such as welding and installing equipment, cabling, and instrumentation. • If blasting is required, it will be conducted in accordance with standard industrial practices and
include those requirements established by the WVPSC in its original approved siting certificate for the Beech Ridge Facility with the overall goal of reducing potential impacts to nearby residents.
Construction sound that may be heard off-site will vary from hour-to-hour and day-to-day in accordance with the equipment in use and the operations being performed at the site. Since the construction activity at the site will be temporary, will occur mostly in the daytime hours, and will produce sounds that are already familiar to the community, its overall noise impact on the community beyond 1000 ft. of the nearest turbine is not expected to be significant. Note that the community currently experiences sound from timber and mining operations. Typical on-site equipment used to construct the wind farm project will include trucks, cranes, dozers, excavators, trenchers, graders, and batch plants. Representative equivalent sound levels associated with these construction items during the workday are listed in Table 4. For example, with 2 trucks, 1 dozer, and 1 excavator operating at a WTG, the calculated equivalent sound level during the workday is 53 dBA at 1640 ft. (e.g., residential structure B-23 in Table 7) and 44 dBA at 3330 ft. (e.g., residential structure GB-0125) from a proposed new turbine. The reported sound levels are based on the results of extensive previous acoustical studies of engine-powered construction equipment. Figure 11 displays the contours of the estimated maximum Ldn sound levels over the entire study area for Construction Phase 1, with comparisons to the measured preconstruction ambient Ldn values. The sound estimates for the expansion study assume construction activity at all 47 potential turbine locations, although only 33 turbines will be constructed. These contours were developed with a commercial computer noise modeling program, Cadna/A. This program employs ray-tracing technology that accounts for various factors, including geometric spreading, atmospheric absorption, and ground conditions; for the purpose of our modeling, we have assumed that the community is always downwind from the project equipment. 6. Station Sound Estimates and Mitigation Measures

Report No. 421 Acentech Incorporated
6
The range of sound levels that will propagate from the wind turbine generators to various locations in the community around the site has been predicted. The project is addressing the facility sound with the purchase of the General Electric 1.6xle-100 wind turbine generator, which incorporates the following noise control treatments into its design: • Noise insulation of the gearbox and generator • Reduced-noise gearbox • Reduced-noise nacelle • Vibration isolation mounts • Quieted-design rotor blades In addition, the project will specify and purchase high-efficiency, reduced-noise transformers. The estimated A-weighted Ldn operating sound levels for the four community monitoring locations are listed in Table 5; and for the 21 residential structures within one mile of the project, the estimates are shown in Table 7 and plotted versus distance to the nearest WTG on Fig. 12. Of added note, Figs. 13 and 14 (respectively, without and with land use classifications) display the A-weighted Ldn sound contours for operation of the proposed facility expansion. Similar to the estimated construction noise values, the estimated Ldn values and contours for the operating phase were developed with the computer noise modeling program, Cadna/A. Measurements and observations made by the field team in February 2011 along Cold Knob Road about one mile east of the existing A-line turbines during a time with favorable turbine operating, background sound, and sound propagation conditions, support the Cadna modeling procedure. The estimated values for the wind farm Ldn sound levels range at the community monitoring locations from 33 dBA to 47 dBA and at the 21 residential structures within one mile of the project from 38 dBA to 47 dBA, which compare to the measured range of preconstruction ambient Ldn values of 47 dBA to 50 dBA. The facility sound estimates assume maximum sound output of all wind turbine generators at 47 potential locations, which occurs under conditions of maximum rated wind speed [11 m/s (24 mph) to cutout]. As previously noted, the study evaluated all 47 potential locations for the turbines although only 33 turbines will be installed as part of the expansion phase. Under conditions of reduced wind speeds, the background sound associated with wind in trees would be less; however, the WTG sound emissions would also be less. The project sound levels are estimated on a time-weighted basis (Ldn) for outdoor locations; for indoor locations, these levels would be reduced by 12 dBA with the windows open and by 24 dBA or more with the windows closed. We anticipate that the wind farm will be heard at times in the community at distances of 1600 ft. from the project, however, ambient sounds will provide useful masking of the turbine sound and our measurements and estimates indicate that the long-term Ldn sound levels of the

Report No. 421 Acentech Incorporated
7
wind farm will be similar or less than the existing ambient Ldn levels at that distance for both outdoor and indoor locations. And at greater distances, the long-term Ldn sound levels of the wind farm are estimated to be significantly less than the existing ambient Ldn levels. To address the potential issue of low frequency sound for the expansion project, we employed the Cadna model to estimate the C-weighted Ldn sound levels for the proposed new turbines; these estimates, including comparisons with the measured ambient C-weighted Ldn values, are presented on Figs. 15 and 16 and listed in Tables 6 and 7. As described in Appendix A, the C-weighted sound level (dBC) slightly de-emphasizes the low and high frequencies relative to the mid frequency components of sound. The de-emphasis of low frequency sound with the C-weighting filter is less than with the A-weighting filter, which results in a measured C-weighted sound level being greater than its corresponding A-weighted sound level at a given community location. By comparing an A-weighted sound level (dBA) with a C-weighted sound level (dBC), one can determine the low frequency component of the sound. The estimated C-weighted Ldn sound levels for the wind farm range from 52 dBC to 62 dBC at the community monitoring locations and from 54 dBC to 62 dBC at the 21 residential structures within one mile of the project; these estimates compare to the similar range of measured preconstruction ambient C-weighted Ldn values of 55 dBC to 73 dBC across the monitoring locations. The study also considered the potential additive effects of the existing and the proposed expansion on the sound levels in the community. The Town of Duo is located between the existing wind facility and the proposed expansion area. Most of the residences in the town are approximately two miles from the nearest turbines of the proposed expansion and about 3600 ft. from the nearest existing turbines. The estimated Ldn sound levels at these residences due to the proposed new turbines are modest and range from 31 to 34 dBA. And the Ldn sound levels from wind farm operation for most of the locations are estimated to increase about 1 dBA with the addition of the proposed new turbines compared to the current levels with only the existing turbines. As noted previously in this report, the sound model is conservative as it assumes that all turbines are operating at maximum sound power output and that all locations, including the Duo locations, are downwind of all turbines at all times. 7. Noise Impact Assessment

Report No. 421 Acentech Incorporated
8
As noted in Section 5, the majority of the construction activities associated with the project will be conducted during the daylight hours, and it will vary over time, depending on the equipment in use and the operations being performed at the site. The temporary noise associated with construction of the project will be similar to the noise produced during excavation, grading, and steel erection activities at many other mid-size building projects, and the current timber and mining activities in the region. Similar to the existing wind turbine facility, the expansion facility will be available to operate 24-hours per day and seven days per week; and it may be heard at times in the community during turbine operation. It is expected that routine operation will produce day-night sound levels in the community that are similar to or lower than the measured existing ambient day-night sound levels.

Report No. 421 Acentech Incorporated
9
Figure 1. Area Map with Proposed Beech Ridge Phase II Wind Farm Showing Turbine Locations and One Mile and Five-Mile Buffer Zones.

Report No. 421 Acentech Incorporated
10
Figure 2. Area Map Showing Land Use Classifications with Community Sound Monitoring Locations 1 through 4 and Average Measured Existing Ambient A-Weighted Day-Night Sound Levels (Ldn, dBA) during 4 – 15 February 2011 Sound Survey.
4/48
3/47
2/50
1/48
Note: Measured Ldn sound levels, sound sources, and land uses were relatively uniform within the one-mile buffer zone, resulting in a flat ambient sound contour for the area.
Report No. 421 Acentech Incorporated
11
Figure 3. View Looking SW from Location 1 (Town of Duo).
Figure 4. View Looking E from Location 2 (Beech Ridge Road).

Report No. 421 Acentech Incorporated
12
Figure 5. View Looking SE from Location 3 (NW of Project Site).
Figure 6. View Looking NE from Location 4 (Town of Quinwood).
Report No. 421 Acentech Incorporated
13
Figure 7. Leq A-Weighted and C-Weighted Existing Ambient Sound Levels Measured at Location 1 (Town of Duo) and Wind Speeds for 10-Minute Intervals during 4 – 15 February 2011.
-10
0
10
20
30
40
50
60
70
80
90
0:00 0:00 0:00 0:00 0:00 0:00 0:00 0:00 0:00 0:00 0:00 0:00 0:00
Date and Time
10-M
in L
eq S
ound
Lev
el (d
BA
& d
BC
)
-10
0
10
20
30
40
50
60
70
80
90
Win
d Sp
eed
at 8
0m H
eigh
t (m
/s)
1-ALeq1-CLeqMet Tower 1 Wind SpeedMet Tower 2 Wind Speed
Loc. 111-day A-Ldn = 48
Fri.2/4
Mon.2/7
Sun.2/6
Sat.2/5
Tue.2/15
Mon.2/14
Sun.2/13
Sat.2/12
Fri.2/11
Thur.2/10
Wed.2/9
Tue.2/8

Report No. 421 Acentech Incorporated
14
Figure 8. Leq A-Weighted and C-Weighted Existing Ambient Sound Levels Measured at Location 2 (Beech Ridge Road) and Wind Speeds for 10-Minute Intervals during 4 – 15 February 2011.
-10
0
10
20
30
40
50
60
70
80
90
0:00 0:00 0:00 0:00 0:00 0:00 0:00 0:00 0:00 0:00 0:00 0:00 0:00
Date and Time
10-M
in L
eq S
ound
Lev
el (d
BA
& d
BC
)
-10
0
10
20
30
40
50
60
70
80
90
Win
d Sp
eed
at 8
0m H
eigh
t (m
/s)
2-ALeq2-CLeqMet Tower 1 Wind SpeedMet Tower 2 Wind Speed
Loc. 211-day A-Ldn = 50
Fri.2/4
Mon.2/7
Sun.2/6
Sat.2/5
Tue.2/15
Mon.2/14
Sun.2/13
Sat.2/12
Fri.2/11
Thur.2/10
Wed.2/9
Tue.2/8

Report No. 421 Acentech Incorporated
15
Figure 9. Leq A-Weighted and C-Weighted Existing Ambient Sound Levels Measured at Location 3 (NW of Project Site) and Wind Speeds for 10-Minute Intervals during 4 – 15 February 2011.
-10
0
10
20
30
40
50
60
70
80
90
0:00 0:00 0:00 0:00 0:00 0:00 0:00 0:00 0:00 0:00 0:00 0:00 0:00
Date and Time
10-M
in L
eq S
ound
Lev
el (d
BA
& d
BC
)
-10
0
10
20
30
40
50
60
70
80
90
Win
d Sp
eed
at 8
0m H
eigh
t (m
/s)
3-ALeq3-CLeqMet Tower 1 Wind SpeedMet Tower 2 Wind Speed
Loc. 311-day A-Ldn = 47
Fri.2/4
Mon.2/7
Sun.2/6
Sat.2/5
Tue.2/15
Mon.2/14
Sun.2/13
Sat.2/12
Fri.2/11
Thur.2/10
Wed.2/9
Tue.2/8

Report No. 421 Acentech Incorporated
16
Figure 10. Leq A-Weighted and C-Weighted Existing Ambient Sound Levels Measured at Location 4 (Town of Quinwood) and Wind Speeds for 10-Minute Intervals during 4 – 15 February
2011.
-10
0
10
20
30
40
50
60
70
80
90
0:00 0:00 0:00 0:00 0:00 0:00 0:00 0:00 0:00 0:00 0:00 0:00 0:00
Date and Time
10-M
in L
eq S
ound
Lev
el (d
BA
& d
BC
)
-10
0
10
20
30
40
50
60
70
80
90
Win
d Sp
eed
at 8
0m H
eigh
t (m
/s)
4-ALeq4-CLeqMet Tower 1 Wind SpeedMet Tower 2 Wind Speed
Loc. 411-day A-Ldn = 48
Fri.2/4
Mon.2/7
Sun.2/6
Sat.2/5
Tue.2/15
Mon.2/14
Sun.2/13
Sat.2/12
Fri.2/11
Thur.2/10
Wed.2/9
Tue.2/8

Report No. 421 Acentech Incorporated
17
Figure 11. Area Map of Proposed Expansion of Beech Ridge Wind Farm with Estimated Construction A-Weighted Ldn Sound Level Contours Compared to Average Measured Existing Ambient A-Weighted Ldn Sound Levels (dBA) at Locations 1 to 4.
Note: Contours are for construction sound only, assuming construction at each WTG simultaneously, and do not include contribution of ambient sound.
4/48
3/47
2/50
1/48
Report No. 421 Acentech Incorporated
18
Figure 12. Estimated A-Weighted Ldn Sound Level for Operation (dBA) of Proposed Expansion of Beech Ridge Wind Farm at 21 Residential Structures within One Mile of Project Boundary.
0
10
20
30
40
50
60
70
80
0 1000 2000 3000 4000 5000 6000
Distance to Hub of Nearest Turbine (ft)
A-W
eigh
ted
Ldn
Sou
nd L
evel
(dB
A)

Report No. 421 Acentech Incorporated
19
Figure 13. Area Map of Proposed Expansion of Beech Ridge Wind Farm with Estimated Operation A-Weighted Ldn Sound Level Contours Compared to Average Measured Existing Ambient A-Weighted Ldn Sound Levels (dBA) at Locations 1 to 4.
4/48
3/47
2/50
1/48
Notes: Contours are for operation sound only and do not include contribution of ambient sound. Land use classifications not shown on this figure for clarity; see Figure 14 for Operation Sound Level Contours on map with land use classifications.

Report No. 421 Acentech Incorporated
20
Figure 14. Area Map of Proposed Expansion of Beech Ridge Wind Farm Showing Land Use Classifications with Estimated Operation A-Weighted Ldn Sound Level Contours Compared to Average Measured Existing Ambient A-Weighted Ldn Sound Levels (dBA) at Locations 1 to 4.
4/48
3/47
2/50
1/48
Note: Contours are for operation sound only and do not include contribution of ambient sound.

Report No. 421 Acentech Incorporated
21
Figure 15. Estimated C-Weighted Ldn Sound Level for Operation (dBC) of Proposed Expansion of Beech Ridge Wind Farm at 21 Residential Structures within One Mile of Project Boundary.
0
10
20
30
40
50
60
70
80
0 1000 2000 3000 4000 5000 6000
Distance to Hub of Nearest Turbine (ft)
C-W
eigh
ted
Ldn
Sou
nd L
evel
(dB
C)

Report No. 421- REV DRAFT-4 Acentech Incorporated
22
Figure 16. Area Map of Proposed Expansion of Beech Ridge Wind Farm with Estimated Operation C-Weighted Ldn Sound Level Contours Compared to Average Measured Existing Ambient C-Weighted Ldn Sound Levels (dBC) at Locations 1 to 4.
4/56
3/55
2/73
1/65
Note: Contours are for operation sound only and do not include contribution of ambient sound.

Report No. 421 Acentech Incorporated
23
Table 1. Description of Monitoring Locations for Preconstruction Ambient Sound Survey
(4 - 15 February 2011).
Location
Description
Approx. Dist. (ft.) to nearest WTG
1 – Town of Duo hamlet with several homes and small church 10,500 (3600*) 2 – Beech Ridge Road very few scattered rural homes 1600 † 3 – NW of Project Site near hamlet with several homes 5800 4 – Town of Quinwood near hamlet with several homes 5000
* Nearest WTG is at existing operating wind facility. † Monitoring location is closer to a proposed WTG location than the nearest residential structure.

Report No. 421 Acentech Incorporated
24
Table 2. Type of Acoustic Instrumentation Used for Ambient Sound Survey
(4 - 15 February 2011).
Instrument Type Manufacturer Model Continuous Sound Level Monitors Rion NL-31 & NL-32 Preamplifiers Rion NH-21 1/2" Microphones Rion UC-53A Calibrator Bruel & Kjaer 4231 Precision Sound Level Meter and Octave Band Analyzer Rion NA-27 Preamplifier Rion NH-20 1/2" Microphone Rion UC-53A Calibrator Norsonic 1251

Report No. 421 Acentech Incorporated
25
Table 3. Summary of Monitoring Locations and Ldn Sound Levels (dBA) Measured during
Ambient Sound Survey (4 - 15 February 2011).
Location GPS Reading (UTM) Dist. to Nearest
WTG (ft.)
Ambient
Ldn* Easting (m) Northing (m) Elev. (m)
1 – Town of Duo 535224 4213961 1033 10,500 48 2 – Beech Ridge Road 535472 4218322 1206 1600 † 50 3 – NW of Project Site 533286 4219763 971 5800 47 4 – Town of Quinwood 527828 4212790 921 5000 48
* Ldn measured for over 255 hours at Locations 1 - 4. † Monitoring location is closer to a proposed WTG location than the nearest residential structure. Note that across the four locations, measured average Ldn of 48 dBA with a standard deviation of 1 dBA.

Report No. 421 Acentech Incorporated
26
Table 4. Estimated Equivalent Sound Levels (Leq*) of Representative Construction Equipment at
Various Distances.
Equipment
Construction Sound Levels (dBA)
1640 ft. † 3330 ft. ** 1 mile 5 miles
Phase I – Preparation & Foundation
Blasting 59†† 50†† 43†† 14†† Pile Driving 58†† 49†† 42†† 13††
Dozer 48 39 32 3 Excavator 49 40 33 4
Trencher 49 40 33 4
Grader 47 38 31 2 Roller 44 35 28 <0
Trucks 43 34 27 <0
Batch Plant 40 31 24 <0
Phase II – Erection &
Installation
Trucks 43 34 27 <0
Crane 49 40 33 4
Phase III – Test &
Commission
Trucks 43 34 27 <0
* Estimated Leq sound levels over a 10-hour daytime shift. 24-hr Ldn would be 4 dBA less than each Leq. Above estimates do not include attenuation due to any terrain shielding (i.e., estimates assume line-of sight to receptor). † Estimated sound levels at residential structure B-23 in Table 7. ** Estimated sound levels at residential structure GB-0125 in Table 7. †† Estimated values for blasting and pile driving are maximum (Lmax) sound levels, not Leq. Reference: ESEERCO Power Plant Construction Noise Guide, BBN Report No. 3321, May 1977.

Report No. 421 Acentech Incorporated
27
Table 5.
Comparison of Average Measured A-Weighted Ldn Sound Levels during Ambient Sound Survey with Estimated A-Weighted Ldn Sound Levels for WTG Facility (dBA).
Location*
Dist. to Nearest
WTG (ft.)
Average Measured
Ambient A-Weighted
Ldn
Estimated Facility
Operation A-Weighted
Ldn
1 – Town of Duo 10,500 48 34 2 – Beech Ridge Road 1600 50 47 3 – NW of Project Site 5800 47 37 4 – Town of Quinwood 5000 48 38
* Comparisons provided for the actual sound monitoring locations; in some areas, residences are located closer or farther from WTGs.

Report No. 421 Acentech Incorporated
28
Table 6.
Comparison of Average Measured C-Weighted Ldn Sound Levels during Ambient Sound Survey with Estimated C-Weighted Ldn Sound Levels for WTG Facility (dBC).
Location*
Dist. to Nearest
WTG (ft.)
Average Measured
Ambient C-Weighted
Ldn
Estimated Facility
Operation C-Weighted
Ldn
1 – Town of Duo 10,500 65 53 2 – Beech Ridge Road 1600 73 62 3 – NW of Project Site 5800 55 54 4 – Town of Quinwood 5000 56 52
* Comparisons provided for the actual sound monitoring locations; in some areas, residences are located closer or farther from WTGs.

Report No. 421 Acentech Incorporated
29
Table 7.
Estimated A-Weighted and C-Weighted Ldn Sound Levels (dBA and dBC) for WTG Facility at Residential Structures within One Mile of Expansion Area.
Residential
Structures
w/in 1 mile of
Expansion
GPS Reading (UTM) Dist. to
Nearest
WTG
(ft.)
Estimated
Facility
Operation
A-Weighted
Ldn (dBA)
Estimated
Facility
Operation
C-Weighted
Ldn (dBC)
Easting (m) Northing (m) Elev. (m)
B-23 535465 4218274 1199 1640 47 62
B-17 535003 4218608 1202 2180 45 60 B-18 535019 4218572 1198 2200 43 57 B-24 535259 4218288 1202 2310 45 60 B-19 534949 4218464 1195 2590 44 59 B-15 534684 4219070 1142 2970 43 59 B-14 534645 4219087 1138 3100 43 58 B-11 534641 4219112 1133 3130 42 58 B-13 534640 4219114 1133 3140 42 58 B-12 534636 4219098 1137 3140 43 58 B-10 534606 4219098 1135 3240 43 59 B-9 534601 4219104 1134 3260 43 59 B-8 534602 4219129 1132 3270 43 58 GB-0125 534579 4219112 1132 3330 43 59 B-7 534563 4219127 1132 3390 43 58 B-6 534557 4219150 1132 3430 43 59 B-16 534635 4218382 1262 3430 44 61 235 528032 4212705 922 4400 40 56 234 528003 4212678 924 4500 40 56 GB-0126 533309 4219424 961 4680 39 55 GB-0128 533341 4219584 952 5170 38 54
Report No. 421 Acentech Incorporated
A-1
Appendix A
Sound in Lay Terms Sounds we hear come from small pressure oscillations, or sound waves, that travel through the air and actuate our hearing mechanism. These airborne pressure oscillations cause the eardrum and small bones of the middle ear to vibrate. These vibrations are transmitted to the fluid-filled cochlea of the inner ear's sensory organ. Sensory hair cells then transduce these vibrations into nerve impulses that are transmitted to the brain where they are perceived and interpreted. Noise is often defined as unwanted sound and the degree of disturbance or annoyance of an intruding noise depends on various factors including the magnitude and nature of the intruding noise, the magnitude of the background or ambient sound present without the intruding noise, and the nature of the activity of people in the area where the noise is heard. For example, people relaxing at home generally prefer a quiet environment, while factory employees may be accustomed to relatively high noise levels when at work. The magnitude, or loudness, of sound waves (pressure oscillations) is described quantitatively by the terms sound pressure level, sound level, or simply noise level. The magnitude of a sound is measured in decibels, abbreviated dB. Decibels are used to quantify sound pressure levels just as degrees are used to quantify temperature and inches are used to quantify distance. The faintest sound level that can be heard by a young healthy ear is about 0 dB, a moderate sound level is about 50 dB, and a loud sound level is about 100 dB. Various common outdoor sound levels are listed below.
130 dBA Loud siren at 100 feet 95 dBA Pile Driver at 100 feet 80 dBA Truck at 100 feet 65 dBA Lawn mower at 100 feet 60 dBA Average speech 55 dBA Automobile 30 mph at 100 feet 50 dBA Quiet urban daytime 35 dBA Quiet suburban nighttime 25 dBA Quiet rural nighttime
Sound energy spreads as it travels away from its source causing the sound level to diminish. Other factors that reduce sound levels include absorption in the atmosphere, diffraction and refraction in the atmosphere, and terrain. The frequency of a sound is analogous to its tonal quality or pitch. The unit for frequency is hertz, abbreviated Hz (formerly cycles per second or cps). Thus, if a sound wave oscillates 500 times per second, its frequency is 500 Hz. The fundamental frequency of Middle C on a piano keyboard, for example, is 262 Hz. However, most sounds include a composite of many frequencies and are characterized as broad band or random. The normal frequency range of human hearing extends from a low frequency of about 20 to 50 Hz (a rumbling sound) up to a high frequency of about 10,000 to 15,000 Hz (a hissing sound) or even higher for some people. People have different hearing sensitivity to different frequencies and generally hear best in the mid-frequency region that is common to human speech, about 500 to 4000 Hz.

Report No. 421 Acentech Incorporated
A-2
Appendix A Con’t. Sound level meters are usually equipped with electronic filters or weighting circuits, such as specified in standards ANSI S1.4 or IEC 651, for the purpose of simulating the frequency response characteristics of the human ear. The A-weighting filter included with essentially all sound level meters is most commonly employed for this purpose because the measured sound level data correlate well with subjective response to sounds. Sound levels measured using the A-weighting network are designated by dBA. The background or ambient acoustic environment in most communities varies from place to place and varies with time at any given location due to the composite of many nearby and distant sound sources. The ambient environment includes high sound level single-events such as the passby of an airplane or nearby car, the barking of a dog, thunder, or a siren. The ambient acoustic environment also includes relatively steady residual or background sounds caused by sources such as distant traffic and ventilation equipment. The quantity of the single-event sounds and the amplitude of the background sounds are usually least during the late night hours from about midnight to 5:00 am. Indeed, the ambient sound level at a location is related to the amount of human activity in its vicinity. The amplitude statistics of this rather complex acoustic environment are considered to be non-Gaussian (because of the presence of the lower-level residual background sounds) and non-stationary (because of diurnal and seasonal variations). At any location, a complete physical description of the ambient acoustic environment might include its sound level at various frequencies, as a function of time. As a first step towards simplifying this multi-dimensional description, it has become common practice to eliminate the frequency variable by measuring the A-weighted sound level (dBA), as observed on a standard sound level meter. The A-weighting filter emphasizes the mid-frequency components of sounds to approximate the frequency response of the human ear. A-weighted sound levels correlate well with our perception of most sounds. Another weighting network employed in most sound level meters is the C-weighting network. The C-weighted sound level (dBC) slightly de-emphasizes the low and high frequencies relative to the mid frequency components of sound. The de-emphasis of low frequency sound with the C-weighting filter is less than with the A-weighting filter. By comparing an A-weighted sound level (dBA) with a C-weighted sound level (dBC), we can determine the low frequency component of the sound. An increase or decrease of the outdoor ambient sound level in a community by 1 or 2 dB is generally not noticeable. Whereas a change of the ambient sound level by 5 or 6 dB is generally noticeable and an increase or decrease of the ambient sound level by 10 dB is generally considered to represent a doubling or halving of the perceived sound. To evaluate impacts and report time-varying ambient sound levels it is common practice, using the A-weighted scale, to measure the equivalent sound level and the day-night sound level. The equivalent sound level (Leq) is the level of a steady-state sound that has the same (equivalent) energy as the time-varying sound of interest, taken over a specified time period. Thus, the equivalent sound level is a single-valued level that expresses the time-averaged total energy of the entire ambient sound energy. It includes both the high-level single event sounds and the relatively steady background sounds. The day-night sound level (Ldn) is simply the average equivalent sound for 24-hours after 10 dBA has been added to the nighttime sound levels from 10pm to 7am. Adding 10 dBA to the nighttime sound levels accounts for people’s expectations that nighttime be a quiet period. Both the equivalent sound level and the day-night sound

Report No. 421 Acentech Incorporated
A-3
levels have been selected by the U.S. Environmental Protection Agency (USEPA) as the best descriptors to use for the purpose of identifying and evaluating levels of environmental noise. EPA has identified an Ldn level of 55 dBA as protective of the health and welfare of humans. In addition, the Federal Energy Regulatory Commission (FERC) employs an Ldn level of 55 dBA as its criterion during review of proposed projects. As part of the application process, the West Virginia Public Service Commission (WVPSC) Guidelines for Noise Studies for Siting Certificates require a project to submit preconstruction ambient Ldn data and facility operation Ldn estimates for review in addition to information on construction noise