beginner guide to particle technology
TRANSCRIPT

M e a s u r i n g w h a t m a t te rs ™
Beginner guide to particle technology

M e a s u r i n g w h a t m a t te rs ™
Introduction
In Beginner guide to particle technology, you will learn about the physical nature,
origins and behavior of particles, including:
• Their size. Particles are measured in microns (µm). A micron’s length is
equivalent to 1/1000th of a millimeter.
• Particle concentrations. How many particles are in a cubic foot of indoor air?
How many particles do humans shed daily?
• The three ways to control particles. Filtration is essential to controlling
particle contamination.
For a more in-depth review of these topics, see our:• Intermediate guide to particle technology, and• Advanced guide to particle technology
2

M e a s u r i n g w h a t m a t te rs ™
Particles
Generally, there are three types of particles: non-viable organic, viable organic and inorganic.
Non-viable organic particles come from non-reactive organic material, which is material derived from living organisms and includes carbon-based compounds.
Viable organic particles are capable of living, developing or germinating under favorable conditions; bacteria and fungus are examples of viable organic compounds.
Inorganic particles are non-reactive materials, such as sand, salt, iron, calcium salts and other mineral-based materials.
SizeVarious manufacturing applications concentrate on particles measured in microns. These particles range in size from well under a micron (µm) to about 100 µm. A micron’s length is equivalent to 1/1000 of a millimeter.
A single grain of salt measures about 60 µm and human hair measures between 50-150 µm. The average human eye can’t see particles smaller than 50 µm.
TABLE 1: Some common particles and their relative sizes.
PARTICLE CONTENT PARTICLE SIZE (µm)Sneeze particles 10 – 300 µmHair 50 – 150 µmPollen 7 – 100 µmDust <0.1 – >100 µmVisible 50 µmBacteria 1.0 – 10 µmFlu virus 0.07 µm
3

M e a s u r i n g w h a t m a t te rs ™
ConcentrationsA standard cubic foot of indoor air typically has about 1 million particles larger than 0.5 µm. Remote marine environments tend to have lower particle levels than remote continental environments. In those environments, a cubic foot of air contains 10’s or 100’s of particles larger than 0.5 µm. Urban environments are much higher in particle counts than either of those.
In liquids, a single milliliter of a cleanroom’s ultrapure water source contains much less than 1 particle larger than 0.05 µm, yet a milliliter of drinking water may contain a million particles larger than 0.05 µm.
Humans produce significant particle concentrations, shedding about 1 ounce (28 grams) of skin particles per day. See FIGURE 1. The simple process of exhaling air can produce several thousand particles, especially from smokers.
FIGURE 1: How human activity generates particles
T H E S K I N W E S H E D
Skin
par
ticle
s rel
ease
d (m
illio
n/m
inut
e)
Sitting quietly1 million/min
1086420
Source: Dr. Ken Goldstein Cleanroom Consultants, and Mike Fitzpatrick, Lockwood Greene, Cleanrooms East 99
Walking 3 kph5 million/min
Walking 5 kph7.5 million/min
Walking 8 kph10 million/min
4
M e a s u r i n g w h a t m a t te rs ™
MaterialsAlmost anything can generate particles under the right circumstances. In a cleanroom, the most prolific particle generators are usually people. People generate particles in a variety of ways, including shedding skin cells, emitting scent, losing hair, breathing and sneezing.
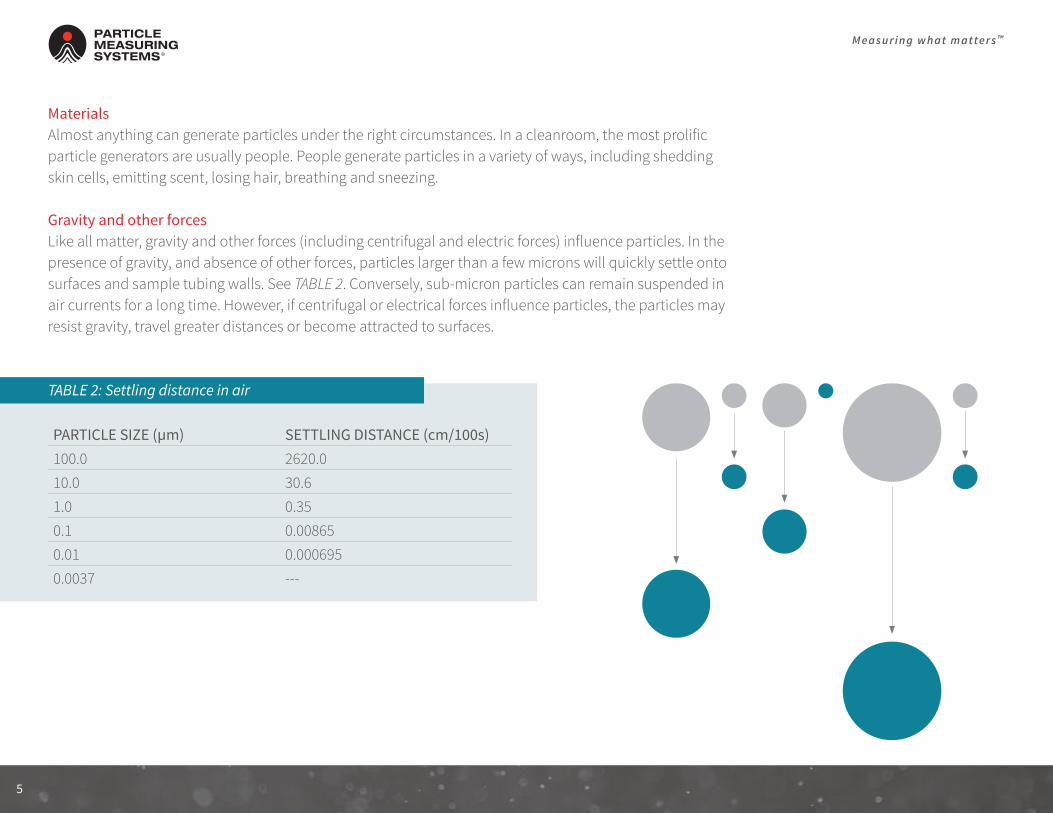
Gravity and other forcesLike all matter, gravity and other forces (including centrifugal and electric forces) influence particles. In the presence of gravity, and absence of other forces, particles larger than a few microns will quickly settle onto surfaces and sample tubing walls. See TABLE 2. Conversely, sub-micron particles can remain suspended in air currents for a long time. However, if centrifugal or electrical forces influence particles, the particles may resist gravity, travel greater distances or become attracted to surfaces.
TABLE 2: Settling distance in air
PARTICLE SIZE (µm) SETTLING DISTANCE (cm/100s)100.0 2620.010.0 30.61.0 0.350.1 0.008650.01 0.0006950.0037 ---
5

M e a s u r i n g w h a t m a t te rs ™
Transporting particles in air through tubingLarger particles tend to settle, or impact, and adhere to tubing walls, which makes sampling the particles more difficult. The tube or duct collects sample media from a remote location, but when sample media within a tube travels from a remote location to a particle counter, two things happen:
• Some pressure is lost• Some particles adhere to the tubing
Aerosol particle lossTo minimize particle loss in tubing, the tubing should always lie flat (if possible) with minimal bends. If tubing bends are required, the bend radius (which is measured to the inside curvature) should not be less than six inches (15 cm). Also, the tubing diameter and materials should be conducive to particle transport. Bev-A-Line® conductive polymer 3/8 inches (~8 millimeters) ID tubing is commonly installed with aerosol manifold systems and offers superior particle transport at a reasonable cost. Some tubing materials are not always available, or affordable, so based upon reducing particle losses, the following list is in order of preference:
1. Stainless steel2. Conductive polymer3. Polyester4. Vinyl (if plasticizer does not interfere)5. Polyethylene6. Copper7. Glass8. Teflon9. Aluminum
6

M e a s u r i n g w h a t m a t te rs ™
Environments
Many modern, high-tech processes demand an absence of particulates. For instance, pharmaceutical companies determine process cleanliness by monitoring 0.5 µm particles and product sterility by monitoring 5 µm particles. In contrast, semiconductor manufacturing tends to concentrate on particles from 0.3 µm down to 0.05 µm. Controlling particle contaminationThere are three ways to control particles:
• Eliminate existing particles in the manufacturing environment• Prevent or restrict the importation of new particles into the manufacturing environment• Prevent the generation of new particles within the manufacturing process
7

M e a s u r i n g w h a t m a t te rs ™
FiltrationFiltration is essential to controlling particle contamination. There are two steps to filtration: directing the particles to the filter and trapping them inside the filter.
Filters become more efficient as particles gradually fill the gaps in the filter media, so fewer areas are available for particles to slip through. The increased contamination creates less area for the air to pass through, creating greater pressure across the filter and eventually limiting flow through the filter. Once a filter is saturated with particles it must be replaced. Sometimes the filter media can be purged (cleaned) and reused.
Filter media have become very sophisticated and are made from synthetic fibers, membranes (Gore-Tex®), porous plastics or ceramics. Common air filtration standards are as follows:
• High-efficiency particulate air (HEPA) filtration is the industry standard for ultraclean or ultrapure manufacturing environments. HEPA filters typically remove 99.99% of particles equal to or larger than the filter’s specification, which is usually 0.3 µm. HEPA filtration is an integral part of heating/ventilation/air conditioning (HVAC) systems.
• Ultra-efficiency particulate air (ULPA) filtration removes 99.9997% of particles equal to or larger than 0.12 µm. Ultraclean process environments require UPLA filters.
Today, sophisticated particle counting instrumentation can perform filter efficiency analysis.
CleanroomsClean process environments must remain unfailingly clean, so merely filtering the factory’s air is inadequate. To minimize particle contamination, it’s important to build separate environments (cleanrooms) that allow particle limits to be maintained at measurable and controllable levels.
Further contamination reduction in a cleanroom requires personnel to wear protective gowns, hair and beard covers, hoods, overshoes and gloves. These are affectionately referred to as “bunny suits.” In the cleanest environments, personnel wear bunny suits fitted with helmets and respirators that filter exhaled air. Cleanroom apparel is extremely important in microcontamination control to contain the particles emitted by people.
8

M e a s u r i n g w h a t m a t te rs ™
CLASS NUMBER OF PARTICLES PER CUBIC METER BY MICROMETER SIZE 0.1 µm 0.2 µm 0.3 µm 0.5 µm 1.0 µm 5.0 µmISO 1 10 2 - - - - ISO 2 100 24 10 4 - - ISO 3 1,000 237 102 35 8 - ISO 4 10,000 2,370 1,020 352 83 - ISO 5 100,000 23,700 10,200 3,520 832 29ISO 6 1,000,000 237,000 102,000 35,200 8,320 293ISO 7 - - - 352,000 83,200 2,930ISO 8 - - - 3,520,000 832,000 29,300ISO 9 - - - 35,200,000 8,320,000 293,000
Classification of cleanrooms and minienvironmentsThe International Organization for Standardization (ISO) develops standards for particle concentrations in clean processes. ISO 14644-1 establishes standard classes of air cleanliness for cleanrooms and clean zones based on specified concentrations of airborne particulates. The specific allowable particle limits per ISO Class are shown in TABLE 3.
TABLE 3: ISO cleanroom classifications
Cleanroom evaluation and certificationCleanroom certification occurs after construction or significant physical changes. Certification guarantees the facility has met the requirements for a statistically valid maximum concentration of specified-size airborne particles. Cleanroom certifications may occur in any of three different stages: as built, at rest or operational. Consult ISO 14644 documentation for further details.
9

M e a s u r i n g w h a t m a t te rs ™
Particle detection
Particle counters continuously measure particle contamination levels, trends and sources. Manufacturing personnel use particle data to understand causes of contamination, precisely schedule cleanroom maintenance cycles, correlate contamination levels with manufacturing processes and fine-tune each step of production.
Optical particle countersMost people are familiar with the sight of dust flickering in a sunbeam. Four elements are necessary to see the dust: sunlight (illuminates the dust), dust (reflects the sunlight), air (carries the dust) and your eye (sees the dust, or more accurately, sees the light reflected by the dust). An optical particle counter (OPC) uses the same elements but maximizes the effectiveness. Particle counters use a high-intensity light source (a laser), a controlled air flow (viewing volume) and highly sensitive light-gathering detectors (a photo detector).
10

M e a s u r i n g w h a t m a t te rs ™
Types of particle countersThere are several varieties of particle counters. The primary differences depend upon the medium in which particles are suspended: air, liquid, or gas.
Air: Airborne particle counters measure contamination in HEPA-filtered cleanrooms, disk drive assemblies, drug manufacturers, small test benches, rocket launch facilities and hundreds of different controlled air applications.
Liquid: Liquid particle counters measure contamination in liquid, including drinking water, injectable drugs, microelectronic cleaning fluids and transmission fluids.
Gas: Gas particle counters measure contamination suspended in pressurized gases. These gases may be either inert or reactive and either dry (anhydrous) or containing trace water vapors.
Using particle countersParticle counters are not like other common testing equipment. They include lasers, specialized optics, printed circuit boards (PCBs) and carefully aligned sampling regions. The extremely sensitive measurement is affected by environmental stressors like vibration, EMI (electromagnetic interference), heat/cold extremes and dirt. Particle counters are high-performance, sensitive electronic instruments that can be used for trend tracking, statistically valid sampling and data interpretation.
Trend tracking Trend tracking and particle counters give detailed particle contamination trend analysis. They monitor gradual or sudden changes in the environment’s contamination levels. This information can tell the operator if there is a filtration problem, if a tool or process is dirty, or if someone left a door or valve open.
Statistically valid sampling The number of samples, the duration, and sampling need to be considered to achieve a statistically valid sample. Particle counts may be higher within convection currents or settle onto surfaces, but in general, the principles of diffusion show that sampling from one area of a room will provide similar data to another area of a room.
Data interpretation A particle counter samples media at a constant flow rate and counts the particles in the media. The data collected by the particle counter are viewable in two ways:
• Raw counts: The total number of particles in a specific size channel. Raw counts are not calculated as a function of the sample volume, so the data does not report volumetric contamination values. This data is useful in some applications, as well as in calibrating the instrument.
• Normalized counts: The total number of particles divided by the sampled volume. Normalized counts correlate particle counts to sample volumes, so the data is reported in particle concentrations per unit volume (ft3, m3, mL, etc.).
11

M e a s u r i n g w h a t m a t te rs ™
Conclusion
This paper gives a basic understanding of particles and particle counting to help improve your cleanliness levels.
For more guidance on selecting the correct particle counter for your application, visit pmeasuring.com/beginnerguide or call +1-303-443-7100
12

About Particle Measuring SystemsA global technology leader in the environmental monitoring industry,
Particle Measuring Systems, a Spectris company, is the inventor of laser
particle counting and the largest particle counter manufacturer in the world.
Regardless of industry or monitoring requirements, we help manufacturers measure what matters.
p m e a s u r i n g .co m