behavioral and developmental effects of preventing iron-deficiency anemia
DESCRIPTION
Iron-deficiencyTRANSCRIPT

2003;112;846Pediatricsand Paulina Pino
Betsy Lozoff, Isidora De Andraca, Marcela Castillo, Julia B. Smith, Tomas WalterHealthy Full-Term Infants
Behavioral and Developmental Effects of Preventing Iron-Deficiency Anemia in
http://pediatrics.aappublications.org/content/112/4/846.full.html
located on the World Wide Web at: The online version of this article, along with updated information and services, is
of Pediatrics. All rights reserved. Print ISSN: 0031-4005. Online ISSN: 1098-4275.Boulevard, Elk Grove Village, Illinois, 60007. Copyright © 2003 by the American Academy published, and trademarked by the American Academy of Pediatrics, 141 Northwest Pointpublication, it has been published continuously since 1948. PEDIATRICS is owned, PEDIATRICS is the official journal of the American Academy of Pediatrics. A monthly
at N/A on February 15, 2012pediatrics.aappublications.orgDownloaded from

Behavioral and Developmental Effects of Preventing Iron-DeficiencyAnemia in Healthy Full-Term Infants
Betsy Lozoff, MD*; Isidora De Andraca, PhD‡; Marcela Castillo, PhD‡; Julia B. Smith, EdD§;Tomas Walter, MD�; and Paulina Pino, PhD¶
ABSTRACT. Objective. To determine the behavioraland developmental effects of preventing iron-deficiencyanemia in infancy.
Methods. Healthy full-term Chilean infants whowere free of iron-deficiency anemia at 6 months wereassigned to high- or low-iron groups or to high- or no-added-iron groups. Behavioral/developmental outcomesat 12 months of age included overall mental and motortest scores and specific measures of motor functioning,cognitive processing, and behavior. There were no dif-ferences between high- and low-iron groups in the prev-alence of iron-deficiency anemia or behavioral/develop-mental outcome, and they were combined to form aniron-supplemented group (n � 1123) for comparison withthe no-added-iron group (n � 534).
Results. At 12 months, iron-deficiency anemia waspresent in 3.1% and 22.6% of the supplemented andunsupplemented groups, respectively. The groups dif-fered in specific behavioral/developmental outcomes butnot on global test scores. Infants who did not receivesupplemental iron processed information slower. Theywere less likely to show positive affect, interact socially,or check their caregivers’ reactions. A smaller proportionof them resisted giving up toys and test materials, andmore could not be soothed by words or objects whenupset. They crawled somewhat later and were morelikely to be tremulous.
Conclusions. The results suggest that unsupple-mented infants responded less positively to the physicaland social environment. The observed differences seemto be congruent with current understanding of the effectsof iron deficiency on the developing brain. The studyshows that healthy full-term infants may receive devel-opmental and behavioral benefits from iron supplemen-tation in the first year of life. Pediatrics 2003;112:846–854;iron deficiency, nutritional anemia, behavior, develop-ment, infant.
Iron-deficiency anemia affects an estimated 20% to25% of infants worldwide, with a higher propor-tion having iron deficiency without anemia.1–3
Despite the high worldwide prevalence, many coun-tries, both industrialized and developing, have notmade routine iron supplementation for healthy terminfants a priority. The expense and effort of preven-tion or screening and theoretical concerns about ironoverload or interference with immunity, absorptionof other trace minerals, or breastfeeding have beenissues.4–6 A basic question, however, has concernedfunctional consequences of iron deficiency, and ef-fects on infant behavior and development have beenat the core of the debate.
Evidence for a cause-effect relationship betweenpoorer behavioral/developmental outcome andearly iron deficiency remains equivocal.7 A recentcomprehensive review8 detailed the research brieflysummarized here. Case-control studies contrastinginfants with iron-deficiency anemia with a compari-son group generally find lower mental and motortest scores and other behavioral differences. Therehas been little or no evidence of lower developmen-tal test scores among infants with iron deficiency thatis not severe enough to cause anemia. Results afteriron therapy vary. Most studies report persistingdifferences, even long term. Only 1 showed completecorrection of test score differences in infancy.9 Theseresults suggest either that iron-deficiency anemia ininfancy has some effects that cannot readily be cor-rected with treatment, as in the animal model,10 orthat other factors are the cause of poorer behaviorand development.
A few studies of behavior and development haveprovided iron prophylactically to some infants butnot others. No consistent pattern of results hasemerged from the 3 published preventive trials infull-term healthy infants,11–13 and some method-ologic issues have become apparent. The period ofiron supplementation has varied, and no study hasascertained that infants were free of iron-deficiencyanemia before entering the trial. Studies have fo-cused on global developmental scores, which neitherpredict later functioning14 nor assess specific pro-cesses that might be affected by iron deficiency dur-ing early development. Furthermore, large samplesare required to detect effects, because there is yetlittle indication that overall development is poorer iniron deficiency without anemia. A recent editorialconcluded that the “jury is still out” and “large trials
From the *Center for Human Growth and Development and Department ofPediatrics and Communicable Diseases, University of Michigan, Ann Ar-bor, Michigan; ‡Psychology Unit, Institute of Nutrition and Food Technol-ogy, University of Chile, Santiago, Chile; §Department of Curriculum,Instruction, and Leadership, Oakland University, Rochester, Michigan; �He-matology Unit, Institute of Nutrition and Food Technology, University ofChile, Santiago, Chile; and ¶Department of Environmental and Occupa-tional Health, School of Public Health, Faculty of Medicine, University ofChile, Santiago, Chile.Received for publication Mar 3, 2002; accepted Jan 13, 2003.Reprint requests to (B.L.) Center for Human Growth and Development, 300N Ingalls, University of Michigan, Ann Arbor, MI 48109-0406. E-mail:[email protected] (ISSN 0031 4005). Copyright © 2003 by the American Acad-emy of Pediatrics.
846 PEDIATRICS Vol. 112 No. 4 October 2003 at N/A on February 15, 2012pediatrics.aappublications.orgDownloaded from
of both iron supplementation in infants and irontreatment in children with iron deficiency aneamiaare urgently needed.”15
The purpose of this study was to determine thebehavioral and developmental effects of preventingiron-deficiency anemia in healthy full-term infants.We predicted that iron supplementation effective inreducing iron-deficiency anemia would also result inbetter behavioral and developmental outcome. Thestudy was designed so that the iron-supplementedgroup corresponded to the recommendations of theAmerican Academy of Pediatrics (breastfeeding anduse of supplemental iron or iron-fortified formulauntil 12 months of age). In a preliminary analysis ofdevelopmental test scores only, there were no differ-ences between infants who did or did not receiveadditional iron.16 When all outcomes were examinedin this final analysis, the iron-supplemented groupperformed better in every domain except global testscores.
METHODS
Overall DesignThe study was initially designed to be a double-blind, random-
ized, controlled trial comparing the behavioral and developmentaleffects of iron supplementation and no-added iron. However,unforeseen circumstances related to funding and secular changesin infant feeding affected the design such that the study could notbe the randomized, controlled trial planned.17 When the studystarted, many Chilean infants were weaned from the breast by 6months. Therefore, infant formula was the vehicle for supplemen-tation, but, to avoid interference with breastfeeding, we plannedon enrolling only those infants who had started to receive somecow milk or formula by 6 months of age. To conduct the study inthe face of a 25% budget cut, we sought to have infant formuladonated; Abbott-Ross Laboratories generously agreed. Becauseno-iron formula was no longer made, the study started with alow-iron condition instead of the no-added-iron condition origi-
nally planned. Study infants were randomly assigned to high- orlow-iron formula (12 mg/L or an average of 2.3 mg/L, respective-ly). Part way through the study, we made the unexpected obser-vation that the amount of iron in the low-iron formula was suffi-cient to prevent iron-deficiency anemia, although the infants’ ironstatus was not as good as those on high-iron formula.18 We alsoobserved that breastfeeding had increased in the community as aresult in part of a highly effective national campaign to encouragebreastfeeding.
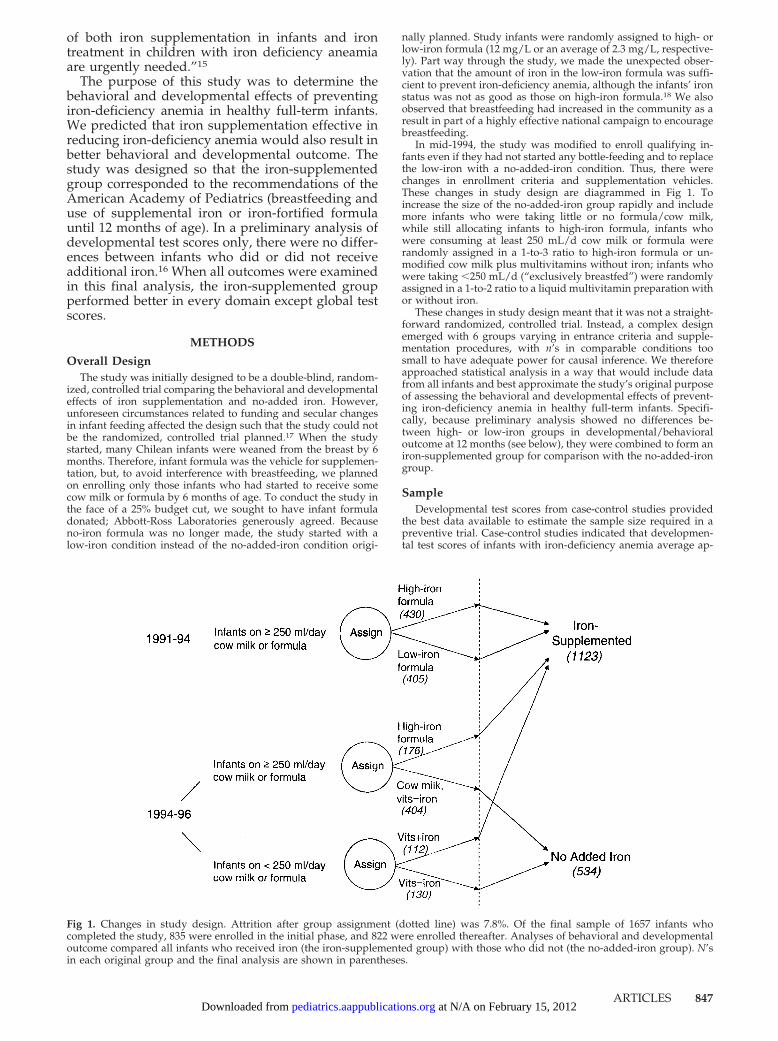
In mid-1994, the study was modified to enroll qualifying in-fants even if they had not started any bottle-feeding and to replacethe low-iron with a no-added-iron condition. Thus, there werechanges in enrollment criteria and supplementation vehicles.These changes in study design are diagrammed in Fig 1. Toincrease the size of the no-added-iron group rapidly and includemore infants who were taking little or no formula/cow milk,while still allocating infants to high-iron formula, infants whowere consuming at least 250 mL/d cow milk or formula wererandomly assigned in a 1-to-3 ratio to high-iron formula or un-modified cow milk plus multivitamins without iron; infants whowere taking �250 mL/d (“exclusively breastfed”) were randomlyassigned in a 1-to-2 ratio to a liquid multivitamin preparation withor without iron.
These changes in study design meant that it was not a straight-forward randomized, controlled trial. Instead, a complex designemerged with 6 groups varying in entrance criteria and supple-mentation procedures, with n’s in comparable conditions toosmall to have adequate power for causal inference. We thereforeapproached statistical analysis in a way that would include datafrom all infants and best approximate the study’s original purposeof assessing the behavioral and developmental effects of prevent-ing iron-deficiency anemia in healthy full-term infants. Specifi-cally, because preliminary analysis showed no differences be-tween high- or low-iron groups in developmental/behavioraloutcome at 12 months (see below), they were combined to form aniron-supplemented group for comparison with the no-added-irongroup.
SampleDevelopmental test scores from case-control studies provided
the best data available to estimate the sample size required in apreventive trial. Case-control studies indicated that developmen-tal test scores of infants with iron-deficiency anemia average ap-
Fig 1. Changes in study design. Attrition after group assignment (dotted line) was 7.8%. Of the final sample of 1657 infants whocompleted the study, 835 were enrolled in the initial phase, and 822 were enrolled thereafter. Analyses of behavioral and developmentaloutcome compared all infants who received iron (the iron-supplemented group) with those who did not (the no-added-iron group). N’sin each original group and the final analysis are shown in parentheses.
ARTICLES 847 at N/A on February 15, 2012pediatrics.aappublications.orgDownloaded from
proximately 10 points lower than scores of infants with better ironstatus. If the prevalence of iron-deficiency anemia in an unsupple-mented population were 20% to 25%, as is often the case inotherwise healthy, well-nourished infants, then iron supplemen-tation could conceivably prevent lower scores in 1 of every 4 or 5infants. Considering that test scores for this 20% to 25% wouldotherwise be approximately 10 points lower, the mean for thesupplemented group overall would be 2 to 2.5 points higher thanthe unsupplemented group. These considerations guided thestudy, which was originally designed to have sufficient power todetect a group difference of 2 points, requiring a total sample of3200 infants. Enrollment was stopped when the sample size wassufficient to have 90% power to detect a 2.5-point difference indevelopmental test scores. A total of 1657 infants completed thestudy.
The study was conducted between September 1991 and August1996 in 4 contiguous working-class communities on the outskirtsof Santiago, Chile. Parasites causing blood loss, malaria, hemoglo-binopathies, and high lead levels were almost nonexistent. All but8 infants were initially breastfed. Clinics distributed unmodifiedpowdered milk as part of a legally required and highly effectiveprogram for preventing generalized undernutrition. Screening in-fants for anemia was not a regular part of pediatric care, androutine iron supplementation was not the policy in Chile at thetime.
Infants who received their usual health care at the communityclinics were carefully screened to enroll healthy infants who didnot have iron-deficiency anemia at 6 months (Table 1). The fol-lowing entrance criteria were used: birth weight �3.0 kg, single-ton term birth, routine vaginal delivery, no major congenitalanomalies, no major perinatal complications, no phototherapy, nohospitalization for longer than 5 days, no chronic illness, and noiron therapy. The 3.0-kg birth weight cutoff was used becausesome clinics had a preexisting program providing iron to infantswho weighed �3 kg. Exclusion criteria were residence outside theneighborhoods; another infant �12 months in the household;infant in child care; illiterate or psychotic caregiver or no stablecaregiver available to accompany the child for appointments; and,until mid-1994, “exclusive” breastfeeding, defined as �250 mL/dcow milk or formula. Refusal/dropout before group assignmenttotaled 6.0%. Attrition after group assignment was 7.8%. Therewere no differences between those who did or did not completethe study in infant characteristics (birth weight, gestational age,sex, growth, and temperament), family characteristics (householdsize, father absence, parental education, maternal depressedmood, and Home Observation for Measurement of the Environmentscore), or group assignment.
Procedures
Hematology and Supplementation
Infants were screened to prevent those with iron-deficiencyanemia from entering the study. Fingerstick hemoglobin levelswere determined at 5 to 6 months by HemoCue (Leo Diagnostics,Helsingborg, Sweden). A venipuncture to document iron status(7–10 mL of blood) was promptly performed for HemoCue values�103 g/L. Anemia at 6 months was defined as a venous hemo-globin �100 g/L. Iron deficiency was defined as 2 of 3 abnormaliron measures (mean cell volume �70 fl, erythrocyte protopor-phyrin �100 �g/dL red blood cells [1.77 �mol/L], serum ferritin�12 �g/L). Infants with iron deficiency anemia at 6 months weretreated with oral iron and did not enter the trial.
Formula/milk was provided in powdered form in identicalcans and vitamins in identical bottles, distinguished only by labelswith different numbers (several for each condition), which wereplaced by laboratory personnel who had no contact with familiesor fieldworkers. At clinic visits, personnel used lists of predeter-mined, randomly generated numbers to give participating infantsthe next available milk/vitamin number appropriate for the in-fant’s feeding method. Consumption was verified at weekly homevisits and monthly clinic appointments.
Infants received monthly pediatric check-ups and growth mea-surements. Project physicians were instructed to make clinicaljudgments as if infants were not in a study. Thus, if doctors wereconcerned that an infant might be anemic, then they were torequest a blood test and/or treat the infant. No infant was elimi-nated for this reason. All infants received a venipuncture at 12months for determination of iron status. The criterion for irondeficiency was the same as at 6 months, but the cutoff for anemiaat 12 months was a hemoglobin level �110 g/L. Infants withiron-deficiency anemia were treated with oral iron. Blood leadlevels were measured in the last 331 study infants. The mean leadlevel was 7.8 � 0.2 �g/dL, with no statistically significant differ-ences between groups and no significant negative correlation withdevelopmental/behavioral outcomes.
Continuity of pediatric care, monthly check-ups, and testing foranemia before and after the trial provided infants with consider-ably closer monitoring than they would otherwise have received.Study participants were given formula or milk, vitamins, pediatriccare, study tests and evaluations, and transportation free ofcharge. The study was approved by the appropriate InstitutionalReview Boards of the University of Michigan, University of Chile,and the National Institutes of Health Office of Protection FromResearch Risks.
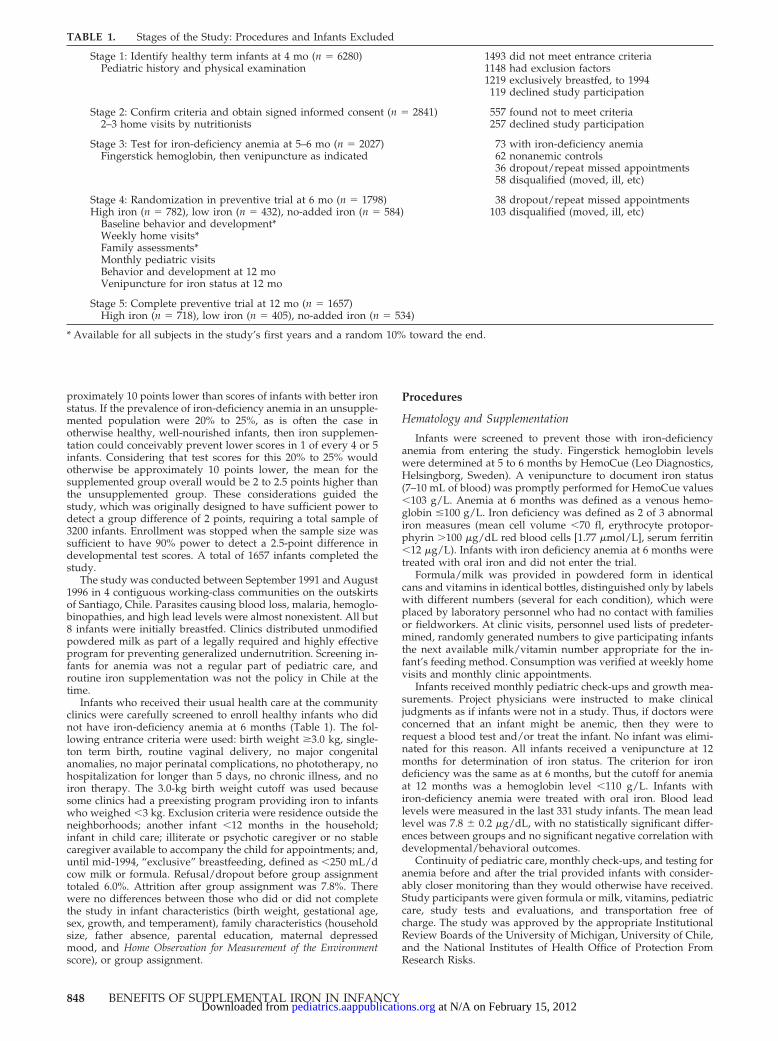
TABLE 1. Stages of the Study: Procedures and Infants Excluded
Stage 1: Identify healthy term infants at 4 mo (n � 6280) 1493 did not meet entrance criteriaPediatric history and physical examination 1148 had exclusion factors
1219 exclusively breastfed, to 1994119 declined study participation
Stage 2: Confirm criteria and obtain signed informed consent (n � 2841) 557 found not to meet criteria2–3 home visits by nutritionists 257 declined study participation
Stage 3: Test for iron-deficiency anemia at 5–6 mo (n � 2027) 73 with iron-deficiency anemiaFingerstick hemoglobin, then venipuncture as indicated 62 nonanemic controls
36 dropout/repeat missed appointments58 disqualified (moved, ill, etc)
Stage 4: Randomization in preventive trial at 6 mo (n � 1798) 38 dropout/repeat missed appointmentsHigh iron (n � 782), low iron (n � 432), no-added iron (n � 584) 103 disqualified (moved, ill, etc)
Baseline behavior and development*Weekly home visits*Family assessments*Monthly pediatric visitsBehavior and development at 12 moVenipuncture for iron status at 12 mo
Stage 5: Complete preventive trial at 12 mo (n � 1657)High iron (n � 718), low iron (n � 405), no-added iron (n � 534)
* Available for all subjects in the study’s first years and a random 10% toward the end.
848 BENEFITS OF SUPPLEMENTAL IRON IN INFANCY at N/A on February 15, 2012pediatrics.aappublications.orgDownloaded from

Behavioral and Developmental AssessmentsFor characterizing infant behavior and development at group
assignment, the Fagan Test of Infant Intelligence14 and a measureof temperament19 were administered. Toward the end of thestudy, these measures could be obtained only for a randomlyselected 10% because of lack of funds. N�s for the Fagan test andtemperament measure were 1039 and 1357, respectively. Overalldevelopmental outcomes at 12 months were the Mental Develop-mental Index and Psychomotor Developmental Index of the Bay-ley Scales of Infant Development.20 The Fagan test provided spe-cific cognitive outcome measures at 12 months. Behavioraloutcome measures were derived from the Behavior Rating Scale.21
Data on the age of crawling and walking were collected prospec-tively during weekly home visits between 6 and 12 months untilthe latter part of the study when this labor-intensive aspect couldno longer be supported. Motor milestone data were available for967 infants.
Other AspectsInformation on family background included household com-
position, parental education and occupation, other indicators ofsocioeconomic status,22 maternal depressed mood,23 maternalIQ,24 life stresses,25 stimulation in the home,26 and so forth. Dataon parental education were available for the entire sample, buttoward the end of the study, some of these measures could beobtained only for a randomly selected 10%. Even for measuressubjected to sampling, n’s averaged well over 1000 (range: 995-1379). There were no significant differences in family backgroundbetween infants with and without complete background data.Nutritionists conducted the socioeconomic evaluation in the homeafter study criteria were confirmed. Weekly measures of feedingwere obtained by fieldworkers. Psychologists conducted otherassessments of the mother and the family and all infant evalua-tions. Personnel were specially trained and standardized for per-forming each measurement (�80% interrater reliability).
Data AnalysisStatistical analyses followed the general linear model for con-
tinuous variables, using multiple regression to control for back-ground factors. Analysis of categorical variables used the �2 testand logistic regression. The effect of missing background data onanalysis of outcomes controlling for family factors was minimizedby 2 data analytic strategies. In regression analyses, pairwisedeletion of missing data was used in the covariance matrix to useall available data. For analyses that did not allow this strategy, wemaximized relevant information by constructing a composite offamily background data using factor analysis weighting and avail-able-data mean combination, dividing by the number of itemsavailable. An � level of 0.05 was used in tests of statistical signif-icance.
We previously reported that the high- and low-iron groups upto the 1994 change in enrollment criteria were comparable inbackground and the prevalence of iron-deficiency anemia at 12months (2.8% vs 3.8%, n � 430 and 405, respectively) but differedin the proportion with iron deficiency overall (39% vs 20%).18
(This difference provides good evidence that the infants actuallytook the assigned formula and that the high-iron formula had theexpected effect of improving iron status more than low-iron for-mula.) Because the high- and low-iron groups differed with re-spect to iron deficiency and the effects of iron deficiency withoutanemia are still unclear, a preliminary step in data analysis was todetermine whether there were any differences in behavior anddevelopment. The groups were similar at baseline except for anisolated difference in temperament: infants in the low-iron groupwere considered to be slightly less adaptable. There were nostatistically significant differences on any behavioral or develop-mental outcome measure at 12 months. Another preliminary stepwas to compare infants who were enrolled before and after thechanges in study design of July 1994. This analysis was based oninfants who were assigned to the high-iron condition, as this wasthe only group with enrollment before and after the changes.Other than anticipated differences in feeding, there were no dif-ferences in infant or family characteristics. Therefore, the high-and low-iron groups were combined for comparison with theno-added-iron group.
RESULTS
Final Study GroupsThe final study groups, totaling 1657 infants, were
similar in most family background and infant char-acteristics (Table 2). However, they differed in feed-ing as expected, with the most intense breastfeedingin the no-added-iron group. At the outset, infants inthe no-added-iron group were advantaged in otherways as well. They weighed 50 g more at birth, werebigger at study entry, and had slightly higher screen-ing hemoglobin levels. They were considered bytheir mothers to be slightly less difficult and unpre-dictable. Their mothers had somewhat fewer symp-toms of depression, and their homes were slightlymore stimulating. All background factors, includingthese differences, were controlled statistically.
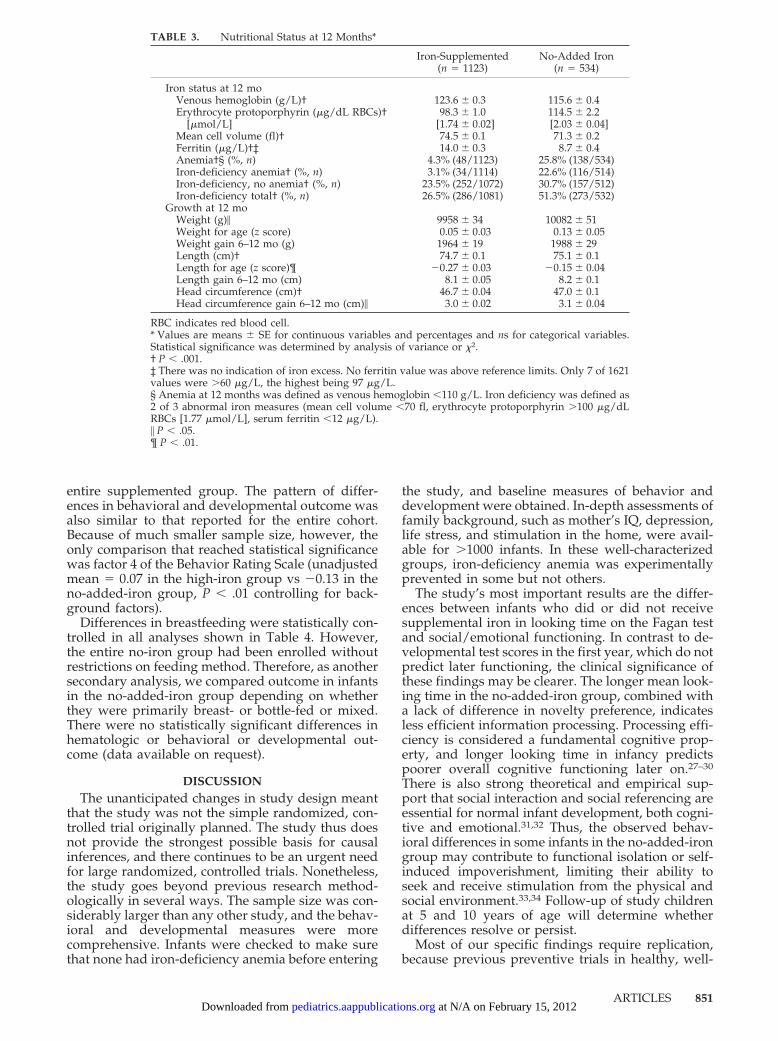
Nutritional OutcomeIn keeping with larger size at birth and 6 months,
infants in the no-added-iron group remained largerat 12 months. Differences in gain in weight or lengthduring the study did not reach statistical signifi-cance, but the increase in head circumference wassignificantly greater. There were dramatic differ-ences in iron status. Iron-deficiency anemia waspresent in 3.1% and 22.6% of the iron and no-added-iron groups, respectively. Iron deficiency (with orwithout anemia) was observed in 26.5% and 51.3%,respectively. There was no indication of iron excessin iron-supplemented infants (see Table 3).
Behavioral and Developmental OutcomeTable 4 compares iron-supplemented and un-
supplemented infants, showing adjusted means onoutcome measures after control for the set of back-ground variables in Table 2. There were no signifi-cant differences in mental or motor test scores at 12months. On the Fagan test, there was a significanteffect of iron supplementation on looking time (thetime infants looked at pairs of novel and familiarpictures). Infants who did not receive iron lookedlonger, on average, controlling for looking time at 6months in addition to background factors. Therewere no group differences in novelty preference.
There was a significant effect of iron supplemen-tation on the age of crawling or creeping. Unsupple-mented infants crawled a bit later, on average, thaninfants who received iron supplementation. Differ-ences in the exact age at walking could not be deter-mined, because fewer than half of the sample werewalking at study conclusion.
On the Behavior Rating Scale, there were signifi-cant effects of supplementation on 2 of 4 factorsgenerated by a factor analysis of the Chile data (Ta-ble 4). Analysis of individual scales in factors withoverall differences revealed the following: higherproportions of unsupplemented infants were ratedas showing no positive affect, no attempt to interactsocially, and no reference to others’ reactions to testmaterials/no bids for help; more of them were ratedas very “adaptable,” ie, readily relinquishing testmaterials and accepting new ones more than half thetime. Of the 5 scales that did not fit into any factor,
ARTICLES 849 at N/A on February 15, 2012pediatrics.aappublications.orgDownloaded from

there were significant effects of supplementation onSoothability and Tremulousness. A higher propor-tion of the no-added-iron group could not be soothedby words or objects when distressed. Thus, morerequired physical comforting or could not be soothedby any means. There was no difference in the pro-portion showing upset or distress. More of the un-supplemented group was rated as tremulous occa-sionally or more often during the test.
Secondary AnalysesAll comparisons were repeated for the subset of
study infants who were randomly assigned to high-
or no-added-iron groups after the changes in studydesign of mid-1994 (n � 288 and 534, respectively).There were no differences in background character-istics except expected differences in breastfeeding asa result of the disproportionate assignment proce-dure (see “Overall Design”). The subsets were com-parable in baseline temperament and novelty prefer-ence, but the high-iron group had longer lookingtimes on the Fagan test on study entry at 6 months(2.00 � 0.06 seconds vs 1.86 � 0.04 seconds in theno-iron group, F(1379) � 4.08, P � .05). At 12 months,the hematology results showed the same markeddifferences in iron status reported above using the
TABLE 2. Background Characteristics*
Iron-Supplemented(n � 1123)
No-Added Iron(n � 534)
InfantSex (% male, n) 51.8% (582/1123) 54.5% (291/534)Birth weight (g)† 3525 � 11 3580 � 16Gestational age (wk) 39.4 � 0.03 39.5 � 0.05Feeding
Age first bottle (mo)‡ 3.01 � 0.08 4.63 � 0.14Age off breast if weaned (mo)‡ 4.97 � 0.12 5.84 � 0.20Nursing at 1 y‡ (%, n) 27.6% (813/1123) 44.4% (237/534)Formula/milk intake (mL/d)‡§ 569.9 � 7.2 403.9 � 10.8
Fagan Test of Infant Intelligence at 6 moNovelty preference (%) 62.1% � 0.2 61.9% � 0.4Mean looking time (seconds) 1.93 � 0.03 1.86 � 0.04
Temperament at 6 moDifficult� 19.6 � 0.2 18.9 � 0.3Dull 7.7 � 0.1 7.4 � 0.1Unadaptable 11.8 � 0.2 11.2 � 0.3Unpredictable� 8.5 � 0.1 8.1 � 0.2
Growth at 6 moWeight (g) � 7984 � 26 8092 � 40Weight for age (z score)† 0.39 � 0.03 0.52 � 0.04Length (cm)† 66.6 � 0.1 66.9 � 0.1Length for age (z score)† �0.22 � 0.02 �0.08 � 0.04Head circumference (cm) 43.7 � 0.04 43.8 � 0.06
HemoCue at 6 mo (g/L)‡ 113.5 � 0.3 115.1 � 0.4Family¶
Social class index �# 28.1 � 0.2 27.3 � 0.3No. of people in household� 5.4 � 0.1 5.1 � 0.1No. of children for mother 2.1 � 0.04 2.1 � 0.06Father absent (%, n) 14.9% (146/983) 16.1% (62/386)Household head’s education (y) 8.8 � 0.1 8.9 � 0.1Mother’s education (y) 9.3 � 0.1 9.2 � 0.1Mother’s age (y) 26.8 � 0.2 26.5 � 0.3Mother’s IQ** 83.8 � 0.3 83.8 � 0.6Maternal depressed mood� 16.8 � 0.4 14.7 � 0.9Maternal smoking (%, n)‡†† 19.7% (193/980) 29.1% (112/385)Number of stressors in past year 4.8 � 0.1 4.7 � 0.2Stimulation in the home† 30.3 � 0.2 31.4 � 0.4
* Values are means � SE for continuous variables and percentages and n’s for categorical variables.Sample size varied as a result of reduced administration of baseline behavior and family measurestoward the end of the study (see text and footnote, Table 1). Statistical significance (P � .05) wasdetermined by analysis of variance or �2.Significant differences between groups are indicated as follows: † P � .01, ‡ P � .001.§ Values are the average daily intake throughout the study. This variable, which was inverselycorrelated with each of the 3 measures of breastfeeding, provided a single index reflecting the extentof breastfeeding.� P � .05.¶ The mother provided information for 94% of the infants.# Higher scores on the Graffar,22 a widely-used Chilean measure of socioeconomic status, indicatepoorer conditions even within lower- to lower-middle-class samples.** Four subscales of the Wechsler Adult Intelligence Scale–Revised were administered.†† Maternal smoking and alcohol or drug use were infrequent and low in intensity. Eighty percent ofmothers who smoked reported 1–5 cigarettes/day, 17% reported 6–10 cigarettes/day, and only 3%smoked �10 cigarettes/day. No mother reported using illicit drugs. Thirty mothers reported con-suming alcoholic beverages, with only 3 having more than 1 drink/week. Data on these behaviorsduring pregnancy were not available.
850 BENEFITS OF SUPPLEMENTAL IRON IN INFANCY at N/A on February 15, 2012pediatrics.aappublications.orgDownloaded from
entire supplemented group. The pattern of differ-ences in behavioral and developmental outcome wasalso similar to that reported for the entire cohort.Because of much smaller sample size, however, theonly comparison that reached statistical significancewas factor 4 of the Behavior Rating Scale (unadjustedmean � 0.07 in the high-iron group vs �0.13 in theno-added-iron group, P � .01 controlling for back-ground factors).
Differences in breastfeeding were statistically con-trolled in all analyses shown in Table 4. However,the entire no-iron group had been enrolled withoutrestrictions on feeding method. Therefore, as anothersecondary analysis, we compared outcome in infantsin the no-added-iron group depending on whetherthey were primarily breast- or bottle-fed or mixed.There were no statistically significant differences inhematologic or behavioral or developmental out-come (data available on request).
DISCUSSIONThe unanticipated changes in study design meant
that the study was not the simple randomized, con-trolled trial originally planned. The study thus doesnot provide the strongest possible basis for causalinferences, and there continues to be an urgent needfor large randomized, controlled trials. Nonetheless,the study goes beyond previous research method-ologically in several ways. The sample size was con-siderably larger than any other study, and the behav-ioral and developmental measures were morecomprehensive. Infants were checked to make surethat none had iron-deficiency anemia before entering
the study, and baseline measures of behavior anddevelopment were obtained. In-depth assessments offamily background, such as mother’s IQ, depression,life stress, and stimulation in the home, were avail-able for �1000 infants. In these well-characterizedgroups, iron-deficiency anemia was experimentallyprevented in some but not others.
The study’s most important results are the differ-ences between infants who did or did not receivesupplemental iron in looking time on the Fagan testand social/emotional functioning. In contrast to de-velopmental test scores in the first year, which do notpredict later functioning, the clinical significance ofthese findings may be clearer. The longer mean look-ing time in the no-added-iron group, combined witha lack of difference in novelty preference, indicatesless efficient information processing. Processing effi-ciency is considered a fundamental cognitive prop-erty, and longer looking time in infancy predictspoorer overall cognitive functioning later on.27–30
There is also strong theoretical and empirical sup-port that social interaction and social referencing areessential for normal infant development, both cogni-tive and emotional.31,32 Thus, the observed behav-ioral differences in some infants in the no-added-irongroup may contribute to functional isolation or self-induced impoverishment, limiting their ability toseek and receive stimulation from the physical andsocial environment.33,34 Follow-up of study childrenat 5 and 10 years of age will determine whetherdifferences resolve or persist.
Most of our specific findings require replication,because previous preventive trials in healthy, well-
TABLE 3. Nutritional Status at 12 Months*
Iron-Supplemented(n � 1123)
No-Added Iron(n � 534)
Iron status at 12 moVenous hemoglobin (g/L)† 123.6 � 0.3 115.6 � 0.4Erythrocyte protoporphyrin (�g/dL RBCs)† 98.3 � 1.0 114.5 � 2.2
[�mol/L] [1.74 � 0.02] [2.03 � 0.04]Mean cell volume (fl)† 74.5 � 0.1 71.3 � 0.2Ferritin (�g/L)†‡ 14.0 � 0.3 8.7 � 0.4Anemia†§ (%, n) 4.3% (48/1123) 25.8% (138/534)Iron-deficiency anemia† (%, n) 3.1% (34/1114) 22.6% (116/514)Iron-deficiency, no anemia† (%, n) 23.5% (252/1072) 30.7% (157/512)Iron-deficiency total† (%, n) 26.5% (286/1081) 51.3% (273/532)
Growth at 12 moWeight (g)� 9958 � 34 10082 � 51Weight for age (z score) 0.05 � 0.03 0.13 � 0.05Weight gain 6–12 mo (g) 1964 � 19 1988 � 29Length (cm)† 74.7 � 0.1 75.1 � 0.1Length for age (z score)¶ �0.27 � 0.03 �0.15 � 0.04Length gain 6–12 mo (cm) 8.1 � 0.05 8.2 � 0.1Head circumference (cm)† 46.7 � 0.04 47.0 � 0.1Head circumference gain 6–12 mo (cm)� 3.0 � 0.02 3.1 � 0.04
RBC indicates red blood cell.* Values are means � SE for continuous variables and percentages and ns for categorical variables.Statistical significance was determined by analysis of variance or �2.† P � .001.‡ There was no indication of iron excess. No ferritin value was above reference limits. Only 7 of 1621values were �60 �g/L, the highest being 97 �g/L.§ Anemia at 12 months was defined as venous hemoglobin �110 g/L. Iron deficiency was defined as2 of 3 abnormal iron measures (mean cell volume �70 fl, erythrocyte protoporphyrin �100 �g/dLRBCs [1.77 �mol/L], serum ferritin �12 �g/L).� P � .05.¶ P � .01.
ARTICLES 851 at N/A on February 15, 2012pediatrics.aappublications.orgDownloaded from

TABLE 4. Iron Supplement Versus No-Added Iron: Behavioral and Developmental Outcome at 12 Months*
Iron-Supplemented
(n � 1082)
No-Added-Iron(n � 531)
Significant Background Variables
Age at testing (wk) 50.9 � 0.1 50.8 � 0.1Bayley Scales of Infant Development†
Mental Development Index 103.9 � 0.4 104.6 � 0.9 Number in household, birth weight, sex,gestational age, temperament “dull,” %novelty at 6 mo, extent breastfeeding,maternal education and IQ, HOME
Psychomotor Development Index 96.7 � 0.5 97.5 � 1.1 Gestational age, temperament “dull” or“difficult,” % novelty at 6 mo, numberin household, HOME, social class index
Fagan Test of Infant IntelligenceNovelty preference (%) 62.3 � 0.2 62.7 � 0.5Mean looking time (seconds)‡ 1.39 � 0.02 1.46 � 0.04 Number in household, sex, looking time at
6 mo, social class index, maternal IQ,head circumference gain
Age of crawling (days)‡ 297.7 � 2.0 303.0 � 4.9 Temperament “dull,” % novelty at 6 mo,maternal education, number inhousehold, HOME, education head ofhousehold
Behavioral Rating Scale§Factor 1 (Energy, Interest, Initiative,
Exploration, Attention, Persistence,Enthusiasm, Fearfulness)
�0.03 � 0.03 0.04 � 0.08 Sex, gestational age, temperament“difficult,” maternal IQ, HOME, socialclass index
Factor 2 (Gross-Motor, Fine-Motor,Movement Control, Hypotonicity, SlowMovement)
�0.01 � 0.03 0.06 � 0.08 Sex, gestational age, father absent,maternal IQ, number in household,temperament “difficult,” extentbreastfeeding
Factor 3� (Negative Affect, Hypersensitivity,Adaptation, Frustration, Orientation,Cooperation)
�0.05 � 0.03 0.12 � 0.08 Gestational age, maternal depressed mood
Factor 4� (Positive Affect, Social Referencing,Social Engagement)
0.05 � 0.03 �0.21 � 0.07 Sex, gestational age, temperament“unadaptable,” extent breastfeeding
Significant items in factors with overalldifferences (%, n for items in Factors 3and 4)
Resists change � 50% of time¶ 20.3% (218/1075) 16.4% (87/530) Gestational ageNo positive affect‡ 8.1% (87/1075) 12.1% (64/531) Gestational age, number of childrenNo attempts to interact socially‡ 4.7% (51/1075) 8.5% (45/531) Extent breastfeeding, HOME, HemoCue at
6 moNo reference to others’ reactions� 7.8% (84/1075) 18.3% (97/531) Gestational age, extent breastfeeding
Significant items not in any factorCannot be soothed by words or objects¶ 16.3% (172/1053) 19.6% (104/531) Extent breastfeedingTremulous occasionally or more often§ 8.7% (91/1051) 11.7% (62/530)
HOME indicates Home Observation for Measurement of the Environment.* Values are adjusted means � SE for continuous variables and percentages and n’s for categorical variables. In view of baselinedifferences between groups in feeding, growth, and temperament and the well-documented importance of family characteristics, allfactors in Table 1 were included as covariates. Only 1 index for growth and 1 for breastfeeding were included, because anthropometryand feeding measures were intercorrelated within each set. Height-for-age z score at 6 months was used to control for growth at studyentry. The average daily amount of formula/milk consumed over the course of the trial was used to control for the extent of breastfeeding.Because the slight difference in increase in head circumference—the only change in growth between 6 and 12 mo to show a statisticallysignificant difference—this variable was also included as a covariate. Levels of statistical significance controlling for background variableswere determined by multiple regression for continuous variables and logistic regression for categorical ones. The n’s shown are for mentaland motor test scores and behavior ratings. For the Fagan test, ns for the iron-supplemented and no-added-iron groups were 1005 and480, respectively. Ns for age at crawling were lower (704 and 244, respectively) as a result of discontinuation of weekly home visits towardthe end of the study (see footnote, Fig 1).† The revised version of the Bayley Scales20 became available midway through the study. To maintain comparability of data throughout,the original Bayley Scales21 continued to be used for mental and motor testing.‡ P � .01.§ Factor analysis used varimax rotation with maximum likelihood estimation. The criteria for factors were an eigenvalue �1 and internalcorrelation among items �0.40. The factor analysis resulted in 4 factors (see Table 3 for constituent items) and 5 scales that did not fit inany factor (Soothability, Hypertonicity, Tremulousness, Frenetic Movement, and Hyperactivity). A rating of Social Referencing, althoughnot part of the final version of the Behavior Rating Scale,15 was included because of interest in affective alterations in early iron deficiency.Factor scores are shown as z scores � SE using the mean for the total sample as 0. When there was a significant effect of supplementationon an overall factor, the constituent scales were analyzed individually. Ratings on most scales were skewed, with abrupt breaks in thedistributions. We therefore also analyzed individual scales using a categorical approach similar to one developed for the Infant BehaviorRecord.35 The pattern of statistically significant results for uncovaried data was the same whether analyzed as continuous or categoricalvariables. Given the marked skew in distributions, the categorical approach was used in covariate analyses to determine levels ofstatistical significance. Ratings of state were treated separately, because state could affect all other ratings. Only 8% of children were ratedas drowsy on � 1–2 brief occasions during developmental testing (consequently with more state transitions as well). Analyses with andwithout these children yielded the same statistically significant differences. Results for the entire sample are reported.� P � .001.¶ P � .05.
852 BENEFITS OF SUPPLEMENTAL IRON IN INFANCY at N/A on February 15, 2012pediatrics.aappublications.orgDownloaded from

nourished infants have generally focused on globaltest scores. However, personal and social skills weremost affected in 1 such trial,12 and earlier case-con-trol studies have reported more iron-deficient infantsto be solemn, wary, hesitant, and so forth,34 (also seereview8). These findings are congruent with our re-sults. The lack of differences in global measures isnot surprising. With screening at study entry, noinfant had iron-deficiency anemia for �6 months—ashort time in which to have an impact on overalldevelopmental test scores. Furthermore, lower testscores have not been consistently observed in otherpreventive trials,11–13 and most infants in case-con-trol studies have been older.8
The assignment procedures produced groups gen-erally comparable in family background, making itunlikely that poorer outcome in the unsupplementedgroup was attributable to environmental disadvan-tage. If anything, this group started the study withslight advantages (in growth, temperament, breast-feeding, initial hemoglobin level, maternal depres-sion, and stimulation in the home), yet the groupfinished the study disadvantaged in cognitive pro-cessing, behavior, and motor function. Nonetheless,it should be noted that differences are at the grouplevel and relatively small in magnitude.
All infants received vitamins, but infants on for-mula received additional micronutrients, relative tothose receiving cow milk. Had the entire no-added-iron group been on cow milk, differences betweencow milk and formula might have contributed to ourresults. However, the no-added-iron group includedmany predominantly breastfed infants, who alsoshowed altered behavior and development. It thus isunlikely that the findings are explained primarily bya difference between cow milk and formula.
Although more studies of basic processes areneeded, recent research on iron deficiency and thedeveloping brain (and brain/behavior relationsmore generally) makes it possible to postulate plau-sible mechanisms for the observed effects. This bodyof research and our related speculations are brieflysummarized to stimulate hypothesis-driven studiesin the future. Iron is required for many relevantcentral nervous system processes, the most studiedbeing myelination and dopaminergic functioning(see reviews36,37). It seems logical that systems thatrapidly myelinate during the period of iron defi-ciency might be especially vulnerable. Recent re-search has provided direct evidence of this by dem-onstrating altered transmission in both the auditoryand the visual systems in children who had iron-deficiency anemia in infancy.38–42 A delay in visualprocessing (at the level of the optic pathway or itsintracerebral connections) could result in longerlooking times on the Fagan test, because infants wereexpected to discriminate between novel and familiarpictures rapidly and repeatedly. A somewhat laterage at crawling could also be congruent with a delayor disruption in myelination. However, we are notsuggesting that a week difference in the age of crawl-ing is clinically important.
Early iron deficiency also adversely affects dopa-minergic neurotransmission.36,37 Among many other
functions, dopamine is involved in broad systemsinfluencing behavioral activation and behavioral in-hibition and plays an important role in the degree towhich individuals experience inherent reward.43 Thebehavioral differences in the no-added-iron groupseem to indicate less positive responsiveness to thephysical and social environment. Even the seeminglyparadoxical finding that a greater proportion of theunsupplemented group was very “adaptable” couldmean that the infants did not find toys/objects suf-ficiently interesting to resist relinquishing them. So-cial referencing (joint attention), which showed thebiggest difference, is a specific process rapidlyemerging in the latter part of the first year, the periodof iron deficiency in this study, and thus might beparticularly affected. Social referencing provides thescaffolding for early learning from the physical andsocial environment.32 Altered dopaminergic func-tioning is also a known factor in extraneous motormovements, such as tremor. Tremor, which has notpreviously been assessed in early iron deficiency,was observed in more of the no-added-iron group.
It is also possible that other nonspecific, subtledifferences contributed to the observed alterations.Although oxygen-carrying capacity and energy me-tabolism have not been found to be affected untilhemoglobin levels drop considerably lower thanthose observed in this study, even slight increases infeeling unwell or fatigability could be manifested inless positive affect, less engagement, slower informa-tion processing, and so forth. Regardless of the spe-cific mechanisms for direct effects of iron deficiencyon central nervous system development, research inanimal models indicates that behaviors that limitinput from the physical and social environment pro-duce secondary effects on brain structure and func-tion.44,45
CONCLUSIONSUsing specific functionally relevant measures in a
large sample, we demonstrated effects of iron sup-plementation on information processing, social/emotional behavior, and motor function. The study’sspecific results require replication in future random-ized, controlled trials,46 and more research on under-lying mechanisms is needed. It should also be notedthat many infants throughout the world have poorerhealth and nutrition than infants in this study. Effectsof iron supplementation might differ among infantsin less optimal condition. These cautions notwith-standing, this study shows that healthy full-terminfants may receive behavioral and developmentalbenefits from iron supplementation in the first yearof life.
ACKNOWLEDGMENTSThis study was supported by grants from the National Insti-
tutes of Health (HD14122 and HD33487). The low- and high-ironformula (Similac), powdered cow milk, and vitamins (Vidaylinwith and without iron) were donated by Abbott-Ross Laboratories(Columbus, OH).
We are grateful to Marisol Cayazzo and other project personnel(physicians, psychologists, home visitors, nutritionists, secretaries,drivers, research assistants, and other support staff) for compe-tence and dedication; to the project’s External Advisory Commit-
ARTICLES 853 at N/A on February 15, 2012pediatrics.aappublications.orgDownloaded from

tee (Peter Dallman, Ernesto Pollitt, Fernando Viteri, and Ray Yip)for expert advice and continued counsel and support; to EdwardNelson for critical comments on study design; to Joseph Camposfor thoughtful discussion about interpreting the results; to MichaelMoffatt for a draft diagram of the changes in study design; andespecially to the study families for commitment to the project.
REFERENCES1. Florentino RF, Guirriec RM. Prevalence of nutritional anemia in infancy
and childhood with emphasis on developing countries. In: Steckel A,ed. Iron Nutrition in Infancy and Childhood. New York, NY: Raven Press;1984:61–74
2. deMaeyer E, Adiels-Tegman M. The prevalence of anaemia in theworld. World Health Stat Q. 1985;38:302–316
3. Stoltzfus RJ. Defining iron-deficiency anemia in public health terms: atime for reflection. J Nutr. 2001;131:565S–567S
4. Dallman P. Upper limits of iron in infant formulas. J Nutr. 1989;119:1852–1855
5. Yip R, Reeves JD, Lonnerdal B, Keen CL, Dallman PR. Does ironsupplementation compromise zinc nutrition in healthy infants? Am JClin Nutr. 1985;42:683–687
6. Lonnerdal B. Trace element nutrition in infants. Am Rev Nutr. 1989;9:109–124
7. Pollitt E. Developmental sequel from early nutritional deficiencies: con-clusive and probability judgments. J Nutr. 2000;130:350S–353S
8. Grantham-McGregor S, Ani C. A review of studies on the effect of irondeficiency on cognitive development in children. J Nutr. 2001;131:649S–668S
9. Idjradinata P, Pollitt E. Reversal of developmental delays in iron-deficient anaemic infants treated with iron. Lancet. 1993;341:1–4
10. Felt BT, Lozoff B. Brain iron and behavior of rats are not normalized bytreatment of iron deficiency anemia during early development. J Nutr.1996;126:693–701
11. Moffatt MEK, Longstaffe S, Besant J, Dureski C. Prevention of irondeficiency and psychomotor decline in high risk infants through ironfortified infant formula: a randomized clinical trial. J Pediatr. 1994;125:527–534
12. Williams J, Wolff A, Daly A, MacDonald A, Aukett A, Booth IW. Ironsupplemented formula milk related to reduction in psychomotor de-cline in infants for inner city areas: randomised study. BMJ. 1999;318:693–698
13. Morley R, Abbott R, Fairweather-Tait S, MacFayden U, Sterman MB.Iron fortified follow on formula from 9 to 18 months improves ironstatus but not development or growth: a randomised trial. Arch DisChild. 1999;81:247–252
14. Fagan JF, Singer LT. Infant recognition memory as a measure of intel-ligence. In: Lipsitt LP, ed. Advances in Infancy Research. Norwood, NJ:Ablex; 1983:31–78
15. Logan S. Iron deficiency and developmental deficit: the jury is still out.BMJ. 1999;318:697–698
16. Lozoff B, De Andraca I, Walter T, Pino P. Does preventing iron-deficiency anemia (IDA) improve developmental test scores? PediatrRes. 1996;39:136A
17. Shadish W. Revisiting field experimentation: field notes for the future.Psychol Methods. 2002;7:3–18
18. Walter T, Pino P, Pizarro F, Lozoff B. Prevention of iron-deficiencyanemia: comparison of high- and low-iron formulas in term healthyinfants after six months of life. J Pediatr. 1998;132:635–640
19. Bates JE, Freeland CA, Lounsbury ML. Measurement of infant difficult-ness. Child Dev. 1979;50:794–803
20. Bayley N. Bayley Scales of Infant Development. New York, NY: ThePsychological Corporation; 1969
21. Bayley N. Bayley Scales of Infant Development. 2nd ed. San Antonio, TX:The Psychological Corporation; 1993
22. Alvarez M, Muzzo S, Ivanovic D. [Scale for measurement of socioeco-nomic level, in the health area]. Rev Med Chil. 1985;113:243–249
23. Radloff L. The CES-D Scale: a self-report depression scale for research inthe general population. Appl Psychol Meas. 1977;1:385–401
24. Wechsler D. Manual for the Wechsler Adult Intelligence Scale. New York,NY: The Psychological Corporation; 1955
25. Weinraub M, Wolf B. Stress, social supports and parent-childinteractions: similarities and differences in single-parent and two-parent families. In: Boukydis I, Zachariah CF, eds. Research on Supportfor Parents and Infants in the Postnatal Period. Norwood, NJ: Ablex;1987:114–135
26. Caldwell BM, Bradley RH. Home Observation for Measurement of theEnvironment, Revised Edition. Little Rock, AK: University of Arkansas;1984
27. Colombo J, Mitchell DW. Individual differences in early visualattention: fixation time and information processing. In: Colombo J,Fagen J, eds. Individual Differences in Infancy: Reliability, Stability, Predic-tion. Hillsdale, NJ: Erlbaum; 1990:193–227
28. Jacobson SW, Chiodo LM, Jacobson JL. Predictive validity of infantrecognition memory and processing speed to 7-year IQ in an inner-citysample. Infant Behav Dev. 1996;19:524
29. Detterman DK. What does reaction time tell us about intelligence? In:Vernon PA, ed. Speed of Information-Processing and Intelligence. Norwood,NJ: Ablex; 1987:177–200
30. Kail R. Processing speed, speech rate, and memory. Dev Psychol. 1992;28:899–904
31. Committee on Integrating the Science of Early Childhood Development.From Neurons To Neighborhoods: The Science of Early Childhood Develop-ment. Washington, DC: National Academy Press; 2000
32. Mundy P, Neal R. Neural plasticity, joint attention and a transactionalsocial-orienting model of autism. In: Glidden LM, ed. International Re-view of Research in Mental Retardation. New York, NY: Academic Press;2000:139–168
33. Strupp BJ, Levitsky DA. Enduring cognitive effects of early malnutri-tion: a theoretical reappraisal. J Nutr. 1995;125:2221S–2232S
34. Lozoff B, Klein NK, Nelson EC, McClish DK, Manuel M, Chacon ME.Behavior of infants with iron deficiency anemia. Child Dev. 1998;69:24–36
35. Wolf AW, Lozoff B. A clinically interpretable method for analyzing theBayley Infant Behavior Record. J Pediatr Psychol. 1985;10:199–214
36. Beard JL, Connor JR, Jones BC. Iron in the brain. Nutr Rev. 1993;51:157–170
37. Beard JL. Iron biology in immune function, muscle metabolism andneuronal functioning. J Nutr. 2001;131:568S–580S
38. Roncagliolo M, Garrido M, Walter T, Peirano P, Lozoff B. Evidence ofaltered central nervous system development in infants with iron defi-ciency anemia at 6 mo: delayed maturation of auditory brain stemresponses. Am J Clin Nutr. 1998;68:683–690
39. Algarin C, Peirano P, Garrido M, Pizarro F, Lozoff B. Iron deficiencyanemia in infancy: long-lasting effects on auditory and visual systemfunctioning. Pediatr Res. 2003;53–217-223
40. Li YY, Wang HM, Wang WG. The effect of iron deficiency anemia on theauditory brainstem response in infant. Natl Med J China. 1994;74:367–369
41. Sarici SU, Serdar MA, Dundaroz MR, et al. Brainstem auditory-evokedpotentials in iron-deficiency anemia. Pediatr Neurol. 2001;24:205–208
42. Sarici SU, Okutan V, Dundaroz MR, et al. The effect of iron supplemen-tation on visual-evoked potentials in infants with iron deficiency ane-mia. J Trop Pediatr. 2001;47:132–135
43. Depue RA, Collins PF. Neurobiology of the structure of personality:dopamine, facilitation of incentive motivation, and extraversion. BehavBrain Sci. 1999;22:491–569
44. Black JE, Jones TA, Nelson CA, Greenough WT. Neural plasticity anddeveloping brain. In: Alessi NE, Coyle JT, Harrison SI, Eth S, eds. TheHandbook of Child and Adolescent Psychiatry. New York, NY: John Wiley& Sons; 1998:31–53
45. Greenough WT, Black JE. Induction of brain structure by experience:substrates for cognitive development. In: Gunnar M, Nelson C, eds.Developmental Behavioral Neuroscience. The Minnesota Symposia on ChildPsychology. Vol 24. Hillsdale, NJ: Lawrence Erlbaum; 1992:155–200
46. Martins S, Logan S, Gilbert R. Iron therapy for improving psychomotordevelopment and cognitive function in children under the age of threewith iron deficiency anaemia (Cochrane Review). In: The Cochrane Li-brary, Issue 2, 2003. Oxford: Update Software
854 BENEFITS OF SUPPLEMENTAL IRON IN INFANCY at N/A on February 15, 2012pediatrics.aappublications.orgDownloaded from

ERRATUM
A numerical error occurred in the article by Lozoff et al, titled “Behavioral andDevelopmental Effects of Preventing Iron-Deficiency Anemia in Healthy Full-TermInfants,” that was published in the October 2003 issue of Pediatrics (2003;112:846–854). On page 850, Table 2, in the Iron-Supplemented column, the entry for Nursingat 1 y currently reads: “27.6% (813/1123).” It should read: “27.6% (310/1123).”
1853 at N/A on February 15, 2012pediatrics.aappublications.orgDownloaded from
2003;112;846Pediatricsand Paulina Pino
Betsy Lozoff, Isidora De Andraca, Marcela Castillo, Julia B. Smith, Tomas WalterHealthy Full-Term Infants
Behavioral and Developmental Effects of Preventing Iron-Deficiency Anemia in
ServicesUpdated Information &
mlhttp://pediatrics.aappublications.org/content/112/4/846.full.htincluding high resolution figures, can be found at:
References
ml#ref-list-1http://pediatrics.aappublications.org/content/112/4/846.full.htat:This article cites 32 articles, 11 of which can be accessed free
Citations
ml#related-urlshttp://pediatrics.aappublications.org/content/112/4/846.full.htThis article has been cited by 41 HighWire-hosted articles:
Rs)3Peer Reviews (PPost-Publication
http://pediatrics.aappublications.org/cgi/eletters/112/4/846Rs have been posted to this article 32 P
Subspecialty Collections
http://pediatrics.aappublications.org/cgi/collection/bloodBloodthe following collection(s):This article, along with others on similar topics, appears in
Errata
tmlhttp://pediatrics.aappublications.org/content/113/6/1853.full.hsee:An erratum has been published regarding this article. Please
Permissions & Licensing
mlhttp://pediatrics.aappublications.org/site/misc/Permissions.xhttables) or in its entirety can be found online at: Information about reproducing this article in parts (figures,
Reprints http://pediatrics.aappublications.org/site/misc/reprints.xhtml
Information about ordering reprints can be found online:
rights reserved. Print ISSN: 0031-4005. Online ISSN: 1098-4275.Grove Village, Illinois, 60007. Copyright © 2003 by the American Academy of Pediatrics. All and trademarked by the American Academy of Pediatrics, 141 Northwest Point Boulevard, Elkpublication, it has been published continuously since 1948. PEDIATRICS is owned, published, PEDIATRICS is the official journal of the American Academy of Pediatrics. A monthly
at N/A on February 15, 2012pediatrics.aappublications.orgDownloaded from