behavioral economics applied to energy demand … economics applied to energy demand analysis: a...
TRANSCRIPT
Behavioral Economics Applied to Energy Demand Analysis: A Foundation
October 2014
Independent Statistics & Analysis
www.eia.gov
U.S. Department of Energy
Washington, DC 20585

U.S. Energy Information Administration | Behavioral Economics Applied to Energy Demand Analysis i
This report was prepared by the U.S. Energy Information Administration (EIA), the statistical and analytical agency within the U.S. Department of Energy. By law, EIA’s data, analyses, and forecasts are independent of approval by any other officer or employee of the United States Government. The views in this report therefore should not be construed as representing those of the U.S. Department of Energy or other Federal agencies.

October 2014
U.S. Energy Information Administration | Behavioral Economics Applied to Energy Demand Analysis 1
Behavioral Economics Applied to Energy Demand Analysis: A Foundation Neoclassical economics has shaped our understanding of human behavior for several decades. While still an important starting point for economic studies, neoclassical frameworks have generally imposed strong assumptions, for example regarding utility maximization, information, and foresight, while treating consumer preferences as given or external to the framework. In real life, however, such strong assumptions tend to be less than fully valid. Behavioral economics refers to the study and formalizing of theories regarding deviations from traditionally-modeled economic decision-making in the behavior of individuals. The U.S. Energy Information Administration (EIA) has an interest in behavioral economics as one influence on energy demand.
Leidos Engineering, LLC (Leidos), previously known as Science Applications International Corporation (SAIC), conducted research on behavioral economics and energy demand, and reports the following in the contract report in Appendix A:
• “Research revealing that energy consumption can vary widely (by a factor of nearly three) among homes and households with nearly identical characteristics1,2
• Research revealing widespread and consistent disconnects between attitudes and behaviors regarding the importance of the impact of energy consumption on the environment and awareness regarding energy consumption or conservation behavior3
• A variety of papers and studies suggesting energy efficiency policies and program adjustments to address the implications of particular irrational behaviors and cognitive limitations, such as labeling schemes, framing of energy efficient choices as avoiding losses rather than making gains, replacing small value rebates with larger value lottery-based awards, among other tactics4
• Research suggesting that households that received reports regarding their consumption relative to neighbors were demonstrated to cut their usage by 2.5 percent, in a sustained manner.
• Research work suggesting that a large portion of subsidies for hybrid automobiles and solar panels go to free riders, who would have adopted the more energy efficient technology anyway.”
These above findings lend strong evidence to the need for the current National Energy Modeling System (NEMS) framework to continue keeping pace with either existing or developing best practices in energy economics with respect to consumer behavior.
There is substantial research interest within the government, academia, and trade organization communities in consumer behavior with respect to energy demand and efficiency, especially as program
1 Parker, Hoak, Meier, and Brown. “How Much Energy Are We Using? Potential of Residential Energy Demand Feedback Devices,” Proceedings of the 2006 Summer Study on Energy Efficiency in Buildings. American Council for an Energy Efficient Economy. Asilomar, CA. August 2006. 2 Socolow, R. H. “The Twin Rivers program on energy conservation in housing: Highlights and conclusions,” Saving Energy in the Home: Princeton’s Experiments at Twin Rivers. Cambridge, MA; Ballinger Publishing Company. 3 Logica Survey. (2007). Turning Concern into Action: Energy Efficiency and the European Consumer. 4 Allcott H. and Mullainathan S. “Behavioral Science and Energy Policy,” February 2010.

October 2014
U.S. Energy Information Administration | Behavioral Economics Applied to Energy Demand Analysis 2
funding targeting energy efficiency continues to increase. EIA hosted a technical workshop5 on behavioral economics and recently released a nationwide inventory providing detailed summaries of energy efficiency evaluation reports—commonly called evaluation, measurement, and verification (EM&V) reports6—on electricity and natural gas programs. Energy efficiency program budgets have rapidly expanded, and in many states now approach supply-side capital investment in scale. Behavior is commonly considered a key aspect of energy efficiency programs.7
A key finding of the contract report, reflecting expert input from the technical workshop as well as subsequent research, is that the implementation of the modeling structures in NEMS has an inherent tendency to relax key assumptions in the neoclassical framework. While this finding supports the current implementation of demand modeling in NEMS, experimentation with aggregate demand specifications remains warranted. Preliminary approaches are described in the report.
The contract report in Appendix A characterizes and defines behavioral economics with respect to energy economics and demand analysis, and helps to both inform the public and to provide the information and foundational concepts for potential enhancements in EIA’s statistical and modeling programs. When referencing the contract report in Appendix A, it should be cited as a report by Leidos Engineering, LLC prepared for the U.S. Energy Information Administration.
5 U.S. Energy Information Administration, Technical Workshop on Behavior Economics Presentations, accessed September 25, 2014. 6 U.S. Energy Information Administration, State Energy Efficiency Program Evaluation Inventory, accessed September 25, 2014. 7 For example the annual Behavior, Energy and Climate Change (BECC) conference co-hosted by Stanford University, American Council for an Energy-Efficiency Economy, and the University of California has documented an expanding set of related research. http://beccconference.org/archives/ accessed September 26, 2014.

October 2014
U.S. Energy Information Administration | Behavioral Economics Applied to Energy Demand Analysis 1
Appendix A

Final Analytic Report
Behavioral Economics Applied to Energy Demand Analysis Energy Information Administration
August 2014


Final Analytic Report
Behavioral Economics Applied to Energy Demand Analysis Energy Information Administration
August 2014

This report has been prepared for the use of the client for the specific purposes identified in the report. The conclusions, observations and recommendations contained herein attributed to Leidos constitute the opinions of Leidos. To the extent that statements, information and opinions provided by the client or others have been used in the preparation of this report, Leidos has relied upon the same to be accurate, and for which no assurances are intended and no representations or warranties are made. Leidos makes no certification and gives no assurances except as explicitly set forth in this report.
© 2014 Leidos, Inc. All rights reserved.
Analytic Report 4-2_20140822_FINAL.docx
Behavioral Economics Applied to Energy Demand Analysis
Energy Information Administration
Table of Contents
Table of Contents List of Tables
Section 1 OVERVIEW OF RESEARCH OBJECTIVES ..................................... 1-1 1.1 Understand Current State of Behavioral Economics Field ...................... 1-1 1.2 Prioritize Behavioral Factors that may Significantly Impact
Demand .................................................................................................... 1-2 1.3 Enhance the Quality of EIA Products through Improved
Representation of Consumer Behavior .................................................... 1-2 1.4 Maintain Relevancy and Consistency with Best Practices in
Energy Economics ................................................................................... 1-2 1.5 Enhance Capabilities to Support the Residential and Commercial
Demand Modules ..................................................................................... 1-3 1.6 Investigate and Experiment with Alternative Aggregate Demand
Specifications ........................................................................................... 1-3 1.6.1 "Sandbox" Approach ................................................................... 1-3
1.7 Emphasize Leveraging Existing EIA Framework to Infuse Behavioral Factors in Lieu of Wholesale Replacement ........................... 1-3
Section 2 BEHAVIORAL ECONOMICS BACKGROUND INFORMATION ....................................................................................................... 2-1
2.1 Definition of Behavioral Economics ....................................................... 2-1 2.2 Initial Leidos Research ............................................................................ 2-2 2.3 Contravening Behavioral Economics Concepts ....................................... 2-3
Section 3 U.S. National Energy Modeling System .................................................. 3-1 3.1 NEMS Overview ...................................................................................... 3-1 3.2 Component Modules ................................................................................ 3-2 3.3 NEMS Energy Demand Representation .................................................. 3-5
3.3.1 Residential Demand Module (RDM) ........................................... 3-5 3.3.2 Commercial Demand Module (CDM) ......................................... 3-8 3.3.3 Transportation ............................................................................ 3-10
Section 4 EIA/Leidos TECHNICAL WORKSHOP .............................................. 4-1 4.1 Purpose ..................................................................................................... 4-1 4.2 Meeting Summary .................................................................................... 4-1

Table of Contents
iv Leidos, Inc. Analytic Report 4-2_20140822_FINAL.docx 8/25/14
4.3 Key Potential Behavioral Concepts ......................................................... 4-7
Section 5 LEIDOS TARGETED LITERATURE SEARCH ................................ 5-1 5.1 Overview of Selected Literature .............................................................. 5-2 5.2 Concepts and Methodologies in Behavioral Economics Literature ........ 5-1 5.3 Commonly-encountered Behavioral Issues ............................................. 5-1
Section 6 INITIAL FINDINGS ................................................................................ 6-1 6.1 Commonly Encountered Behavioral Variables in the Literature
(priority list) ............................................................................................. 6-1 6.2 Alternative Aggregate Demand Specifications – “Math
Workspace” .............................................................................................. 6-2 6.3 Tractability of Behavioral Economics within existing EIA
framework – Summary of March 2014 Technical Workshop ................. 6-7 6.4 Suggested Next Research Steps ............................................................. 6-11
Section 7 BEHAVIORAL ECONOMICS BIBLIOGRAPHY .............................. 7-1 7.1 Bibliography Sources ............................................................................... 7-1

Table of Contents
Analytic Report 4-2_20140822_FINAL.docx Leidos, Inc. v
List of Tables Table 3-1: NEMS Modular Component Design ........................................................ 3-1 Table 3-2: Example: Behavior Rule Proportions ....................................................... 3-9 Table 3-3: Time Preference Premiums .................................................................... 3-10 Table 5-1: Overview of Behavioral Theories ............................................................. 5-2 Table 5-2: Summary of Targeted Literature Review ................................................. 5-1 Table 6-1: Preliminary Rankings of Behavioral Factors ............................................ 6-2 Table 6-2: Potential Segmentation Axes .................................................................... 6-4 Table 7-1: Behavioral Economics Bibliography ........................................................ 7-2


Analytic Report 4-2_20140822_FINAL.docx


Analytic Report 4-2_20140822_FINAL.docx
Section 1 OVERVIEW OF RESEARCH OBJECTIVES
The Energy Information Administration (EIA) is the nation's premier source of energy information. By law, its data, analyses, and forecasts are independent of approval by any other officer or employee of the United States government. The EIA created the National Energy Modeling System (NEMS), a computer-based, energy-economy modeling system of the U.S., to project the production, imports, conversion, consumption, and prices of energy over a long-term (30-year) forecast horizon, subject to assumptions on macroeconomic and financial factors, world energy markets, resource availability and costs, behavioral and technological choice criteria, cost and performance characteristics of energy technologies, and demographics. NEMS is a modular system, of which four of the modules are designed to represent specific aspects of U.S. energy demand—residential buildings, commercial buildings, industrial facilities, and the transportation sector. NEMS is the tool used to make official government energy projections. It is by law not a regulatory tool; rather, it is used to provide public information and to evaluate policy options, including pending energy-related legislation via Congressional service report requests. Refer to Section 3 of this report for a detailed description of the current NEMS architecture.
From an overarching perspective, the research, workshops, documentation, and findings detailed in this report are ultimately aimed at recommending (i) research agenda items to be carried out in the behavioral economics domain that can help EIA ascertain the extent to which best-in-class behavioral economics theory can inform NEMS, most notably suggestions for experimentation with alternative aggregate demand specifications, and (ii) an initial assessment of implications for energy efficiency (EE) programs and trends. Ultimate objectives include enhancing the quality of EIA products through improved consumer behavior and policy representation in NEMS and maintaining relevancy and consistency with developing best practices in energy economics. Enhanced capabilities, to the extent deployed within the existing EIA framework, will support the Residential Demand Module (RDM) and Commercial Demand Module (CDM), which are major components of NEMS that project energy consumption for marketed energy sources plus distributed solar and geothermal energy.
In the development of this analytic report, the following major research objectives of the EIA, for which this report serves as an initial foundation upon which further study will be undertaken, were priorities that drove the nature of the activities undertaken by Leidos Engineering, LLC (Leidos) in partnership with the EIA.
1.1 Understand Current State of Behavioral Economics Field
The EIA desires to understand whether the behavioral economics field has developed a body of work from which an alternative model can be developed that is cogent

Section 1
1-2 Leidos, Inc. Analytic Report 4-2_20140822_FINAL.docx
enough to complement the existing EIA framework or from which significant adjustments to the existing EIA policy analysis model can be made.
1.2 Prioritize Behavioral Factors that may Significantly Impact Demand
The EIA desires to identify a range of behavioral factors that are likely to have a significant impact on energy demand and prioritize these factors in terms of their impact, the level of precision of estimates that can be developed of this impact, and the ease of their development and incorporation into the existing EIA framework.
1.3 Enhance the Quality of EIA Products through Improved Representation of Consumer Behavior
The EIA desires to determine whether the existing NEMS forecasting framework appropriately captures consumer behavior patterns that deviate from the traditional neoclassical economic paradigm (refer to Section 2 of this report for a comparison of neoclassical and behavioral schools of thought). To the extent that either the existing body of literature or a series of workshops can help to surface alternative configurations, and those experimental configurations can ultimately be infused into the existing EIA models, the downstream quality of the EIA products, which are relied upon by a vast body of external stakeholders, will be improved. Enhanced capabilities to capture the potential variation in projections related to prioritized behavioral factors that may currently be absent from the modeling architecture may also spur the generation of additional scenarios relative to the EIA reference case to capture a range of potential futures given varying assumptions about those same behavioral factors.
1.4 Maintain Relevancy and Consistency with Best Practices in Energy Economics
The EIA desires to solicit feedback from the academic community and industry experts to ensure that the current NEMS framework is keeping pace with either existing or burgeoning best practices in energy economics. To the extent that the existing behavioral economics literature does not contain sufficiently developed methods to quantify and analyze certain behavioral factors deemed to be important to residential and commercial demand, then such a finding is valuable in and of itself. Alternatively, to the extent that research and collaboration with stakeholders can help to crystallize alternative demand specifications, and/or it can be shown that the existing EIA framework contains embedded behavioral levers that capture consumer behavior appropriately, then extensions of the existing framework may be possible to fill gaps in lieu of replacement of, or significant revisions to, certain modules within NEMS.

OVERVIEW OF RESEARCH OBJECTIVES
Analytic Report 4-2_20140822_FINAL.docx Leidos, Inc. 1-3
1.5 Enhance Capabilities to Support the Residential and Commercial Demand Modules
The EIA desires to enhance the capabilities of the existing EIA forecasting architecture to support the RDM and CDM. It is as yet undetermined whether such capability enhancements will be in the form of direct intervention within those modules (refer to research objectives below). Refer to Section 3 of this report for further details on how the CDM and RDM are currently structured.
1.6 Investigate and Experiment with Alternative Aggregate Demand Specifications
The EIA desires to investigate whether alternative aggregate demand specifications exist within the current behavioral economics cannon. To the extent that the literature can directly inform new ideas that capture previously unconsidered behavioral factors, then the EIA intends to determine whether and if sufficient data exists to develop alternative demand models that can be used to test alternative projections as a benchmark and complement to the existing framework. In parallel with such investigations, Leidos and EIA intend to participate in further workshops to generate additional ideas based on prior experience, leveraging synergies within the working group resulting from varying backgrounds in demand forecasting wherever possible.
1.6.1 "Sandbox" Approach The EIA’s intention is to collect a list of ideas associated with alternative demand specifications (the results of our investigations as summarized later in this report) and experiment with them in a “sandbox” environment. A “sandbox” environment implies that EIA staff will construct standalone modeling frameworks based on gathering of raw data, most likely extracted from a combination of existing NEMS raw data, secondary data to capture behavioral factors, and/or the parameterization of theoretical equations that capture behavioral factors. The advantage of sandbox implementation is that additional logic for this purpose will not have to be carefully integrated into the entire NEMS structure until a rigorous and thorough experimentation phase is completed that can uncover data limitations and can ensure that any alternative specifications are subjected to a fair amount of scrutiny for quality.
1.7 Emphasize Leveraging Existing EIA Framework to Infuse Behavioral Factors in Lieu of Wholesale Replacement
Ultimately, the EIA desires to infuse high-priority behavioral factors that may be missing from the existing NEMS architecture into the appropriate module(s) in lieu of wholesale replacement of the CDM and RDM modules. As summarized in Section 4 of this report, the results of the first workshop on the topic and the entirety of

Section 1
1-4 Leidos, Inc. Analytic Report 4-2_20140822_FINAL.docx
additional follow-up feedback and interfacing conducted suggests that the existing EIA framework does indeed contain certain behavioral elements, and the NEMS CDM and RDM modules are not a strict deployment of a rigid neoclassical economic framework. Furthermore, as summarized in Section 5 of this report, the literature does not currently offer an overarching mathematical framework inclusive of behavioral economics theory that can viably displace the core elements of the CDM and RDM modules. Consequently, it is likely that the infusion of certain additional behavioral factors will be preferable to a wholesale replacement of the RDM and CDM.

Analytic Report 4-2_20140822_FINAL.docx
Section 2 BEHAVIORAL ECONOMICS BACKGROUND INFORMATION
2.1 Definition of Behavioral Economics Behavioral Economics refers to the research of, and formalizing of theories regarding, deviations from rational economic decision-making in the behavior of individuals. These deviations result in market behavior that is counter to theoretical economic models and can cause outcomes to differ from expectations derived from these models. Behavioral Economics draws upon cognitive psychology and other fields to inform experimental and theoretical analyses aimed at understanding how individual market agents make decisions.1 This research has demonstrated consistent and widespread departures from rational choice theory and expected utility maximization behavior.
Neoclassical economic theory rests on the assumption that individuals make decisions aimed at maximizing their individual utility based on complete information. Referred to as rational choice theory, the concept implies that individuals can be counted on to consistently behave in ways that are intended to benefit them. Many economic researchers that adhere to this theory suggest that individuals may sometimes deviate from rational behavior for various reasons but that, on a wider scale, such deviations are sufficiently minor and infrequent so as to not invalidate the usefulness of the theory in developing models.
Researchers in the Behavioral Economics field have identified a host of behaviors that are counter to rational choice theory and can generally be classified under the umbrellas of cognitive bias and bounded rationality. Cognitive bias describes behavior that reveals inconsistencies in the evaluation of choices, such as higher implied discount rates on purchase decisions relative to savings decisions, violation of transitive principles (i.e., rational preference axioms), and greater aversion to losses than desire for gains. Bounded rationality describes decision-making based on imperfect information and includes behaviors such as procrastination, simplified decision-making heuristics, and disproportionate weight to readily observable factors, which result from a lack of readily available and complete information. Behavioral Economics research suggests that these deviations from neoclassical assumptions are sufficiently consistent to shed doubt on the usefulness of the neoclassical paradigm in modeling the decision-making of economic agents.
The confluence of these behavioral “failures” and certain market failures is viewed by some energy industry researchers as explaining the difference between observed levels of energy efficiency and a socially optimal level of efficiency, referred to as an “energy efficiency gap.” This gap takes the form of an underinvestment in energy efficiency relative to the level that should be economically optimal and/or a slower
1 Gillingham, Newell, and Palmer. Energy Efficiency Economics and Policy. National Bureau of Economic Research Working Paper 15031. June 2009.
Section 2
2-2 Leidos, Inc. Analytic Report 4-2_20140822_FINAL.docx
than optimal rate of adoption of energy efficiency products. This phenomenon is also viewed as a rationale for policy intervention to alleviate or circumvent the impacts of these failures.
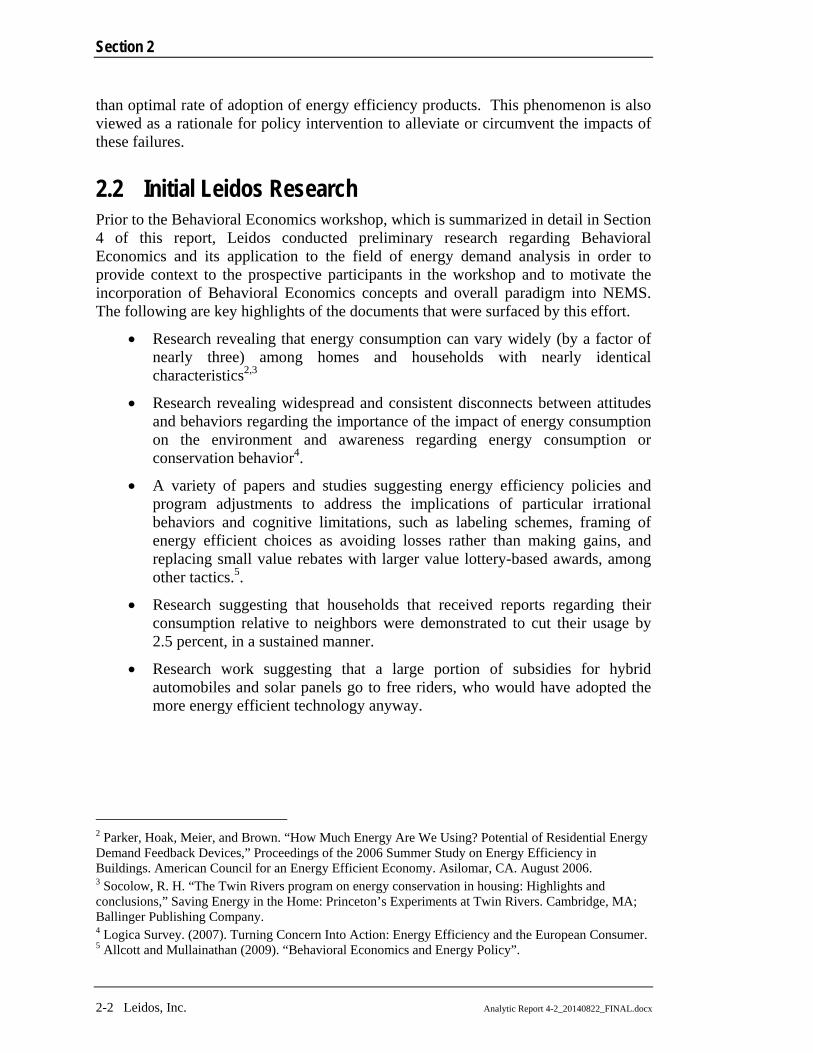
2.2 Initial Leidos Research Prior to the Behavioral Economics workshop, which is summarized in detail in Section 4 of this report, Leidos conducted preliminary research regarding Behavioral Economics and its application to the field of energy demand analysis in order to provide context to the prospective participants in the workshop and to motivate the incorporation of Behavioral Economics concepts and overall paradigm into NEMS. The following are key highlights of the documents that were surfaced by this effort.
Research revealing that energy consumption can vary widely (by a factor of nearly three) among homes and households with nearly identical characteristics2,3
Research revealing widespread and consistent disconnects between attitudes and behaviors regarding the importance of the impact of energy consumption on the environment and awareness regarding energy consumption or conservation behavior4.
A variety of papers and studies suggesting energy efficiency policies and program adjustments to address the implications of particular irrational behaviors and cognitive limitations, such as labeling schemes, framing of energy efficient choices as avoiding losses rather than making gains, and replacing small value rebates with larger value lottery-based awards, among other tactics.5.
Research suggesting that households that received reports regarding their consumption relative to neighbors were demonstrated to cut their usage by 2.5 percent, in a sustained manner.
Research work suggesting that a large portion of subsidies for hybrid automobiles and solar panels go to free riders, who would have adopted the more energy efficient technology anyway.
2 Parker, Hoak, Meier, and Brown. “How Much Energy Are We Using? Potential of Residential Energy Demand Feedback Devices,” Proceedings of the 2006 Summer Study on Energy Efficiency in Buildings. American Council for an Energy Efficient Economy. Asilomar, CA. August 2006. 3 Socolow, R. H. “The Twin Rivers program on energy conservation in housing: Highlights and conclusions,” Saving Energy in the Home: Princeton’s Experiments at Twin Rivers. Cambridge, MA; Ballinger Publishing Company. 4 Logica Survey. (2007). Turning Concern Into Action: Energy Efficiency and the European Consumer. 5 Allcott and Mullainathan (2009). “Behavioral Economics and Energy Policy”.

BEHAVIORAL ECONOMICS BACKGROUND INFORMATION
Analytic Report 4-2_20140822_FINAL.docx Leidos, Inc. 2-3
2.3 Contravening Behavioral Economics Concepts The following are behaviors and concepts that have been identified within the behavioral economics field as sufficiently consistent and widespread to contravene the neoclassical paradigm and confound models developed on that basis. While these concepts are separately discussed and an attempt is made to classify them as either cognitive biases or symptomatic of bounded rationality, there is a large degree of overlap and reinforcement across the concepts and between these labels.
Inconsistent Temporal Framing – Consumers tend to have higher implied discount rates on purchase decisions relative to decisions regarding savings, placing lower value on future costs relative to an upfront purchase consistent with discount rates of 25% to over 100%. However, the irreversibility of many energy efficiency decisions is viewed as supporting some level of differential in implied time value of money.
Status Quo Bias – Consumers tend to dislike change and will more strongly weight current equipment and energy consumption and cost characteristics, regardless of information to the contrary. This behavior has been widely recognized in numerous programs that reflect an opt-out rather than an opt-in to increase participation. People also tend to become psychologically invested in existing equipment, regardless of the costs and benefits of replacement.
Loss Aversion – Consumers tend to have greater aversion to losses than desire for gains, all else equal.
Decision-making Heuristics – Consumers revert to simple rules of thumb and simplified math when faced with complex decisions. For example, consumers tend to choose an option perceived as a compromise or “middle of the road” choice.
Salience Effect – Consumers attach a disproportionate weight to readily observable factors, contributing for example to an overemphasis on the initial cost of energy efficient appliances.6
Prosocial Behavior – Consumers tend to be readily influenced by what others are doing, regardless of costs and benefits, and care more about levels of performance and participation relative to others rather than absolute levels.
Permanent Income Hypothesis Paralysis – Consumers may be fully aware of the long term economic benefits of a decision to make a change and also be fully aware of their higher short-term costs resulting from not making a particular decision, making them rational economic agents from an analytical perspective. However, these same consumers are irrationally concerned with long term economic security (perception of permanent income) and their ability to service debt payments associated with the purchase of a highly efficient end-use, leading to a state of paralysis and inaction.
6 Gillingham, Newell, and Palmer. Energy Efficiency Economics and Policy. National Bureau of Economic Research Working Paper 15031. June 2009.

Section 2
2-4 Leidos, Inc. Analytic Report 4-2_20140822_FINAL.docx
The EIA wishes to uncover additional contravening behavioral concepts from a more thorough literature review, ascertain how and if such concepts can lend themselves to alternative aggregate demand specifications, and then determine the extent to which available data can help mold experimental models as a comparison to EIA’s existing framework. Refer to Section 4 of this report for a detailed description of the outcomes of the EIA’s first workshop on this topic, as it is important to note that the existing modeling architecture was found to contain certain key behavioral levers, and is not a strictly neoclassical economic model.

Analytic Report 4-2_20140822_FINAL.docx
Section 3 U.S. National Energy Modeling System
The National Energy Modeling System (NEMS) is a publicly-available, economy-wide, integrated energy model that includes 12 sub-modules covering energy supply, conversion, and demand. It is used by the U.S. Energy Information Administration (EIA) to annually provide 30-year energy market and infrastructure forecasts, referred to as the Annual Energy Outlook (AEO), and is the principal tool for the analysis of energy and greenhouse gas policies used by the U.S. government.
The following sections provide an overview of the purpose and architecture of NEMS, a description of its component modules, and some details regarding the representation of energy demand in NEMS, with a focus on how consumer behavior is captured.
3.1 NEMS Overview NEMS integrates every energy sector in the U.S. economy, including the gas, oil and power industries, the renewable energy sector, the transportation demand sector and the residential, commercial and industrial energy demand sectors. The model is capable of analyzing overall impacts on the US economy of alternative energy and environmental policies.
Table 3-1: NEMS Modular Component Design
Oil and GasSupply Module
Natural GasTransmission
and DistributionModule
Coal MarketModule
RenewablesModule
Supply
Industrial Demand Module
ResidentialDemand Module
TransportationDemandModule
Demand
ElectricityMarketModule
Liquid FuelsMarketModule
Macroeconomic Activity Module
International Energy Activity
Module
IntegratingModule
Commercial Demand Module
Conversion
The forecast horizon of NEMS is approximately 30 years (currently through 2040). Because of the diverse nature of energy supply, demand, and conversion in the United States, the model supports regional modeling and analysis in order to represent the
Section 3
3-2 Leidos, Inc. Analytic Report 4-2_20140822_FINAL.docx
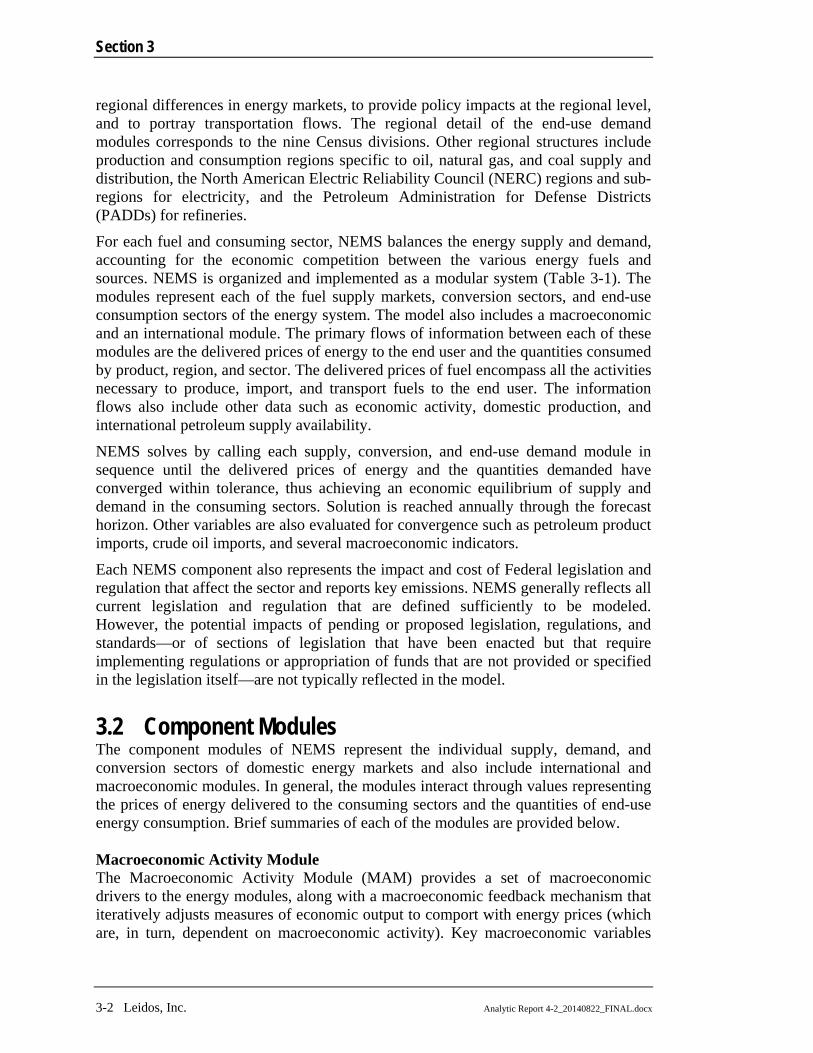
regional differences in energy markets, to provide policy impacts at the regional level, and to portray transportation flows. The regional detail of the end-use demand modules corresponds to the nine Census divisions. Other regional structures include production and consumption regions specific to oil, natural gas, and coal supply and distribution, the North American Electric Reliability Council (NERC) regions and sub-regions for electricity, and the Petroleum Administration for Defense Districts (PADDs) for refineries.
For each fuel and consuming sector, NEMS balances the energy supply and demand, accounting for the economic competition between the various energy fuels and sources. NEMS is organized and implemented as a modular system (Table 3-1). The modules represent each of the fuel supply markets, conversion sectors, and end-use consumption sectors of the energy system. The model also includes a macroeconomic and an international module. The primary flows of information between each of these modules are the delivered prices of energy to the end user and the quantities consumed by product, region, and sector. The delivered prices of fuel encompass all the activities necessary to produce, import, and transport fuels to the end user. The information flows also include other data such as economic activity, domestic production, and international petroleum supply availability.
NEMS solves by calling each supply, conversion, and end-use demand module in sequence until the delivered prices of energy and the quantities demanded have converged within tolerance, thus achieving an economic equilibrium of supply and demand in the consuming sectors. Solution is reached annually through the forecast horizon. Other variables are also evaluated for convergence such as petroleum product imports, crude oil imports, and several macroeconomic indicators.
Each NEMS component also represents the impact and cost of Federal legislation and regulation that affect the sector and reports key emissions. NEMS generally reflects all current legislation and regulation that are defined sufficiently to be modeled. However, the potential impacts of pending or proposed legislation, regulations, and standards—or of sections of legislation that have been enacted but that require implementing regulations or appropriation of funds that are not provided or specified in the legislation itself—are not typically reflected in the model.
3.2 Component Modules The component modules of NEMS represent the individual supply, demand, and conversion sectors of domestic energy markets and also include international and macroeconomic modules. In general, the modules interact through values representing the prices of energy delivered to the consuming sectors and the quantities of end-use energy consumption. Brief summaries of each of the modules are provided below. Macroeconomic Activity Module The Macroeconomic Activity Module (MAM) provides a set of macroeconomic drivers to the energy modules, along with a macroeconomic feedback mechanism that iteratively adjusts measures of economic output to comport with energy prices (which are, in turn, dependent on macroeconomic activity). Key macroeconomic variables
U.S. National Energy Modeling System
Analytic Report 4-2_20140822_FINAL.docx Leidos, Inc. 3-3
used in the energy modules include gross domestic product (GDP), disposable income, value of industrial shipments, new housing starts, new light-duty vehicle sales, interest rates, and employment. Key energy indicators fed back to the MAM include aggregate energy prices and costs. International Module The International Module represents the response of world oil markets (supply and demand) to assumed world oil prices. The output of the module is a set of crude oil and product supply curves that are available to U.S. markets. The petroleum import supply curves are made available to U.S. markets through the Liquid Fuels Market Module of NEMS. The supply-curve calculations are based on historical market data and a world oil supply/demand balance, which is developed from reduced-form models of international liquids supply and demand, current investment trends in exploration and development, and long-term resource economics for 221 countries/territories. The oil production estimates include both conventional and unconventional supply recovery technologies. Residential and Commercial Demand Modules The Residential Demand Module projects energy consumption in the residential sector by housing type and end use, based on delivered energy prices, the menu of equipment available, the availability of renewable sources of energy, and housing starts. The Commercial Demand Module projects energy consumption in the commercial sector by building type and non-building uses of energy and by category of end use, based on delivered prices of energy, availability of renewable sources of energy, and macroeconomic variables representing interest rates and commercial floorspace construction. Industrial Demand Module The Industrial Demand Module projects the consumption of energy for heat and power and for feedstocks and raw materials in each of 21 industries, subject to the delivered prices of energy and macroeconomic variables representing employment and the value of shipments for each industry. Transportation Demand Module The Transportation Demand Module projects consumption of fuels in the transportation sector, including petroleum products, electricity, methanol, ethanol, compressed natural gas, and hydrogen, by transportation mode, vehicle vintage, and size class, subject to delivered prices of energy fuels and macroeconomic variables representing disposable personal income, GDP, population, interest rates, and industrial shipments. Electricity Market Module The Electricity Market Module (EMM) represents generation, transmission, and pricing of electricity, subject to delivered prices for coal, petroleum products, natural gas, and biofuels; costs of generation by all generation plants, including capital costs and macroeconomic variables for costs of capital and domestic investment;
Section 3
3-4 Leidos, Inc. Analytic Report 4-2_20140822_FINAL.docx
environmental emissions laws and regulations; and electricity load shapes and demand. There are three primary submodules—capacity planning, fuel dispatching, and finance and pricing. Renewable Fuels Module The Renewable Fuels Module (RFM) includes submodules representing renewable resource supply and technology input information for central-station, grid-connected electricity generation technologies, including conventional hydroelectricity, biomass (wood, energy crops, and biomass co-firing), geothermal, landfill gas, solar thermal electricity, solar photovoltaics (PV), and wind energy. The RFM contains renewable resource supply estimates representing the regional opportunities for renewable energy development. Oil and Gas Supply Module The Oil and Gas Supply Module (OGSM) represents domestic crude oil and natural gas supply within an integrated framework that captures the interrelationships among the various sources of supply—onshore, offshore, and Alaska, by both conventional and unconventional techniques, including natural gas recovery from coalbeds and low-permeability formations of sandstone and shale. The framework analyzes cash flow and profitability to compute investment and drilling for each of the supply sources, based on the prices for crude oil and natural gas, the domestic recoverable resource base, and the state of technology. Oil and gas production functions are computed for 12 supply regions, including 3 offshore and 3 Alaskan regions. The module also represents foreign sources of natural gas, including pipeline imports and exports to Canada and Mexico, and liquefied natural gas (LNG) imports and exports. Natural Gas Transmission and Distribution Module (NGTDM) The NGTDM represents the transmission, distribution, and pricing of natural gas, subject to end-use demand for natural gas and the availability of domestic natural gas and natural gas traded on the international market. The module tracks the flows of natural gas and determines the associated capacity expansion requirements in an aggregate pipeline network, connecting the domestic and foreign supply regions with 12 U.S. demand regions. The flow of natural gas is determined for both a peak and off-peak period in the year. Key components of pipeline and distributor tariffs are included in separate pricing algorithms. The module also represents foreign sources of natural gas, including pipeline imports and exports to Canada and Mexico and LNG imports and exports. Liquid Fuels Market Module The Liquid Fuels Market Module (LFMM) projects petroleum product prices and sources of supply for meeting petroleum product demand. The sources of supply include crude oil (both domestic and imported), petroleum product imports, unfinished oil imports, other refinery inputs (including alcohols, ethers, esters, corn, biomass, and coal), natural gas plant liquids production, and refinery processing gain. In addition, the LFMM projects capacity expansion and fuel consumption at domestic refineries.

U.S. National Energy Modeling System
Analytic Report 4-2_20140822_FINAL.docx Leidos, Inc. 3-5
The recent adoption of a new LFMM in place of the Petroleum Market Module (PMM) used in earlier NEMS studies provides for more granular and integrated modeling of petroleum refineries and other types of current and potential future liquid fuels production technologies. This allows more direct analysis and modeling of the regional supply and demand effects involving crude oil and other feedstocks, current and future processes, and marketing to consumers. Coal Market Module The Coal Market Module (CMM) simulates mining, transportation, and pricing of coal, subject to end-use demand for coal differentiated by heat and sulfur content. U.S. coal production is represented in the CMM by 40 separate supply curves—differentiated by region, mine type, coal rank, and sulfur content. The coal supply curves include a response to capacity utilization of mines, mining capacity, labor productivity, and factor input costs (mining equipment, mining labor, and fuel requirements), and other mine supply costs. Projections of U.S. coal distribution are determined by minimizing the cost of coal supplied, given coal demands by demand region and sector, environmental restrictions, and accounting for mine-mouth prices, transportation rates, and coal supply contracts. Over the forecast horizon, coal transportation rates in the CMM are projected to vary in response to changes in railroad investment and market share (for western coal only).
3.3 NEMS Energy Demand Representation The subsections below provide an outline of the modeling of energy demand within the Residential, Commercial, and Transportation sectors. Within these demand sectors of NEMS, there are model elements that appear to be designed to capture the effects of consumer behavior, primarily within the calculations regarding technology choice to meet service demands. The discussion below is heavily weighted toward those model aspects. As a review of the Industrial Demand Model (IDM) did not identify specific elements that estimate the results of consumer choice, it is excluded from this section.
3.3.1 Residential Demand Module (RDM) Residential energy demand is determined by existing and projected housing stock, by housing type, based on estimates of housing starts from the Macroeconomic Activity Module (MAM), and the retirement (demolishment) of older housing at a constant rate. Housing is expected to provide a variety of major end-use services, such as space heating and cooling, water heating, cooking, dishwashing, laundering, and refrigeration. Consumer behavior is reflected in the choices made in the technologies to provide these services, both in new construction and in the replacement of obsolete appliances. These major services currently represent approximately 80 percent of residential end-use energy consumption. Other, minor services provided by such items as televisions, PC’s, or other small appliances are addressed in less detail, using either exogenous modeling or projections of saturation rates and Unit Energy Consumption (UEC) estimates.
Section 3
3-6 Leidos, Inc. Analytic Report 4-2_20140822_FINAL.docx
Major End-Use Services
Within each of the major service categories, consumers select new and replacement appliances by equipment class (e.g., natural gas water heater), and by equipment type (e.g., among competing models of natural gas water heaters). The RDM calculates market shares based on consumer behavior as a function of capital and operating costs (i.e., life-cycle cost) and bias (described below). The consumer is allowed to choose among the various levels of cost and efficiency for a given class of equipment. The concept of price-induced technology change is also included in the formulation of equipment costs, which allows future technologies faster diffusion into the marketplace if fuel prices increase markedly and remain high over a multi-year period.
A logistic function is used to estimate the market shares of competing technologies within each major service category. The function assigns market shares for competing technologies based on the relative weights of capital/installed (first cost) and discounted operating (annual fuel) costs. A time dependent log-linear function calculates the installed capital cost of equipment in new construction. If fuel prices increase markedly and remain high over a multi-year period, more efficient appliances may be available earlier in the projection period than would have been the case otherwise.
For new construction, market shares of building shell options are also determined using a similar logistic calculation. The shell options are linked to heating and cooling equipment, as building codes can be met using more efficient equipment in addition to structural options (like windows and insulation levels). The linked, minimum efficiencies for heating and cooling equipment in new construction can be increased, but not decreased, based on the logistic calculation.
Space heaters, air conditioners (heat pumps and central air conditioners), water heaters, ranges, and clothes dryers may be replaced with competing technologies in single-family homes. It is assumed that 20 percent of the replacement market in single-family homes is eligible to switch fuels in any projection year, but multifamily and mobile homes are not considered capable of fuel-switching. The technology choice for fuel-switching decisions is based on a log-linear function, which is flexible to allow the user to specify parameters, such as weighted retail equipment cost, technology switching cost, and bias. Replacements in multifamily and mobile homes are constrained to the same technology.
As mentioned above, in addition to economic factors in the technology choice functions, consumer preference, or “bias” parameters are used to calibrate the model’s estimated market share of a given technology to historical shipment data. These factors may be interpreted as indicators of the aggregate consumer’s predilection for or against a particular fuel or technology. These behavioral parameters are static and are obtained from exogenous data input files. These parameters are incorporated into the model elements that capture the following consumer behaviors:
Choice of heating system for new residential construction, by building type and census division
U.S. National Energy Modeling System
Analytic Report 4-2_20140822_FINAL.docx Leidos, Inc. 3-7
Consumer receptiveness to fuel-switching when choosing replacement technologies
Consumer preference for a specific technology within an appliance class in the efficiency choice model
Minor End-Use Services
Personal computers: The RDM uses an exogenous spreadsheet model, assuming certain market penetration rates for the different technologies over the forecast period, including desktops vs. laptops, LCD vs. CRT monitors, etc. Outputs from the model include the penetration rate (PCs/housing unit) and a usage trend, influenced by a short-term price elasticity function.
Televisions: As with personal computers, the RDM employs an exogenous model for TVs, set-top boxes, and video game consoles that assumes certain market penetration rates for the different technologies over the forecast period, including plasma vs. LCD vs. CRT, high definition vs. standard definition, cable vs. satellite, etc. Outputs from the spreadsheet model, the penetration rate (devices/housing unit) and UEC trend, are used to estimate total television energy consumption.
Other Electric Appliances: The remaining electricity consumption is captured in a catch-all category that includes miscellaneous electrical uses such as small kitchen appliances, small consumer electronics, and small motor devices that are used in homes but do not fall into any of the other categories of equipment that have their own module components. The component computes the UEC on a per-housing-unit basis, by housing type and Census division. Based on historical data, a growth rate is estimated and applied to the UEC to project future energy consumption.
Other Non-Electric Appliances: The RDM treats this as another catch-all category, where total consumption is based on housing stock, unit energy consumption, and a short-term price elasticity function.
Distributed Generation
Three technologies are considered in the RDM for residential generation: Solar PV, Wind, and Fuel Cells. Distributed generation penetration is based on a cash flow simulation model. For each year in a NEMS run, a complete 30-year cash flow analysis is done for each of the three distributed generation technologies. Simulations are carried out for single family homes. System characteristics, financial variables, solar insolation and program-driven systems (e.g., the California solar program) are supplied to the submodule via an exogenous input file.
Technology penetration rates for distributed generating technologies installed in new construction are determined by how quickly an investment in a technology is estimated to recoup its flow of costs. This penetration rate is allowed to be as high as 75% for distributed technologies if the investment “pays back” in less than one year, 30% if the investment pays back in one year, and correspondingly less for longer paybacks. The penetration function is assumed to follow a logistic functional form. For retrofitting distributed generation into existing construction, penetration is capped

Section 3
3-8 Leidos, Inc. Analytic Report 4-2_20140822_FINAL.docx
by assumption at the lesser of 0.5% and the penetration rate into new construction divided by 40. The cap is in effect if penetration into new construction exceeds 20%.
3.3.2 Commercial Demand Module (CDM) Commercial energy demand is determined by existing and projected commercial floorspace, by commercial building type, based on floorspace growth rates provided to the CDM by the Macroeconomic Activity Module, and the retirement of floorspace based on a survival algorithm. The resulting total commercial floorspace, by census division and building type, is used to calculate demand for the major services of space heating, space cooling, water heating, ventilation, cooking, refrigeration, and lighting. These service demands provide input to the Technology Choice subroutine, and subsequently contribute to the development of end-use consumption projections.
Technology Choice
Given the level of energy services demanded, the CDM projects the class and model of equipment selected to satisfy the demand. The model is designed to choose among a discrete set of technologies exogenously characterized by commercial availability, capital cost, operating and maintenance (O&M) cost, removal/disposal cost, efficiency, and equipment life. The menu of equipment depends on technological innovation, market development and policy intervention. The CDM allows for endogenous price-induced technology change in the determination of equipment costs and availability for the menu of equipment. This concept allows future technologies faster diffusion into the marketplace if fuel prices increase markedly for a sustained period of time.
Commercial consumers purchase energy-using equipment to meet three types of demand, referred to as “Decision Types”:
• New: Service demand in newly-constructed buildings; • Replacement: Service demand formerly met by equipment that is at the end of its
useful life and must be replaced; • Retrofit: Service demand formerly met by equipment with a remaining useful life
that is nevertheless subject to retirement on economic grounds.
Because evidence suggests that traditional cost-minimizing models do not adequately account for the full range of economic factors that influence consumer behavior, the CDM is designed to allow the use of several possible assumptions. These assumptions, referred to as “Behavior Rules”, are summarized as follows:
• Least Cost (LC): Choose the equipment that minimizes the total expected cost over the life of the equipment;
• Same Fuel (SF): Buy equipment that uses the same fuel as existing or retiring equipment, but minimizes life-cycle costs under that constraint;
• Same Technology (ST): Buy (or keep) the same technology as the existing or retiring equipment, but choose between models with different efficiency levels based upon minimum life-cycle costs.

U.S. National Energy Modeling System
Analytic Report 4-2_20140822_FINAL.docx Leidos, Inc. 3-9
These behavior rules are designed, based on empirical research, to represent the range of economic factors that influence the consumer's decision. The consumers who minimize life-cycle cost are the most sensitive to energy price changes; thus, the price-sensitivity of the model depends in part on the share of consumers using each behavior rule. The proportion of consumers in each behavior rule segment varies by building type, the end-use service under consideration, and decision type, for the three decision types of new construction, replacement, or retrofit. The following table provides a sample of the Space Heating behavior rule proportions under each of the “decision types” for several commercial buildings.
Table 3-2: Example: Behavior Rule Proportions
Space Heating
New Replacement Retrofit
LC SF ST LC SF ST LC SF ST
Assembly 0.38 0.43 0.19 0.09 0.35 0.56 0.01 0.04 0.95
Education 0.40 0.45 0.15 0.13 0.42 0.45 0.02 0.07 0.91
Food sales 0.26 0.35 0.39 0.04 0.26 0.70 0.00 0.03 0.97
Food service 0.26 0.35 0.39 0.04 0.24 0.72 0.00 0.03 0.97
In addition to the behavior rules, the CDM further segments commercial agents into seven distinct risk-adjusted time preference premium categories. This type of segmentation incorporates the notion that all agents do not consider the same set of parameters in the optimization within the commercial sector. Some participants may display specific behavior due to existing biases regarding certain equipment types or fuels. In addition, the distribution of risk-adjusted time preference premiums represents a variety of commercial agents' attitudes about the desirability of current versus future expenditures with regard to capital, O&M, and fuel costs.
The value of this interest rate premium influences the annualized installed capital cost through an annuity payment financial factor based on the 10-year Treasury note rate, the risk-adjusted time preference premium, and expected physical equipment lifetime. The sum of the 10-year Treasury note rate and the consumer risk-adjusted time preference premium is referred to as the implicit discount rate, i.e., the interest rate required to reflect actual purchases. The implicit discount rate is also known as a “hurdle rate” to emphasize the consideration of all factors, both financial and nonfinancial, that affect an equipment purchase decision. The combination of these factors results in the height of the “hurdle” for the purchase decision.
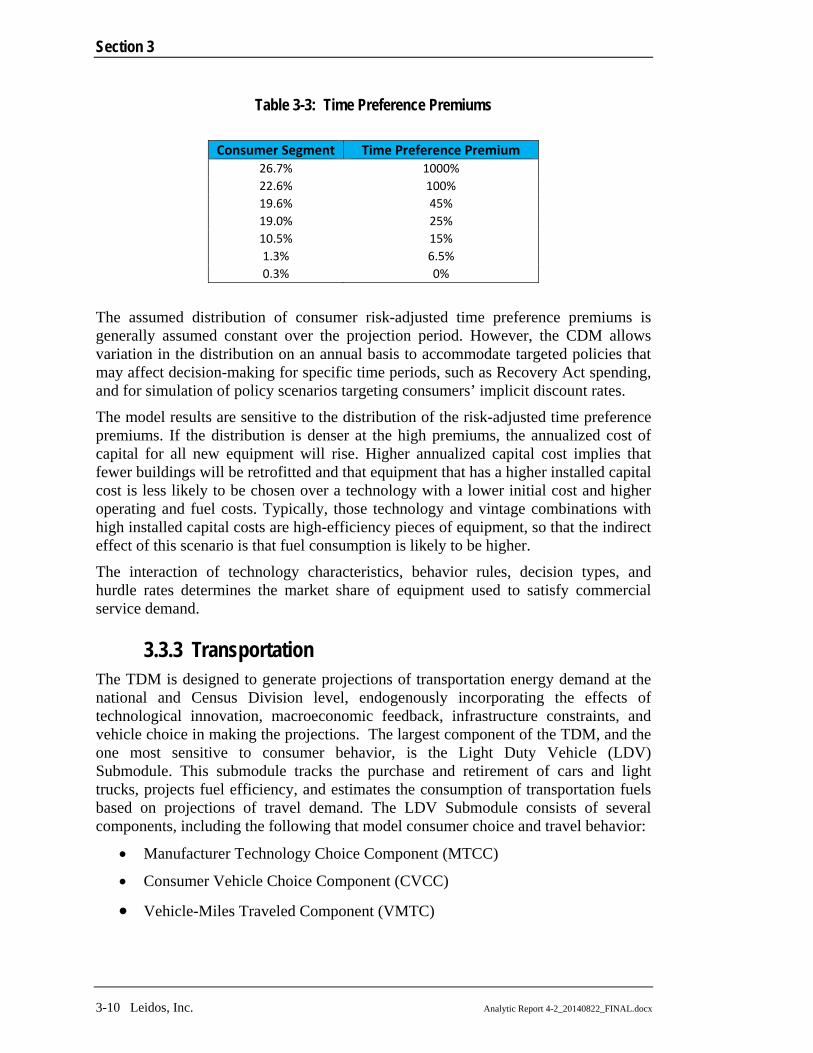
An example of the time preference premiums for space heating in 2009 is shown in the following table.
Section 3
3-10 Leidos, Inc. Analytic Report 4-2_20140822_FINAL.docx
Table 3-3: Time Preference Premiums
Consumer Segment Time Preference Premium
26.7% 1000%
22.6% 100%
19.6% 45%
19.0% 25%
10.5% 15%
1.3% 6.5%
0.3% 0%
The assumed distribution of consumer risk-adjusted time preference premiums is generally assumed constant over the projection period. However, the CDM allows variation in the distribution on an annual basis to accommodate targeted policies that may affect decision-making for specific time periods, such as Recovery Act spending, and for simulation of policy scenarios targeting consumers’ implicit discount rates.
The model results are sensitive to the distribution of the risk-adjusted time preference premiums. If the distribution is denser at the high premiums, the annualized cost of capital for all new equipment will rise. Higher annualized capital cost implies that fewer buildings will be retrofitted and that equipment that has a higher installed capital cost is less likely to be chosen over a technology with a lower initial cost and higher operating and fuel costs. Typically, those technology and vintage combinations with high installed capital costs are high-efficiency pieces of equipment, so that the indirect effect of this scenario is that fuel consumption is likely to be higher.
The interaction of technology characteristics, behavior rules, decision types, and hurdle rates determines the market share of equipment used to satisfy commercial service demand.
3.3.3 Transportation The TDM is designed to generate projections of transportation energy demand at the national and Census Division level, endogenously incorporating the effects of technological innovation, macroeconomic feedback, infrastructure constraints, and vehicle choice in making the projections. The largest component of the TDM, and the one most sensitive to consumer behavior, is the Light Duty Vehicle (LDV) Submodule. This submodule tracks the purchase and retirement of cars and light trucks, projects fuel efficiency, and estimates the consumption of transportation fuels based on projections of travel demand. The LDV Submodule consists of several components, including the following that model consumer choice and travel behavior:
Manufacturer Technology Choice Component (MTCC)
Consumer Vehicle Choice Component (CVCC)
Vehicle-Miles Traveled Component (VMTC)

U.S. National Energy Modeling System
Analytic Report 4-2_20140822_FINAL.docx Leidos, Inc. 3-11
Manufacturer Technology Choice Component (MTCC)
The MTCC component produces estimates of new light-duty vehicle fuel economy. Fuel economy is a significant aspect of the TDM because automotive fuel demand is directly affected by the efficiency with which that fuel is used. The fuel economy of new vehicles is impacted by changes in four factors:
Technology penetration
Level of acceleration performance achieved
Mix of vehicle size classes and vehicle technology types (e.g., hybrid and diesel) sold
Vehicle fuel economy, safety, and emission standards
The demand for increased acceleration performance for each market class is estimated based on an econometric equation relating fuel prices and personal disposable income to demand for performance or horsepower, by market class. These relationships are used to project the change in horsepower, which is then used to project the change in fuel economy through an engineering relationship that links performance and fuel economy.
The change in the mix of market classes sold is projected as a function of fuel price, vehicle price, and personal disposable income. The sales mix by market class is used to calculate new fuel economy.
Each available technology is subjected to a cost-effectiveness test that balances the cost of the technology against the potential fuel savings and the value of any increase in performance provided by the technology. The cost-effectiveness test is used to generate an economic market share for the technology.
Consumer Vehicle Choice Component (CVCC)
The objective of the CVCC is to estimate the market penetration of conventional and alternative-fuel vehicles during the period 1995-2040. To project technology market shares, the component uses estimates of the following variables and vehicle attributes: new car fuel economy (obtained from the MTCC), vehicle price, vehicle range, fuel availability, battery replacement cost, performance (measured by the horsepower-to-weight), home refueling capability, maintenance costs, luggage space, make and model diversity or availability, and fuel price estimates generated by NEMS.
The CVCC uses attribute-based discrete choice techniques and logit-type choice functions, which represent a demand function for vehicle sales in the United States. The demand function uses projections of the changes in vehicle and fuel attributes for the considered technologies to estimate the market share penetration for the various technologies.
The component projects market shares for 14 alternative-fuel technologies as well as for conventional gasoline and diesel technologies. There are three stages or levels to the “tree” structure of the CVCC-logit model. In the first stage, the shares of vehicle sales are determined for five aggregate vehicle groups: conventional, hybrid, dedicated alternative fuel, fuel cell, and electric. The second stage of the logit model subdivides

Section 3
3-12 Leidos, Inc. Analytic Report 4-2_20140822_FINAL.docx
each of the five groups to estimate sales shares for the specific vehicle types within each group. The third level of the CVCC estimates the proportion of the travel in which flex or bi-fuel vehicles are using the alternative or gasoline fuel.
Several vehicle attributes are weighted and evaluated in the logit function. The following vehicle and fuel attributes are considered: vehicle price, fuel cost or cost of driving per mile (fuel price divided by fuel efficiency), vehicle range, fuel availability, battery replacement cost, performance (measured by the horsepower-to-weight ratio), home refueling capability, maintenance costs, luggage space, and make and model diversity or availability. All of the coefficients associated with the various vehicle attributes are static, with the exception of a constant term, which varies by year. This constant term is initially used to calibrate market shares of new vehicle purchases but is not necessarily constant across the forecast period. This may be varied based on the modelers’ judgment about consumer behavior that is not captured by an econometric response to vehicle attributes and may be used to guide the projected mix of vehicle sales to meet targeted goals or the modelers’ expectations.
Vehicle-Miles Traveled Component (VMTC)
The VMTC uses NEMS estimates of fuel price and personal income, along with population projections, to generate a projection of the demand for personal travel, expressed in vehicle-miles traveled per driver. This is subsequently combined with projections of car fleet efficiency to estimate fuel consumption. The primary concern in projecting VMT per licensed driver in the mid- to long-term is to address those effects that alter historical growth trends. The factors affecting future VMT trends in the model are the fuel cost of driving, disposable personal income, the unemployment rate, and past VMT trends. VMT per licensed driver is estimated using a log-linear econometric equation.
Analytic Report 4-2_20140822_FINAL.docx
Section 4 EIA/Leidos TECHNICAL WORKSHOP
4.1 Purpose The EIA conducted a technical workshop “Meeting of Experts” on July 17, 2013 in Washington, D.C. to assess methodological developments in the field of behavioral economics as applied to energy demand analysis and energy efficiency programs. The meeting was jointly planned and facilitated by EIA and Leidos (then SAIC) staff. This meeting was intended to support the EIA goals of updating its analytic assumptions and methods associated with the modeling of changing energy markets, potentially improving consumer behavior and policy representation in NEMS, and maintaining relevancy and consistency with developing best practices in energy economics. This section provides a synopsis of the key discussion points, comments, and suggestions for further examination of behavioral factors that were surfaced during the meeting.
4.2 Meeting Summary The following discussion provides a summary of the meeting, including introductory remarks by EIA and Leidos staff, an outline of major discussion topics, and summarized example participant remarks. A more complete summary has also been made available on the EIA website.
EIA staff provided a series of introductory remarks to provide context and get the conversation started, including goals of the meeting, background on behavioral economics, and EIA’s anticipated path forward. The stated goals of the meeting included the following:
Formulation and capture of insights on the application of behavioral economics to energy demand analysis
Starting point to a longer, broader analytical effort (i.e., as opposed to immediately surfacing the “silver bullet”)
Momentum towards either a working group of interested parties and/or further direct investigation by EIA
The longer term goals outlined by the EIA included discovering whether it was the case that the neoclassical paradigm was significantly challenged by behavioral economics principles and research and if so, finding or developing a new aggregate demand paradigm that reflected these principles and research.
The process to developing alternative modeling constructs outlined by the EIA revolved around experimentation within a “sandbox” environment (i.e., divorced from the actual inner workings of the NEMS model) in order to stress test and scrutinize the implications of any technical adjustments in a parallel path. It was made clear that
Section 4
4-2 Leidos, Inc. Analytic Report 4-2_20140822_FINAL.docx
adjustments within NEMS itself would not be made without a careful, extended, and deliberate review and experimentation process, possibly including the testing of more detailed representations of demographics and regional variability.
The discussion next turned to a description of the NEMS architecture. The following are key highlights of the discussion:
NEMS was described as a modular equilibrium model that reaches agreement iteratively. Accordingly, changes to a given model assumption may have significant system-wide ramifications.
The NEMS RDM and CDM contain weight parameters and behavior rules, respectively, which drive technological adoption of energy efficient or new end-uses. These rules are paired with hurdle rates to drive longer term projections.
One potential outcome of the process is to have either the weight parameters or the hurdle rates be in some way informed by behavioral rules or factors that incorporate societal trends/issues beyond the traditional cost-benefit/payback approach.
Hurdle rates are used to differentiate consumers, and are informed by surveys of commercial managers and estimates of consumer preferences for future energy savings.
The RDM bias parameters were previously based on shipment data by efficiency level and a goal seek exercise; more recently, data is harder to find, and reliance upon alternative sources has been necessary. There may be potential to inform the bias parameters with recent studies in the behavioral economics realm.
Both the RDM and the CDM have a group of fuel price elasticity parameters that capture an allowance for the “rebound effect”, which postulates that as the efficiency of a given end-use increases, so does service demand (albeit the impact is usually small). In addition, there is a parameter in the model that pushes more efficient technologies based on price, but that parameter is not currently active in the EIA reference case. Activating or performing further review on behavioral elements of price response is one possible avenue for further study.
There was discussion around whether EE programs impact the NEMS model and how. While no specific EE programs are explicitly captured, and there is no policy lever in the model, such issues are captured to the extent they color the underlying technologies being modeled. The comment was made that, as historical demand side management (DSM) has impacted appliance stock and consumption, the “momentum” of existing programs was implicitly captured.
EIA/Leidos TECHNICAL WORKSHOP
Analytic Report 4-2_20140822_FINAL.docx Leidos, Inc. 4-3
What followed was a far ranging discussion of behavioral concepts and energy efficiency policy issues. The following are key highlights of the discussion:
The existing modeling framework is pragmatically convenient, in the sense that the modeling structure works and is based on data that can be collected within a reasonably constrained amount of time/resource dedication. But is pragmatic convenience coupled with a theoretical framework that is potentially unsound ultimately problematic?
It was suggested that the challenges with the current framework may best be handled at the macroeconomic level and then transferred to the micro level, i.e. the NEMS end use consumption modules. While EIA has such debates internally rather frequently, the general consensus is that coverage of the macroeconomic drivers is good and well-captured. When thinking about how to deal with variables that may be impacting the future in a new way, the issue is predominantly a “micro” one, as it pertains to either an individual or a firm’s behavior, and whether such agents actually maximize utility, have transitive preferences, etc., and if they don’t, to what extent such deviation is grounds for a completely new framework and/or modifications to the existing framework.
There was discussion as to the priority that should be placed on forecasting the future as opposed to understanding strategies that will cause agents to change their behavior. It was noted that strategies to encourage or engage agents to adopt new technologies may be less important/relevant if they are not expected to occur in the future (i.e., if we don’t expect certain strategies, then they become irrelevant from a forecasting/modeling perspective). Embedding behavioral economics into the equation may be more a function of additional constraints within the existing framework, as opposed to trying to encourage agents with particular strategies, which is an external policy issue rather than an issue affecting EIA’s tangible forecasting needs.
No consumers have total information and seldom make rational economic decisions. As a result of a long tenure of EE program evaluation, it is fairly clear that various levels of information and financial stimulus can get people to invest in or procure particular end use measures such as technologies with “good certainty.” What is less clear is how the information flow and content impacts behavior – information flow can be thought of as the various types of information exchange mechanisms (e.g., types of media, word of mouth, etc.).
Energy demand and energy efficiency analysts do not have a good handle on behavioral change as it relates to EE/DSM programs, and that behavior is a function of three overarching issues:

Section 4
4-4 Leidos, Inc. Analytic Report 4-2_20140822_FINAL.docx
o Psychological issues such as predisposition to efficient appliances, location on the adoption curve (early adopter, laggard), etc.
o Market issues such as direct incentives, program information, education, etc.
o Cultural issues such as day-to-day interaction with others, word of mouth, and other “extra” trends within a given cohort
It was noted that people are different, and behavioral economics has demonstrated this somewhat obvious notion. However, given the right amount of information, issues such as payback and Internal Rate of Return (IRR) are valid substitutes for elusive and subjective issues or alternative variables that may not currently be measured. It is possible that some of these behavioral/non-economic issues are “in the noise”.
It was noted that the heterogeneity of the human condition is not in question, and this is not as much due to behavioral economics as it is common sense. However, when devising a model or an equation(s), you must, by definition, homogenize. Furthermore, there will always be some amount of omitted variable bias. Consequently, the combative characterization of neoclassical and behavioral economics in the literature must be replaced with a more complementary approach that attempts to infuse what data does exist on behavioral issues into the existing framework, which, as an abstraction of reality, for all practical intents and purposes, “works”. Additional caveats were made as follows:
o Limited interval surveys, anecdotal evidence, and isolated studies have limited tractability over an annual modeling cycle, since you cannot easily aggregate or synthesize disparate data elements. Such work is nonetheless extremely valuable, and EIA hopes to provide feedback about which specific end uses, consumer segments, etc., would be helpful for future research.
o EIA already performs a significant number of “what-if” cases that should not be ignored, despite the reference case tending to be the main focus of stakeholders.
o There is a cost-benefit issue intrinsic to this pursuit itself, in that the EIA and other agencies have limited resources, and the incremental improvement to forecast accuracy resulting from such efforts must be weighed against the cost, much like the “rational agent” paradigm being stress tested; therefore, in the long run, behavioral factors worthy of further study should be catalogued and prioritized.

EIA/Leidos TECHNICAL WORKSHOP
Analytic Report 4-2_20140822_FINAL.docx Leidos, Inc. 4-5
With regard to how one might consider adjusting the current model, the following observations were made:
o The RDM allocates shares of different equipment types based on a weighted formulation of capital cost and operating cost. This is not strictly neoclassical economics, since the model is not simply computing an NPV based on a discount rate. The weights are chosen in part based on behavioral issues.
o With regard to the microeconomic issues and notions of aggregate demand, the elasticity parameters embedded in the model, if statistically estimated, are informed by the behavior that has occurred historically.
o Furthermore, the hurdle rate structure is a potential avenue to incorporate behaviorally based risk premiums into the analysis, although what the mechanics of that would look like will take work.
It was noted that the current model imposes constraints on human/economic behavior, and the model works pretty well. Assuming that forecasting is important, the issue is whether any of the structural assumptions or constraints misses something important. One participant suggested that the model may work well only in describing the current situation but not in forecasting, as it can be calibrated to current data but miss the long-term.
One opinion was that the behavioral economics discipline is impactful in terms of policy design, as it can help shape how incentives and programs associated with purchase of durable goods are designed due to insights regarding subjective rates of time preference. However, at the aggregated level at which EIA is tasked with making long term projections, where more macro-level variables such as income tend to swamp heterogenic nuances, we end up with models that rationalize behavior well. EIA may utilize an essentially neoclassical model that has been roughly modified to handle behavioral concepts.
A participant suggested that, as NEMS is at essence a policy evaluation tool, it should address (or incorporate) behavioral issues.
If changes are long and protracted, then they will bear themselves out in the historical data over time, and the current model and forecasts may be adequate. However, if changes are rapid, then EIA may be ill-equipped to do much other than make analyst judgments and calibrations.
In distinguishing between (i) throwing the existing framework away and building something new or (ii) adding more detail and structure to the existing

Section 4
4-6 Leidos, Inc. Analytic Report 4-2_20140822_FINAL.docx
framework, the working group was in general agreement that the latter approach appears more reasonable. Specifically, it was noted that behavioral economics can help most immediately by relaxing constraints or adding constraints (or both).
One participant suggested examining the technology diffusion models used in the DOE Solar Program for other factors that could be used in the NEMS building demand modules.
The meeting transitioned into the concluding phase. The following summary of the overarching meeting themes was discussed:
While behavioral economics in the academic literature can help to modify and tweak the traditional neoclassical framework, there is no fully fleshed out alternative model in the behavioral economics literature that is cogent enough to supplant the existing EIA framework, which is a combination of rational agent model elements and certain behavioral elements;
While there may be some behavioral variables omitted from the structure, there appear to be avenues within the model for updating or creating additional parameter values; if key variables can be extracted from the literature and appended, that is a good thing;
If what is absent is nascent or slow moving in terms of its impact and things change gradually, then the underlying historical trends are also self-informed and self-updating, and the modeling structure implicitly captures these movements through the estimation/specification process;
There may be certain policies that are anticipated to have a significant short-to-medium term impact on demand for energy efficient products and that are worthy of further analysis and review; and
Further examination of adjustments must carefully balance the cost of gathering additional data with the perceived impact on the modeling structure from a forecasting perspective, as resources at EIA are not unlimited.
A memo communicating a detailed summary of the meeting was sent to all meeting invitees to obtain any additional feedback. A dossier regarding a current list of research papers on behavioral economics in energy demand analysis was provided to the group of experts (including those who did not attend) for them to suggest additional sources of data and information. However, Leidos received no response from this communication.

EIA/Leidos TECHNICAL WORKSHOP
Analytic Report 4-2_20140822_FINAL.docx Leidos, Inc. 4-7
4.3 Key Potential Behavioral Concepts While the meeting participants were generally supportive of the ideas that (i) the existing NEMS framework captured many behavioral issues fairly well and (ii) the state of behavioral economic research is unlikely to provide for a completely alternative model to the existing EIA framework, several key concepts and ideas around “levers” within the existing NEMS architecture to better capture behavioral issues came out of the meeting discussion and are outlined below.
Weight parameters or hurdle rates could incorporate behavioral rules or factors that capture societal trends and other issues beyond the traditional cost-benefit/payback approach.
The bias parameters in the RDM, which it seemed were not currently active in NEMS, might be infused with assumptions from recent studies in the behavioral economics realm.
Infusing behavior into NEMS may take the form of embedding trends in some simple way to capture cultural issues and trends regarding particular cohorts or market segments (e.g., demographics, level of sophistication/predisposition to new technology).
In addition to the hurdle rate structure and bias parameters that are incorporated into NEMS (although the latter may be inactive), there is also a time element to consumers’ decision-making, that may need to be incorporated and may in fact mislead analysts regarding the strength of a relationship (i.e., impact may be stronger but lag the event significantly).


Analytic Report 4-2_20140822_FINAL.docx
Section 5 LEIDOS TARGETED LITERATURE SEARCH
The landscape of literature on behavioral economics is vast and at times disparate in nature. Given the constraints of review time and the vast volume of content, Leidos’ literature review was focused on a three-phase approach that was designed to provide a targeted review of critical papers that could serve as a catalyst for alternative approaches to modeling aggregate demand.
The first phase involved collecting as many raw pieces of literature as possible. The data sources for the literature consisted of (i) pieces generated in advance of the first technical workshop by the Leidos team, (ii) pieces surfaced as part of the review of the attendees list for the workshop in terms of literature they may have been involved with, (iii) pieces circulated and/or distributed by the EIA and relayed to Leidos during and after the initial workshop, and (iv) a second pass by Leidos staff at uncovering existing research.
The second phase involved a high-level review of abstracts, conclusions, and key features of each paper in the queue. This was done in tandem with development of the bibliography that constitutes Section 7 of this report. Papers that were deemed to have the most potential to serve as catalysts for further development of potential alternative demand approaches were marked for more in-depth review in the third phase. The papers reviewed herein belong to the sub-group of filtered pieces reviewed in the third phase of the effort.
Papers encountered in the literature can broadly be categorized as one of the following three paper types:
Papers that focus on theoretical constructs associated with optimization and objective functions and alternative approaches to such formulae that deviate from the traditional paradigm, but that generally are purely theoretical and not applied with either empirical data or experimental design;
Papers that involve some sort of empirical exercise to demonstrate certain key theses of the given paper, and
Papers that are focused on examination of how behavioral economics can be applied in a marketing or policy context in terms of making certain energy efficiency programs or conservation measures more effective.
The overview presented in this section attempts to organize these papers in a sequence that relays a variety of possibilities based on the universe of different approaches and perspectives taken. The section that follows provides a summary and overview of key behavioral factors encountered in the literature, the data sources (if any) encountered, and the possible nexus of certain key concepts with the existing NEMS architecture (including notes on where certain elements may already be in NEMS that are of note in the papers reviewed).
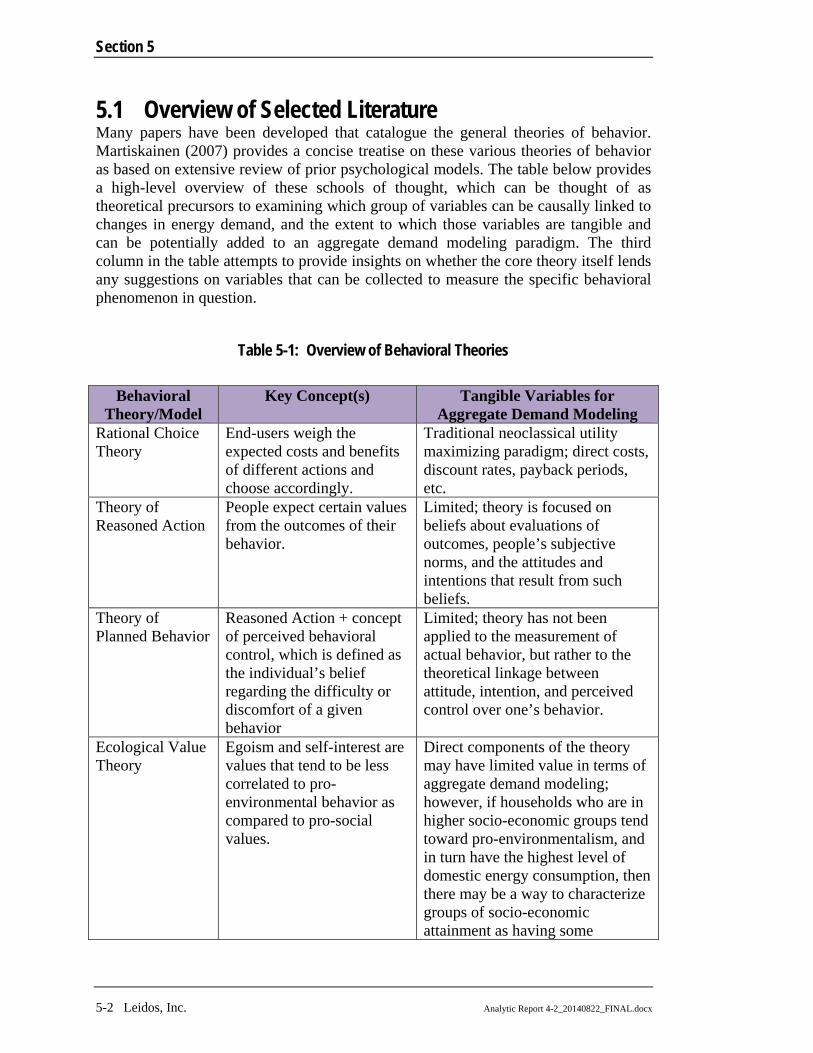
Section 5
5-2 Leidos, Inc. Analytic Report 4-2_20140822_FINAL.docx
5.1 Overview of Selected Literature Many papers have been developed that catalogue the general theories of behavior. Martiskainen (2007) provides a concise treatise on these various theories of behavior as based on extensive review of prior psychological models. The table below provides a high-level overview of these schools of thought, which can be thought of as theoretical precursors to examining which group of variables can be causally linked to changes in energy demand, and the extent to which those variables are tangible and can be potentially added to an aggregate demand modeling paradigm. The third column in the table attempts to provide insights on whether the core theory itself lends any suggestions on variables that can be collected to measure the specific behavioral phenomenon in question.
Table 5-1: Overview of Behavioral Theories
Behavioral
Theory/Model Key Concept(s) Tangible Variables for
Aggregate Demand Modeling Rational Choice Theory
End-users weigh the expected costs and benefits of different actions and choose accordingly.
Traditional neoclassical utility maximizing paradigm; direct costs, discount rates, payback periods, etc.
Theory of Reasoned Action
People expect certain values from the outcomes of their behavior.
Limited; theory is focused on beliefs about evaluations of outcomes, people’s subjective norms, and the attitudes and intentions that result from such beliefs.
Theory of Planned Behavior
Reasoned Action + concept of perceived behavioral control, which is defined as the individual’s belief regarding the difficulty or discomfort of a given behavior
Limited; theory has not been applied to the measurement of actual behavior, but rather to the theoretical linkage between attitude, intention, and perceived control over one’s behavior.
Ecological Value Theory
Egoism and self-interest are values that tend to be less correlated to pro-environmental behavior as compared to pro-social values.
Direct components of the theory may have limited value in terms of aggregate demand modeling; however, if households who are in higher socio-economic groups tend toward pro-environmentalism, and in turn have the highest level of domestic energy consumption, then there may be a way to characterize groups of socio-economic attainment as having some

LEIDOS TARGETED LITERATURE SEARCH
Analytic Report 4-2_20140822_FINAL.docx Leidos, Inc. 5-3
Behavioral Theory/Model
Key Concept(s) Tangible Variables for Aggregate Demand Modeling
influence on future demand. Value Belief Norm Theory
There are predictors of pro-social behaviors that can be compartmentalized into several categories of causal variables: attitudinal factors, contextual forces, personal capabilities, and habit/routine
Highest potential appears to reside within the contextual forces (monetary costs and benefits, support policies), and certain personal capabilities that can more easily be measured. Examples: energy price, owner/renter occupancy flags, literacy, income, and social status; NEMS model already captures certain elements of such factors
Symbolic Interactionism and Symbolic Self-Completion Theories
People purchase certain goods to construct their identity and to portray a certain image
N/A; highly nuanced personal influences related to identity cannot easily be measured without prohibitively costly survey work
Attitude Behavior Context Model
Behavior is a function of attitudinal variables and contextual factors.
Cross-referenced with Value Belief Norm Theory above, does not provide additional potential variables, save for the notion that if the general contextual framework around energy conservation and energy efficiency could somehow be characterized as a variable, and then coupled with survey data on attitudes, that could help determine what proportion of people would engage in a certain behavior through understanding the ease of the action coupled with the attitudes involved.
Theory of Interpersonal Behavior
Intentions and habits must be considered as drivers of behavior in addition to other contextual factors.
Model is a complex interaction of rational, social, normative, and emotional factors. Less utilized in empirical work due to its complexity; certain habits can be very difficult to measure.
Persuasion theory Behavior is a function of the credibility, persuasiveness, and message content associated with a given persuasive effort. Behavior can be impacted by
Persuasion and advertising impacts are generally captured in certain diffusion constructs (e.g. Bass Diffusion) or alternatives; however, the intersection of such concepts with aggregate demand

Section 5
5-4 Leidos, Inc. Analytic Report 4-2_20140822_FINAL.docx
Behavioral Theory/Model
Key Concept(s) Tangible Variables for Aggregate Demand Modeling
messaging that is sufficiently persuasive.
modeling is less well defined.
Social Learning Theory
There are learning effects associated with personal experience and observing the behavior of others within a close social circle
Limited; learning impacts are difficult to measure without prohibitively costly and time consuming survey work
Arising from the tabularization above and from the investigations alluded to in Martiskainen are several factors that may be worthy of further consideration as it relates to aggregate demand modeling. These factors are (i) measures of feedback and the associated dollars expended on providing detailed feedback to end-users, (ii) measures of the amounts expended on rewards, incentives, or competitions associated with inciting behaviorally induced change, and (iii) certain causal variables, derived from the Value Behavior Norm theory and related theories, that have potential to be measured or which are already measured and included in the NEMS framework, such as energy price, owner/renter occupancy flags, literacy, income, and social status.
A compelling list of behavioral economics principles that can inform energy policy was prepared by Houde and Todd in 2011. This list captures such principles and places them into the following categories:
Framing principles, which focus on how information is transferred, or framed, relative to how consumers perceive reality. Examples include loss aversion, default/status quo effects, and sunk costs.
Choice architecture and heuristics, which relates to how choices are organized. Examples include choice overload and the compromise effect. The authors suggest that certain choice architectures can be designed to “nudge” consumers into a particular decisional direction.
Pro-social behavior, which refers to how agents respond to societal cues regarding a particular decision or perspective; examples include acting for status/self-image improvement or visibility, inequality/punishment factors, and social norms (or achievement and well-being relative to others).
Time Inconsistency/Commitment Mechanisms, which relates to individuals tending to procrastinate and put off costly changes. Examples include a distinct preference towards avoiding near term costs even in the face of longer-term savings (which may go beyond any reasonable discount rate) and habit formation.
Incentive structures, which focus on the nature of incentives, both monetary and non-monetary, and the impact such structures have on choices. Examples include in-kind gifts, tournaments/competitions, and lotteries (which provide a small chance for a very large reward).

LEIDOS TARGETED LITERATURE SEARCH
Analytic Report 4-2_20140822_FINAL.docx Leidos, Inc. 5-5
Stern (2000) defines environmentally significant behavior as consisting of (i) environmental activism, (ii), non-activist public sphere behaviors, (iii) private sphere environmentalism, and (iv) other behaviors. While Stern does not posit a general causal theory regarding which variables can be used to determine the extent and nature of environmentally significant behavior, there is evidence to suggest that personal capabilities, such as literacy, social status, financial resources, and behavior-specific knowledge and skills can be a determinant for the amount of private sphere environmentalism that can be expected at the agent level. Private sector environmentalism, which includes consumer purchase behaviors, maintenance of household equipment, and changes in equipment use, including curtailment, can have the potential to have the most significant impact on long-term energy usage, as contrasted to more extrinsic elements of environmentally significant behavior, such as petitioning or joining activist groups. This suggests that directly measureable financial factors may well drive a good portion of the environmentally significant behaviors, but perhaps in a manner counter to historical expectations (i.e., certain income ranges or levels of educational attainment may well be negatively correlated with consumption, all else equal, due to the impact these factors may have on values). Interestingly, Stern finds that environmental activism was significantly associated (negatively) with age and income.
A team of researchers from Portland State University, the California Energy Commission, and Pacific Gas and Electric (Lutzenhiser, 2010) reviewed the state of residential energy consumption models to identify behavioral issues and other factors that lead to inaccurate modeling outcomes and conservative policy approaches with respect to energy efficiency. The discussion captures viewpoints and issues from the technology, economics, psychology, and social studies perspectives to collect examples of departures in assumptions or flaws in the typical energy modeling paradigm. The paper closes with thoughts on rationalizing the typical modeling approaches, particularly whether aggregate models miss underlying variability in behavior, resulting in suboptimal energy policy.
Diamond and others from the Lawrence Berkeley Nuclear Laboratory and the University of California Energy Institute argue, in a recent paper, for changing the energy efficiency focus to look at absolute levels of energy consumption (i.e., an extensive variable) rather than the relative energy efficiency for a given level of energy services (i.e., an intensive variable). Their arguments include that doing so simplifies and clarifies the policy prescriptions and more effectively serves the goal of sustainability. The paper includes discussions regarding the “rebound effect” (i.e., an increase in energy services demand driven from an effective drop in the cost of energy services due to improved energy efficiency), labeling related to energy efficiency that is inconsistent with the ultimate goals of EE policy, particularly given changing consumer and business behavior, and concluding remarks on policy prescriptions.
RLW Analytics, assisted by Skumatz Economic Research Associates, Inc., prepared a lengthy report for the California Public Utilities Commission on the efficacy of the 2004 and 2005 California Statewide Energy Star® New Homes Program (ESH Program). The ESH Program provides financial incentives, education, and marketing assistance to California builders who construct new residences that exceed the state’s

Section 5
5-6 Leidos, Inc. Analytic Report 4-2_20140822_FINAL.docx
mandatory minimum EE standards. The evaluation relied primarily upon engineering-based estimates, calibrated to modeled usage data for affected end uses, of the impact of EE measures, adjusted by a net-to-gross (NTG) factor. The NTG factor was based on surveys to determine free ridership, behavioral changes to the EE measures (e.g., rebound effect), and market effects (e.g., spillover due to awareness of program-driven EE measures by non-participants), although only the free ridership issue was reflected in the ultimate NTG used in the savings estimates. The report conclusions include a summary of participating homes and energy savings estimates, compared to savings anticipated by the utilities administering the program.
Gillingham and others (2009) present a framework for conceptualizing energy efficiency decisions as a tradeoff between energy and capital for the provision of energy services. They utilize this framework for clarifying a range of market and behavior failures as divergences from economically efficient outcomes. The paper provides a discussion of, and classification regime for these failures, and offers example energy policy measures to alleviate the resulting gap in energy efficiency investment relative to economically optimal levels.
In a 2009 paper, Gowdy calls rational choice theory untenable and offers that behavioral failures, rather than reflecting anomalies or unusual departures from the rational actor model, reflect the complexity of human decision-making. The paper anticipates that behavioral economics will result in a unified model of decision-making to inform, for example, sustainability policy. Examples of behavioral issues driving sustainability mores are analyzed with policy implications in mind.
The International Energy Agency published a report in 2007 providing a detailed discussion regarding a widespread market barrier to optimal energy efficiency investment—the principle-agent problem. The book provides a detailed explanation of the principle-agent problem and presents analyses of the magnitude of energy demand for a range of affected appliances via case studies in several different countries.
Researchers from the University of California Center for Energy and Environmental Economics (2012) analyzed the extent to which dwelling and demographic characteristics determined residential energy consumption in the Netherlands. The analysis reflected a cross sectional econometric framework involving observations from 300,000 dwellings over January 2008 to December 2009. Dwelling characteristics reflected in the analysis included dwelling type (single family, duplex, etc.), age, number of rooms, thermal and quality characteristics, and location. Demographic characteristics included family size, age, marital status, ethnicity, and income. Data regarding appliances in the dwellings were not researched. Their analysis concluded that natural gas consumption tended to be more a function of dwelling characteristics than demographic variables, while electricity consumption tended to be more strongly a function of income and family composition.
Sanstad and Howarth (1994) argue that even “substantive rationality” is an inaccurate description of consumer decision-making and present a case for policy intervention to reduce the impacts of market and behavioral failures on energy efficiency. However, they also recognize that the theoretical framework for incorporating behavior into a

LEIDOS TARGETED LITERATURE SEARCH
Analytic Report 4-2_20140822_FINAL.docx Leidos, Inc. 5-7
unified energy demand modeling approach is not sufficiently developed (or was not at the time). The authors suggest the phasing out of heuristic and constant energy services assumptions in favor of more realistic behavioral assumptions and the need to cut across the disciplines of economics, psychology, sociology, and other fields to addressing complex policy questions.
Allcott (2009) notes that consumers may be “inattentive”, and myopic with respect to energy price expectations for the future, which can in large part explain the gap between the predictions of the rational agent framework, and could provide an economic justification for a standards-based approach that moves consumers into more efficient goods. The presentation recommends further laboratory experimentation to target customer attentiveness.
Dahl (1993) provides an extensive amount of documentation regarding econometric modeling frameworks that can be used to project energy demand and elasticity. These models are generally based on relating energy to measures of income, own-price and cross price elasticity, weather variables, lag structures of the dependent variable, appliance stock, and various other mathematical variations of traditional utility forecasting models. Of note in this piece is the relatively limited emphasis on the key behavioral variables noted in Martiskainen, which is in part due to the tractability of the behavioral concepts from a variable construction and quantitative perspective.
Gabaix (2011) presents a sparsity-based model of bounded rationality. Within this framework, the agent in question is represented much like an economic modeler, in the sense that a given decision is made with a few key variables that have non-zero decisional weights, thereby making the model “sparse”, and consequently, the loss associated with making a more complex decision with far more variables is minimized by the decision maker using a parsimonious framework. As examples, Gabaix cites the fact that decision makers may be anchored on certain default values, such as discount rates, which only in certain instances adjust towards the truth. Furthermore, Gabaix cites evidence that sales matter more for lower priced goods than higher priced goods, and that regardless of the consequences, people generally spend around one hour on retirement planning. This suggests that the minimization problem is predicated upon minimizing the expected loss from an imperfect model. Gabaix cites further work that will explore bounded rationality in a dynamic programming context. However, the current framework is entirely theoretical and does not present any empirical work or experimental economics design.
Iacoviello and Pavan (2008) present three different models of housing transactional costs. In the first model, transactional costs are set to zero, rendering housing fully liquid. In the second model, transactional costs are free if the net housing investment does not exceed 3% of the initial period value. Finally, in a “lumpy” housing model, every housing transaction incurs a 3% transaction cost proportional to the value of the initial stock. The paper shows that during “lumpy” housing market conditions, personal savings rates are higher and interest rates are lower. Furthermore, they conclude that patience is a key driver for why a certain portion of the population never accumulates any wealth beyond their initial housing down payment. The paper’s three separate modeling constructs all demonstrate a pro-cyclical relationship between housing investment and the economy, the fact that housing investment is a leading

Section 5
5-8 Leidos, Inc. Analytic Report 4-2_20140822_FINAL.docx
indicator of GDP, and that housing investment is more volatile than business investment. From the perspective of aggregate demand modeling, a key variable of note is the personal savings rate. As uncertainty regarding the housing market and future wealth shocks increases, the personal savings rate should, in theory, increase, as end users hedge against said future wealth shocks. In the commercial utility forecasting space, the use of the personal savings rate can be an effective explanatory variable in terms of explaining more recent softness in residential loads7.
Moss (2008) reviews the main approaches to market segmentation, and notes that behavioral economics principles can be used to map messaging and collateral to carefully segmented groups within a given utility. He goes on to note that such segments are not necessarily commensurate with the classical utility rate classifications or retail classes (e.g. residential, commercial, or industrial). Segmentation may indirectly lend itself to certain quantitative approaches that attempt to segment demand. However, given that reports of demand are typically provided commensurate with retail classes, certain sub-segment nuances related to consumption patterns may not be tractable for modeling purposes, and would best be served as a basis for marketing effective energy efficiency programs.
7 Based on energy demand forecasting work prosecuted by Leidos for a variety of electric utilities across the United States.

Analytic Report 4-2_20140822_FINAL.docx
5.2 Concepts and Methodologies in Behavioral Economics Literature The table below summarizes the targeted literature review, capturing the authorship details, nature of the published document, the primary BE theme(s) and factors that are discussed therein, whether the paper reflected a modeling effort utilizing significant data, and whether the study had implications that were useful for aggregate energy demand modeling (and whether such usefulness was direct, meaning that the concept(s) were immediately portable to a model like NEMS rather than being associated simply with philosophical issues or requiring some additional modeling infrastructure).
Table 5-2: Summary of Targeted Literature Review
Title Author(s) Year Nature of Paper Behavioral Economics Theme
and Factors Data
Intensive
Usefulness for Aggregate
Energy Demand Modeling
Sticky Points in Modeling Household Energy Consumption
Portland State University, CEC, and PG&E
2010
Discussion regarding the state of energy demand analysis and modeling with a focus on representation of behavior from various discipline perspectives
Lack of behavior representation in energy demand models; considers rebound, high implied discount factors, and social norms; perspective is primarily EE program design
No Low/Indirect
Don’t Supersize Me! Toward a Policy of Consumption‐Based Energy Efficiency
LBNL and Univ. of CA Energy Institute
2006
Discussion regarding transitioning EE goals from intensive (e.g., energy use per $ of GDP) to “extensive” (simply energy use or carbon output) and drivers of increasing energy consumption
Failures in current EE policy; Discusses rebound, various market failures, and alternative measures of energy efficiency; perspective is EE policy
No Low/Indirect
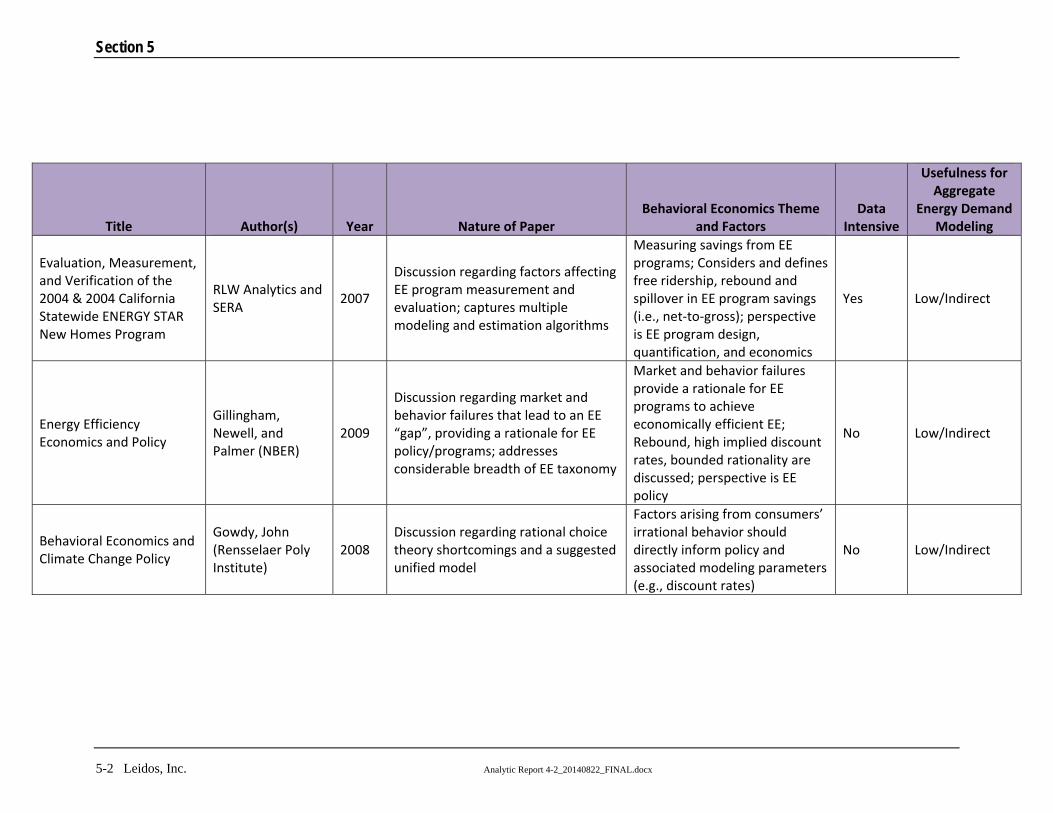
Section 5
5-2 Leidos, Inc. Analytic Report 4-2_20140822_FINAL.docx
Title Author(s) Year Nature of Paper Behavioral Economics Theme
and Factors Data
Intensive
Usefulness for Aggregate
Energy Demand Modeling
Evaluation, Measurement, and Verification of the 2004 & 2004 California Statewide ENERGY STAR New Homes Program
RLW Analytics and SERA
2007
Discussion regarding factors affecting EE program measurement and evaluation; captures multiple modeling and estimation algorithms
Measuring savings from EE programs; Considers and defines free ridership, rebound and spillover in EE program savings (i.e., net‐to‐gross); perspective is EE program design, quantification, and economics
Yes Low/Indirect
Energy Efficiency Economics and Policy
Gillingham, Newell, and Palmer (NBER)
2009
Discussion regarding market and behavior failures that lead to an EE “gap”, providing a rationale for EE policy/programs; addresses considerable breadth of EE taxonomy
Market and behavior failures provide a rationale for EE programs to achieve economically efficient EE; Rebound, high implied discount rates, bounded rationality are discussed; perspective is EE policy
No Low/Indirect
Behavioral Economics and Climate Change Policy
Gowdy, John (Rensselaer Poly Institute)
2008 Discussion regarding rational choice theory shortcomings and a suggested unified model
Factors arising from consumers’ irrational behavior should directly inform policy and associated modeling parameters (e.g., discount rates)
No Low/Indirect

LEIDOS TARGETED LITERATURE SEARCH
Analytic Report 4-2_20140822_FINAL.docx Leidos, Inc. 5-3
Title Author(s) Year Nature of Paper Behavioral Economics Theme
and Factors Data
Intensive
Usefulness for Aggregate
Energy Demand Modeling
Mind the Gap IEA 2007
Report on estimation of impact of market barriers to socially optimal energy efficiency, particularly the principle‐agent (PA) problem; Extension of agency theory to energy efficiency issues; Estimates of amount of energy use subject to PA issues
Market barriers that can be circumvented are a significant contributor to the EE gap; PA issues, lack of information, externalities, and poor capital access are discussed in detail across numerous case studies
Yes Low/Direct
Behavioral Economics and Energy Policy
Hunt Allcott 2009
Presentation on the perception of consumers as it relates to “mis‐optimization” around gasoline prices and fuel efficient vehicles; suggests that laboratory experiments may be a good way to decipher whether consumers truly undervalue future energy costs
Consumers may be inattentive to changes in gasoline price expectations; myopia and inattention could explain the “Energy Efficiency Gap”; suggest field experiments as a key potential approach to falsification of rational agent theories
Yes Low/Indirect
Toward a Coherent Theory of Environmentally Significant Behavior
Paul Stern 2000
Review of existing theories on causal factors and key driving variables that determine the nature and extent of environmentally significant behavior in an agent
Literacy, social status, and financial resources are posited to drive private‐sphere environmentalism, which includes consumer purchase behaviors and maintenance of equipment, which directly impacts energy usage
No Med/Direct

Section 5
5-4 Leidos, Inc. Analytic Report 4-2_20140822_FINAL.docx
Title Author(s) Year Nature of Paper Behavioral Economics Theme
and Factors Data
Intensive
Usefulness for Aggregate
Energy Demand Modeling
List of Behavioral Economics Principles that can inform Energy Policy
Sebastien Houde & Annika Todd
2011
Compartmentalizes a series of key factors that can inform energy policy into five key areas, namely framing, choice architecture, pro‐social behavior, time inconsistency, and incentives
Nature of EE incentives (program expenditures tracked as inputs to NEMs) may be a potential variable for experimentation; discount rates are also mentioned, which are already a component of the NEMS framework
No Med/Direct
Affecting Consumer Behavior on Energy Demand
Mari Martiskainen 2007
An in‐depth review of the current state of behavioral theories, and a discussion of the best methods to link behavioral change to a particular set of tactics. Based on the UK Energy Efficiency Commitment.
Feedback on energy use, in various forms, as well as the nature of financial rewards and incentives, community based campaigns and contests, and other direct behavioral interventions at the utility level, for which data could be collected, may be useful in aggregate demand modeling.
No Med/Direct
A Survey of Energy Demand Elasticities in Support of the Development of NEMS
Carol Dahl 1993
Summarizes and specifies a vast number of modeling constructs aimed at estimating elasticity for various consumables and reports such elasticity values
Detailed description of existing econometric specifications associated with determinations of elasticity; treatment of commonly noted behavioral factors is limited
No Low/Indirect

LEIDOS TARGETED LITERATURE SEARCH
Analytic Report 4-2_20140822_FINAL.docx Leidos, Inc. 5-5
Title Author(s) Year Nature of Paper Behavioral Economics Theme
and Factors Data
Intensive
Usefulness for Aggregate
Energy Demand Modeling
Residential Energy Use and Conservation: Economics and Demographics
Brounen & Kok (Netherlands), Quigley (UC Berkeley)
2011
Report on a study of the impact of physical housing and demographic characteristics on energy consumption in the Netherlands
Demographic characteristics matter more for electricity consumption than dwelling characteristics, while the reverse appears to be true for gas consumption
Yes Med/Direct
Consumer Rationality and Energy Efficiency
Sanstad (LBNL) and Howarth (UC Santa Cruz)
1994
Paper examines methodological disparities between rational choice theory and alternative approaches, noting some shortcomings of BE research
Substantial departures from rationality that are evident in consumer behavior result in energy market inefficiency and justify EE programs; bounded rationality is the primary identified factor
No Low/Indirect
A Sparsity‐Based Model of Bounded Rationality
Xavier Gabaix 2011
An end‐user simplifies the world by assigning zero weights to a host of decision variables, such that the minimization of loss from a more simplified model for decision making is the focus of most decisions. Rationality is thereby “bounded” by the parsimonious nature of how an agent removes variables from reality
People pay attention to large deviations from the average and a limited set of intertemporal variables, such as their short‐term income; Paper is highly theoretical and generally not empirically‐based
No Low/Indirect

Section 5
5-6 Leidos, Inc. Analytic Report 4-2_20140822_FINAL.docx
Title Author(s) Year Nature of Paper Behavioral Economics Theme
and Factors Data
Intensive
Usefulness for Aggregate
Energy Demand Modeling
An Equilibrium Model of Lumpy Housing Investment
Iacoviello and Pavan
2008
“Lumpy” housing does matter in terms of aggregate consumption and investment. The authors use three modeling frameworks to demonstrate that lumpiness in housing adjustment increases the volatility of aggregate consumption, and that savings rates are higher during periods of “lumpy” housing.
The personal savings rate is higher during periods of “lumpy” housing. The personal savings rate has promise as a basis for explaining recent softness in residential sector energy demand.
Yes High/Direct
Market Segmentation and Energy Efficiency Program Design
Steven J. Moss 2008
Market segmentation as applied to a whole host of other consumer goods can be a powerful tool for utilities that are looking to market Energy Efficiency programs more effectively. Market segments must be differentiated from classical utility notions of retail classes (e.g. residential, commercial, industrial, etc.).
Behavioral factors can be used to better design messaging and marketing collateral based on attitudes, tastes, and preferences. Detailed information on how utilities are segmenting customers would be divergent and disparate and may not translate well for aggregate demand modeling.
No Low/Indirect

Analytic Report 4-2_20140822_FINAL.docx
5.3 Commonly-encountered Behavioral Issues In light of the above targeted literature review and Leidos’ internal discussions regarding the themes and factors encountered within the literature that may serve as catalysts for further experimentation, the following variables are noted as being front-of-mind throughout the pieces reviewed (note: there are clearly a far more vast universe of behavioral factors and nuances that were mentioned in the literature than what is contained in the targeted list below):
Bounded rationality – Consumers do not always make optimal economic decisions reflective of rational behavior. Previously identified behaviors, such as simplified decision rules (e.g., default preference, compromise effect), salience effect (i.e., over-weighting of readily observable factors), status quo preference (e.g., proclivity to existing technologies) and sunk cost effect (i.e., preference for currently installed equipment), tend to limit the impacts of shifts in the relative economics of competing fuels.
Procrastination – Consumers tend to take an inordinate amount of time between making decisions and acting on them. Accordingly, the lag between economic justification of action and the resulting action can be very long, dampening the effect of changes in relative economics of competing fuels or technologies.
Principal-agent situations – Some proportion of residential and commercial structures are subject to rental arrangements for which the tenant has no control over major end uses but is responsible for the operating costs. Studies estimate the amount of energy use by appliance type subject to this situation at 25 percent to nearly 70 percent. This leads to suboptimal economic outcomes in the form of purchases of inefficient appliances whose cheaper capital costs are more than offset by more expensive operating costs. The differential in ability to make improvements to the home or business that would help reduce usage is one of the main points surrounding the potential for occupancy status to have an impact on pro-social behavior and concordantly consumption.
Demographic issues – Households with young or old householders tend to consume less energy, all else equal. A related issue is that, while household size is a significant determinant of energy consumption, particularly electrical energy, young children tend to be correlated with energy consumption.
Personal savings behavior – While income is a commonly-accepted determinant of energy consumption (perhaps to a point), changes in the propensity to spend v. save have some impact on energy consumption. Recent empirical work at the individual utility level suggests that the personal savings rate can be a functional explanatory variable; furthermore certain literature on the “lumpiness” of the housing market (e.g. high transactional costs associated with moving) appears to suggest that the personal savings rate is much higher during periods of more uncertainty in the housing market. End-user concerns

Section 5
5-2 Leidos, Inc. Analytic Report 4-2_20140822_FINAL.docx
regarding longer term income prospects and other conservative behaviors that may not be strictly “rational” relative to the costs and benefits of a given choice bundle of goods may be indirectly measured by how and if saving is occurring across end-users. This appears likely to be a factor in the post-2009 recession weakness of residential energy demand.
Adoption of social norms – Consumers tend to be influenced by the actions, or even perceived actions, of others. This includes a range of energy efficiency behaviors and energy-related capital spending decisions, like the purchase of energy efficient appliances. This may be a factor in the long lag between changes in energy prices and influences on energy consumption behavior.
Environmentalism behavior – While income tends to be positively related to energy consumption, some studies have shown that higher incomes are also related to improved energy efficiency, perhaps due to higher education attainment (literacy) or greater leisure.
Segmentation of Income Levels – The literature suggests theories predicated upon the positive relationship between increasing levels of income and a greater desire to engage in environmentally significant and/or pro-social behavior. This suggests that the traditional elastic relationship between income levels and ever-increasing amounts of consumption may reach an inflection point, after which pro-social behavior creates a more inelastic income-to-usage relationship. Similar to the bullet above, segmenting end-users based on income level may be a tractable approach to generating more realistic trends in usage or even in terms of determining alternative discount rates.
Monies Expended on Feedback on Energy Usage, Competition, and Advertising of Behaviorally Based Programs – The literature suggests that one of the main uses of behavioral economics is as a tool to prepare marketing collateral to encourage pro-social behavior or uptake of certain energy efficiency programs. Specifically, feedback on one’s usage, the introduction of competitions and associated campaigns, and advertising of other programs that are rooted in behavioral economics theory can have a significant impact on impacting end-user choices. Consequently, some financial measure of such expenditures may help explain deviations in aggregate demand and the speed at which certain demand-altering constructs diffuse into the general populace.
Large Deviations from Average or “Steady-State” commodity prices – The sparsity-based model suggests that consumers assign zero values to a large number of potential choice vector parameters, thereby paying attention to a smaller, more manageable and parsimonious set of factors when making decisions. Large deviations from average level energy prices, both own-price and cross-price, could potentially spark a certain amount of attention in the non-zero variable set for a consumer base that has been shown in the literature to be at least partially “inattentive” to energy prices given their relative standing as compared to other key expenses. Whereas decreases in energy

LEIDOS TARGETED LITERATURE SEARCH
Analytic Report 4-2_20140822_FINAL.docx Leidos, Inc. 5-3
prices may not be afforded specific attention, large deviations on the high-side may be given undue attention relative to their magnitude.

Analytic Report 4-2_20140822_FINAL.docx
Section 6 INITIAL FINDINGS
6.1 Commonly Encountered Behavioral Variables in the Literature (priority list)
Leveraging the variable list summarized in Section 5, Leidos has created a three-pronged rubric for assigning preliminary priority to each behavioral issue. The prongs of this approach are as follows:
1. Tractability. Tractability is herein defined as a preliminary view regarding the availability of actual data that is subject to an allowable amount of measurement error and that may be directly applicable to sandbox experimentation without prohibitively expensive or time-consuming primary research. While the literature has certainly pointed out a slew of interesting theoretical principles (e.g. buying something to craft one’s identity), not all of these factors are tractable for aggregate demand modeling. Additionally, to the extent that the NEMS model already contains some structure that captures a behavioral concept that could be tweaked or adjusted, then said concept has relatively high tractability, as there is no need to create any new infrastructure around that notion.
2. Impact. Impact is herein defined as a preliminary view on the likelihood that a given behavioral factor will have a significant impact on either the existing modeling framework on within the confines of an alternative modeling framework. This view on impact is generally based on the literature review, Leidos’ existing and prior forecasting work in the utility markets, and our preliminary brainstorming regarding what is likely to work and not work as the experimental phase unfolds.
3. Consensus. Consensus is herein defined as the level to which the existing literature that has been reviewed is of common opinion regarding the directionality or significance of a given behavioral factor. To the extent that such consensus does not exist, additional difficulties related to cross-referencing any sandbox findings with theoretical expectations may be present.
The table below attempts to assign a preliminary ranking for each behavioral factor based on the three prongs above, as a precursor to additional research and experimentation.
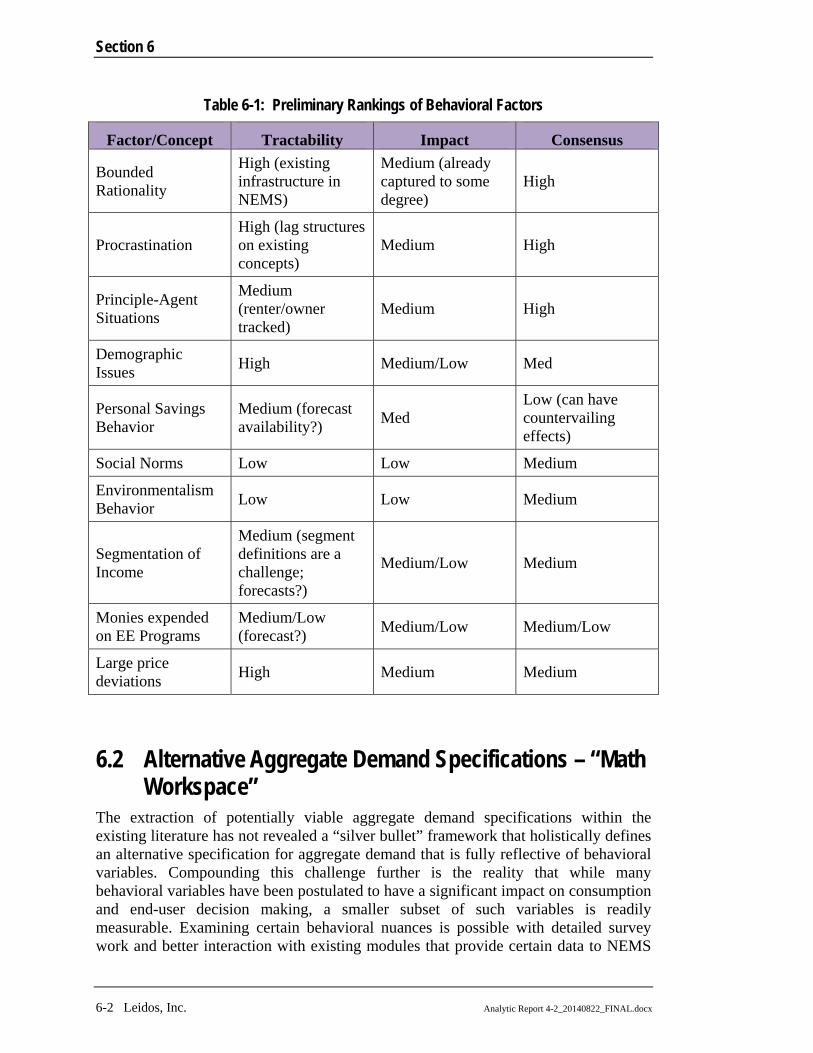
Section 6
6-2 Leidos, Inc. Analytic Report 4-2_20140822_FINAL.docx
Table 6-1: Preliminary Rankings of Behavioral Factors
Factor/Concept Tractability Impact Consensus
Bounded Rationality
High (existing infrastructure in NEMS)
Medium (already captured to some degree)
High
Procrastination High (lag structures on existing concepts)
Medium High
Principle-Agent Situations
Medium (renter/owner tracked)
Medium High
Demographic Issues High Medium/Low Med
Personal Savings Behavior
Medium (forecast availability?) Med
Low (can have countervailing effects)
Social Norms Low Low Medium
Environmentalism Behavior Low Low Medium
Segmentation of Income
Medium (segment definitions are a challenge; forecasts?)
Medium/Low Medium
Monies expended on EE Programs
Medium/Low (forecast?) Medium/Low Medium/Low
Large price deviations High Medium Medium
6.2 Alternative Aggregate Demand Specifications – “Math Workspace”
The extraction of potentially viable aggregate demand specifications within the existing literature has not revealed a “silver bullet” framework that holistically defines an alternative specification for aggregate demand that is fully reflective of behavioral variables. Compounding this challenge further is the reality that while many behavioral variables have been postulated to have a significant impact on consumption and end-user decision making, a smaller subset of such variables is readily measurable. Examining certain behavioral nuances is possible with detailed survey work and better interaction with existing modules that provide certain data to NEMS

INITIAL FINDINGS
Analytic Report 4-2_20140822_FINAL.docx Leidos, Inc. 6-3
(e.g. macroeconomic module)8, but, in general, the most promising alternatives are predicated upon re-simulating (with different assumptions) or altering certain sub components of the NEMS modules.
The above challenges notwithstanding, Leidos’ review of the literature uncovered the following top-level specifications that warrant further study. These mathematical concepts are the result of the literature review that Leidos conducted and a subsequent open brainstorming session by Leidos staff. These concepts are intended to spark further critical thinking and research regarding exactly how to translate these ideas into a mathematical structure suitable for experimentation within a portion of the NEMS architecture or offline side analyses. It is anticipated that this “Math Workspace” will evolve into a separate working file to house alternative specifications for demand that originate from EIA staff or other sources and that Leidos will participate in ongoing discussions regarding whether and how to experiment with certain ideas (if at all) in an effort to codify how the process will move forward and determine Leidos support activities in the next project phase.
1. Sparsity-based model of Bounded Rationality – individuals minimize the
economic loss due to an imperfect but parsimonious choice domain filled with
a subset of all possible choice variables, much like an economic modeler. The
decision model is “sparse”, in the sense that it contains a limited number of
non-zero parameters.
a. min ∑ ∑ | |
In terms of interpretation of this framework for aggregate demand, one way to
think about this theory would be to resolve that aggregate demand is a function
of a sparse set of variables, and that only large perturbations in prices or other
deviations from moving averages will be sufficiently attention-worthy to spark
behavioral change.
b. , where the second function
represents deltas in a given variable(s) that may be significant
determinants of demand over a longer lag period (or may not,
depending on whether they are deemed important by the consumer).
2. Segmentation of demand. A significant amount of feedback was garnered
regarding the need to perhaps further segment demand based on some key
8 Refer to the subsection below for ideas raised at the March 2014 Follow-up workshop in this regard.
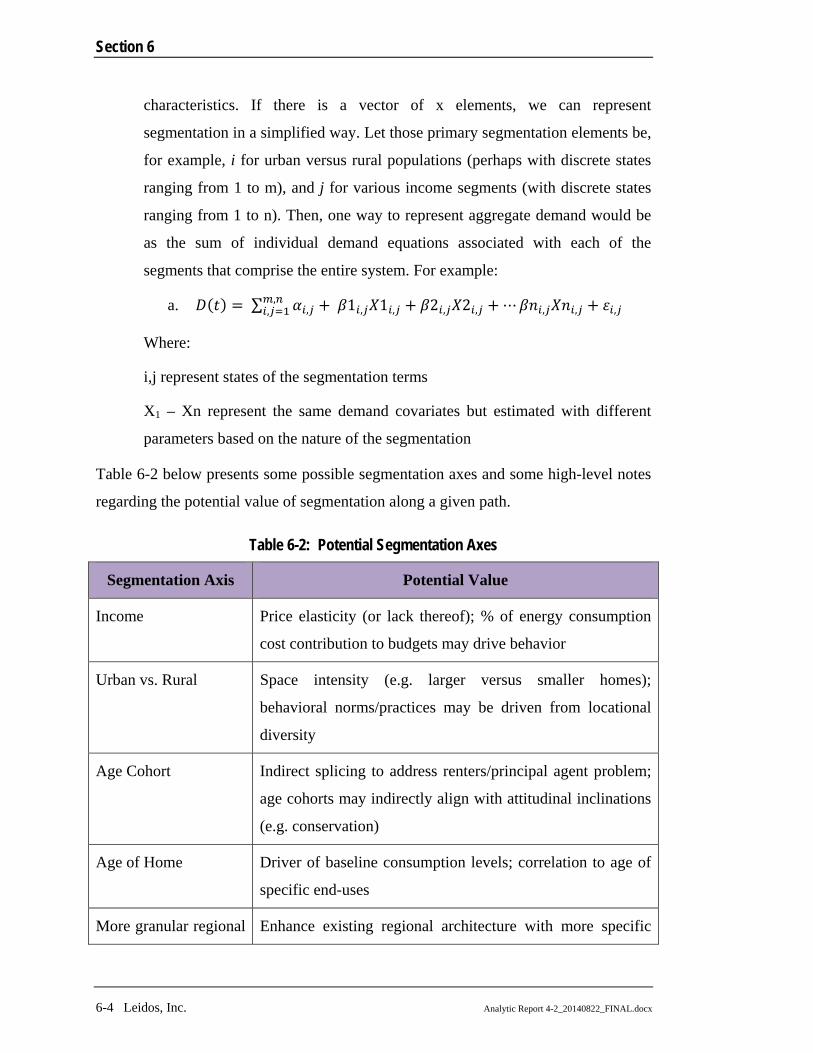
Section 6
6-4 Leidos, Inc. Analytic Report 4-2_20140822_FINAL.docx
characteristics. If there is a vector of x elements, we can represent
segmentation in a simplified way. Let those primary segmentation elements be,
for example, i for urban versus rural populations (perhaps with discrete states
ranging from 1 to m), and j for various income segments (with discrete states
ranging from 1 to n). Then, one way to represent aggregate demand would be
as the sum of individual demand equations associated with each of the
segments that comprise the entire system. For example:
a. ∑ , 1 , 1 ,,, 2 , 2 , ⋯ , , ,
Where:
i,j represent states of the segmentation terms
X1 – Xn represent the same demand covariates but estimated with different
parameters based on the nature of the segmentation
Table 6-2 below presents some possible segmentation axes and some high-level notes
regarding the potential value of segmentation along a given path.
Table 6-2: Potential Segmentation Axes
Segmentation Axis Potential Value
Income Price elasticity (or lack thereof); % of energy consumption
cost contribution to budgets may drive behavior
Urban vs. Rural Space intensity (e.g. larger versus smaller homes);
behavioral norms/practices may be driven from locational
diversity
Age Cohort Indirect splicing to address renters/principal agent problem;
age cohorts may indirectly align with attitudinal inclinations
(e.g. conservation)
Age of Home Driver of baseline consumption levels; correlation to age of
specific end-uses
More granular regional Enhance existing regional architecture with more specific
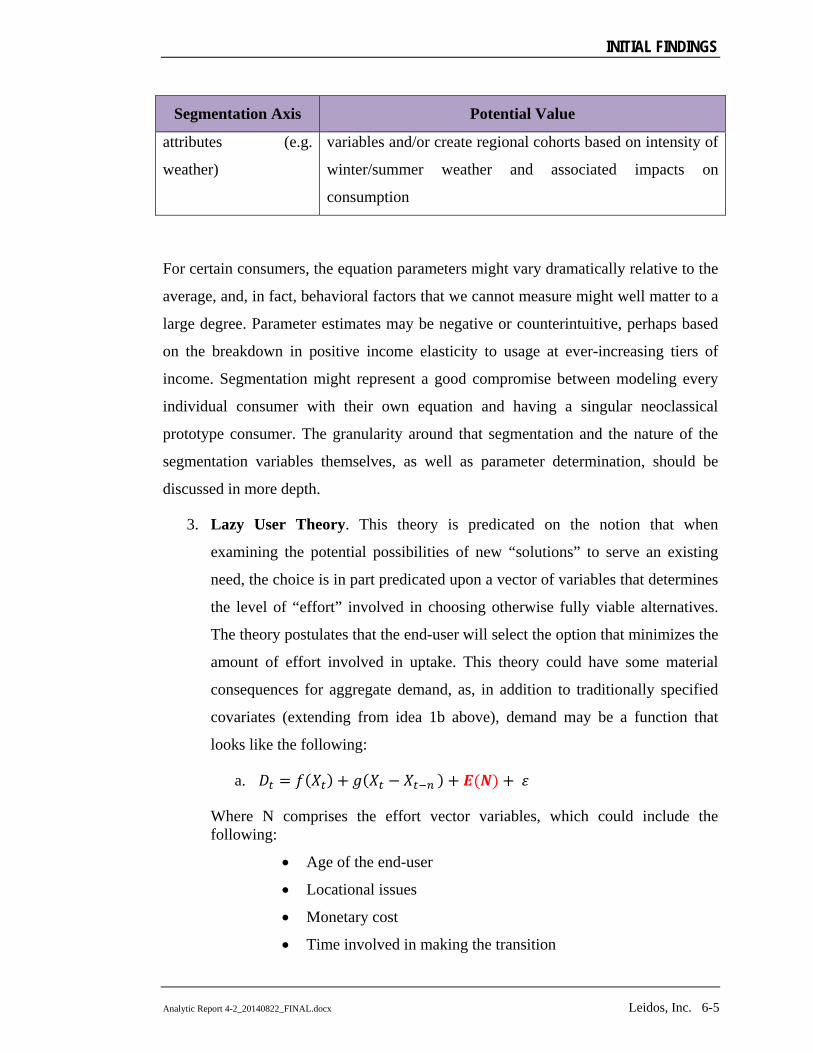
INITIAL FINDINGS
Analytic Report 4-2_20140822_FINAL.docx Leidos, Inc. 6-5
Segmentation Axis Potential Value
attributes (e.g.
weather)
variables and/or create regional cohorts based on intensity of
winter/summer weather and associated impacts on
consumption
For certain consumers, the equation parameters might vary dramatically relative to the
average, and, in fact, behavioral factors that we cannot measure might well matter to a
large degree. Parameter estimates may be negative or counterintuitive, perhaps based
on the breakdown in positive income elasticity to usage at ever-increasing tiers of
income. Segmentation might represent a good compromise between modeling every
individual consumer with their own equation and having a singular neoclassical
prototype consumer. The granularity around that segmentation and the nature of the
segmentation variables themselves, as well as parameter determination, should be
discussed in more depth.
3. Lazy User Theory. This theory is predicated on the notion that when
examining the potential possibilities of new “solutions” to serve an existing
need, the choice is in part predicated upon a vector of variables that determines
the level of “effort” involved in choosing otherwise fully viable alternatives.
The theory postulates that the end-user will select the option that minimizes the
amount of effort involved in uptake. This theory could have some material
consequences for aggregate demand, as, in addition to traditionally specified
covariates (extending from idea 1b above), demand may be a function that
looks like the following:
a.
Where N comprises the effort vector variables, which could include the following:
Age of the end-user
Locational issues
Monetary cost
Time involved in making the transition

Section 6
6-6 Leidos, Inc. Analytic Report 4-2_20140822_FINAL.docx
Mental effort involved in making the transition (or educational attainment as a potential proxy)
While some of these variables may not be directly measureable, others could
be used to enhance either the segmentation of certain cohorts when examining
demand for various “new technologies” in the RDM, or perhaps as key driving
variables previously unconsidered. For example, the demand for electric
vehicles could directly be tied to data on regional/locational age of the
population. The same could be true for new appliances that, while significantly
more efficient, carry learning curve issues related to the “smart” elements of
their product design.
4. Generalized Bass Diffusion. Based on the Leidos team review of the NEMS
model as detailed in Section 3, the Generalized Bass Model is not currently
used in any of the demand models of NEMS. This framework could be adapted
for use in forecasting consumer response to not only new technology, but also
response to policy initiatives intended to modify consumer behavior.
One translation that has been deployed in recent load forecasting work by
Leidos to capture distributed solar penetration is the Discrete Bass Model,
which can be expressed in time series format using the following equation:
a. 1 1
Given an initial or recent period data set on uptake, a traditional linear
regression of uptake as a function of the cumulative sales up to the prior time
period and the square of cumulative sales up to the prior time period can be
estimated. While there are translations required to get from the estimated
parameters to the projected diffusion, there may be a way to leverage this
framework (or extension of the model) to project uptake of new technology
that may fall into the “other category”, given reliable initial period or multi-
period data.
Refer to the Suggested Next Research Steps below for a summary of a suggested Math Workspace path to be pursued by the EIA team and supported by Leidos.

INITIAL FINDINGS
Analytic Report 4-2_20140822_FINAL.docx Leidos, Inc. 6-7
Additionally, another set of unique ideas was uncovered as a function of the March 2014 Follow-on Technical Workshop hosted by EIA and attended by Leidos. These ideas are also summarized below in bulleted format.
6.3 Tractability of Behavioral Economics within existing EIA framework – Summary of March 2014 Technical Workshop
Below is a bullet-list summary of the conceptual ideas regarding NEMS energy demand experimentation that were originated during a technical workshop held at the EIA in March 2014. Certain ideas flowed from the conversation as the workshop progressed, while other ideas extended from the initial technical workshop conducted in 2013. The concepts, in tandem with the Math Workspace ideas discussed in the prior section, form the basis for the universe of potential next steps to be undertaken to explore this topic further.
Segmentation of appliances based on a more granular approach to features
within RDM and CDM may help to capture some of the hedonic influences
associated with consumer choice, much like what is captured in the
transportation module (e.g., horsepower). Examples of hedonic appliance
features include changeable color panels and stainless steel finish for
refrigerators, quiet mode and delayed start functionality for dishwashers, and
advanced temperature and cycle settings for clothes washers. As the
segmentation becomes more granular (or perhaps even regional), hedonic
issues become a more significant driver of choices.
More detailed modeling of the “minor” end uses (e.g., TVs), as opposed to the
current trending or other simplified forecasting approaches, was mentioned as
a potential NEMS improvement. Are there behavioral factors at play, for
example, with regard to the increasing numbers, and average screen size, of
TVs (or is that merely a function of the declining marginal cost of producing
larger TVs due to the advent of new technology, and if so, can the existing
model capture cost in some more rigorous fashion)? Is there a more rigorous
forecasting framework that might better capture trends regarding TVs, rather
than some simple trending functions? More broadly, more detailed modeling of
some of the “minor” end-uses, which may take up a larger and larger share of

Section 6
6-8 Leidos, Inc. Analytic Report 4-2_20140822_FINAL.docx
overall consumption, regardless of whether or not that modeling is focused on
behavioral issues, may be in order.
There was a concept mentioned related to avoiding “technology lock-in” in the
commercial sector, wherein certain commercial customers would turn around
end-use appliances before the end of their useful life. Perhaps we could
explore CBECS data to determine “deviations” from the general rules
regarding turnover and create a new “rapid turnaround” rule/grouping.
The commercial model has 7 types of hurdle rates, which resembles a weighted
average decision associated with making a change for a particular end-use.
There may be room to experiment with these existing hurdle rates to capture
more granularity – this is an idea that was also mentioned in the 2013
workshop.
Price lags may need to be further explored and expanded within the CDM
framework (or perhaps a variable that measures deviations in price over n
periods to capture that variable becoming a non-zero choice parameter in the
agent’s “sparse” decision-making approach).
The notion from the 2013 workshop related to the fact that NEMS may not
need to engage in larger or more granular segmentation was raised, as the
segmentation that is already done via hurdle rates “gets you a long way there”.
The idea that people still seek “max for min” is there, but it may be sloppy, and
there may not be a better decision framework for forecasting purposes.
Ecological modeling, such as that used for traffic forecasting, was brought up,
but was noted as a potentially impractical alternative. If deviations from
preference order, on the average, are small and not systemic, then they may not
matter.
The topic of segmentation of various populations was re-raised. Based on the
totality of feedback on segmentation, the following concepts or areas of focus
for segmentation were raised:

INITIAL FINDINGS
Analytic Report 4-2_20140822_FINAL.docx Leidos, Inc. 6-9
o If hurdle rates represent different segments and those segments make
different decisions, then should the segments themselves be static?
How would changes in sub-segments be “forecasted”?
o Limitations were mentioned relative to the end-use consumption survey
in terms of further segmentation. However, the RECS data does
provide single-family, multi-family, and mobile home housing types.
o A nested logit model was mentioned that assigns hedonic values to
attributes of a car (e.g. horsepower) that may be in some way replicable
within the RDM and CDM.
o It was noted that Leidos may want to review RECS to provide feedback
on potential segmentation variables.
o Stratification of the modules by income tier was again mentioned, with
the challenge being the forecast of the income distribution.
o Varying technology choice by building type was mentioned.
o Other segmentation axes were mentioned as follows: urban vs. rural,
weather/climate zones, age cohorts (which may be duplicative of stage-
of-life issues), and household composition.
o Additional data sources related to segmentation:
Neilsen database
BLS time-use survey
Add/refine questions within RECS – a new model for RECS
where the output could become more customizable – if new
data is collected, how will it be forecasted?
University efforts (University of CA?) – can potentially buy
masked data for $1,000 a question – may be a cost effective
way to gather more data.
The behavioral literature is generally “case study based”. There is a need for
“aggregation and synthesis”, and interacting with the behavioral economics

Section 6
6-10 Leidos, Inc. Analytic Report 4-2_20140822_FINAL.docx
community to perform case studies on “major” end uses, such as HVAC and
lighting, may be a good short-term strategy.
With burgeoning programs to fund or help fund capital costs for energy
efficiency improvements (e.g., Property-Assessed Clean Energy), there may be
an opportunity to capture the impact of the “capital availability” being taken
out of the decision framework as an up-front expense (in lieu of a loan that is
paid back over a broader period as part of a property’s tax liability) as a sub-
segment.
There may be ways to influence the RECS data gathering process to provide
additional data that would allow for better segmentation. For example, the
RECs data does not capture SEER ratings or age of HVAC units.
Within the later brainstorming-focused sessions, the following concepts were
outlined in an open brainstorming context:
o Further disaggregation/segmentation of a regional nature or within the
commercial/industrial sectors, or perhaps based on income tiers.
o Should we focus more on modeling the consumer versus modeling a
given product? As an adder, can we in some way model the
manufacturers or gain intelligence about their intentions, as is done in
the auto/transportation modeling?
o If we were to change the product/technology slate offered, how would
that impact the results of RDM/CDM, particularly if certain items are
removed from the menu as options (e.g. CFLs)? Furthermore, could
we experiment with changing the product menu and the hurdle rates at
the exact same time?
o An elasticity study could be done by feeding a whole range of energy
prices to the RDM and CDM modules without too much disruption of
the underlying process.
o What if we “turned the standards off” in the model and re-ran the
modules?

INITIAL FINDINGS
Analytic Report 4-2_20140822_FINAL.docx Leidos, Inc. 6-11
o Modeling of behavior in the “minor” end uses was mentioned again, in
the context of modeling regional skew or stage-of-life characteristics as
it pertains to choices for the smaller end uses.
o The idea of extending the complexity of the home size model was
offered up, as preferences for home size may be a function of certain
factors that may not be currently captured. This could be projected
based on the other macroeconomic data that is available but not
currently utilized, which in part could indirectly capture behavioral
trends. There are a lot of variables within the macroeconomic module
that are not currently used within NEMS – there may be opportunities
to get more information from the macroeconomic module (e.g.
population model?)
o Using lag structures and finding a way to better represent amortized
capital cost were also brought up as possible avenues for further
experimentation.
o EIA staff offered up the option of simulating retrofitting behavior by
cutting down appliance lifetimes and examining how the model
behaves – this would be a much easier way to experiment than to add
segmentation to the model.
6.4 Suggested Next Research Steps Based on the totality of research, workshops, and internal brainstorming sessions conducted in support of this report, as well as via interaction with the EIA team involved in initiating this investigation, the following is a top-level summary of suggested next research steps that should be undertaken in parallel paths to continue to advance this topic.
1. Continue to engage technical workshop invitees and participants on a recurring basis. The invitees and technical individuals who participated in one or both of the workshops should be re-engaged on a recurring basis. It is very likely that the core research issues being pursued by this group of practitioners and academics is going to evolve over time. New ideas and developments, as well as the longer term “sandbox” experimentation by the EIA should be re-surfaced within the group, and that may spark additional ideas or areas of

Section 6
6-12 Leidos, Inc. Analytic Report 4-2_20140822_FINAL.docx
investigation. The working group can be thought of as a virtual research evaluation panel. While the extent of participation in a longer-term effort is likely to be uncertain, the ease of communication through an email list will hopefully offset attrition.
2. Work to develop and extend/enhance Math Workspace. The Math Workspace currently contains several open-brainstorm ideas from Leidos as a function of the literature we have reviewed. This workspace should be enhanced to capture other EIA ideas and can serve as the starting point for determining exactly how to deploy these potential alternative specifications within the confines of RDM or CDM. It can also serve as a platform to eliminate ideas due to lack of data/measurability concerns, cost prohibitive deployment issues, or a theoretical basis for exclusion. Note that Section 6 also contains a tabularized summary of variables commonly encountered in the literature, and that this list and the mathematical ideas are not mutually inclusive.
3. Leverage ideas from the March 2014 workshop to further filter ideas for
actual experimentation. EIA staff time and resources are limited. Furthermore, EIA has certain on-going critical reporting and analysis responsibilities. Consequently, not all of the ideas surfaced for further experimentation are feasible to pursue. Some further effort is needed to generate a punch list of the most immediately tractable ideas, leaving others as possibilities only.
4. Conduct follow-on analytical research on data sources/options for variables that fall into the “gray area” in terms of measurability. It may be valuable to further investigate survey data, alternative data banks, or other experimental structures that could reveal tractable data for variables that appear compelling but for which no data currently exists.
5. Execute the 2-3 most promising experiments from #3 with readily available data. This amount of experimentation would follow logically from item #3 above, in that a carefully bounded number of experiments could be conducted, most likely in parallel.
6. Generate exhibits to characterize tangible forecast differences resulting from experiments from #5 and share with workshop invitees. The entire realm of experimentation with behavioral concepts is predicated upon the notion that deviations from a classical utility maximization paradigm (which we have established is neither a boundary nor an appropriate definition of NEMS as it is currently designed), if captured and parameterized appropriately, can be used to generate tangible differences in the forecasts that the EIA produces. The experimentation performed in the next phase should attempt to falsify as many of the commonly held perceptions regarding behavioral factors as possible. To the extent variables can be translated to data

INITIAL FINDINGS
Analytic Report 4-2_20140822_FINAL.docx Leidos, Inc. 6-13
and represent some statement regarding behavioral factors, then an experiment should be able to be designed that can falsify the postulate or theory being purported. Said differently, scientific statements must be falsifiable. To the extent EIA can set up these various “sandbox” experiments and quantify tangible differences (if any), this can serve to better define the realm of ideas emanating from behavioral economics that meet this criterion and can help eliminate generalizations regarding potential deviations that are untestable or intractable due to lack of data/measurability challenges.


Analytic Report 4-2_20140822_FINAL.docx
Section 7 BEHAVIORAL ECONOMICS BIBLIOGRAPHY
7.1 Bibliography Sources The following table represents the sum total of the literature pursued as part of this analytic report. The vintage, author(s), title/description, and a link to the source paper (whenever available) are provided.
The literature reviewed can be categorized as being sourced from the following four core areas:
1. Literature collected by Leidos in advance of the initial technical workshop, which was either independently sourced or based on the prior work of the technical workshop invitees.
2. Literature provided directly by the EIA for consideration by Leidos.
3. Literature extracted by Leidos during a more extensive follow-up search after the first workshop.
4. Literature provided as follow-up by the expert panel that participated in the initial workshop, as well as additional literature provided by invitees subsequent to the re-submittal of the full draft bibliography in March 2014.
The bibliography was forwarded in complete form to the original broad list of workshop invitees in March 2014. The purpose of the re-submittal of the extent of all material gathered was to (i) understand whether there were any critical or seminal piece(s) of literature germane to the issue that were not captured and (ii) to solicit further focused feedback on possible alternative aggregate demand specifications that either spring-boarded from a particular piece, or were concepts being considered by the expert working group.
While feedback was somewhat limited, the feedback that was received indicated that this represented a comprehensive bibliography. While it is not fully possible to be “exhaustive” in generating this bibliography as a function of the tangential relevance of certain pieces of literature to the core topic, the table below represents a dossier that is assumed to capture the preponderance of critical work done on behavioral economics, particularly relevant to energy consumption. As noted in Section 6, Leidos’ proposed Math Workspace approach to developing further ideas, as well as the suggestion to continually reengage this working group for more insights is intended to further advance the baseline content in the table below.
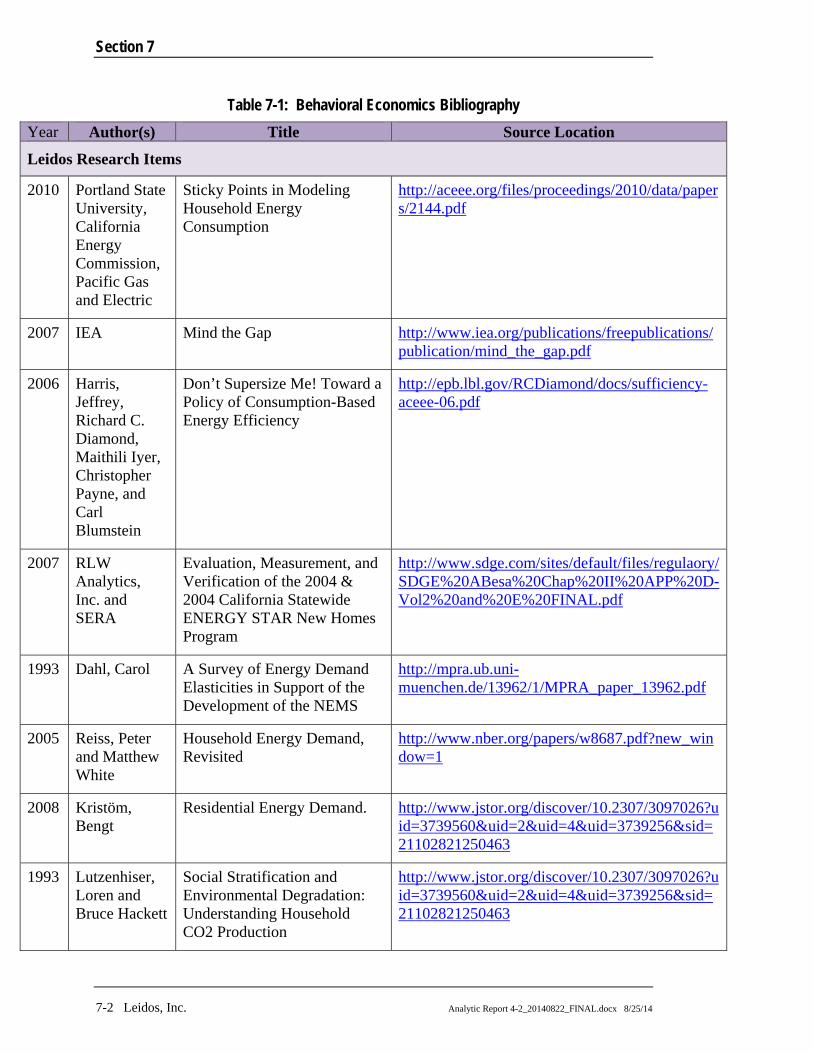
Section 7
7-2 Leidos, Inc. Analytic Report 4-2_20140822_FINAL.docx 8/25/14
Table 7-1: Behavioral Economics Bibliography
Year Author(s) Title Source Location
Leidos Research Items
2010 Portland State University, California Energy Commission, Pacific Gas and Electric
Sticky Points in Modeling Household Energy Consumption
http://aceee.org/files/proceedings/2010/data/papers/2144.pdf
2007 IEA Mind the Gap http://www.iea.org/publications/freepublications/publication/mind_the_gap.pdf
2006 Harris, Jeffrey, Richard C. Diamond, Maithili Iyer, Christopher Payne, and Carl Blumstein
Don’t Supersize Me! Toward a Policy of Consumption-Based Energy Efficiency
http://epb.lbl.gov/RCDiamond/docs/sufficiency-aceee-06.pdf
2007 RLW Analytics, Inc. and SERA
Evaluation, Measurement, and Verification of the 2004 & 2004 California Statewide ENERGY STAR New Homes Program
http://www.sdge.com/sites/default/files/regulaory/SDGE%20ABesa%20Chap%20II%20APP%20D-Vol2%20and%20E%20FINAL.pdf
1993 Dahl, Carol A Survey of Energy Demand Elasticities in Support of the Development of the NEMS
http://mpra.ub.uni-muenchen.de/13962/1/MPRA_paper_13962.pdf
2005 Reiss, Peter and Matthew White
Household Energy Demand, Revisited
http://www.nber.org/papers/w8687.pdf?new_window=1
2008 Kristöm, Bengt
Residential Energy Demand. http://www.jstor.org/discover/10.2307/3097026?uid=3739560&uid=2&uid=4&uid=3739256&sid=21102821250463
1993 Lutzenhiser, Loren and Bruce Hackett
Social Stratification and Environmental Degradation: Understanding Household CO2 Production
http://www.jstor.org/discover/10.2307/3097026?uid=3739560&uid=2&uid=4&uid=3739256&sid=21102821250463

BEHAVIORAL ECONOMICS BIBLIOGRAPHY
File: 000000/99-99999-99999-9999 Leidos, Inc. 7-3
Year Author(s) Title Source Location 2008 Gowdy, John
M. Behavioral Economics and Climate Change Policy
http://evolution.binghamton.edu/evos/wp-content/uploads/2010/01/Gowdy-et-al-2008_economics-and-climate-change.pdf
2008 Thaler, Richard and Cass Sunstein
Nudge (Book for purchase) http://www.amazon.com/Nudge-Improving-Decisions-Health-Happiness/dp/014311526X
2009 Gillingham, Kenneth, Richard G. Newell, and Karen Palmer
Energy Efficiency Economics and Policy
http://www.rff.org/documents/rff-dp-09-13.pdf
2007 Martiskainen, Mari
Affecting Consumer Behavior on Energy Demand
https://www.sussex.ac.uk/webteam/gateway/file.php?name=seg-consumer-behaviour-final-report.pdf&site=264
2000 Stern, Paul. C Toward a Coherent Theory of Environmentally Significant Behavior
http://www.worldresourcesforum.org/files/file/Stern%20-%20Toward%20a%20Coherent%20Theory%20of%20Environmentally%20Significant%20Behavior.pdf
1985 J. Stanley Black, Paul C. Stern, Julie Elworth
Personal and Contextual Influences on Household Energy Adaptations
http://psycnet.apa.org/index.cfm?fa=buy.optionToBuy&id=1985-16122-001
2007 Schultz, P. Wesley, Jessica Nolan, Robert B. Cialdini, Noah J. Goldstein, and Vladas Griskevicius
The Constructive, Destructive, and Reconstructive Power of Social Norms
http://piee.stanford.edu/cgi-bin/docs/behavior/becc/2008/presentations/17-1C-01-The_Constructive_Destructive_and_Reconstructive_Power_of_Social_Norms.pdf
1993 Lutzenhiser, Loren
Social and Behavioral Aspects of Energy Use
http://www.annualreviews.org/doi/abs/10.1146/annurev.eg.18.110193.001335?journalCode=energy.2
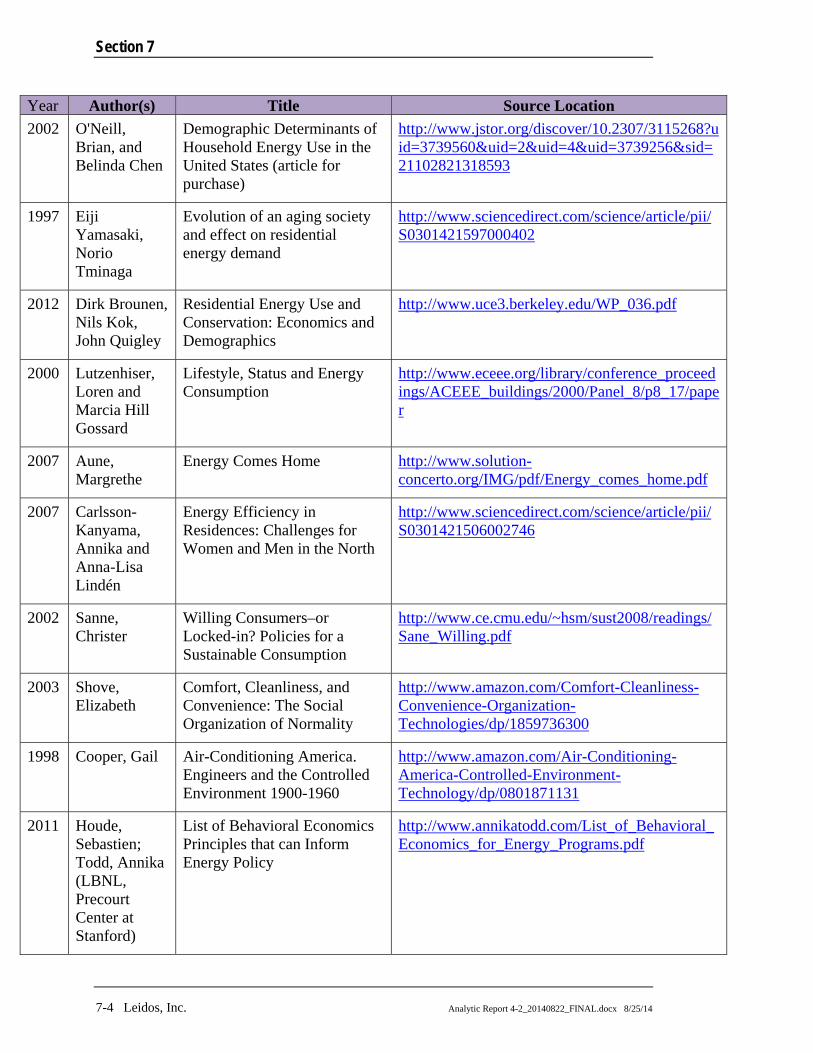
Section 7
7-4 Leidos, Inc. Analytic Report 4-2_20140822_FINAL.docx 8/25/14
Year Author(s) Title Source Location 2002 O'Neill,
Brian, and Belinda Chen
Demographic Determinants of Household Energy Use in the United States (article for purchase)
http://www.jstor.org/discover/10.2307/3115268?uid=3739560&uid=2&uid=4&uid=3739256&sid=21102821318593
1997 Eiji Yamasaki, Norio Tminaga
Evolution of an aging society and effect on residential energy demand
http://www.sciencedirect.com/science/article/pii/S0301421597000402
2012 Dirk Brounen, Nils Kok, John Quigley
Residential Energy Use and Conservation: Economics and Demographics
http://www.uce3.berkeley.edu/WP_036.pdf
2000 Lutzenhiser, Loren and Marcia Hill Gossard
Lifestyle, Status and Energy Consumption
http://www.eceee.org/library/conference_proceedings/ACEEE_buildings/2000/Panel_8/p8_17/paper
2007 Aune, Margrethe
Energy Comes Home http://www.solution-concerto.org/IMG/pdf/Energy_comes_home.pdf
2007 Carlsson-Kanyama, Annika and Anna-Lisa Lindén
Energy Efficiency in Residences: Challenges for Women and Men in the North
http://www.sciencedirect.com/science/article/pii/S0301421506002746
2002 Sanne, Christer
Willing Consumers–or Locked-in? Policies for a Sustainable Consumption
http://www.ce.cmu.edu/~hsm/sust2008/readings/Sane_Willing.pdf
2003 Shove, Elizabeth
Comfort, Cleanliness, and Convenience: The Social Organization of Normality
http://www.amazon.com/Comfort-Cleanliness-Convenience-Organization-Technologies/dp/1859736300
1998 Cooper, Gail Air-Conditioning America. Engineers and the Controlled Environment 1900-1960
http://www.amazon.com/Air-Conditioning-America-Controlled-Environment-Technology/dp/0801871131
2011 Houde, Sebastien; Todd, Annika (LBNL, Precourt Center at Stanford)
List of Behavioral Economics Principles that can Inform Energy Policy
http://www.annikatodd.com/List_of_Behavioral_Economics_for_Energy_Programs.pdf

BEHAVIORAL ECONOMICS BIBLIOGRAPHY
File: 000000/99-99999-99999-9999 Leidos, Inc. 7-5
Year Author(s) Title Source Location 2007 Jeff Rubin
and Benjamin Tal
Does Energy Efficiency Save Energy?
http://research.cibcwm.com/economic_public/download/snov07.pdf
2009 Loren Lutzenhiser, Laura Cesafsky, Heather Chappells, and many more
Behavioral Assumptions Underlying California Residential Sector Energy Efficiency Programs
http://www1.eere.energy.gov/buildings/betterbuildings/neighborhoods/pdfs/ba_ee_res_wp.pdf
2011 Harry D. Saunders
Historical Evidence for Energy Consumption Rebound in 30 US Sectors and a Toolkit for Rebound Analysts
http://thebreakthrough.org/blog/Historical%20Evidence%20Article%2011-11-10.pdf
1986 Paul Stern Blind Spots in Policy Analysis: What Economics Doesn’t Say about Energy Use
http://ideas.repec.org/a/wly/jpamgt/v5y1986i2p200-227.html#abstract
2009 Hunt Allcott Behavioral Economics and Energy Policy
http://www.stanford.edu/group/peec/cgi-bin/docs/events/2009/becc/presentations/5F%20Alcott.pdf
2012 Joe Bull Loads of green washing—can behavioral economics increase willingness-to-pay for efficient washing machines in the UK?
http://www.sciencedirect.com/science/article/pii/S0301421512005769
2011 Opinion Dynamics
Massachusetts Cross-Cutting Behavioral Program Evaluation
http://www.ma-eeac.org/Docs/8.1_EMV%20Page/2011/2011%20Residential%20Studies/MACC%20Behavioral%20Report%20Volume%202%20Final.pdf
2012 Wu, May Sacramento Municipal Utility District - Impact and Persistence Evaluation Report
http://www1.integralanalytics.com/files/documents/related-documents/FinalSMUDHERSEval2012v4.pdf
Experts Meeting Participants Research Items
2010 Todd, Annika Behavioral economics is the New Green (presentation)
http://www.annikatodd.com/Annika_Todd_Behavioral_Economics_is_the_New_Green.pdf
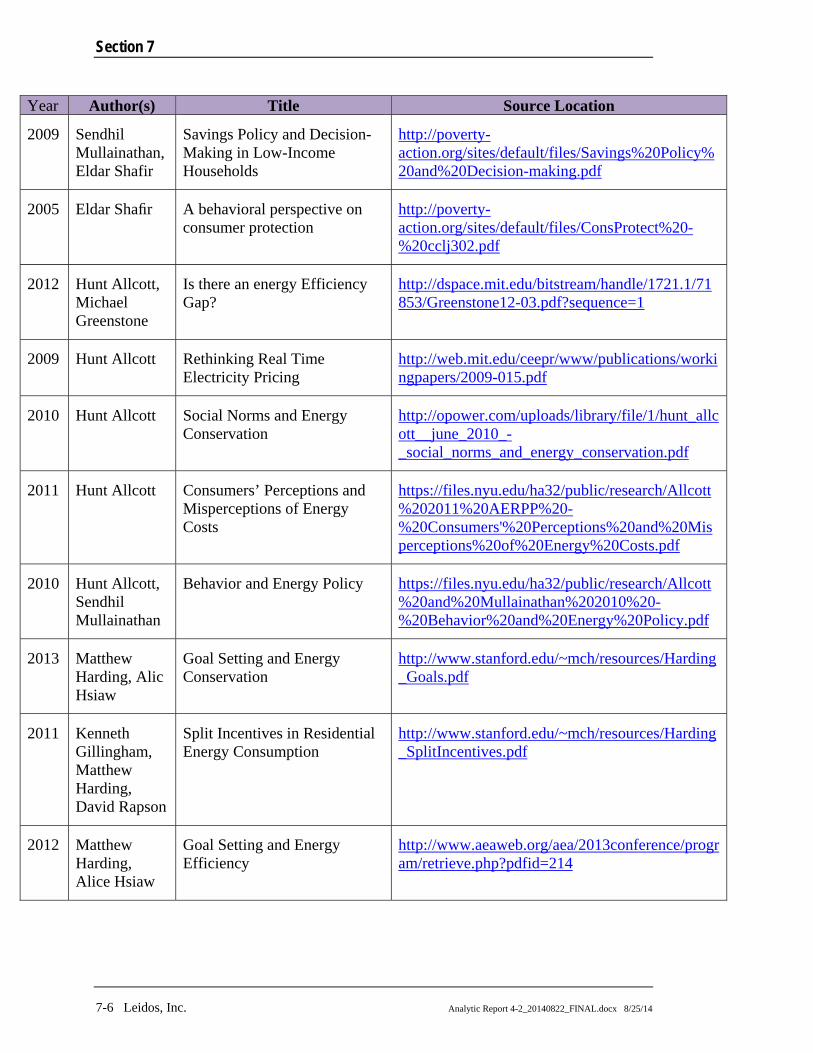
Section 7
7-6 Leidos, Inc. Analytic Report 4-2_20140822_FINAL.docx 8/25/14
Year Author(s) Title Source Location
2009 Sendhil Mullainathan, Eldar Shafir
Savings Policy and Decision-Making in Low-Income Households
http://poverty-action.org/sites/default/files/Savings%20Policy%20and%20Decision-making.pdf
2005 Eldar Shafir A behavioral perspective on consumer protection
http://poverty-action.org/sites/default/files/ConsProtect%20-%20cclj302.pdf
2012 Hunt Allcott, Michael Greenstone
Is there an energy Efficiency Gap?
http://dspace.mit.edu/bitstream/handle/1721.1/71853/Greenstone12-03.pdf?sequence=1
2009 Hunt Allcott Rethinking Real Time Electricity Pricing
http://web.mit.edu/ceepr/www/publications/workingpapers/2009-015.pdf
2010 Hunt Allcott Social Norms and Energy Conservation
http://opower.com/uploads/library/file/1/hunt_allcott__june_2010_-_social_norms_and_energy_conservation.pdf
2011 Hunt Allcott Consumers’ Perceptions and Misperceptions of Energy Costs
https://files.nyu.edu/ha32/public/research/Allcott%202011%20AERPP%20-%20Consumers'%20Perceptions%20and%20Misperceptions%20of%20Energy%20Costs.pdf
2010 Hunt Allcott, Sendhil Mullainathan
Behavior and Energy Policy https://files.nyu.edu/ha32/public/research/Allcott%20and%20Mullainathan%202010%20-%20Behavior%20and%20Energy%20Policy.pdf
2013 Matthew Harding, Alic Hsiaw
Goal Setting and Energy Conservation
http://www.stanford.edu/~mch/resources/Harding_Goals.pdf
2011 Kenneth Gillingham, Matthew Harding, David Rapson
Split Incentives in Residential Energy Consumption
http://www.stanford.edu/~mch/resources/Harding_SplitIncentives.pdf
2012 Matthew Harding, Alice Hsiaw
Goal Setting and Energy Efficiency
http://www.aeaweb.org/aea/2013conference/program/retrieve.php?pdfid=214

BEHAVIORAL ECONOMICS BIBLIOGRAPHY
File: 000000/99-99999-99999-9999 Leidos, Inc. 7-7
Year Author(s) Title Source Location
2011 Emir Kamenica, Sendhil Mullainathan, Richard Thaler
Behavioral Economics and Consumer Regulation
http://faculty.chicagobooth.edu/richard.thaler/research/pdf/Helping%20Consumers%20Know%20Themselves.pdf
2013 James Sallee Rational inattention and Energy Efficiency
(for purchase) http://www.nber.org/papers/w19545
2010 Lucas Davis Evaluating the Slow Adoption of Energy Efficient Investments: Are Renters Less Likely to have Energy Efficient Appliances
http://www.nber.org/papers/w16114.pdf?new_window=1
2008 Maximilian Auffhammer, Carl Blumstein, Meredith Fowlie
Demand-Side Management and Energy Efficiency Revisited
http://nature.berkeley.edu/~fowlie/demandsidemanagementrevisited.pdf
2012 Meredith Fowlie, Catherine Wolfram, Michael Greenstone
(presentation) Reconcilable differences? Examining the gap between engineering projections and ex post realized gains from energy efficiency investments
http://eetd.lbl.gov/sites/all/files/lbnl_2012-m_fowlie.pdf
2013 Nicolas Ryan Is There an Energy-Efficiency Gap? Measuring Returns to Efficiency with a Field Experiment in India (study results upcoming)
http://www.hks.harvard.edu/centers/mrcbg/programs/sustsci/activities/program-initiatives/india/overview/is-there-an-energy-efficiency-gap-measuring-returns-to-efficiency-with-a-field-experiment-in-india
EIA Research Items
2009 Matteo Iacoviello, Marina Pavan
Housing and Debt Over the Life Cycle and Over the Business Cycle
http://www.federalreserve.gov/pubs/ifdp/2011/1032/ifdp1032.pdf
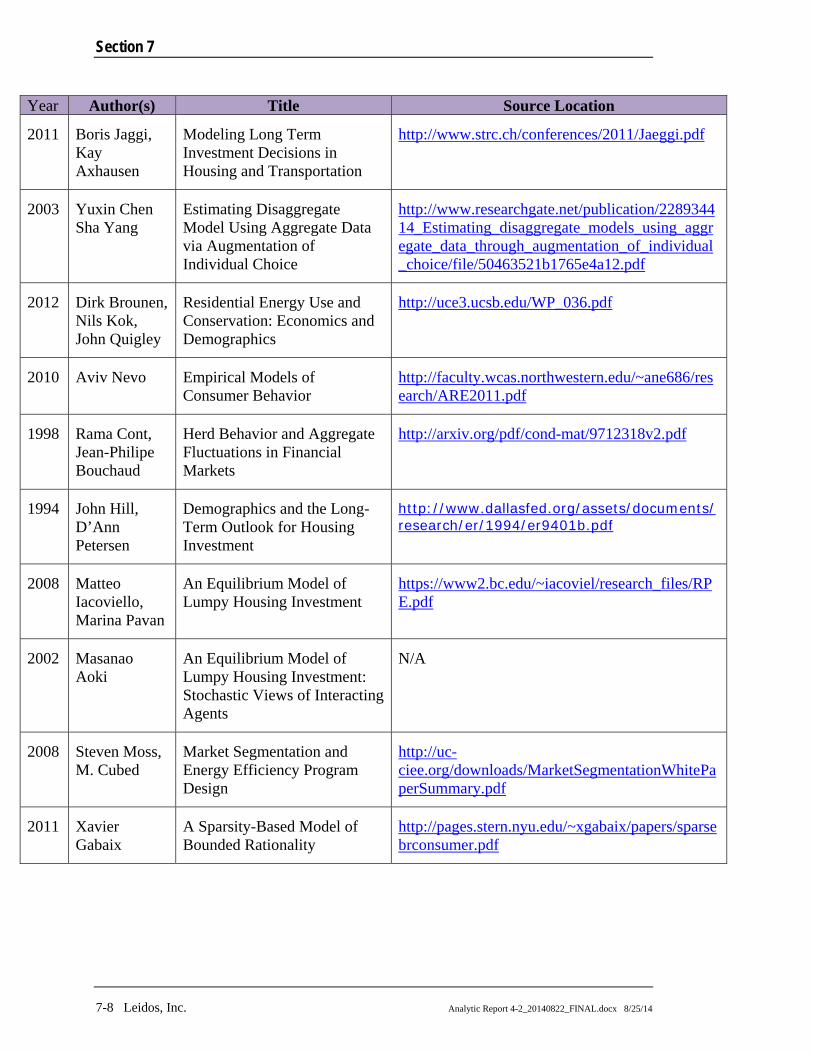
Section 7
7-8 Leidos, Inc. Analytic Report 4-2_20140822_FINAL.docx 8/25/14
Year Author(s) Title Source Location
2011 Boris Jaggi, Kay Axhausen
Modeling Long Term Investment Decisions in Housing and Transportation
http://www.strc.ch/conferences/2011/Jaeggi.pdf
2003 Yuxin Chen Sha Yang
Estimating Disaggregate Model Using Aggregate Data via Augmentation of Individual Choice
http://www.researchgate.net/publication/228934414_Estimating_disaggregate_models_using_aggregate_data_through_augmentation_of_individual_choice/file/50463521b1765e4a12.pdf
2012 Dirk Brounen, Nils Kok, John Quigley
Residential Energy Use and Conservation: Economics and Demographics
http://uce3.ucsb.edu/WP_036.pdf
2010 Aviv Nevo Empirical Models of Consumer Behavior
http://faculty.wcas.northwestern.edu/~ane686/research/ARE2011.pdf
1998 Rama Cont, Jean-Philipe Bouchaud
Herd Behavior and Aggregate Fluctuations in Financial Markets
http://arxiv.org/pdf/cond-mat/9712318v2.pdf
1994 John Hill, D’Ann Petersen
Demographics and the Long-Term Outlook for Housing Investment
http://www.dallasfed.org/assets/documents/research/er/1994/er9401b.pdf
2008 Matteo Iacoviello, Marina Pavan
An Equilibrium Model of Lumpy Housing Investment
https://www2.bc.edu/~iacoviel/research_files/RPE.pdf
2002 Masanao Aoki
An Equilibrium Model of Lumpy Housing Investment: Stochastic Views of Interacting Agents
N/A
2008 Steven Moss, M. Cubed
Market Segmentation and Energy Efficiency Program Design
http://uc-ciee.org/downloads/MarketSegmentationWhitePaperSummary.pdf
2011 Xavier Gabaix
A Sparsity-Based Model of Bounded Rationality
http://pages.stern.nyu.edu/~xgabaix/papers/sparsebrconsumer.pdf
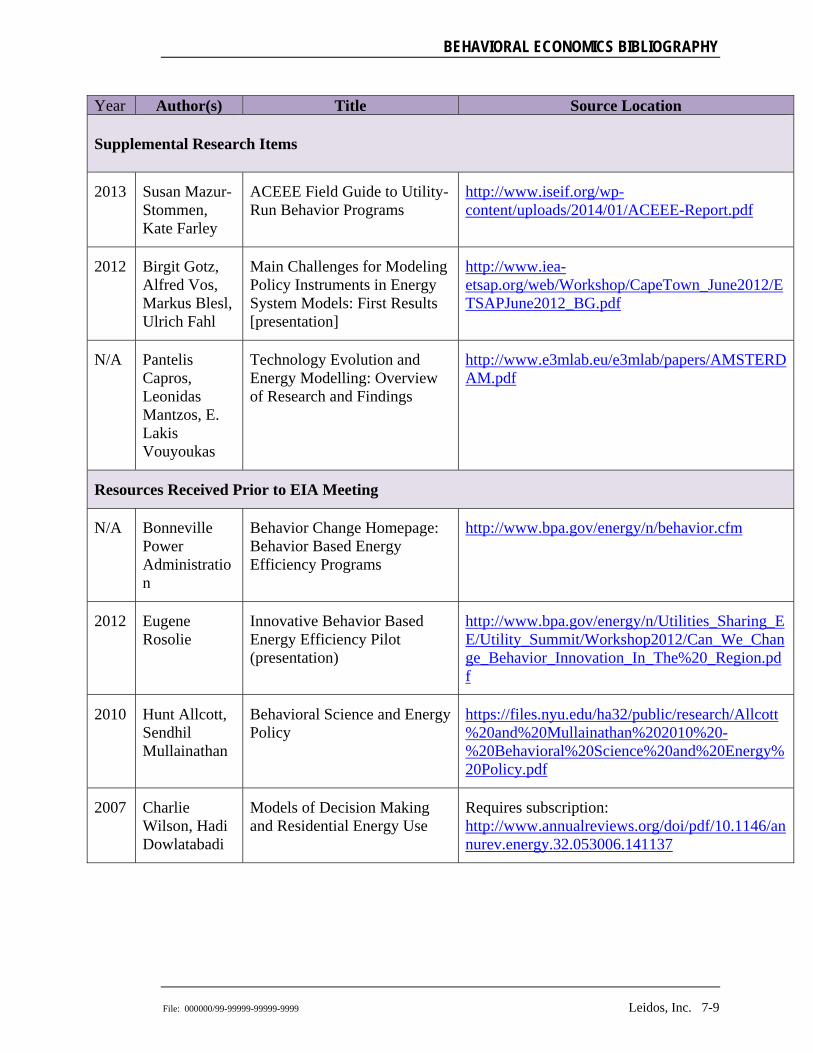
BEHAVIORAL ECONOMICS BIBLIOGRAPHY
File: 000000/99-99999-99999-9999 Leidos, Inc. 7-9
Year Author(s) Title Source Location
Supplemental Research Items
2013 Susan Mazur-Stommen, Kate Farley
ACEEE Field Guide to Utility-Run Behavior Programs
http://www.iseif.org/wp-content/uploads/2014/01/ACEEE-Report.pdf
2012 Birgit Gotz, Alfred Vos, Markus Blesl, Ulrich Fahl
Main Challenges for Modeling Policy Instruments in Energy System Models: First Results [presentation]
http://www.iea-etsap.org/web/Workshop/CapeTown_June2012/ETSAPJune2012_BG.pdf
N/A Pantelis Capros, Leonidas Mantzos, E. Lakis Vouyoukas
Technology Evolution and Energy Modelling: Overview of Research and Findings
http://www.e3mlab.eu/e3mlab/papers/AMSTERDAM.pdf
Resources Received Prior to EIA Meeting
N/A Bonneville Power Administration
Behavior Change Homepage: Behavior Based Energy Efficiency Programs
http://www.bpa.gov/energy/n/behavior.cfm
2012 Eugene Rosolie
Innovative Behavior Based Energy Efficiency Pilot (presentation)
http://www.bpa.gov/energy/n/Utilities_Sharing_EE/Utility_Summit/Workshop2012/Can_We_Change_Behavior_Innovation_In_The%20_Region.pdf
2010 Hunt Allcott, Sendhil Mullainathan
Behavioral Science and Energy Policy
https://files.nyu.edu/ha32/public/research/Allcott%20and%20Mullainathan%202010%20-%20Behavioral%20Science%20and%20Energy%20Policy.pdf
2007 Charlie Wilson, Hadi Dowlatabadi
Models of Decision Making and Residential Energy Use
Requires subscription: http://www.annualreviews.org/doi/pdf/10.1146/annurev.energy.32.053006.141137

Section 7
7-10 Leidos, Inc. Analytic Report 4-2_20140822_FINAL.docx 8/25/14
Year Author(s) Title Source Location
2003 Colin Camerer, George Loewenstein, Matthew Rabin
Advances in Behavioral Economics
Book: http://press.princeton.edu/titles/7607.html
2009 Jon Froehlich Promoting Energy Efficient Behaviors in the Home through Feedback: The Role of Human-Computer Interaction
ftp://trout.cs.washington.edu/tr/2009/02/UW-CSE-09-02-01.PDF
2006 Keith Dennis The Compatibility of Economic Theory and Proactive Energy Efficiency Policy
Requires purchase: http://www.sciencedirect.com/science/article/pii/S1040619006000893
2006 Chris Bataille, Mark Jaccard, John Nyboer and Nic Rivers
Towards General Equilibrium in a Technology-Rich Model with Empirically Estimated Behavioral Parameters
http://www.emrg.sfu.ca/media/publications/2006/EJ%20Hybrid%20Special%20Issue%20Paper%20Bataille%20et%20al%20FINAL.pdf
1982 Robin Winkler, Richard Winett
Behavioral interventions in resource conservation: A systems approach based on behavioral economics
Requires purchase: http://psycnet.apa.org/journals/amp/37/4/421/
2003 Diane DiClemente
Applied behavioral economics and consumer choice
Requires purchase: http://www.sciencedirect.com/science/article/pii/S0167487003000035
2007 Lorna Greening, Gale Boyd, Joseph Roop
Modeling of industrial energy consumption: An introduction and context
Requires purchase: http://www.sciencedirect.com/science/article/pii/S0140988307000448
2004 Adam Jaffe, Richard Newell, Robert Stavins
Economics of Energy Efficiency
Link is dead: http://resume.marcbrands.com/classfolder/45-859/[email protected]/courses/1/s04-45859/content/_185112_1/economics_of_energy_efficiency.pdf
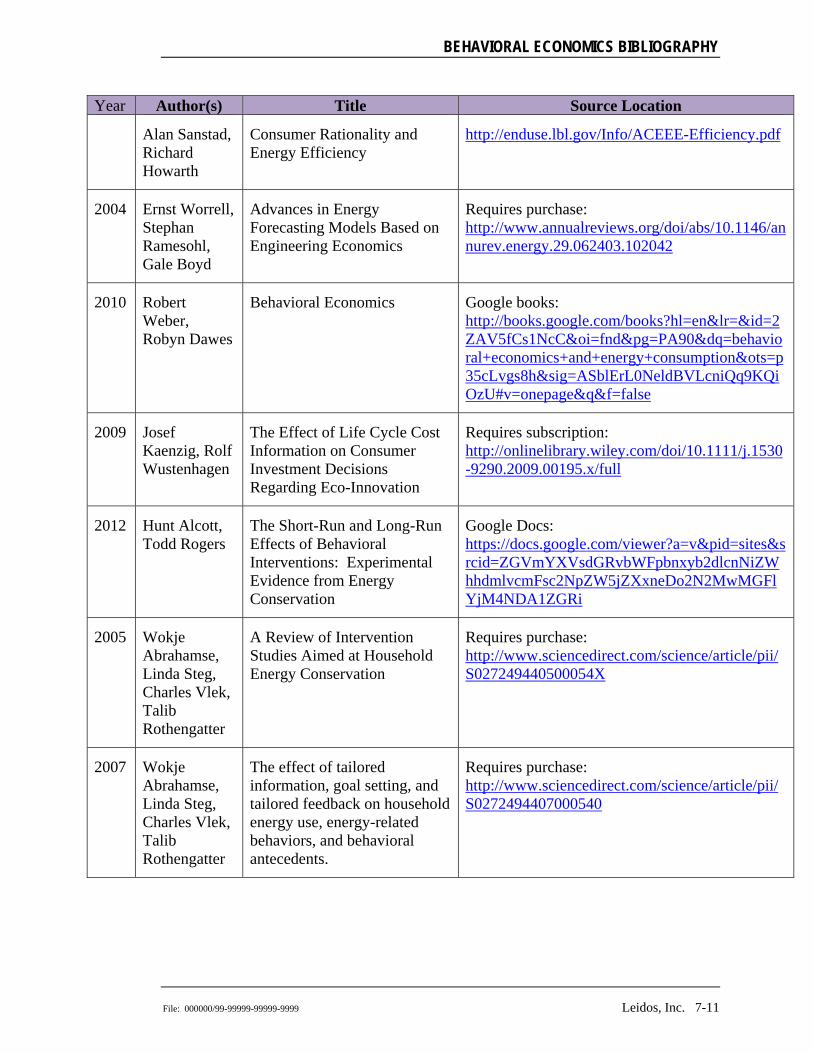
BEHAVIORAL ECONOMICS BIBLIOGRAPHY
File: 000000/99-99999-99999-9999 Leidos, Inc. 7-11
Year Author(s) Title Source Location
Alan Sanstad, Richard Howarth
Consumer Rationality and Energy Efficiency
http://enduse.lbl.gov/Info/ACEEE-Efficiency.pdf
2004 Ernst Worrell, Stephan Ramesohl, Gale Boyd
Advances in Energy Forecasting Models Based on Engineering Economics
Requires purchase: http://www.annualreviews.org/doi/abs/10.1146/annurev.energy.29.062403.102042
2010 Robert Weber, Robyn Dawes
Behavioral Economics Google books: http://books.google.com/books?hl=en&lr=&id=2ZAV5fCs1NcC&oi=fnd&pg=PA90&dq=behavioral+economics+and+energy+consumption&ots=p35cLvgs8h&sig=ASblErL0NeldBVLcniQq9KQiOzU#v=onepage&q&f=false
2009 Josef Kaenzig, Rolf Wustenhagen
The Effect of Life Cycle Cost Information on Consumer Investment Decisions Regarding Eco-Innovation
Requires subscription: http://onlinelibrary.wiley.com/doi/10.1111/j.1530-9290.2009.00195.x/full
2012 Hunt Alcott, Todd Rogers
The Short-Run and Long-Run Effects of Behavioral Interventions: Experimental Evidence from Energy Conservation
Google Docs: https://docs.google.com/viewer?a=v&pid=sites&srcid=ZGVmYXVsdGRvbWFpbnxyb2dlcnNiZWhhdmlvcmFsc2NpZW5jZXxneDo2N2MwMGFlYjM4NDA1ZGRi
2005 Wokje Abrahamse, Linda Steg, Charles Vlek, Talib Rothengatter
A Review of Intervention Studies Aimed at Household Energy Conservation
Requires purchase: http://www.sciencedirect.com/science/article/pii/S027249440500054X
2007 Wokje Abrahamse, Linda Steg, Charles Vlek, Talib Rothengatter
The effect of tailored information, goal setting, and tailored feedback on household energy use, energy-related behaviors, and behavioral antecedents.
Requires purchase: http://www.sciencedirect.com/science/article/pii/S0272494407000540

Section 7
7-12 Leidos, Inc. Analytic Report 4-2_20140822_FINAL.docx 8/25/14
Year Author(s) Title Source Location
2011 Toshi Arimura, Shanjun Li, Richard Newell, Karen Palmer
Cost-Effectiveness of Electricity Energy Efficiency Programs
http://www.nber.org/papers/w17556
1994 Adam Jaffe, Robert Stavins
The Energy Paradox and the Diffusion of Conservation Technology
http://www.hks.harvard.edu/fs/rstavins/Papers/TheEnergyParadox.REE1994.pdf
2005 Adam Jaffe, Richard Newell, Robert Stavins
A Tale of Two Market Failures: Technology and Environmental Policy
Requires purchase: http://www.sciencedirect.com/science/article/pii/S0921800905000303
2008 Jason Shogren, Laura Taylor
On Behavioral-Environmental Economics
http://reep.oxfordjournals.org/content/2/1/26.abstract
2000 Richard Howarth, Brent Haddad, Bruce Paton
The economics of energy efficiency: insights from voluntary participation programs
Requires purchase: http://www.sciencedirect.com/science/article/pii/S0301421500000264
2010 Bonneville Power Administration
Residential Sector Research Findings for Behavior Based Energy Efficiency
http://www.bpa.gov/energy/n/pdf/Behavior_Change_Report_Dec_2010_July_5.pdf
2012 Scott Dimetrosky (Apex Analytics)
Are Savings from Behavioral Programs Ready for TRM Prime Time?
http://beccconference.org/wp-content/uploads/2012/11/BECC-TRM-Presentation_111112-Dimetrosky.pdf
2012 Philip Mosenthal
A New Regulatory Framework to Support Behavioral Programs
http://ilsagfiles.org/SAG_files/Meeting_Materials/2012/November%2027,%202012%20Meeting/A_New_Regulatory_Framework_to_Support_Behavioral_Programs_Optimal_Energy_Phil_Mosenthal.pdf

BEHAVIORAL ECONOMICS BIBLIOGRAPHY
File: 000000/99-99999-99999-9999 Leidos, Inc. 7-13
Year Author(s) Title Source Location
2012 Mitchell Rosenberg
Evaluating Feedback Programs: Results to Date, Challenges for the Next Wave
http://beccconference.org/wp-content/uploads/2012/11/Feedback-Reports-BECC-2012.pdf
2012 Michael Li, Anika Todd
Evaluation, Measurement, and Verification (EM&V) of Residential Behavior-Based Energy Efficiency Programs: Issues and Recommendations
http://behavioranalytics.lbl.gov/reports/behavior-based-emv-slides.pdf
2013 Edward Vine The California Behavioral Gap Analysis
http://www.aceee.org/files/pdf/conferences/mt/2013/EdVine_D1.pdf
2012 Ahmad Faruqui, Sanem Sergici, Neil Lessem
Consistency of Results in Dynamic Pricing Experiments
http://beccconference.org/wp-content/uploads/2012/12/Consistency-of-results-in-dynamic-pricing-experiments-11-21-12.pdf
2007 Charles, Wilson
Non-Economic Models of Behavior & Decision Making
Dead link: http://www.mendeley.com/research/noneconomic-models-behavior-decision-making-noneconomic-approaches/
Resources Received Subsequent to March 2014 Bibliography Distribution
2012 Hunt Allcott and Todd Rogers
The Short-Run and Long-Run Effects of Behavioral Interventions: Experimental Evidence from Energy Conservation
http://www.nber.org/papers/w18492
2013 Hunt Allcott and Dmitry Taubinski
The Lightbulb Paradox: Evidence from Two Randomized Experiments
http://www.nber.org/papers/w19713.pdf
2014 Hunt Allcott, Sendhil Mullainathan, and Dmitry Taubinski
Energy Policy with Externalities and Internalities
http://www.hks.harvard.edu/m-rcbg/heep/ee-workshop_131024-25/supp/3.c-e%20Allcott/AMT%20NBER%20WP%20-%20Energy%20Policy%20with%20Externalities%20and%20Internalities.pdf
2007 Collan, Mikael
Lazy User Theory of Solution Selection
http://ideas.repec.org/p/pra/mprapa/4330.html