behavioral health barometer - samhsa - substance … health barometer: indiana, 2014. hhs...
TRANSCRIPT
i
Acknowledgments This report was prepared for the Substance Abuse and Mental Health Services Administration (SAMHSA) by RTI International under contract No. 283–07–0208 with SAMHSA, U.S. Department of Health and Human Services (HHS).
Public Domain Notice All material appearing in this report is in the public domain and may be reproduced or copied without permission from SAMHSA. Citation of the source is appreciated. However, this publication may not be reproduced or distributed for a fee without the specific, written authorization of the Office of Communications, SAMHSA, HHS.
Electronic Access and Printed Copies This publication may be downloaded or ordered at http://store.samhsa.gov. Or call SAMHSA at 1–877–SAMHSA–7 (1–877–726–4727) (English and Español).
Recommended Citation Substance Abuse and Mental Health Services Administration. Behavioral Health Barometer: Indiana, 2014. HHS Publication No. SMA–15–4895IN. Rockville, MD: Substance Abuse and Mental Health Services Administration, 2015.
Originating Office Center for Behavioral Health Statistics and Quality, Substance Abuse and Mental Health Services Administration, 1 Choke Cherry Road, Rockville, MD 20857.
ii
CONTENTS
FOREWORD ......................................................................................................................................... iii
YOUTH SUBSTANCE USE ................................................................................................................... 1Illicit Drug Use ................................................................................................................................... 1Cigarette Use .................................................................................................................................... 2Binge Alcohol Use ............................................................................................................................ 3Substance Use Initiation and Risk Perceptions .................................................................................. 4
YOUTH MENTAL HEALTH AND TREATMENT .................................................................................... 6Depression ....................................................................................................................................... 6Treatment for Depression .................................................................................................................. 7
MENTAL HEALTH AND TREATMENT ................................................................................................. 8Thoughts of Suicide .......................................................................................................................... 8Serious Mental Illness ....................................................................................................................... 9Treatment for Any Mental Illness ...................................................................................................... 10Mental Health Consumers ................................................................................................................11
SUBSTANCE USE .............................................................................................................................. 12Alcohol Dependence or Abuse........................................................................................................ 12Illicit Drug Dependence or Abuse .................................................................................................... 13Heavy Alcohol Use ...........................................................................................................................14
SUBSTANCE USE TREATMENT ....................................................................................................... 15Enrollment and Treatment Focus ..................................................................................................... 15Alcohol ........................................................................................................................................... 16Opioids (Medication-Assisted Therapy) .............................................................................................17Illicit Drugs ...................................................................................................................................... 18
FIGURE NOTES ................................................................................................................................. 19
DEFINITIONS ..................................................................................................................................... 20
SOURCES .......................................................................................................................................... 21
iii
FOREWORD
The Substance Abuse and Mental Health Services Administration (SAMHSA), an operating division within the U.S. Department of Health and Human Services (HHS), is charged with reducing the impact of substance abuse and mental illness on America’s communities. SAMHSA is pursuing this mission at a time of significant change. Health reform has been enacted, bringing sweeping changes to how the United States delivers, pays for, and monitors health care. Simultaneously, state budgets are shrinking, and fiscal restraint is a top priority.
This is the second edition of the Behavioral Health Barometer: Indiana, one of a series of state and national reports that provide a snapshot of behavioral health in the United States. The reports present a set of substance use and mental health indicators as measured through data collection efforts sponsored by SAMHSA, including the National Survey on Drug Use and Health and the National Survey of Substance Abuse Treatment Services. This array of indicators provides a unique overview of the nation’s behavioral health at a point in time as well as a mechanism for tracking change and trends over time. As new data become available, indicators highlighted in these reports will be updated to reflect the current state of the science and incorporate new measures of interest. The Behavioral Health Barometers will provide critical information to a variety of audiences in support of SAMHSA’s mission of reducing the impact of substance abuse and mental illness on America’s communities.
Behavioral Health Barometers for all 50 states, the District of Columbia, and the nation are published on a regular basis as part of SAMHSA’s larger behavioral health quality improvement approach.
Pamela S. Hyde, JD, Administrator Substance Abuse and Mental Health Services Administration
1
YOUTH SUBSTANCE USE ILLICIT DRUG USE
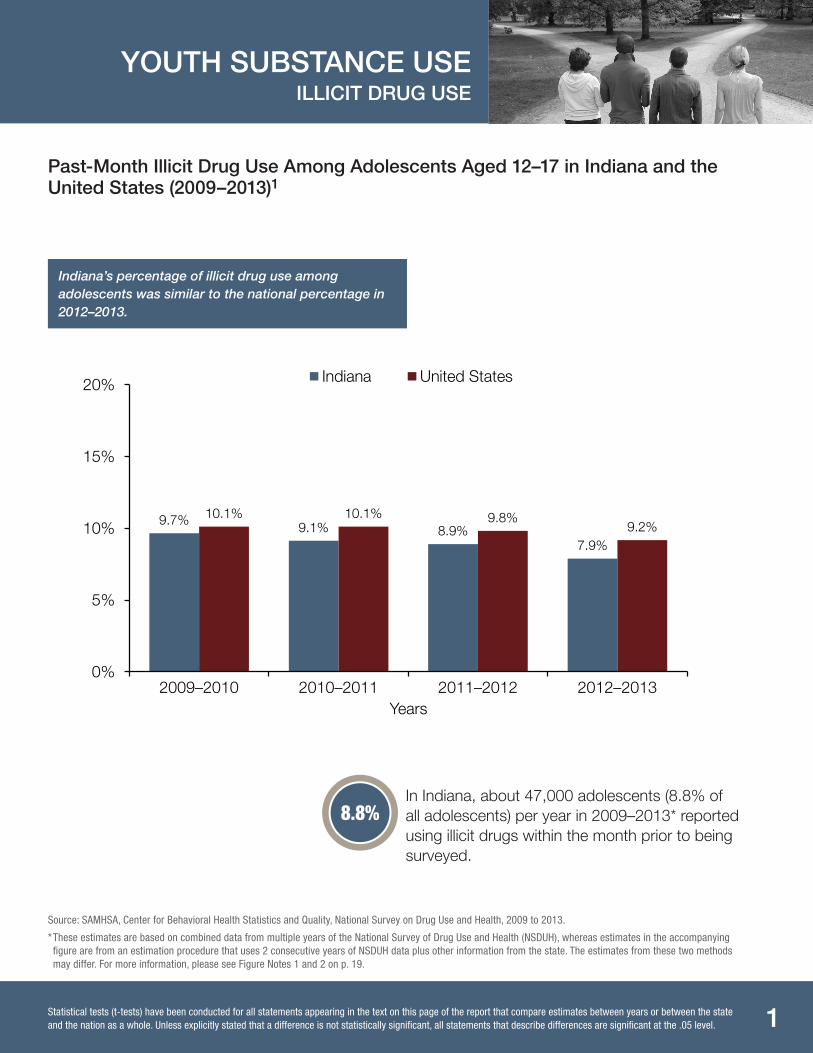
Past-Month Illicit Drug Use Among Adolescents Aged 12–17 in Indiana and the United States (2009–2013)1
Indiana’s percentage of illicit drug use among adolescents was similar to the national percentage in 2012–2013.
9.7% 9.1% 8.9% 7.9%
10.1% 10.1% 9.8% 9.2%
0%
5%
10%
15%
20%
2009–2010 2010–2011 2011–2012 2012–2013 Years
Indiana United States
In Indiana, about 47,000 adolescents (8.8% of all adolescents) per year in 2009–2013* reported using illicit drugs within the month prior to being surveyed.
8.8%
Source: SAMHSA, Center for Behavioral Health Statistics and Quality, National Survey on Drug Use and Health, 2009 to 2013.
* These estimates are based on combined data from multiple years of the National Survey of Drug Use and Health (NSDUH), whereas estimates in the accompanying figure are from an estimation procedure that uses 2 consecutive years of NSDUH data plus other information from the state. The estimates from these two methods may differ. For more information, please see Figure Notes 1 and 2 on p. 19.
Statistical tests (t-tests) have been conducted for all statements appearing in the text on this page of the report that compare estimates between years or between the state and the nation as a whole. Unless explicitly stated that a difference is not statistically significant, all statements that describe differences are significant at the .05 level.
2
YOUTH SUBSTANCE USE CIGARETTE USE
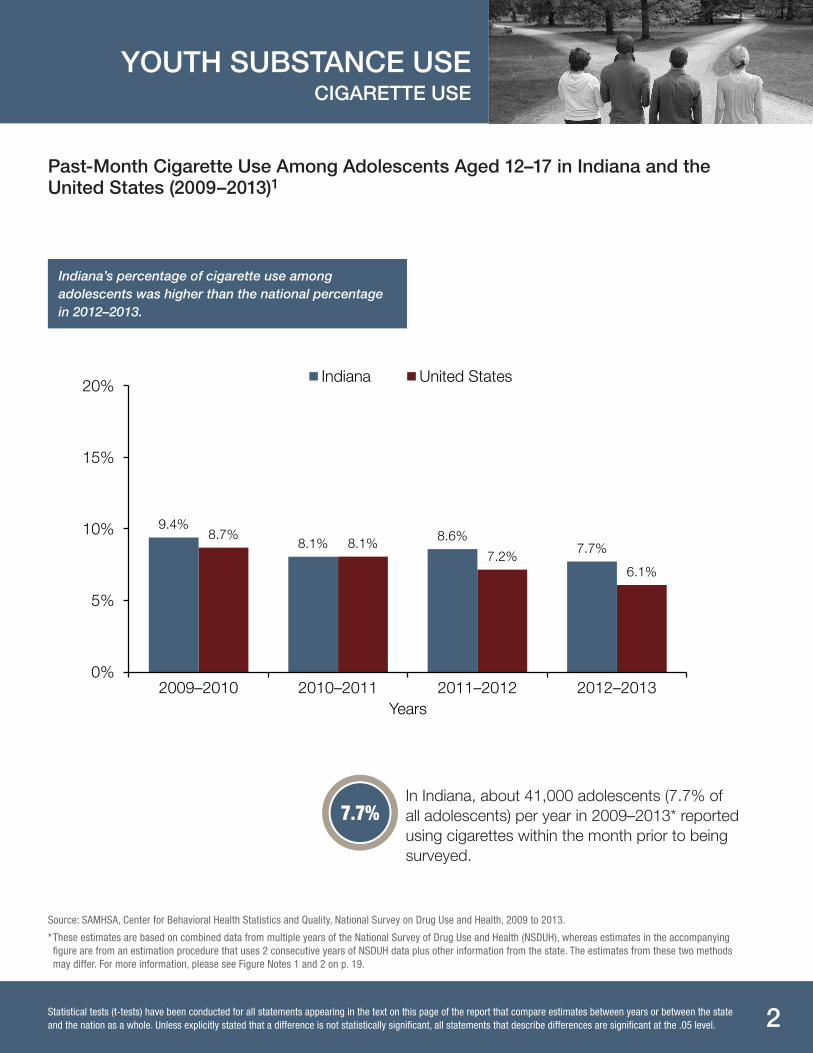
Past-Month Cigarette Use Among Adolescents Aged 12–17 in Indiana and the United States (2009–2013)1
Indiana’s percentage of cigarette use among adolescents was higher than the national percentage in 2012–2013.
9.4% 8.1% 8.6%
7.7% 8.7%
8.1% 7.2%
6.1%
0%
5%
10%
15%
20%
2009–2010 2010–2011 2011–2012 2012–2013 Years
Indiana United States
In Indiana, about 41,000 adolescents (7.7% of all adolescents) per year in 2009–2013* reported using cigarettes within the month prior to being surveyed.
7.7%
Source: SAMHSA, Center for Behavioral Health Statistics and Quality, National Survey on Drug Use and Health, 2009 to 2013.
* These estimates are based on combined data from multiple years of the National Survey of Drug Use and Health (NSDUH), whereas estimates in the accompanying figure are from an estimation procedure that uses 2 consecutive years of NSDUH data plus other information from the state. The estimates from these two methods may differ. For more information, please see Figure Notes 1 and 2 on p. 19.
Statistical tests (t-tests) have been conducted for all statements appearing in the text on this page of the report that compare estimates between years or between the state and the nation as a whole. Unless explicitly stated that a difference is not statistically significant, all statements that describe differences are significant at the .05 level.
3
YOUTH SUBSTANCE USE BINGE ALCOHOL USE
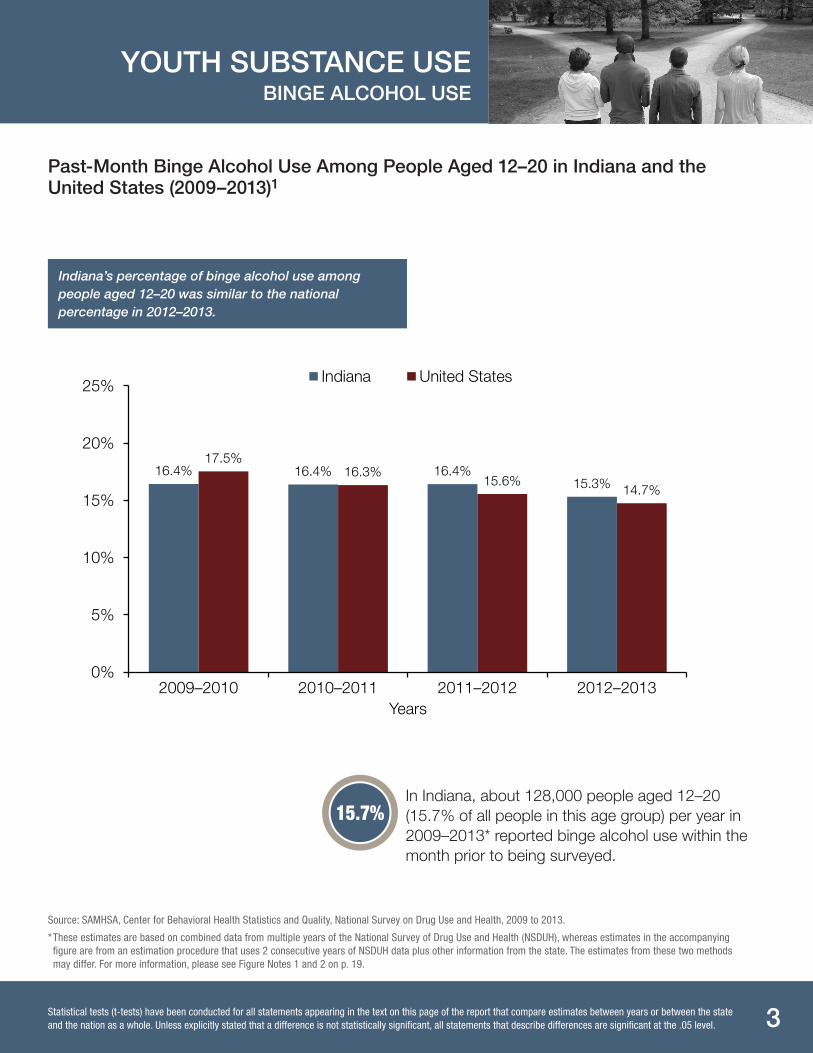
Past-Month Binge Alcohol Use Among People Aged 12–20 in Indiana and the United States (2009–2013)1
Indiana’s percentage of binge alcohol use among people aged 12–20 was similar to the national percentage in 2012–2013.
16.4% 16.4% 16.4% 15.3%
17.5% 16.3%
15.6% 14.7%
0%
5%
10%
15%
20%
25%
2009–2010 2010–2011 2011–2012 2012–2013 Years
Indiana United States
In Indiana, about 128,000 people aged 12–20 (15.7% of all people in this age group) per year in 2009–2013* reported binge alcohol use within the month prior to being surveyed.
15.7%
Source: SAMHSA, Center for Behavioral Health Statistics and Quality, National Survey on Drug Use and Health, 2009 to 2013.
* These estimates are based on combined data from multiple years of the National Survey of Drug Use and Health (NSDUH), whereas estimates in the accompanying figure are from an estimation procedure that uses 2 consecutive years of NSDUH data plus other information from the state. The estimates from these two methods may differ. For more information, please see Figure Notes 1 and 2 on p. 19.
Statistical tests (t-tests) have been conducted for all statements appearing in the text on this page of the report that compare estimates between years or between the state and the nation as a whole. Unless explicitly stated that a difference is not statistically significant, all statements that describe differences are significant at the .05 level.
4
YOUTH SUBSTANCE USE SUBSTANCE USE INITIATION AND
RISK PERCEPTIONS
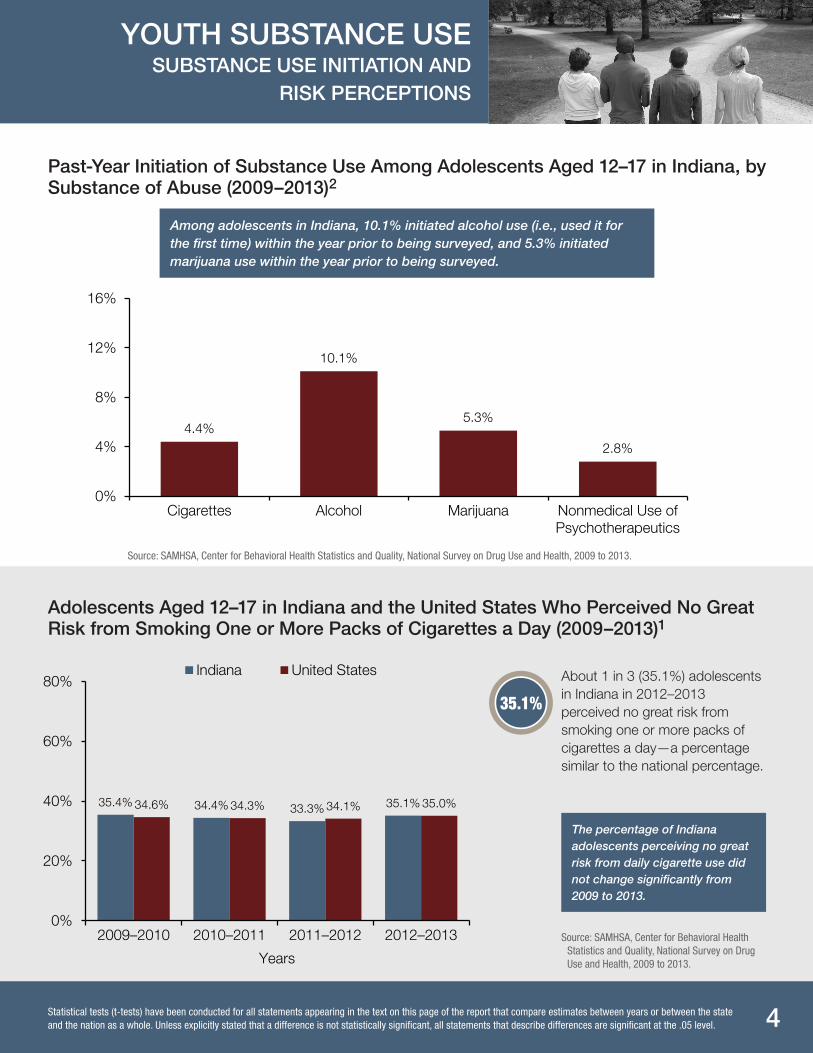
Past-Year Initiation of Substance Use Among Adolescents Aged 12–17 in Indiana, by Substance of Abuse (2009–2013)2
Among adolescents in Indiana, 10.1% initiated alcohol use (i.e., used it for the first time) within the year prior to being surveyed, and 5.3% initiated marijuana use within the year prior to being surveyed.
4.4%
10.1%
5.3%
2.8%
0%
4%
8%
12%
16%
Cigarettes Alcohol Marijuana Nonmedical Use ofPsychotherapeutics
Source: SAMHSA, Center for Behavioral Health Statistics and Quality, National Survey on Drug Use and Health, 2009 to 2013.
Adolescents Aged 12–17 in Indiana and the United States Who Perceived No Great Risk from Smoking One or More Packs of Cigarettes a Day (2009–2013)1
35.4% 34.4% 33.3% 35.1% 34.6% 34.3% 34.1% 35.0%
0%
20%
40%
60%
80%
2009–2010 2010–2011 2011–2012 2012–2013
Years
Indiana United States About 1 in 3 (35.1%) adolescents in Indiana in 2012–2013 perceived no great risk from smoking one or more packs of cigarettes a day—a percentage similar to the national percentage.
35.1%
The percentage of Indiana adolescents perceiving no great risk from daily cigarette use did not change significantly from 2009 to 2013.
Source: SAMHSA, Center for Behavioral Health Statistics and Quality, National Survey on Drug Use and Health, 2009 to 2013.
Statistical tests (t-tests) have been conducted for all statements appearing in the text on this page of the report that compare estimates between years or between the state and the nation as a whole. Unless explicitly stated that a difference is not statistically significant, all statements that describe differences are significant at the .05 level.
5
YOUTH SUBSTANCE USE SUBSTANCE USE INITIATION AND
RISK PERCEPTIONS
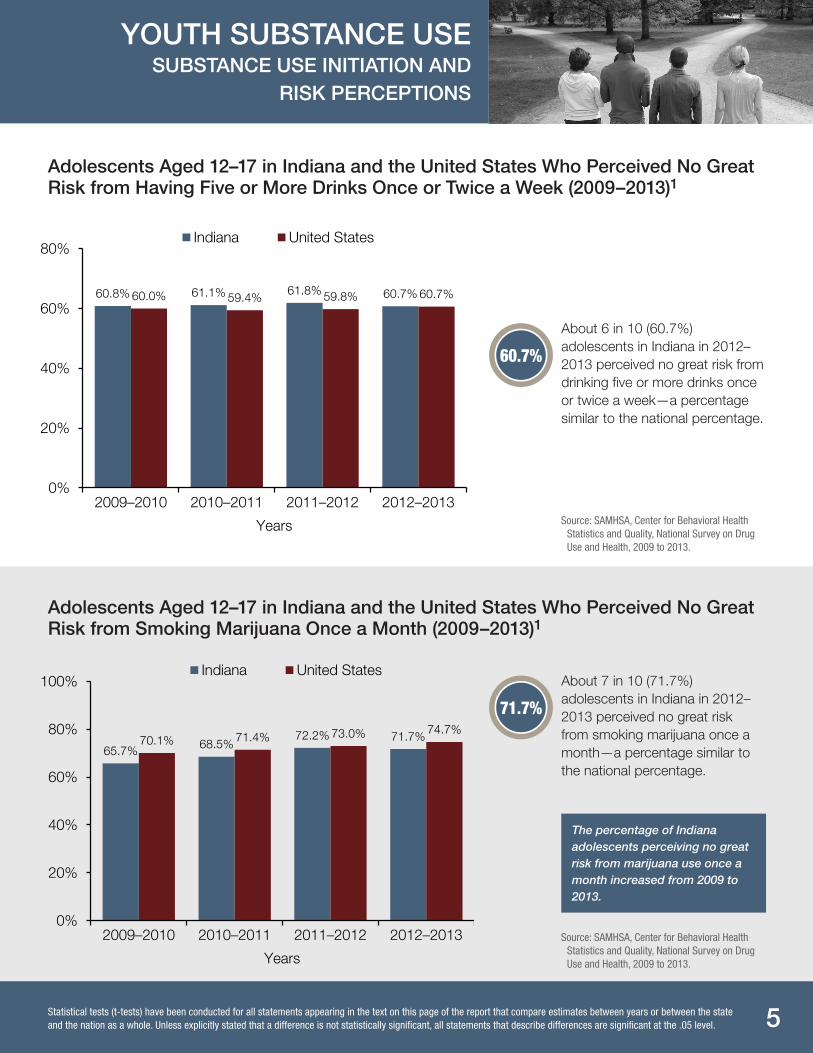
Adolescents Aged 12–17 in Indiana and the United States Who Perceived No Great Risk from Having Five or More Drinks Once or Twice a Week (2009–2013)1
60.8% 61.1% 61.8% 60.7% 60.0% 59.4% 59.8% 60.7%
0%
20%
40%
60%
80%
2009–2010 2010–2011 2011–2012 2012–2013
Years
Indiana United States
About 6 in 10 (60.7%) adolescents in Indiana in 2012–2013 perceived no great risk from drinking five or more drinks once or twice a week—a percentage similar to the national percentage.
60.7%
Source: SAMHSA, Center for Behavioral Health Statistics and Quality, National Survey on Drug Use and Health, 2009 to 2013.
Adolescents Aged 12–17 in Indiana and the United States Who Perceived No Great Risk from Smoking Marijuana Once a Month (2009–2013)1
65.7% 68.5% 72.2% 71.7% 70.1% 71.4% 73.0% 74.7%
0%
20%
40%
60%
80%
100%
2009–2010 2010–2011 2011–2012 2012–2013
Years
Indiana United StatesAbout 7 in 10 (71.7%) adolescents in Indiana in 2012–2013 perceived no great risk from smoking marijuana once a month—a percentage similar to the national percentage.
71.7%
The percentage of Indiana adolescents perceiving no great risk from marijuana use once a month increased from 2009 to 2013.
Source: SAMHSA, Center for Behavioral Health Statistics and Quality, National Survey on Drug Use and Health, 2009 to 2013.
Statistical tests (t-tests) have been conducted for all statements appearing in the text on this page of the report that compare estimates between years or between the state and the nation as a whole. Unless explicitly stated that a difference is not statistically significant, all statements that describe differences are significant at the .05 level.
6
YOUTH MENTAL HEALTH AND TREATMENT
DEPRESSION
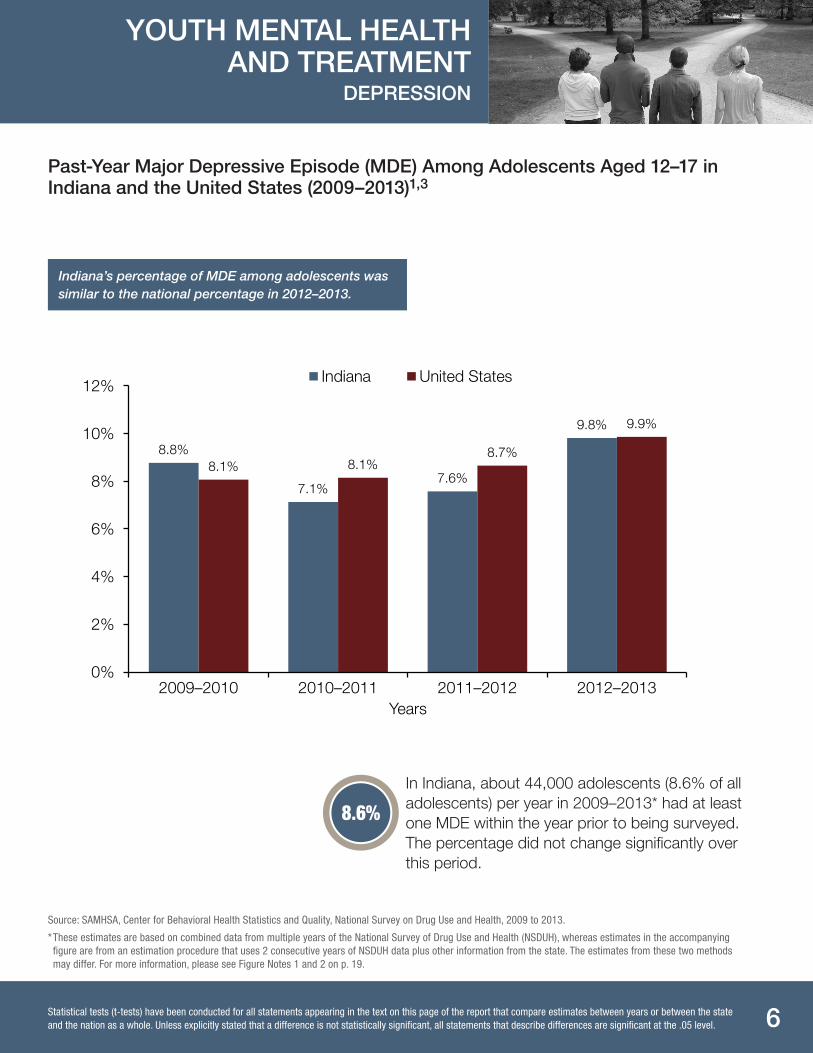
Past-Year Major Depressive Episode (MDE) Among Adolescents Aged 12–17 in Indiana and the United States (2009–2013)1,3
Indiana’s percentage of MDE among adolescents was similar to the national percentage in 2012–2013.
8.8%
7.1% 7.6%
9.8%
8.1% 8.1% 8.7%
9.9%
0%
2%
4%
6%
8%
10%
12%
2009–2010 2010–2011 2011–2012 2012–2013 Years
Indiana United States
In Indiana, about 44,000 adolescents (8.6% of all adolescents) per year in 2009–2013* had at least one MDE within the year prior to being surveyed. The percentage did not change significantly over this period.
8.6%
Source: SAMHSA, Center for Behavioral Health Statistics and Quality, National Survey on Drug Use and Health, 2009 to 2013.
* These estimates are based on combined data from multiple years of the National Survey of Drug Use and Health (NSDUH), whereas estimates in the accompanying figure are from an estimation procedure that uses 2 consecutive years of NSDUH data plus other information from the state. The estimates from these two methods may differ. For more information, please see Figure Notes 1 and 2 on p. 19.
Statistical tests (t-tests) have been conducted for all statements appearing in the text on this page of the report that compare estimates between years or between the state and the nation as a whole. Unless explicitly stated that a difference is not statistically significant, all statements that describe differences are significant at the .05 level.
7
YOUTH MENTAL HEALTH AND TREATMENT
TREATMENT FOR DEPRESSION
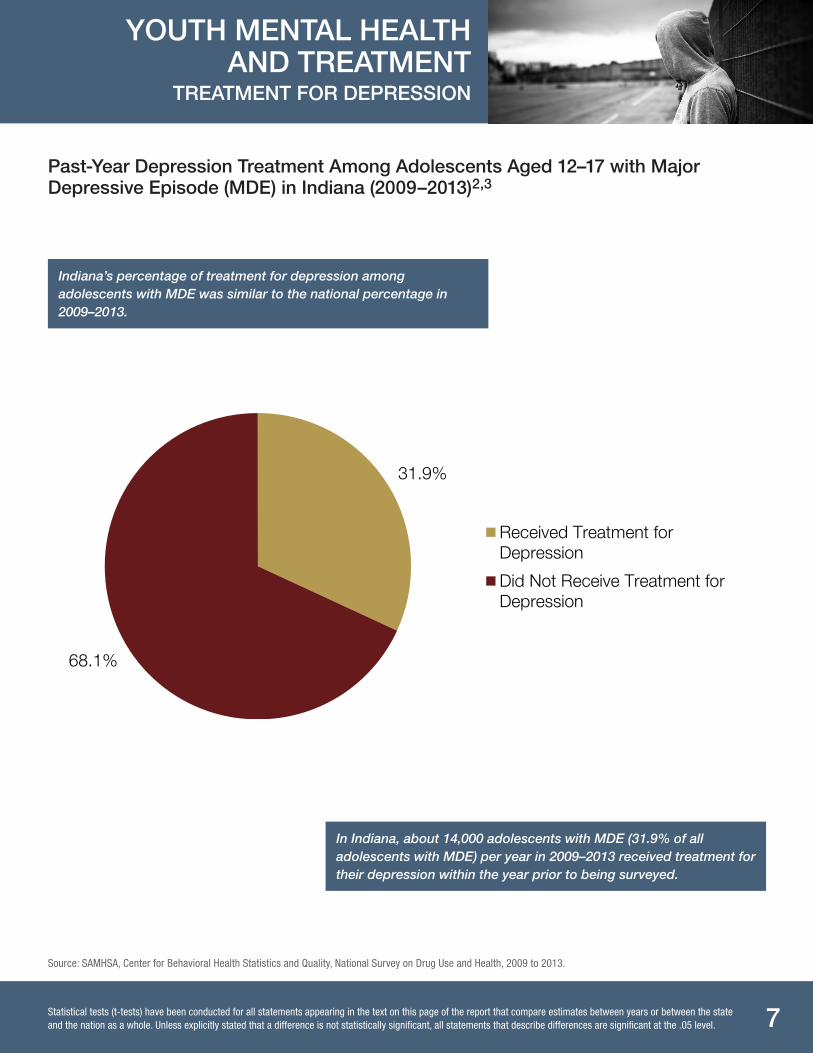
Past-Year Depression Treatment Among Adolescents Aged 12–17 with Major Depressive Episode (MDE) in Indiana (2009–2013)2,3
Indiana’s percentage of treatment for depression among adolescents with MDE was similar to the national percentage in 2009–2013.
31.9%
68.1%
Received Treatment forDepression
Did Not Receive Treatment forDepression
In Indiana, about 14,000 adolescents with MDE (31.9% of all adolescents with MDE) per year in 2009–2013 received treatment for their depression within the year prior to being surveyed.
Source: SAMHSA, Center for Behavioral Health Statistics and Quality, National Survey on Drug Use and Health, 2009 to 2013.
Statistical tests (t-tests) have been conducted for all statements appearing in the text on this page of the report that compare estimates between years or between the state and the nation as a whole. Unless explicitly stated that a difference is not statistically significant, all statements that describe differences are significant at the .05 level.
8
MENTAL HEALTH AND TREATMENT
THOUGHTS OF SUICIDE
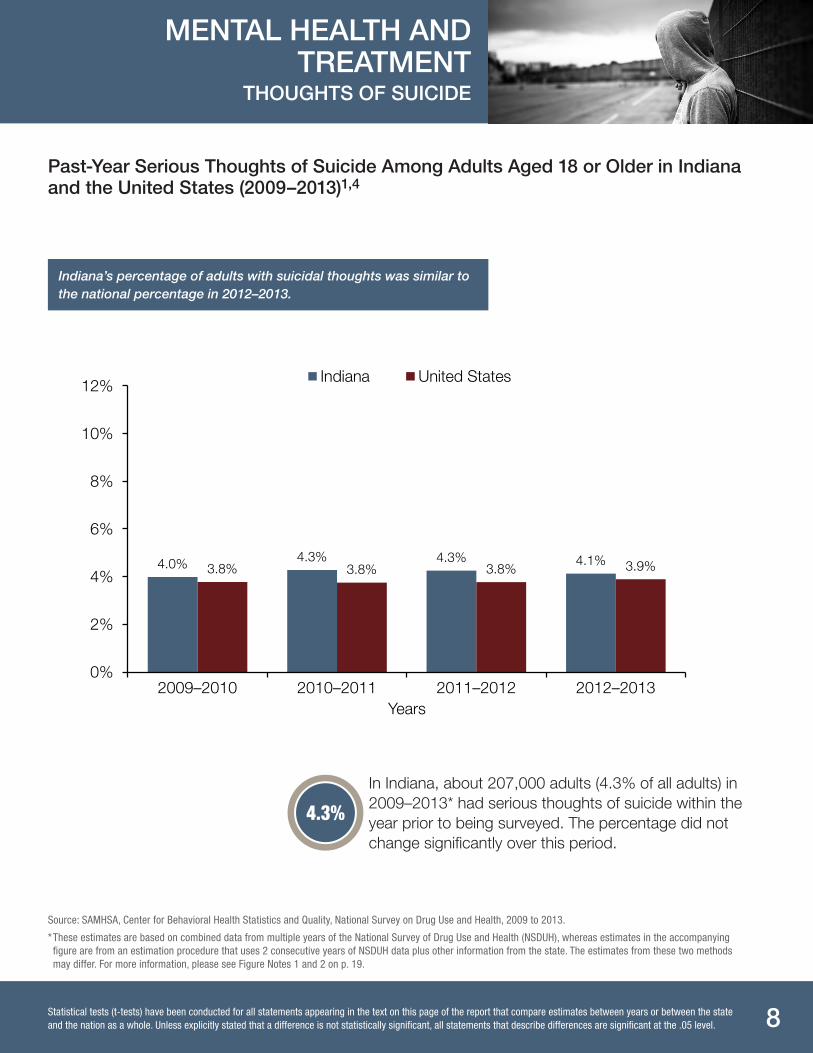
Past-Year Serious Thoughts of Suicide Among Adults Aged 18 or Older in Indiana and the United States (2009–2013)1,4
Indiana’s percentage of adults with suicidal thoughts was similar to the national percentage in 2012–2013.
4.0% 4.3% 4.3% 4.1% 3.8% 3.8% 3.8% 3.9%
0%
2%
4%
6%
8%
10%
12%
2009–2010 2010–2011 2011–2012 2012–2013 Years
Indiana United States
In Indiana, about 207,000 adults (4.3% of all adults) in 2009–2013* had serious thoughts of suicide within the year prior to being surveyed. The percentage did not change significantly over this period.
4.3%
Source: SAMHSA, Center for Behavioral Health Statistics and Quality, National Survey on Drug Use and Health, 2009 to 2013.
* These estimates are based on combined data from multiple years of the National Survey of Drug Use and Health (NSDUH), whereas estimates in the accompanying figure are from an estimation procedure that uses 2 consecutive years of NSDUH data plus other information from the state. The estimates from these two methods may differ. For more information, please see Figure Notes 1 and 2 on p. 19.
Statistical tests (t-tests) have been conducted for all statements appearing in the text on this page of the report that compare estimates between years or between the state and the nation as a whole. Unless explicitly stated that a difference is not statistically significant, all statements that describe differences are significant at the .05 level.
9
MENTAL HEALTH AND TREATMENT
SERIOUS MENTAL ILLNESS
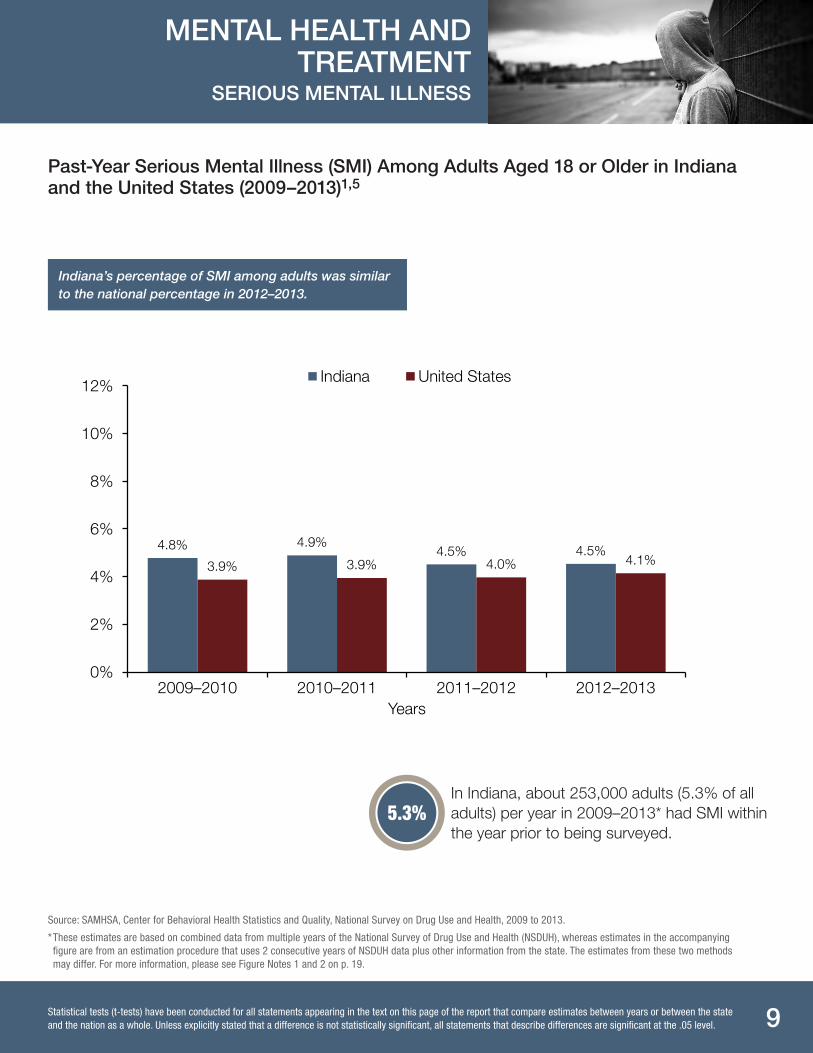
Past-Year Serious Mental Illness (SMI) Among Adults Aged 18 or Older in Indiana and the United States (2009–2013)1,5
Indiana’s percentage of SMI among adults was similar to the national percentage in 2012–2013.
4.8% 4.9% 4.5% 4.5%
3.9% 3.9% 4.0% 4.1%
0%
2%
4%
6%
8%
10%
12%
2009–2010 2010–2011 2011–2012 2012–2013 Years
Indiana United States
In Indiana, about 253,000 adults (5.3% of all adults) per year in 2009–2013* had SMI within the year prior to being surveyed.
5.3%
Source: SAMHSA, Center for Behavioral Health Statistics and Quality, National Survey on Drug Use and Health, 2009 to 2013.
* These estimates are based on combined data from multiple years of the National Survey of Drug Use and Health (NSDUH), whereas estimates in the accompanying figure are from an estimation procedure that uses 2 consecutive years of NSDUH data plus other information from the state. The estimates from these two methods may differ. For more information, please see Figure Notes 1 and 2 on p. 19.
Statistical tests (t-tests) have been conducted for all statements appearing in the text on this page of the report that compare estimates between years or between the state and the nation as a whole. Unless explicitly stated that a difference is not statistically significant, all statements that describe differences are significant at the .05 level.
10
MENTAL HEALTH AND TREATMENT
TREATMENT FOR ANY MENTAL ILLNESS
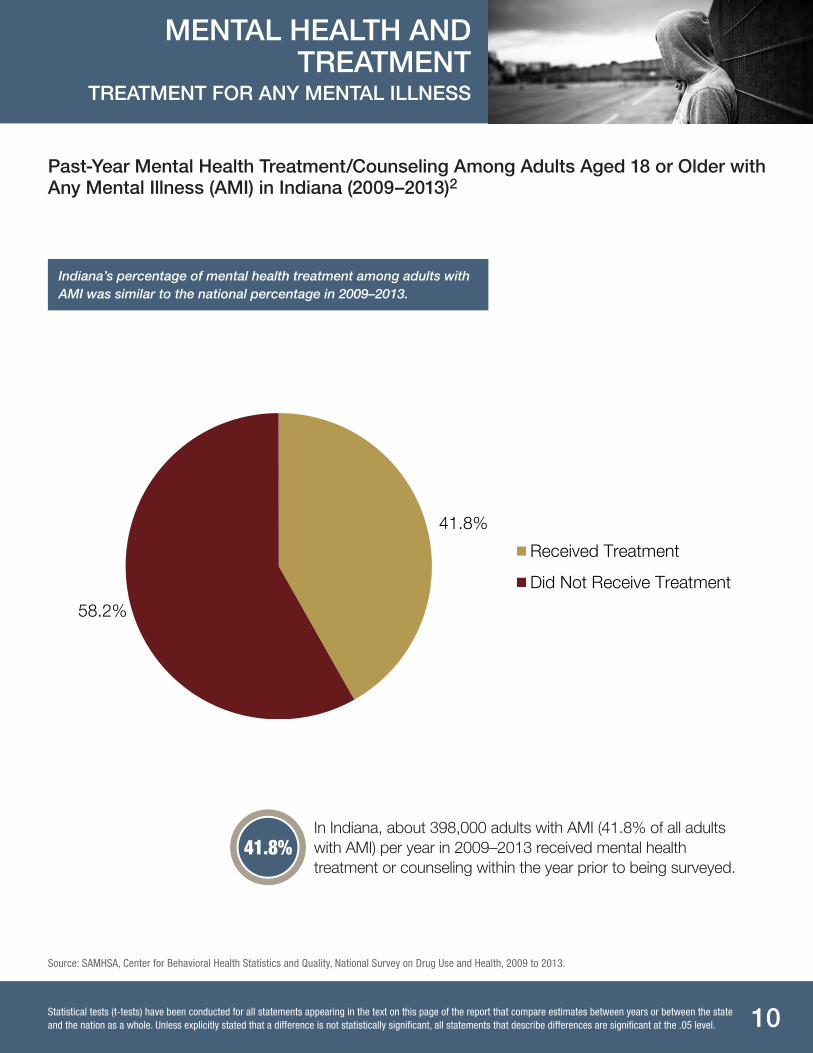
Past-Year Mental Health Treatment/Counseling Among Adults Aged 18 or Older with Any Mental Illness (AMI) in Indiana (2009–2013)2
Indiana’s percentage of mental health treatment among adults with AMI was similar to the national percentage in 2009–2013.
41.8%
58.2%
Received Treatment
Did Not Receive Treatment
In Indiana, about 398,000 adults with AMI (41.8% of all adults with AMI) per year in 2009–2013 received mental health treatment or counseling within the year prior to being surveyed.
41.8%
Source: SAMHSA, Center for Behavioral Health Statistics and Quality, National Survey on Drug Use and Health, 2009 to 2013.
Statistical tests (t-tests) have been conducted for all statements appearing in the text on this page of the report that compare estimates between years or between the state and the nation as a whole. Unless explicitly stated that a difference is not statistically significant, all statements that describe differences are significant at the .05 level.
11
MENTAL HEALTH AND TREATMENT
MENTAL HEALTH CONSUMERS
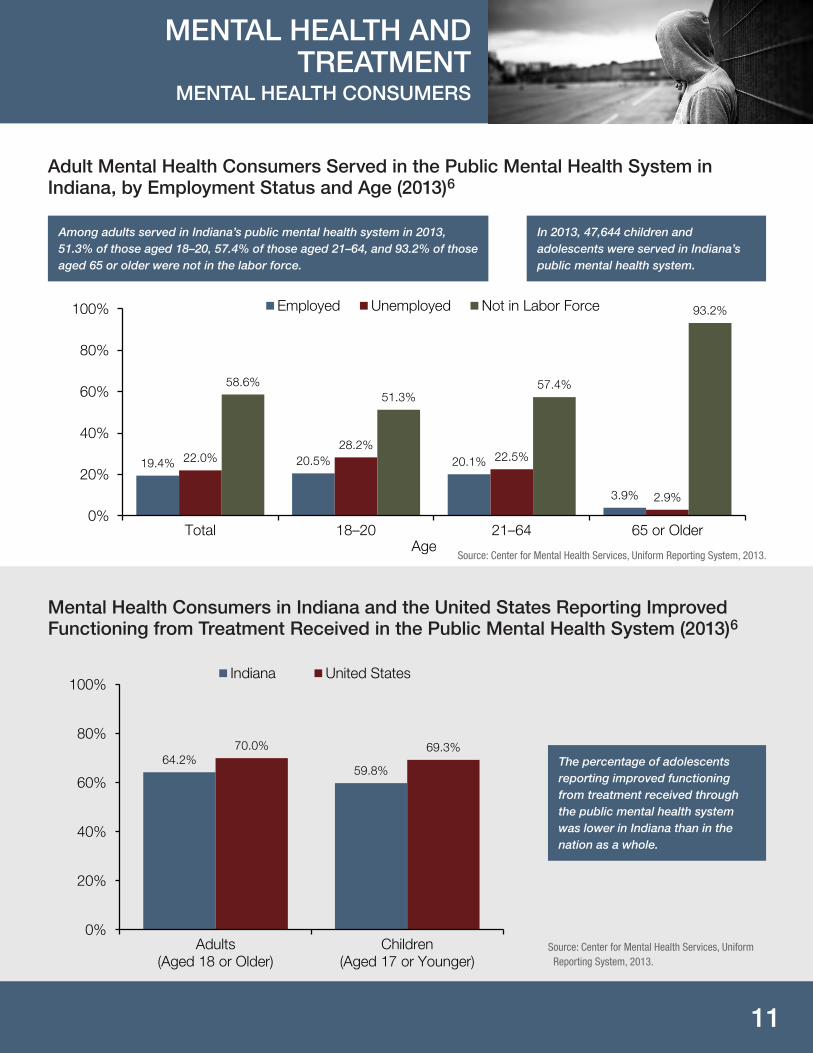
Adult Mental Health Consumers Served in the Public Mental Health System in Indiana, by Employment Status and Age (2013)6
Among adults served in Indiana’s public mental health system in 2013, 51.3% of those aged 18–20, 57.4% of those aged 21–64, and 93.2% of those aged 65 or older were not in the labor force.
In 2013, 47,644 children and adolescents were served in Indiana’s public mental health system.
19.4% 20.5% 20.1%
3.9%
22.0% 28.2%
22.5%
2.9%
58.6% 51.3%
57.4%
93.2%
0%
20%
40%
60%
80%
100%
Total 18–20 21–64 65 or OlderAge
Employed Unemployed Not in Labor Force
Source: Center for Mental Health Services, Uniform Reporting System, 2013.
Mental Health Consumers in Indiana and the United States Reporting Improved Functioning from Treatment Received in the Public Mental Health System (2013)6
64.2% 59.8%
70.0% 69.3%
0%
20%
40%
60%
80%
100%
Adults(Aged 18 or Older)
Children(Aged 17 or Younger)
Indiana United States
The percentage of adolescents reporting improved functioning from treatment received through the public mental health system was lower in Indiana than in the nation as a whole.
Source: Center for Mental Health Services, Uniform Reporting System, 2013.
12
SUBSTANCE USE ALCOHOL DEPENDENCE OR ABUSE
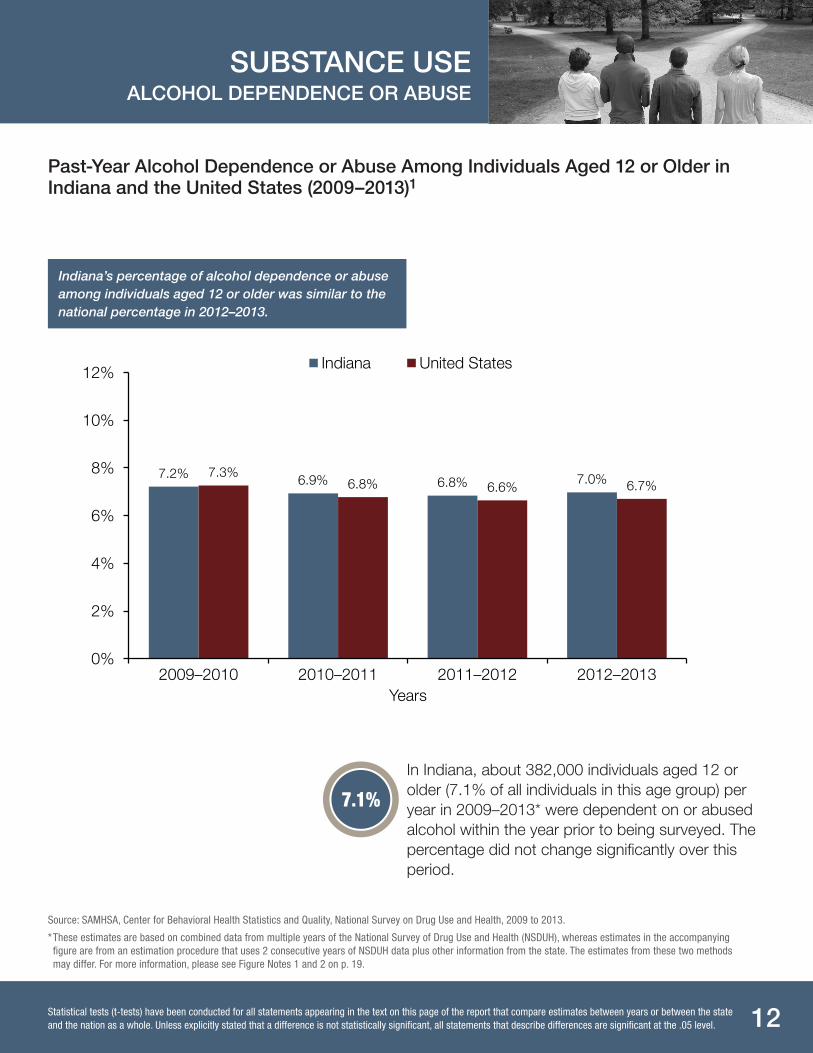
Past-Year Alcohol Dependence or Abuse Among Individuals Aged 12 or Older in Indiana and the United States (2009–2013)1
Indiana’s percentage of alcohol dependence or abuse among individuals aged 12 or older was similar to the national percentage in 2012–2013.
7.2% 6.9% 6.8% 7.0% 7.3% 6.8% 6.6% 6.7%
0%
2%
4%
6%
8%
10%
12%
2009–2010 2010–2011 2011–2012 2012–2013 Years
Indiana United States
In Indiana, about 382,000 individuals aged 12 or older (7.1% of all individuals in this age group) per year in 2009–2013* were dependent on or abused alcohol within the year prior to being surveyed. The percentage did not change significantly over this period.
7.1%
Source: SAMHSA, Center for Behavioral Health Statistics and Quality, National Survey on Drug Use and Health, 2009 to 2013.
* These estimates are based on combined data from multiple years of the National Survey of Drug Use and Health (NSDUH), whereas estimates in the accompanying figure are from an estimation procedure that uses 2 consecutive years of NSDUH data plus other information from the state. The estimates from these two methods may differ. For more information, please see Figure Notes 1 and 2 on p. 19.
Statistical tests (t-tests) have been conducted for all statements appearing in the text on this page of the report that compare estimates between years or between the state and the nation as a whole. Unless explicitly stated that a difference is not statistically significant, all statements that describe differences are significant at the .05 level.
13
SUBSTANCE USE ILLICIT DRUG DEPENDENCE OR ABUSE
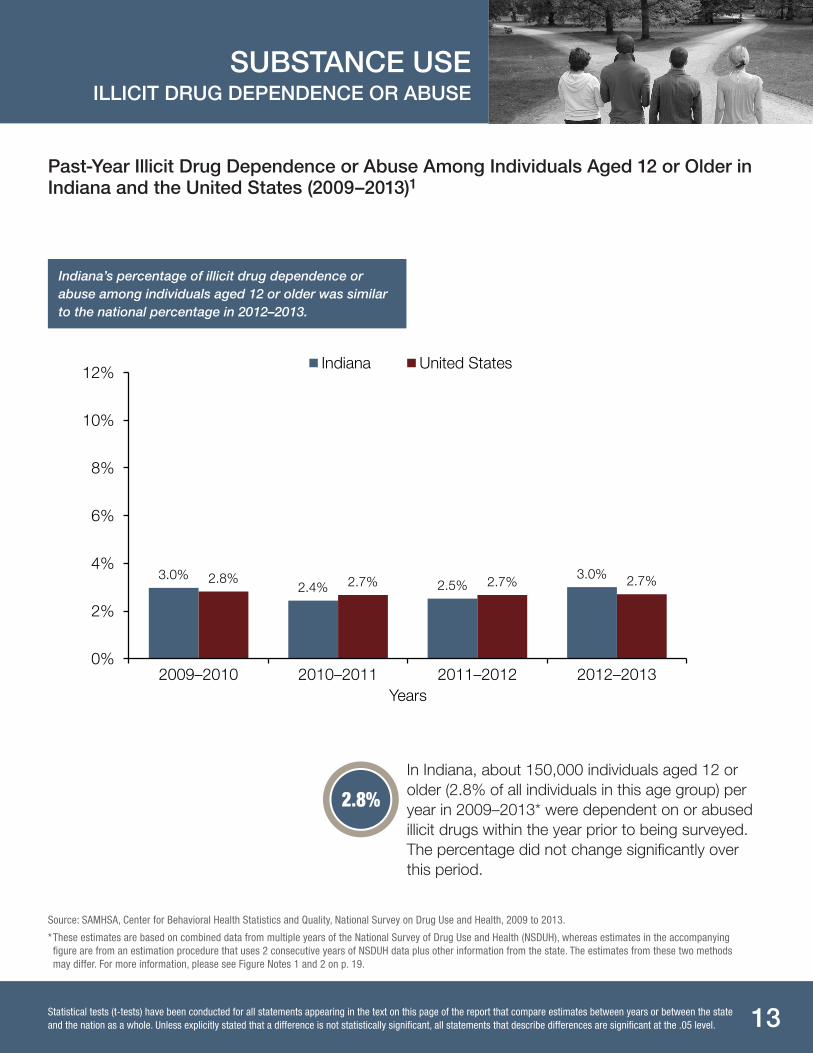
Past-Year Illicit Drug Dependence or Abuse Among Individuals Aged 12 or Older in Indiana and the United States (2009–2013)1
Indiana’s percentage of illicit drug dependence or abuse among individuals aged 12 or older was similar to the national percentage in 2012–2013.
3.0% 2.4% 2.5%
3.0% 2.8% 2.7% 2.7% 2.7%
0%
2%
4%
6%
8%
10%
12%
2009–2010 2010–2011 2011–2012 2012–2013 Years
Indiana United States
In Indiana, about 150,000 individuals aged 12 or older (2.8% of all individuals in this age group) per year in 2009–2013* were dependent on or abused illicit drugs within the year prior to being surveyed. The percentage did not change significantly over this period.
2.8%
Source: SAMHSA, Center for Behavioral Health Statistics and Quality, National Survey on Drug Use and Health, 2009 to 2013.
* These estimates are based on combined data from multiple years of the National Survey of Drug Use and Health (NSDUH), whereas estimates in the accompanying figure are from an estimation procedure that uses 2 consecutive years of NSDUH data plus other information from the state. The estimates from these two methods may differ. For more information, please see Figure Notes 1 and 2 on p. 19.
Statistical tests (t-tests) have been conducted for all statements appearing in the text on this page of the report that compare estimates between years or between the state and the nation as a whole. Unless explicitly stated that a difference is not statistically significant, all statements that describe differences are significant at the .05 level.
14
SUBSTANCE USE HEAVY ALCOHOL USE
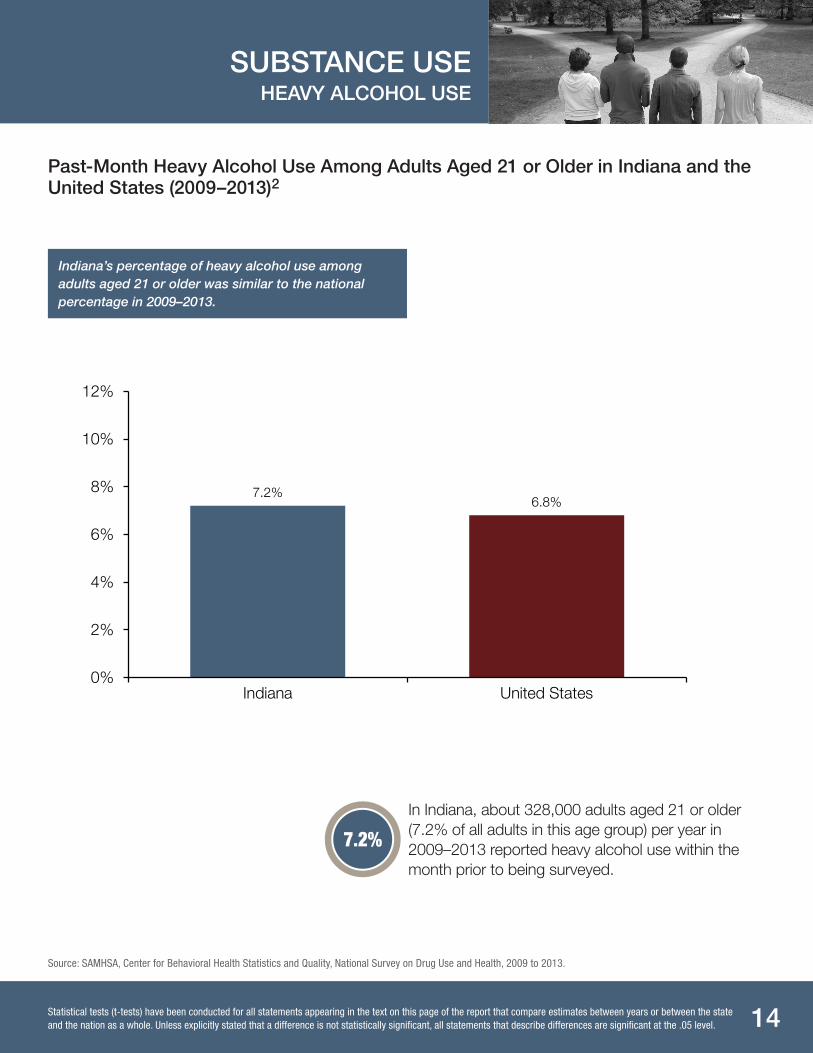
Past-Month Heavy Alcohol Use Among Adults Aged 21 or Older in Indiana and the United States (2009–2013)2
Indiana’s percentage of heavy alcohol use among adults aged 21 or older was similar to the national percentage in 2009–2013.
7.2% 6.8%
0%
2%
4%
6%
8%
10%
12%
Indiana United States
In Indiana, about 328,000 adults aged 21 or older (7.2% of all adults in this age group) per year in 2009–2013 reported heavy alcohol use within the month prior to being surveyed.
7.2%
Source: SAMHSA, Center for Behavioral Health Statistics and Quality, National Survey on Drug Use and Health, 2009 to 2013.
Statistical tests (t-tests) have been conducted for all statements appearing in the text on this page of the report that compare estimates between years or between the state and the nation as a whole. Unless explicitly stated that a difference is not statistically significant, all statements that describe differences are significant at the .05 level.
15
SUBSTANCE USE TREATMENT ENROLLMENT AND TREATMENT FOCUS
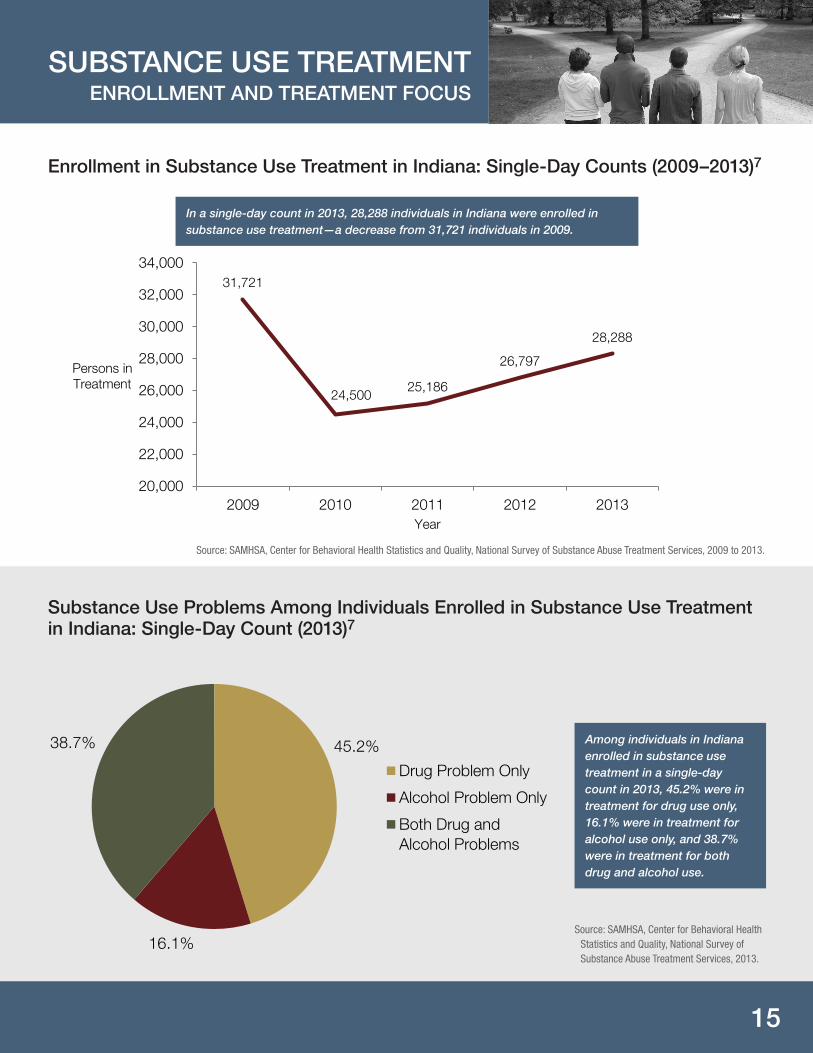
Enrollment in Substance Use Treatment in Indiana: Single-Day Counts (2009–2013)7
In a single-day count in 2013, 28,288 individuals in Indiana were enrolled in substance use treatment—a decrease from 31,721 individuals in 2009.
31,721
24,500 25,186
26,797
28,288
20,000
22,000
24,000
26,000
28,000
30,000
32,000
34,000
2009 2010 2011 2012 2013
Persons in Treatment
Year
Source: SAMHSA, Center for Behavioral Health Statistics and Quality, National Survey of Substance Abuse Treatment Services, 2009 to 2013.
Substance Use Problems Among Individuals Enrolled in Substance Use Treatment in Indiana: Single-Day Count (2013)7
45.2%
16.1%
38.7%
Drug Problem Only
Alcohol Problem Only
Both Drug andAlcohol Problems
Among individuals in Indiana enrolled in substance use treatment in a single-day count in 2013, 45.2% were in treatment for drug use only, 16.1% were in treatment for alcohol use only, and 38.7% were in treatment for both drug and alcohol use.
Source: SAMHSA, Center for Behavioral Health Statistics and Quality, National Survey of Substance Abuse Treatment Services, 2013.
16
SUBSTANCE USE TREATMENT ALCOHOL
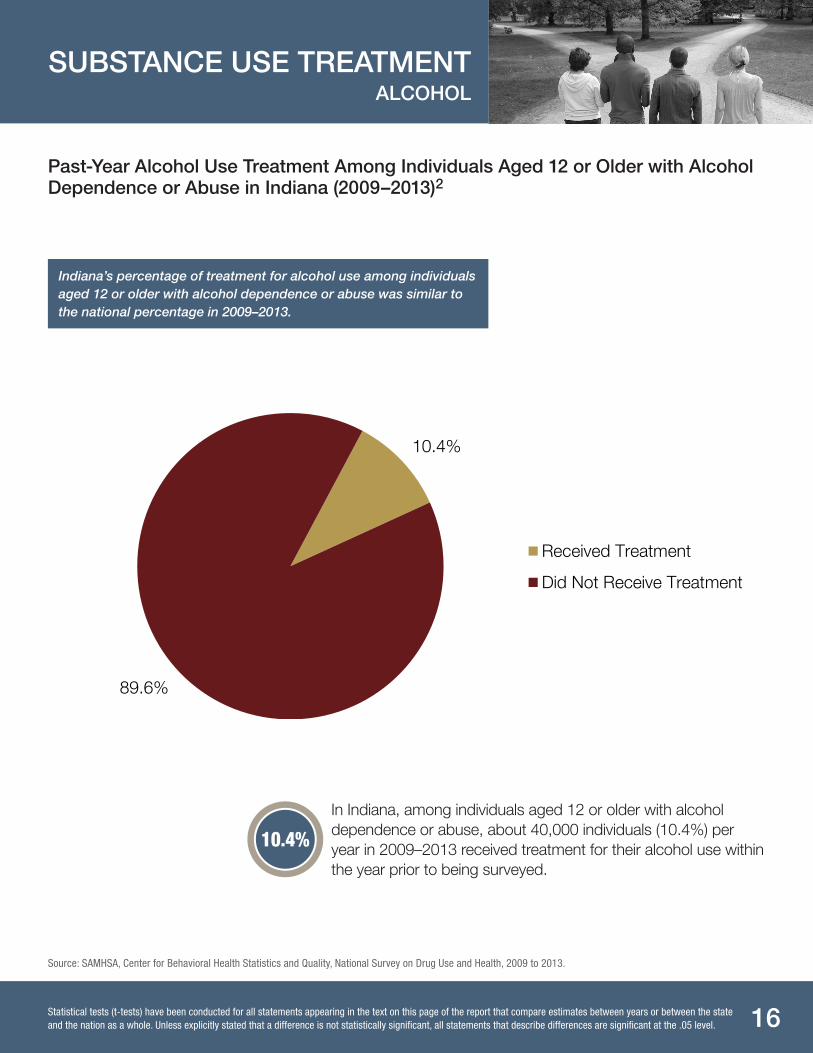
Past-Year Alcohol Use Treatment Among Individuals Aged 12 or Older with Alcohol Dependence or Abuse in Indiana (2009–2013)2
Indiana’s percentage of treatment for alcohol use among individuals aged 12 or older with alcohol dependence or abuse was similar to the national percentage in 2009–2013.
10.4%
89.6%
Received Treatment
Did Not Receive Treatment
In Indiana, among individuals aged 12 or older with alcohol dependence or abuse, about 40,000 individuals (10.4%) per year in 2009–2013 received treatment for their alcohol use within the year prior to being surveyed.
10.4%
Source: SAMHSA, Center for Behavioral Health Statistics and Quality, National Survey on Drug Use and Health, 2009 to 2013.
Statistical tests (t-tests) have been conducted for all statements appearing in the text on this page of the report that compare estimates between years or between the state and the nation as a whole. Unless explicitly stated that a difference is not statistically significant, all statements that describe differences are significant at the .05 level.
17
SUBSTANCE USE TREATMENT OPIOIDS (MEDICATION-ASSISTED THERAPY)
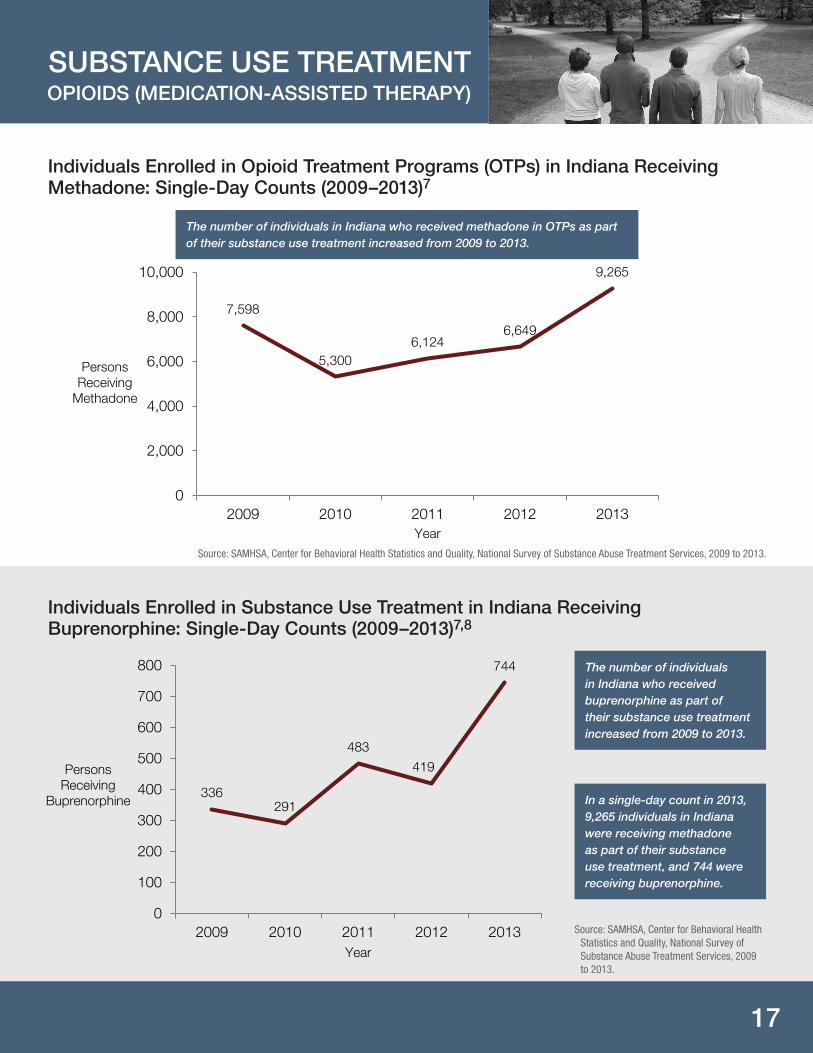
Individuals Enrolled in Opioid Treatment Programs (OTPs) in Indiana Receiving Methadone: Single-Day Counts (2009–2013)7
The number of individuals in Indiana who received methadone in OTPs as part of their substance use treatment increased from 2009 to 2013.
7,598
5,300 6,124
6,649
9,265
0
2,000
4,000
6,000
8,000
10,000
2009 2010 2011 2012 2013
Persons Receiving
Methadone
Year Source: SAMHSA, Center for Behavioral Health Statistics and Quality, National Survey of Substance Abuse Treatment Services, 2009 to 2013.
Individuals Enrolled in Substance Use Treatment in Indiana Receiving Buprenorphine: Single-Day Counts (2009–2013)7,8
336 291
483
419
744
0
100
200
300
400
500
600
700
800
2009 2010 2011 2012 2013
Persons Receiving
Buprenorphine
Year
The number of individuals in Indiana who received buprenorphine as part of their substance use treatment increased from 2009 to 2013.
In a single-day count in 2013, 9,265 individuals in Indiana were receiving methadone as part of their substance use treatment, and 744 were receiving buprenorphine.
Source: SAMHSA, Center for Behavioral Health Statistics and Quality, National Survey of Substance Abuse Treatment Services, 2009 to 2013.
18
SUBSTANCE USE TREATMENT ILLICIT DRUGS
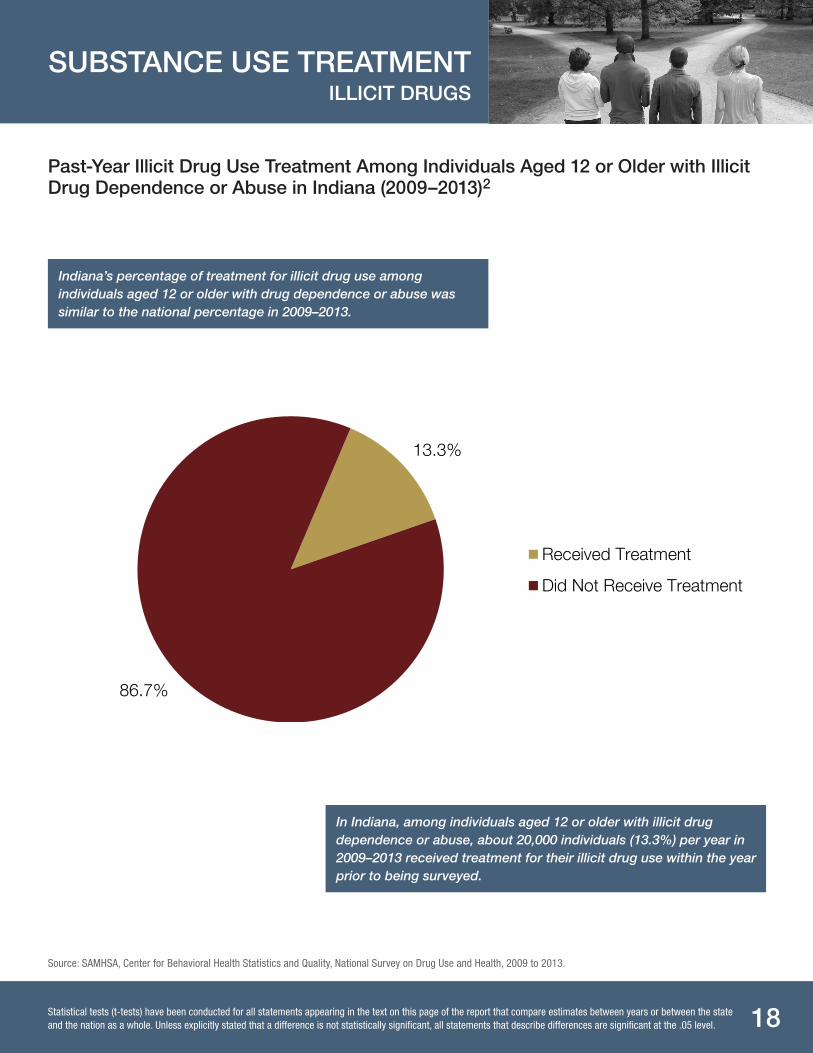
Past-Year Illicit Drug Use Treatment Among Individuals Aged 12 or Older with Illicit Drug Dependence or Abuse in Indiana (2009–2013)2
Indiana’s percentage of treatment for illicit drug use among individuals aged 12 or older with drug dependence or abuse was similar to the national percentage in 2009–2013.
13.3%
86.7%
Received Treatment
Did Not Receive Treatment
In Indiana, among individuals aged 12 or older with illicit drug dependence or abuse, about 20,000 individuals (13.3%) per year in 2009–2013 received treatment for their illicit drug use within the year prior to being surveyed.
Source: SAMHSA, Center for Behavioral Health Statistics and Quality, National Survey on Drug Use and Health, 2009 to 2013.
Statistical tests (t-tests) have been conducted for all statements appearing in the text on this page of the report that compare estimates between years or between the state and the nation as a whole. Unless explicitly stated that a difference is not statistically significant, all statements that describe differences are significant at the .05 level.
19
FIGURE NOTES
1 State estimates are based on a small area estimation procedure in which state-level National Survey of Drug Use and Health (NSDUH) data from 2 consecutive survey years are combined with local-area county and census block group/tract-level data from the state. This model-based methodology provides more precise estimates of substance use at the state level than those based solely on the sample, particularly for states with smaller sample sizes.
2 Estimates are annual averages based on combined 2009–2013 NSDUH data or combined 2005–2013 or 2006– 2013 NSDUH data where indicated. These estimates are based solely on the sample, unlike estimates based on the small area estimation procedure as stated above.
3 Respondents with unknown past-year major depressive episode (MDE) data were excluded.
4 Estimates were based only on responses to suicide items in the NSDUH Mental Health module. Respondents with unknown suicide information were excluded.
5 Estimates of SMI and AMI presented in this publication may differ from estimates in other publications as a result of revisions made to the NSDUH mental illness estimation models in 2012. Other NSDUH mental health measures presented were not affected. Please note that 2013 Barometer reports include the revised SMI and AMI estimates. For further information, see Revised Estimates of Mental Illness from the National Survey on Drug Use and Health, which is available on the SAMHSA Web site at http://www.samhsa.gov/data/sites/default/files/NSDUH148/NSDUH148/sr148-mental-illness-estimates.pdf.
6 Data on mental health consumers are from the SAMHSA Center for Mental Health Services Uniform Reporting System.
7 Single-day counts reflect the number of persons who were enrolled in substance use treatment on March 31, 2009; March 31, 2010; March 31, 2011; March 30, 2012; and March 29, 2013.
8 Physicians who obtain specialized training may prescribe buprenorphine. Some physicians are in private, office-based practices; others are affiliated with substance abuse treatment facilities or programs and may prescribe buprenorphine to clients at those facilities. Additionally, OTPs may also prescribe and/or dispense buprenorphine. The buprenorphine single-day counts include only those clients who received/were prescribed buprenorphine by physicians affiliated with substance abuse treatment facilities or OTPs; they do not include clients from private practice physicians.
20
DEFINITIONS
Any mental illness (AMI) among adults aged 18 or older is defined as currently or at any time in the past year having had a diagnosable mental, behavioral, or emotional disorder (excluding developmental and substance use disorders) of sufficient duration to meet diagnostic criteria specified within the 4th edition of the Diagnostic and Statistical Manual of Mental Disorders (DSM-IV). Adults who had a diagnosable mental, behavioral, or emotional disorder in the past year, regardless of their level of functional impairment, were defined as having any mental illness.
Binge alcohol use is defined as drinking five or more drinks on the same occasion (i.e., at the same time or within a couple of hours of each other) on at least 1 day in the past 30 days.
Dependence on or abuse of alcohol or illicit drugs is defined using DSM-IV criteria.
Heavy alcohol use is defined as drinking five or more drinks on the same occasion on each of 5 or more days in the past 30 days.
Illicit drugs include marijuana/hashish, cocaine (including crack), inhalants, hallucinogens, heroin, or prescription-type drugs used nonmedically, based on data from original NSDUH questions, not including methamphetamine use items added in 2005 and 2006.
Illicit drug use treatment and alcohol use treatment refer to treatment received in order to reduce or stop illicit drug or alcohol use, or for medical problems associated with illicit drug or alcohol use. They include treatment received at any location, such as a hospital (inpatient), rehabilitation facility (inpatient or outpatient), mental health center, emergency room, private doctor’s office, self-help group, or prison/jail.
Major depressive episode (MDE) is defined as in the 4th edition of the Diagnostic and Statistical Manual of Mental Disorders (DSM-IV), which specifies a period of at least 2 weeks in the past year when a person experienced a depressed mood or loss of interest or pleasure in daily activities and had a majority of specified depression symptoms.
Mental health treatment/counseling is defined as having received inpatient or outpatient care or having used prescription medication for problems with emotions, nerves, or mental health.
Nonmedical use of prescription-type psychotherapeutics includes the nonmedical use of pain relievers, tranquilizers, stimulants, or sedatives and does not include over-the-counter drugs.
Number of persons enrolled in substance use treatment refers to the number of clients in treatment at alcohol and drug abuse facilities (both public and private) throughout the 50 States, the District of Columbia, and other U.S. jurisdictions.
Serious mental illness (SMI) is defined by SAMHSA as adults aged 18 or older who currently or at any time in the past year have had a diagnosable mental, behavioral, or emotional disorder (excluding developmental and substance use disorders) of sufficient duration to meet diagnostic criteria specified within the 4th edition of the Diagnostic and Statistical Manual of Mental Disorders (DSM-IV) that has resulted in serious functional impairment, which substantially interferes with or limits one or more major life activities.
Treatment for depression is defined as seeing or talking to a medical doctor or other professional or using prescription medication for depression in the past year.
21
SOURCES
American Psychiatric Association. (1994). Diagnostic and statistical manual of mental disorders (DSM-IV) (4th ed.). Washington, DC: Author.
Center for Behavioral Health Statistics and Quality. (2010). National Survey of Substance Abuse Treatment Services (N-SSATS): 2009 data on substance abuse treatment facilities (HHS Publication No. SMA 10–4579, DASIS Series: S–54). Rockville, MD: Substance Abuse and Mental Health Services Administration, U.S. Department of Health and Human Services.
Center for Behavioral Health Statistics and Quality. (2011). National Survey of Substance Abuse Treatment Services (N-SSATS): 2010 data on substance abuse treatment facilities (HHS Publication No. SMA 11–4665, DASIS Series: S–59). Rockville, MD: Substance Abuse and Mental Health Services Administration, U.S. Department of Health and Human Services.
Center for Behavioral Health Statistics and Quality. (2012). National Survey of Substance Abuse Treatment Services (N-SSATS): 2011 data on substance abuse treatment facilities (HHS Publication No. SMA 12–4730, DASIS Series: S–64). Rockville, MD: Substance Abuse and Mental Health Services Administration, U.S. Department of Health and Human Services.
Center for Behavioral Health Statistics and Quality. (2013). National Survey of Substance Abuse Treatment Services (N-SSATS): 2012 data on substance abuse treatment facilities (HHS Publication No. SMA 14–4809, DASIS Series: S–66). Rockville, MD: Substance Abuse and Mental Health Services Administration, U.S. Department of Health and Human Services.
Center for Behavioral Health Statistics and Quality. (2014). National Survey of Substance Abuse Treatment Services (N-SSATS): 2013 data on substance abuse treatment facilities. Rockville, MD: Substance Abuse and Mental Health Services Administration, U.S. Department of Health and Human Services.
Center for Behavioral Health Statistics and Quality. (2011). Results from the 2010 National Survey on Drug Use and Health: Mental health findings (HHS Publication No. SMA 11–4667; NSDUH Series H–42). Rockville, MD: Substance Abuse and Mental Health Services Administration.
Center for Behavioral Health Statistics and Quality. (2012). Results from the 2011 National Survey on Drug Use and Health: Mental health findings (HHS Publication No. SMA 12–4725; NSDUH Series H–45). Rockville, MD: Substance Abuse and Mental Health Services Administration.
Center for Behavioral Health Statistics and Quality. (2013). Results from the 2012 National Survey on Drug Use and Health: Mental health findings (HHS Publication No. SMA 13–4805; NSDUH Series H–47). Rockville, MD: Substance Abuse and Mental Health Services Administration.
Center for Behavioral Health Statistics and Quality. (2014). Results from the 2013 National Survey on Drug Use and Health: Mental health findings (HHS Publication No. SMA 14–4887; NSDUH Series H–49). Rockville, MD: Substance Abuse and Mental Health Services Administration.
22
SOURCES
Center for Behavioral Health Statistics and Quality. (2011). Results from the 2010 National Survey on Drug Use and Health: Summary of national findings. (HHS Publication No. SMA 11–4658, NSDUH Series H–41). Rockville, MD: Substance Abuse and Mental Health Services Administration, U.S. Department of Health and Human Services.
Center for Behavioral Health Statistics and Quality. (2012). Results from the 2011 National Survey on Drug Use and Health: Summary of national findings (HHS Publication No. SMA 13–4713, NSDUH Series H–44). Rockville, MD: Substance Abuse and Mental Health Services Administration, U.S. Department of Health and Human Services.
Center for Behavioral Health Statistics and Quality. (2013). Results from the 2012 National Survey on Drug Use and Health: Summary of national findings (HHS Publication No. SMA 13–4795, NSDUH Series H–46). Rockville, MD: Substance Abuse and Mental Health Services Administration, U.S. Department of Health and Human Services.
Center for Behavioral Health Statistics and Quality. (2014). Results from the 2013 National Survey on Drug Use and Health: Summary of national findings (HHS Publication No. SMA 14–4863, NSDUH Series H–48). Rockville, MD: Substance Abuse and Mental Health Services Administration, U.S. Department of Health and Human Services.
Center for Mental Health Services. (2011). 2011 CMHS Uniform Reporting System Output Tables. Rockville, MD: Substance Abuse and Mental Health Services Administration, U.S. Department of Health and Human Services. Retrieved from http://www.samhsa.gov/dataoutcomes/urs/urs2011.aspx
Center for Mental Health Services. (2014). 2013 CMHS Uniform Reporting System Output Tables. Rockville, MD: Substance Abuse and Mental Health Services Administration, U.S. Department of Health and Human Services. Retrieved from http://www.samhsa.gov/dataoutcomes/urs/urs2013.aspx
Office of Applied Studies. (2010). Results from the 2009 National Survey on Drug Use and Health: Mental health findings. (HHS Publication No. SMA 10–4609; NSDUH Series H–39). Rockville, MD: Substance Abuse and Mental Health Services Administration.
Office of Applied Studies. (2010). Results from the 2009 National Survey on Drug Use and Health: Volume I. Summary of national findings. (HHS Publication No. SMA 104586Findings, NSDUH Series H–38A). Rockville, MD: Substance Abuse and Mental Health Services Administration, U.S. Department of Health and Human Services.
HHS Publication No. SMA–15–4895IN2015
U.S. Department of Health and Human ServicesSubstance Abuse and Mental Health Services Administration
Center for Behavioral Health Statistics and Qualitywww.samhsa.gov