behavioral opportunities for energy savings in office ... ·...
TRANSCRIPT

Imperial College London Faculty of Natural Sciences Centre for Environmental Policy
Behavioral opportunities for energy savings in office buildings: a London field experiment By Douglas Jesse Miller, Jr. September 2013 Submitted in partial fulfillment of the requirements for the MSc and/or the DIC. Academic supervision by Dr. Yuri Mishina, Imperial College Business School Administrative supervision by Dr. Clive Potter, Imperial College London Experimental work sponsored by Carbon Smart

Behavioral opportunities for energy savings in office buildings: a London field experiment
Douglas Miller | 2
Declaration of own work I declare that this thesis – Behavioral opportunities for energy savings in office buildings: a London field experiment – is entirely my own work and that where any material could be construed as the work of others, it is fully cited and referenced, and/or with appropriate acknowledgement given. Signature: Name of student: Douglas Jesse Miller, Jr. Name of supervisor: Dr. Yuri Mishina, Imperial College Business School

Behavioral opportunities for energy savings in office buildings: a London field experiment
Douglas Miller | 3
Authorization to hold electronic copy of MSc thesis Thesis title: Behavioral opportunities for energy savings in office buildings: a London field experiment Author: Douglas Jesse Miller, Jr. I hereby assign to Imperial College London, Centre of Environmental Policy the right to hold an electronic copy of the thesis identified above and any supplemental tables, illustrations, appendices or other information submitted therewith (the “thesis”) in all forms and media, effective when and if the thesis is accepted by the College. This authorization includes the right to adapt the presentation of the thesis abstract for use in conjunction with computer systems and programs, including reproduction or publication in machine-‐readable form and incorporation in electronic retrieval systems. Access to the thesis will be limited to ET MSc teaching staff and students and this can be extended to other College staff and students by permission of the ET MSc Course Directors/Examiners Board. Signed: Name printed: Douglas Jesse Miller, Jr. Date: 26 August 2013

Behavioral opportunities for energy savings in office buildings: a London field experiment
Douglas Miller | 4
If we examine a man alone, without his relation to everything around him, his every
action appears free to us. But if we see at least some relation to what is around him, if
we see his connection with anything whatever – with the man who is talking to him,
with the book he is reading, with the work he is doing, even with the air that surrounds
him, even with the light that falls on things around him – we see that each of these
conditions has an influence on him and guides at least one side of his activity.
-‐ Leo Tolstoy, War and Peace (1869)

Behavioral opportunities for energy savings in office buildings: a London field experiment
Douglas Miller | 5
Abstract Barring a transformational breakthrough in the near future in investment for and the use of non-‐fossil fuel energy sources, energy efficiency serves as a crucial strategy for major progress to be made in slowing the emission of greenhouse gases and lessening the scale of the impacts of climate change. Office buildings are a major and growing source of energy consumption and carbon dioxide (CO2) emissions. While there are vast opportunities to reduce energy consumption in office buildings through energy efficient technologies and materials, these opportunities possess financial costs, physical disruptions and other impacts that at present people may not be willing to bear. Behavior change, on the other hand, also has the potential to reduce energy consumption in office buildings yet possesses just a fraction of these costs and can be adopted without delay. In order to contribute to needs in the emerging field of research on the role of behavior change in office buildings to reduce energy use and related greenhouse gas emissions, a controlled field experiment including about 1,100 participants was conducted from July to August 2013 in five organizations across four office buildings in London, UK. The aim of the field experiment was to evaluate the effectiveness and ‘stickiness’ of behavior change interventions in private, public, and university office building settings that facilitate new expectations among employees – i.e. workplace norms – and therein modify the individual decision making context. The specific objective involved in the experiment was to increase the number of computer monitors turned off by employees during non-‐working hours. The change in behavior was therefore – in the literal sense – within an arm’s reach of employees: pressing the power button on monitors. The behavioral intervention sought to modify the choice context by creating new expectations and norms through invoking either public commitment or social comparison. Data was collected in the form of observational (proportion) data from on-‐site visits of the number of monitors left on/turned off during non-‐working hours and in the form of electricity meter readings. The results of the experiment suggest that the facilitation of new expectations and workplace norms among employees significantly increases the adoption of energy saving behavior in office buildings. To evaluate the observational data results, a quasi-‐binomial generalized linear model was used and demonstrated that the behavior change intervention led to a statistically significant increase in the monitors turned off during non-‐working hours. Public commitment and social comparison were equally effective in facilitating behavior change. Differences in the impacts of the intervention across private, public, and university buildings as well as within organizations were insignificant. To evaluate the electricity meter readings, a general linear model was used and as expected – due to the relatively small amount of electricity consumed by computer monitors – the behavioral intervention did not significantly affect overall building electricity use. Even so, the meter readings highlighted the significant role of energy efficient technologies and materials in reducing office building energy use during non-‐working hours. The experiment provides insights that potentially can be applied to other and larger sources of energy use in office buildings. With a minimal set of conditions being met, small interventions can compel dramatic increases in energy saving behaviors. Yet despite the expanding knowledge readily available for reducing energy use in office buildings such as was provided by this experiment, it appears that organizations are largely failing to adopt energy saving measures, suggesting that the adoption of available voluntary measures has reached a plateau. Recommendations are offered for policymakers to spur the adoption of energy saving strategies in office buildings and thereby better capture the low-‐hanging fruit of mitigation opportunities to reduce the scale and scope of impacts expected from climate change.

Behavioral opportunities for energy savings in office buildings: a London field experiment
Douglas Miller | 6
Acknowledgements This study was made possible through the combined and direct contribution of several individuals. As such, the author would like to extend a wholehearted thank-‐you to the following people: Dr. Yuri Mishina, Imperial College Business School Dr. Clive Potter, Imperial College London Jack Shepherd, Carbon Smart Dr. Tilly Collins, Imperial College London Kendra Kallevig-‐Childers, Royal Borough of Kensington and Chelsea Damian Hemmings, Merton Council Sara Muir, Imperial College London Nick Bright, Workspace/LeRoy House Michael Lomotey, Clothes Aid/LeRoy House Amit Jetwa, Arlington Estates/LeRoy House The author would also like to express utmost gratitude to his family and friends for their continued support, encouragement, and inspiration to treat life as a boundless journey.
Behavioral opportunities for energy savings in office buildings: a London field experiment
Douglas Miller | 7
Table of Contents Introduction
Energy use in office buildings……………………………………………………………………………………….9 Potential for energy savings through behavior change……………………………………………….11 Behavior change experiment and expected results…………………………………………………….12
Literature review Individual behavior and behavior change…………………………………………...........................14 Applying energy saving behaviors in an office setting………………………...........................17 Previous studies applying energy saving behaviors in an office setting…………….…………26 Research needs……………………………….................………………………………............................32
Methods The experiment……………………………….................………………………………............................34 Recruitment of participants………………………………...........................................................34 Initial meetings…..……………………………….................………………………………........................36 Observed potential energy savings and barriers assessment………………………………………37 Behavioral strategy design and implementation………………………………...........................38 Data collection……………………………….................……………………………….............................47 Data analysis……………………………….................………………………………................................49
Experimental results and discussion Recruitment process……………………………….................…………………………………..................51 Participants……………………………………………………………..........………………………………….........53 Behavior change: results and discussion……………...........................................................55 Electricity meter readings: results and discussion……………………....................................60 Experimental process: comments………………………………..................................................62 Limitations and opportunities for future research……....................................................63
Policy recommendations…..........................................……...........................................................67 Conclusions…..........................................……................................................................................72 References…..........................................…….................................................................................75 Appendix I: Figures from background research
Figure A: US primary energy consumption, by type.....…….............................................81 Figure B: Share of US primary energy consumption, by type………………………………..…….81 Figure C: Commercial buildings electricity consumption.....……....................……………….82 Figure D: Commercial buildings energy consumption, by end use…………………..………….82 Figure E: Commercial buildings energy consumption, by % share end use………………....83 Figure F: 2010 Commercial energy end-‐use expenditure splits………………………..…………83 Figure G: Commercial buildings energy expenditures, by % share end-‐use………………...84 Figure H: CO2 emissions from US commercial buildings energy consumption...............84 Figure I: Commercial buildings energy end-‐use CO2 emissions, by end use...................85

Behavioral opportunities for energy savings in office buildings: a London field experiment
Douglas Miller | 8
Figure J: Commercial buildings energy end-‐use CO2 emissions, by % share of total…….85 Figure K: Energy expenditures per square foot of office floor space……………………….….86 Figure L: Office buildings delivered energy end-‐use intensities, by building activity.…..86 Figure M: Energy-‐unaware behavior uses twice as much energy as the minimum that
can be achieved.……………………………………………………………………………………………………87 Figure N: Energy saving potential………….……………………………………………………………………87 Figure O: Potential behavioral energy savings and reduced emissions in residential and
services buildings……………………………….………………………………………………………………….88 Figure P: Uncertainties in annual site energy consumption by category…..…………………89 Figure Q: Range of practice in building operations for a medium-‐size office building...89 Figure R: Themes from literature review…………………..………………………………………………..90 Figure S: Possible heuristics, and design implications, extracted by workshop
participants………………………….………………………………………………………………………………..92 Figure T: Example of Opower social comparison letter………………........................……….93
Appendix II: Experimental results
Behavior change: output from quasi-‐binomial generalized linear model…….……………..94 Electricity meter readings: output from general linear model………….…………………………95 Electricity meter readings: RBKC and Merton Council data…………………………………………96
-‐-‐-‐ List of figures within the main text
Figure 1: The Reminder Prompt……………………………..…………………………………………………….41 Figure 2a-‐i: The initial Social Feedback Prompt…….………………………………………………………43 Figure 2a-‐ii: The ensuing Social Feedback Prompt..………………………………………………………43 Figure 2b: The Public Commitment Prompt.…………………………………………………………………44 Figure 2c: The Explanation Prompt………………………………….……………………..……………………44 Figure 3a: Appearance of workstation with Social Feedback Prompt and Reminder
Prompt…….……….……………………………………………………………………………………………………..45 Figure 3b: Appearance of workstation with Public Commitment Prompt, Reminder
Prompt, and Explanation Prompt…………………………………………………………………………….45 Figure 4: Participation among recruited organizations…………………….……………………………52 Figure 5: Recruitment summary…………………………………………………………………………………..52 Figure 6: Behavior change by experimental group (Visit 1 versus Visit 2)…………….……….56 Figure 7: Behavior change by building and experimental group (Visit 1 versus Visit 2)…57 Figure 8: Difference in electricity consumption between working and non-‐working
hours…………….……………………………………………………………….………………………………………..61 List of tables within the main text
Table 1: Possible heuristics and intervention design implications…………….……….………….40 Table 2: A detailed summary of the participants in the experiment……………………..………54 Table 3: Observational data results (Visit 1 versus Visit 2)………………..………………………….56

Behavioral opportunities for energy savings in office buildings: a London field experiment
Douglas Miller | 9
Introduction Energy use in office buildings According to the International Energy Agency’s (IEA) World Energy Outlook 2012, it
appears certain that fossil fuels will maintain their majority share of the world’s energy
production for at least the near future. From a global perspective it also is expected that
the overall consumption of fossil fuels – and related greenhouse gas emissions – will
continue to increase. Thus, barring a transformational breakthrough in investment for
and the use of renewable energy sources, energy efficiency serves as a crucial strategy
for major progress to be made in slowing the emission of greenhouse gases into the
atmosphere. Sweeping and concerted efforts are required across all sectors to find
opportunities – both great and small – to reduce greenhouse gas emissions in order to
alleviate the scale of the impacts of climate change.
Office buildings are a major and growing source of energy consumption as well as
carbon dioxide (CO2) emissions. The US Department of Energy’s (US DOE) Buildings
Energy Data Book (2012) offers an illustration of the general trends and breakdown of
commercial energy use and CO2 emissions1: US commercial buildings increased their
share of total US energy consumption from 13.5% in 1980 to 18.6% in 2010. Similarly,
US DOE (2012) shows that the rise in energy consumption by US commercial buildings
has been accompanied with an increase in CO2 emissions from 653 million metric tons in
1980 to 1,036 million metric tons in 2010. The report also indicates the major end-‐uses
for energy consumption in US commercial buildings, such as lighting (20%), space
heating (16%), space cooling (15%), ventilation (9%), refrigeration (7%), water heating
(4%), electronics (4%), computers (4%), and several others. The US DOE report Energy
Efficiency Trends in Residential and Commercial Buildings (2008) further elaborates upon
the trends in office buildings associated with energy use.
1 See Appendix I for various figures that were compiled using data from the US DOE’s Buildings Energy Data Book.

Behavioral opportunities for energy savings in office buildings: a London field experiment
Douglas Miller | 10
The office buildings sector “is the largest in the commercial sector in floor space and
energy use in most countries” and energy use within the office buildings sector is
dominated by heating, cooling, and lighting (Nguyen & Aiello, 2013: p. 247)2. Office
buildings “range from small, single story multi-‐occupied buildings to the skyscrapers that
form the skylines of all major cities” and “tend to be newer than other buildings” (World
Business Council for Sustainable Development, 2009: p. 40). Because the commercial
buildings sector and, more specifically, the office buildings sector hold a significant share
of overall energy consumption both in the US and around the globe, a large source of
opportunities is available to reduce global energy consumption and CO2 emissions.
Numerous studies have been conducted assessing the potential for energy savings
through investments in energy efficient technologies. For example, Farrell and Remes
(2008) identify financially attractive and cost-‐effective energy efficiency investments – in
appliances, lighting, heating/cooling, and water heating – that capture a 13.8 quadrillion
British Thermal Unit (BTU) commercial building end-‐use opportunity across the
developed and developing world. However, while technological opportunities are vast,
they are not directly investigated further in this paper. Instead, the paper will focus on
the potential for energy savings in office buildings through changes in individual
behavior. The reason for this is that measures involving behavior change, unlike
technological improvements, can reduce energy use and greenhouse gas emissions
immediately and without significant financial costs. Even though the investments in new
technologies and materials will be recouped over time – often within a couple years –
through cost savings, these investments are made much less frequently than would be
expected due to the discounting of future benefits so prevalent in a setting where short-‐
term thinking leads to the tendency “to emphasize the initial cost rather than life cycle
costs” (World Business Council for Sustainable Development, 2009: p. 42). Many
companies now require “a one-‐and-‐a-‐half-‐ to two-‐and-‐a-‐half-‐year payback” (Creyts et
al, 2010: p. 6). Similarly, the payback periods associated with the upfront costs can take
2 Two figures from Nguyen & Aiello (2013) are provided in Appendix I to show the impact of behavior on the energy consumption of buildings and the energy saving potential associated with heating/cooling, lighting, and plug loads.

Behavioral opportunities for energy savings in office buildings: a London field experiment
Douglas Miller | 11
longer than an organization may plan to or be certain it will stay in a given office.
Moreover, organizations often choose to make investments for purposes other than
cost reductions. If an organization does invest in cost reduction measures it may choose
to lower costs other than those related to energy, since energy can be perceived as an
‘invisible’ cost and is often not a substantial cost for an organization to bear in relation
to other costs, like salaries. Organizations may also hesitate to invest in new
technologies due to the physical disruption, hassle, and general inconveniences
associated with these projects. Time “is a resource that needs to be available in order to
allow employees to take action” (Pellegrini-‐Masini & Leishman, 2011: p. 5412). Finally, it
can also be the case that a company may not be in a position to make decisions about
these types of investments, as is often the case in commercial buildings with multiple
tenants.
Azar & Menassa (2012) point to the long-‐term impact of targeting the operations phase
of commercial buildings: generally more than 80 percent of a commercial building’s
total energy consumption over its lifespan occurs during its operation phase, versus its
materials and construction. Colmenar-‐Santos et al. (2013) also indicate that most of the
energy consumed and CO2 emitted by commercial buildings takes place during their
lifetime operations. And energy use in the operations phase of a building will be
affected by user behavior: for example, Pfafferott & Herkel (2007) find that variations in
room temperature – and thus related energy use – “result mostly from variations in use
of the offices” (p. 678). Hence because occupants play a central role in the way energy is
consumed and the amount of energy consumed over the lifetime operations of a
building, behavior change should be seen as a core strategy for reducing energy use and
related CO2 emissions.
Potential for energy savings through behavior change While there are vast opportunities to reduce energy consumption in office buildings
through energy efficient technologies and materials, these opportunities possess
financial costs, physical disruptions and other impacts that at present people may not be

Behavioral opportunities for energy savings in office buildings: a London field experiment
Douglas Miller | 12
willing to bear. Behavior change, on the other hand, also has the potential to reduce
energy consumption yet possesses just a fraction of the costs of technological change.
Moreover, there is an emerging interest in this topic, as suggested by the creation of the
UK Government’s Behavioural Insights Team and new behavior change services by
environmentally focused consultancies. Dietz et al. (2009) offer evidence that behavior
change measures can on their own lead to substantial reductions in energy use and
related CO2 emissions. Nguyen & Aiello (2013) suggest that careless energy consumption
in office buildings “can add one-‐third to a building’s designed energy performance,
while conservation behavior can save [an additional] third” (p. 245). Hence, energy
unaware behavior “uses twice as much energy as the minimum that can be achieved”
(Nguyen & Aiello, 2013: p. 246).
Behavior change must be at the center of the overall strategy to reduce energy use and
greenhouse gas emissions associated with office buildings. Behavioral interventions may
also have a positive spillover effect related to energy efficient technologies: the
behavior of individuals “can strengthen or undermine the effectiveness of technical
measures which have been implemented with energy conservation and efficiency
considerations in mind” (Lo et al, 2012-‐a: p. 227-‐228). The World Business Council for
Sustainable Development (2009) endorses the need for behavior change – through
workforce engagement, energy saving skills training, and an energy aware culture –
within a set of mutually reinforcing strategies to reduce building energy consumption.
Behavior change experiment and expected results Research on the role of behavior change in office buildings to reduce energy use and
related greenhouse gas emissions is in its infancy. In order to address research needs
and contribute to the wider literature on this subject, a controlled field experiment
involving about 1,100 participants was conducted from July to August 2013 in five
organizations across four office buildings in London, United Kingdom. The aim of the
field experiment was to evaluate the effectiveness and ‘stickiness’ of behavior change
interventions in private, public, and university office building settings that facilitate new

Behavioral opportunities for energy savings in office buildings: a London field experiment
Douglas Miller | 13
expectations among employees – i.e. workplace norms – and therein modify the
individual decision making context.
The specific objective of the behavior change intervention was to increase the number
of computer monitors turned off overnight, during non-‐working hours. The experiment
therein targeted a change in behavior that is – in the literal sense – within an arm’s
reach of employees: pressing the power button on monitors. In addition to showing
employees how to achieve the desired behavior, the behavioral interventions sought to
modify the choice context by creating new expectations through invoking either public
commitment or social comparison. Data was collected in the form of observational
(proportion) data from on-‐site visits of the number of monitors left on/turned off during
non-‐working hours and in the form of electricity meter readings.
Based on the review of existing literature that is presented in the following section,
there were several expected results from the experiment: It was expected that the
behavioral intervention would compel a significant increase in the number of computer
monitors being turned off during non-‐working hours and thus a significant change in
behavior. Moreover, it was expected that behavioral change would endure over time
(‘stick’) because they engaged staff by modifying the choice context through social
mechanisms. However, because the targeted behavior change involved computer
monitors – a relatively low source of energy use in office buildings – it was expected
that there would not be significant reductions in overall energy use, related greenhouse
gas emissions, or to the operating costs of participating office buildings.
Rather, the insights from this experiment were therein expected to demonstrate the
critical role of modifying the office building choice context through new workplace
norms in facilitating energy-‐saving behavior that endures over time. Such insights could
then be more broadly incorporated into behavior change strategies addressing other,
more energy-‐intensive practices and devices in office buildings.

Behavioral opportunities for energy savings in office buildings: a London field experiment
Douglas Miller | 14
Literature review This section offers an extensive yet concise review of current behavior change literature
in order to provide a framework for the behavior change experiment presented in this
paper3. There are several reasons why conducting a review of relevant literature is
useful for the purpose of the present research: It informs the expectations of the
potential office energy savings that can be achieved through behavior change, the
strategies that are developed to facilitate energy saving behaviors, and the
interpretation of the findings from the experiment. At the conclusion of this section, the
current gaps in behavior change literature relating to office settings are presented.
Individual behavior and behavior change Behavior change measures will only succeed if they revolve around the realities of
individual human cognition and why people behave as they do. Kahneman (2011)
suggests that human decision-‐making is characterized by two processes: System 1 and
System 2. He argues that most human cognition and resulting behavior is primarily
guided by System 1 processes, or those that “are fast, automatic, effortless, associative,
and often emotionally charged; they are also governed by habit, and are therefore
difficult to control or modify” (p. 232). Moreover, System 1 processes largely operate in
an unconscious manner, occur in response to cues in the surrounding environment, are
context-‐dependent, and follow a set of heuristics (or rules of thumb). System 2
processes, however, are effortful, slower, deliberative, and flexible. System 2 processes
are avoided if possible because they invoke greater cognitive effort and individuals “are
not accustomed to thinking hard, and are often content to trust a plausible judgment
that quickly comes to mind” (Kahneman, 2011: p. 231). Simply consider the difficulty in
changing one’s own morning routine – even slightly – versus just doing the same old
thing again today.
3 A summary of the key themes and takeaways from the literature review is provided in Appendix I.

Behavioral opportunities for energy savings in office buildings: a London field experiment
Douglas Miller | 15
Kahneman (2011) demonstrates through extensive empirical analyses the central role of
System 1 processes in individual decision-‐making and resulting behavior. In sum, people
prefer to operate in auto-‐pilot mode. Hence the difficulty of behavior change and the
resistance people show towards it: any behavior change measure requires effort,
deliberation, and time. Nevertheless, the distinction between System 1 and 2 offers a
roadmap for behavior change. Because most decisions are shaped by System 1
processes, behavior change measures should go along with these processes rather than
clash with them. Dolan et al. (2009) provide an arsenal of tools – as summarized in their
mnemonic MINDSPACE (Messenger, Incentives, Norms, Defaults, Salience, Priming,
Affect, Commitment, Ego) – that is based on System 1 cognition and can be used to
better facilitate behavior change. When applying these tools, Johnson et al. (2012)
argue that it is important to distinguish between “those used in structuring the choice
task and those used in describing the choice options” (p. 487). By designing behavioral
measures that appropriately integrate the characteristics of System 1 processes, change
becomes easier and more likely to become part of an individual’s auto-‐pilot mode.
Darnton (2008) evaluates over sixty models of behavior and theories of behavior change
in a comprehensive review of potential strategies for behavior change relating to
environmental matters. Although no single model is perfect, each contributes to a
broader understanding of what it takes to bring about new (desirable) behavior.
Intervention mapping (IM) offers a process through which current needs toward
achieving a desired change are found, target behaviors for change are identified, a plan
of action is developed, and continuous evaluation is conducted to continue progress
towards achieving the objective(s) of the intervention. Kok et al. (2011) argue that
applying existing systematic approaches like Intervention Mapping to energy related
behavior change will more effectively address the “personal, social, and economic
barriers to performing desirable behaviors” and yield behavior change (p. 5281). In line
with this argument, according to Steg & Vlek (2009) it is important to account for the
factors that promote or inhibit pro-‐environmental behavior because the “effectiveness
of behavioral interventions generally increases when they are aimed at important

Behavioral opportunities for energy savings in office buildings: a London field experiment
Douglas Miller | 16
antecedents of the relevant behavior and at removing barriers for change” (p. 311).
Chatterton & Wilson (2012) argue that interventions “need to be targeted in different
ways for different groups” of people (p. 6). Intervention Mapping begins with a needs
assessment, then moves on to identifying program objectives, methods and
applications, program development, planning for program implementation, and
planning for evaluation. Through this process, Kok et al. (2011) suggest that lasting
behavior change will occur when there are (1) strong positive intentions, following from
advantages outweighing disadvantages of the change, perceived social norms and
support, consistency of behavior with self-‐image/self-‐evaluation, positive emotional
reaction, and perceived capability/self-‐efficacy, (2) no environmental constraints, and
(3) employees possess the necessary skills to enact the change (p. 5282). Kok et al.
(2011) also cite the importance of there being “general organizational determinants
(e.g. general trust in management), proenvironmental policies, proenvironmental
management, and physical facilitation of proenvironmental behavior (e.g. placing easily
accessible recycling bins)” (p. 5283).
Darnton (2008) presents a similar but less complex approach in the form of the UK’s
Department for Environment, Food and Rural Affairs’ (Defra) 4Es (Enable, Encourage,
Engage and Exemplify) model. The 4Es model is one of the more useful frameworks
because it encapsulates many of the insights that can be useful in facilitating changes in
individual behavior and goes with the grain of how individuals behave and make
decisions. Moreover, the 4Es model shows how intervention mapping can be better
applied in cultivating behavior change by combining a mix of behavioral tools:
1. Enable: remove barriers, give information, provide facilities, provide variable
alternatives, educate/train/provide skills, provide capacity 2. Encourage: tax system, expenditure-‐grants, reward scheme, recognition/social
pressure (league tables), penalties/fines/enforcement action 3. Engage: community action, co-‐production, deliberation, personal
contacts/enthusiasts, media campaigns/opinion formers, use networks 4. Exemplify: leading by example, achieving consistency in policies

Behavioral opportunities for energy savings in office buildings: a London field experiment
Douglas Miller | 17
Darnton (2008) also suggests that expanding the boundaries of the 4Es model to include
the wider context of culture change enhances the impact of behavioral strategies. The
Cultural Capital Framework is presented to highlight the links between individual
behavior, behavioral norms, cultural capital (which includes the attitudes, values and
aspirations shaped by the society, community, organization(s), and people with whom
individuals affiliate), behavioral intentions, behavioral drivers (the 4Es model), and
behavioral paths. Darnton (2008) therein puts considerable weight behind non-‐
prescriptive, adaptive strategies in bringing about behavior change. He suggests the
importance of developing solutions based on local contexts, adopting participative
methods, establishing directions of change (and providing related resources) rather than
externally determined targets, ensuring that strategies adapt over time through learning
and innovation, and viewing failure as “an opportunity to build understanding” (p. 63).
Therefore, it appears that proactive, inclusive, flexible, and contextual methods may be
more effective in bringing about long-‐term changes in behavior in comparison to top-‐
down, external, prescriptive, and predictive methods.
Applying energy saving behaviors in an office setting The core questions raised in this study revolve around the opportunities for energy
savings through changes in repeated behaviors among office building occupants. The
focus is hence on energy use related habits, or the routine behaviors driven by System 1
(automatic, sub-‐conscious, quick) cognition that contribute to wasted energy
consumption. The aim of the present study is therein to gain a better understanding of
the potential for energy savings in office buildings through behavioral improvements, or
the software of buildings. This stands in contrast to other research on energy savings in
office buildings through technological improvements, or the hardware of buildings.
Energy saving behavior change measures will be more likely to succeed if they work with
System 1 cognition rather than against it: successful interventions “must change the
environmental cues that sustain habits” (Kok et al, 2011: p: 5283). Behavioral
interventions utilizing research from fields like behavioral economics that place the

Behavioral opportunities for energy savings in office buildings: a London field experiment
Douglas Miller | 18
realities of human behavior at their core will be better equipped to bring about change.
For example, Shogren (2012) offers a summary of lessons – spanning topics such as
‘rationality’, risk perception, framing, cooperation, fairness, trust, goal setting,
discounting, and stakeholder engagement – that can be applied in to better align pro-‐
environmental behaviors with the primary drivers of human decision making and
resulting behaviors.
The formation of new, energy saving habits will indicate whether interventions have
been effectively applied and will endure after an intervention is implemented. Yet
therein rests the challenge: how can a new set of energy saving habits become ingrained
in employees throughout an organization? Generally speaking, habits refer to the
manner by which behavioral choices are made and “are reconsidered only when the
context changes significantly” (Steg & Vlek, 2009: p. 312). In addition to creating a
remarkably modified decision making context, there must be both a goal and
satisfactory outcome associated with the new behavior. The habitual behavior must
become learned, stored in memory, and retrieved in instances when individuals
confront the new decision making context. The new context will therein trigger the
energy saving and, by this point, automated behavior. As long as that particular context
remains intact, the energy saving habits will be cultivated while wasteful behaviors are
inhibited. Bicchieri (2006) and Goldstein et al. (2008) demonstrate the particular
importance of norms in the context of individual behaviors and the extent to which
many behaviors are entirely contingent upon the beliefs individuals have of what other
people do and what they think others expect of them. Similarly, Miller (2012) points to
the presence of norms that inhibit the adoption of pro-‐environmental behaviors.
In developing strategies to reduce office energy use through changes in employee
behavior, it is valuable to delve into prior research investigating how to bring about
lasting change in employee behavior. Unfortunately, Lo et al. (2012-‐a) suggest that “the
research on household energy conservation and other proenvironmental behaviors
cannot be easily generalized to organizational contexts” like offices (p. 2934). Focus

Behavioral opportunities for energy savings in office buildings: a London field experiment
Douglas Miller | 19
must be placed on energy saving behaviors in an office setting directly because the
personal motivations for energy consumption and energy savings vary in comparison to
a household setting. The existence of split incentives – whereby organizations reap the
financial benefits of changes in behavior enacted by employees – therein presents a
potential barrier to behavior change. Those engaged in behavior change likely perceive
the process as providing only costs and no tangible benefits. Nesse et al. (2011) further
this point by stating that individual motivation to reduce energy use in office buildings
“is perhaps the most complex, requiring engagement in not only information, but
translation of abstract data into meaningful information for people to use, and tools to
help them make a positive impact” (p. 1). Despite the fact that “occupant behavior is a
major determinant of energy use in buildings, energy savings potential due to behavior
are usually neglected, albeit being referred to as significant as those from technological
solutions” (Lopes et al, 2012: p. 4096). Moreover, focusing on energy efficient
technologies alone without behavior change will likely fail in reducing overall energy
use: Loveday et al. (2008) argue in their analysis of households that even though homes
and products have become more energy efficient since 1970, the “increasing numbers
of products and the advanced technological innovation they contain have brought a
sharp rise in domestic energy consumption” (p. 4641). It seems fair to presume a similar
trend in office buildings, thus suggesting the crucial role of behavior change in reducing
overall energy consumption in office buildings. Yet the central challenge remains over
what it takes to spur behavior change measures, especially given the research of
Kunreuther & Weber (2012) which discusses the difficulty for people to perceive the risk
of climate change and therein delay available mitigation strategies into the indefinite
future. Semenza et al. (2011) found that people will engage in mitigation strategies – in
this case, reduce energy use – if they believed their way of life or actual life to be at risk
and if they believed themselves to be incapable to adapt to the impacts of climate
change.
There is emerging literature that directly addresses the ability of organizations to instill
lasting energy saving behavior. Carrico & Riemer (2011) cite behavior change “as one of

Behavioral opportunities for energy savings in office buildings: a London field experiment
Douglas Miller | 20
the more immediate and cost-‐effective options available for meeting near-‐term targets
while more systematic changes can be implemented” (p. 1). The 2012 Accenture report
Sustainable Energy for All argues that energy efficiency offers a major cost reduction
measure and form of employee engagement. In comparing this cost savings measure to
others, behavior change is an attractive strategy since it “does not require high
technological knowledge and can be used in both new and existing buildings” (Nisiforou
et al, 2012: p. 300). And organizations are interested: Pellegrini-‐Masini & Leishman
(2011) found that organizations “appeared keen to improve their energy management
through the optimization of use of installed technology, new low cost and low
disruption technology (efficient lighting, motion sensors, energy efficient office
equipment) and behavior change” (p. 5415). Moreover, the fact that employees “are a
‘captive’ audience that can be more easily targeted [than households] through low-‐cost
means such as motivational appeals delivered through e-‐mail or newsletters” and that
energy use “is more easily observed by one’s peers in the workplace” suggests there are
at least some factors which favor energy saving behavior in offices in relation to homes,
where some behavioral strategies have already been shown to work.
Nevertheless, there are numerous reasons why organizations are adopting behavioral
measures to a far lesser extent than might be expected. Allcott & Mullainathan (2010-‐a)
argue that there must in fact be an assortment of (non-‐financial) barriers preventing the
adoption of the non-‐price-‐based behavioral interventions that potentially could save
billions of dollars in costs if scaled across economies. Attari et al. (2011) show that
failure to implement behavior change measures that reduce energy consumption is not
unique to office buildings but rather can also be observed in households, a setting
where people have an even greater (financial) incentive to adopt such measures. Shove
(2010) points to the blind spots created by as well as the need to move beyond the ABC
– attitude, behavior, and choice – model in the definition(s) of the problem at hand.
Keenan et al. (2012) emphasize two major issues in any change initiative: change fatigue
and resistance to change.

Behavioral opportunities for energy savings in office buildings: a London field experiment
Douglas Miller | 21
Organizations that successfully implement change offer clearly defined and achievable
goals, methods for measuring progress, commitment from those in positions of
leadership, employee engagement, as well as two-‐way, consistent and constant
communication. Keenan et al. (2012) stress the importance of working with both early
adopters of change among employees as well as skeptics. Furthermore, they suggest
that less tangible factors must be communicated – such as self-‐worth and job
satisfaction – that help gain emotional buy-‐in from employees.
Bonini & Görner (2011) argue that despite the potential value offered by sustainable
organizational practices such as energy reduction measures, most organizations do not
actively pursue these strategies and therefore miss an opportunity to reduce costs while
also addressing climate change. Bonini (2011) supports this argument in a set of survey
findings that only one-‐quarter of executives believe sustainable operations are
embedded across their organization. Similarly, the 2013 Deloitte report Culture of
purpose presents a further word of caution for organizational change efforts: in its core
beliefs and culture survey it was found that while employee development programs
serve as a major way to build a culture of purpose – to address issues such as energy use
– the gap between employer and employee beliefs on the integration of these programs
in the workplace is larger than for any other issue. Peloza et al. (2012) point out another
perceptual gap worth considering: organizations are often believed to perform better in
sustainability metrics like energy consumption than their real performance, presenting
both a risk to organizations in terms of their performance, reputation, as well as to the
environment should the failures continue. Pellegrini-‐Masini & Leishman (2011)
recommend that policymakers “magnify the reputational significance of energy
efficiency” (p. 5418).
Bonini (2011) points out that while reducing energy use serves as one of the largest
value creators of any sustainability-‐related measure, these efforts may be hampered
due to an assortment of barriers such as there being a lack of incentives tied to reducing
energy consumption. Metz et al. (2007) suggest that other barriers to behavior change

Behavioral opportunities for energy savings in office buildings: a London field experiment
Douglas Miller | 22
include the tendency to ignore small energy savings opportunities, organizational
failures (such as split/dual incentives), lack of awareness, culture, and tradition.
Furthermore energy use is not a salient issue for employees since they generally neither
observe energy use measurements nor receive feedback on their own changes in energy
consumption over time. There is hence a resulting gap between intentions to reduce
energy use and the actual adoption of energy saving actions.
There are various aspects of the office environment that further complicate the
development of successful behavior change strategies. Nisiforou et al. (2012) found
through a questionnaire that while employees are willing to engage in energy saving
measures, they “are not willing to sacrifice their own personal satisfaction for these
measures” (p. 299). They also suggest that individual behavior in office buildings is
multifaceted due to the differing roles, schedules, social interactions, personal context,
and other variables found in this setting. Moreover, Loveday et al. (2008) stress the
impact on continual rises in energy consumption due to the non-‐stop, always ‘on’
societal contexts within which people now live and work.
To foster strategies that successfully bring about enduring energy saving behavior, it
seems that new and creative approaches are required because organizations continue
to miss opportunities to reduce energy consumption and related greenhouse gas
emissions. Prior attempts to compel energy savings have, to be blunt, largely failed:
mission statements by organizations to reduce energy use are not put into action,
intentions float up in the clouds, and energy saving measures continue to remain near
the bottom of the to-‐do list. There is therefore a dire need for new narratives, forms of
engagement, leadership and excitement over energy conservation in order to take the
steps available right now to help mitigate the effects of climate change.
Instead of continuing to develop new theories or implement strategies from an external
perspective, a more effective route to bringing about behavior change may be to
identify those pieces of the office energy savings puzzle which best fit together in terms

Behavioral opportunities for energy savings in office buildings: a London field experiment
Douglas Miller | 23
of the organization and people involved by directly working with them. The pieces can
then be moved around depending on what seems to work best. Nesse et al. (2011)
recommends the use of the broad framework offered by the Fogg Behavior Model
(FGM) as a starting point in putting together this puzzle due to its identification of (1)
motivation (high or low), (2) ability (easy or difficult), and (3) trigger (a reminder or
prompt) in approaching behavior change. Building on this, Robinson (2012) argues that
if “there’s a positive buzz AND we offer hope AND an enabling environment AND a sticky
solution AND expanded comfort zones AND the right invite THEN people will do things
they have never done before and sustain those changes” (p. 239).
There is growing support for new kinds of approaches to addressing environmental
issues like those relating to energy consumption. But as is argued by Johnson (2013),
these new approaches need not start from scratch: the environmental field should learn
from the failures and successes of public health campaigns. Johnson (2013) stresses the
need to provide people with practical tools rather than more information, inspire
people, understand that changes take place over time, and keep in mind that behavior is
driven by context rather than attitude (unlike what is commonly believed). If the aim is
to change behavior, it must therefore be pursued “primarily through modifying the
environment in which people make their choices” (Robinson, 2013). This is because
many “contextual factors may facilitate or constrain environmental behavior and
influence individual motivations” (Steg & Vlek, 2009: p. 312). Hence there is “a need to
take account of the physical, social, cultural and institutional contexts that shape and
constrain people’s choices” (Owens & Driffill, 2008: p. 4412) since “behaviors are
influenced by their context” (Carrico & Riemer, 2011: p. 2). The findings from Lo et al.
(2012-‐a) align with these arguments and compel recommendations for interventions
within organizations that focus on physical facilitation of pro-‐environmental behavior,
environmental leadership by superiors within an organization, tailored persuasive
communication, and active engagement of employees. The “core elements required in
a successful intervention include information about how to change behavior, feedback,
and a supportive social environment” (Carrico & Riemer, 2011: p. 2).

Behavioral opportunities for energy savings in office buildings: a London field experiment
Douglas Miller | 24
Moreover, Johnson (2013) emphasizes the importance of engaging the people who in
fact will be the ones to ‘change’, since direct involvement in the change process will
ensure that people feel empowered during the change process and that the changes will
lead to a brighter future for them. Energy saving behaviors must become aligned with
the values and priorities of those who are being targeted to change. More generally, it is
necessary to move away from one-‐size-‐fits-‐all approaches – as the can make a situation
worse – and instead focus on developing solutions that fit for the people and
organizations involved. And fit involves taking into account the multiple factors that
shape the context in which people make decisions. An enabling context is therefore of
utmost importance because information on its own does not mean individuals will
change their behavior, as Barlow & Fiala (2007) show that 91 percent of employees are
already aware of ways to save energy. Furthermore, if engagement instills in employees
a sense of psychological ownership and feelings of possession, then according to van
Dyne and Pierce (2004) employees will be more likely to demonstrate “feelings of
responsibility that lead to investing time and energy to benefit the organization” (p.
445). This is especially true of informal, non-‐prescribed behavior such as how people
consume energy at the workplace. But psychological ownership can also work against
behavior change, as people may not want to be told how to manage what is ‘theirs’.
Guarraia et al. (2012) provide four key measures shown to ensure cost reduction
transformations that are sustained over time and ensure a new culture is formed “in
which keeping costs low is the primary objective:” (1) set targets based on external,
market-‐based data rather than internal benchmarks; (2) establish tailor-‐made cost
saving measures that ‘fit’ for the organization; (3) use appropriate and relevant metrics;
and (4) address waste at the ‘seams’ of the organizations that operate in the space
between different departments (p. 2). Owens & Driffill (2008) also point to the key
interaction between technical infrastructures and social norms in the stickiness of
behavior over time. Moreover, Guarraia et al. (2012) stress the importance of winning
over frontline managers and employees as well as addressing employees’ anxieties over
change. Davis-‐Peccoud et al. (2013) echo this last point by saying that those successfully

Behavioral opportunities for energy savings in office buildings: a London field experiment
Douglas Miller | 25
instilling pro-‐environmental measures organization-‐wide “hold employees accountable
for sustainable practices in their jobs” and “equip employees with tools and training in
order to raise the bar for further improvements” (p. 5). Providing employees with
proper tools and training thus provides a backbone upon which organizational energy
saving goals can be realized. It is also important for energy use to be salient: Zografakis
et al. (2012) show that exposure to factors increasing the salience of energy-‐related
issues influences a greater willingness on the part of managers to reduce energy use (in
this case, through more efficient lighting technologies and related practices).
Bouton et al. (2010) suggest that failing to engage employees in reducing office energy
use is one of the primary forms of energy waste in offices and that behavioral barriers
are one of the three barriers inhibiting energy savings in this setting. Hatherall et al.
(2012) argue that “a strong sense of purpose, ample autonomy, opportunity for growth
and a sense of affiliation” are critical aspects of achieving engagement in the workplace.
It is recommended by Bouton et al. (2010) that organizations should take a visible
leadership role in addressing energy consumption and demonstrate to employees how
to reduce energy use (through measures such as providing ‘coaches’). The coaching, or
feedback, process “is as much about reinforcing what employees should do and are
doing right as it is about correcting what they did wrong” (Hatherall et al, 2012).
Through an empirical study of 252 line managers at a large and diverse company,
Conger et al. (2000) provides insights for what it takes to establish the charismatic and
effective leadership which helps facilitate change: individuals will follow the guidance of
a leader when they attribute reverence, trustworthiness, satisfaction towards the
leader; when the leader is able to build a collective identity and establish a broader
mission for which everyone in the group works together towards; and when a leader
makes individuals feel empowered. The combination of a shared purpose, coaching, and
revered, trusted leadership therein appears critical for the adoption of the desired
changes.

Behavioral opportunities for energy savings in office buildings: a London field experiment
Douglas Miller | 26
Previous studies applying energy saving behaviors in an office setting A handful of studies have assessed the role of occupant behaviors in the energy
consumed and CO2 emissions released by office buildings. Pro-‐environmental behavior
change in office settings is an area of limited research but increasing interest. These
studies tend to show that behavior change strategies can achieve noteworthy energy
savings. The findings from Roetzel & Tsangrassoulis (2012) indicate that significant
variations in CO2 emissions result from the behavior of occupants in office buildings.
Their research shows that a “major mitigation potential regarding energy consumption
and greenhouse gas emissions is related to occupant behavior” (Roetzel &
Tsangrassoulis, 2012: p. 349). In related terms, Schweiker & Shukuya (2010) found in
their analysis of four scenarios with varying building envelopes and occupant behaviors
that the “influence of occupant behavior was highly significant,” especially in situations
when indoor and outdoor temperatures are similar (p. 2976). In fact, the UK
government successfully reduced its energy use by more than ten percent through
behavioral measures such as changing defaults and social norms, and is now calling on
others to follow its lead (Cabinet Office, 2011). Furthermore, Wang et al. (2012)
investigate the uncertainties associated with annual energy consumption due to
weather and building operational practices in medium-‐size office buildings across four
regions in the US. They found that energy consumption at each site can be drastically
affected by building operations and thus that building operations inflict a high level of
uncertainty on expected annual energy use. In fact, the level of uncertainty associated
with the use of a building’s HVAC system (-‐15.8 to 70.3 percent), plug load (-‐11.3 to 7.0
percent), and lighting (-‐5.8 to 9.0 percent) – each of which are affected by employee
behavior – was greater than that which was due to weather (-‐4.0 to 6.1 percent) (Wang
et al, 2012: p. 157)4.
Behavior change measures are potentially a cost-‐effective approach for reducing energy
consumption. Carrico & Riemer (2011) show that “significant and substantial reductions 4 See Appendix I for two figures from Wang et al. (2012) on the uncertainties in energy consumption in buildings due to building operations as well as a summary of the range from worst to best practices in building operations.

Behavioral opportunities for energy savings in office buildings: a London field experiment
Douglas Miller | 27
in energy use can be achieved almost immediately with currently available technology
and little upfront cost” in their experiment assessing the impact of two behavioral
interventions on energy use: monthly group-‐level feedback via email and peer educators
that essentially served as energy ‘coaches’ (p. 11). The group-‐level feedback led to 7
percent energy savings, peer education led to 4 percent energy savings, and this took
place while there was 4 percent increase in energy use for the control group. Carrico &
Riemer (2011) also found that the peer education intervention saved $15 per every
dollar spent and that the feedback intervention saved about $32 per dollar spent (or
$12 and just over $5 per ton of CO2 saved, respectively).
According to their review of behavior change literature, although limited research has
been conducted on potential energy savings in offices through behavior change, Lopes
et al. (2012) cite studies on behavior change5 in commercial buildings from the US in
which energy use was lowered by 18 to 35 percent and from South Africa/Botswana in
which there were 56 percent reductions in electricity consumption. They also found
energy reductions through behavior change in residential settings to typically be
between 5 and 20 percent. The potential energy savings in developing nations are likely
to be much greater.
While the energy savings from behavior change strategies are noteworthy, the scale of
energy savings will likely be less than what is possible through technological
improvements. Furthermore, strategies based on information or awareness have no
impact on energy use and lead to wasted time, money, and effort. Metzger et al. (2011)
compared technological and behavioral strategies in reducing the energy use from plug
loads (any device plugged into wall outlets) in a four-‐week experiment conducted at the
US EPA’s LEED Gold certified building in Denver. Colorado. It was found that the
automatic, technological control system that turned off plug load devices after 15
minutes of no occupancy in a pod (a cluster of cubicles of six to eight people) reduced
energy use by 21 percent from the baseline, competition between pods led to a six
5 See Appendix I for the summary of research on potential behavioral energy savings shown in Lopes et al. (2012).

Behavioral opportunities for energy savings in office buildings: a London field experiment
Douglas Miller | 28
percent reduction from the baseline, and that letters providing information about
energy use and how to reduce energy use resulted in no change. The annual cost
savings in the building would be $3,476 for the control system, $991 for pod
competition, and -‐$41 for the informational letters. Moreover, in an exit survey Metzger
et al. (2011) found that none of the respondents found the experiment disruptive.
Opportunities for energy savings through behavior change will vary based on climate
and the building size. Azar & Menassa (2012) conducted a sensitivity analysis in which
thirty energy models were created to encapsulate three building size categories and ten
different US weather conditions in relation to changes in nine different occupancy
behavioral parameters. Some of the main conclusions were that occupancy behaviors
significantly influence overall building energy use and that the influence of different
occupancy behaviors depends upon building size and weather conditions. Moreover,
Azar & Menassa (2012) found that “a significant portion of energy use in small buildings
is typically attributed for the HVAC systems, as opposed to large buildings that spend
higher portions of energy use on equipment and lighting” (p. 849). Thus it appears that
behavior change measures should primarily target heating/cooling for small buildings
and lighting/electronic device use in larger buildings for the greatest energy savings.
Moderate changes will be more likely to stick and receive less resistance in comparison
to drastic changes. With the aim of reducing the energy consumed by heating/cooling,
Brown et al. (2012) show the role of small changes in temperature default settings in a
randomized controlled experiment: while they found a 1°C decrease in the default office
building temperature setting over a six-‐week experiment during the winter heating
season resulted in a average reduction in the chosen setting by 0.38°C, it was also
discovered that “small decreases in the default (1°) led to a greater reduction in chosen
settings than large decreases (2°)” (p. 2). People would manually modify the office
temperature if the change in temperature was large, but left the new default
temperature intact if the change was small. Additionally, Brown et al. (2012) indicate in
their analysis of the experimental findings that 65 percent of the effect could be

Behavioral opportunities for energy savings in office buildings: a London field experiment
Douglas Miller | 29
explained to variations in occupant behavior and that “office occupants who are more
apt to adjust their thermostats prior to the intervention were less susceptible to the
default” (p. 2). Thus implementing a more moderate level of change may lead to a larger
impact on energy use in the long-‐term than more dramatic changes. Steg & Vlek (2009)
also imply that people will prefer strategies framed as promoting the adoption of energy
saving behaviors over those targeting a reduction in wasteful energy behaviors.
It appears that a major opportunity to reduce energy use in office buildings is during
non-‐work hours. Webber et al. (2006) found in a series of after-‐hours audits of office
equipment (computers, monitors, printers, fax machines, copiers, scanners, multi-‐
function devices) for sixteen businesses across three regions in the US that user
behavior (which “determines the number of hours per day during which a device is in
use, the number of hours the device is turned on but idle, and the number of hours the
device is off”) like turning off devices at night or enabling power management
significantly influences energy use (p. 3). Masoso & Grobler (2010) present an
astounding finding on the scale of energy wasted during the hours when offices are
empty yet lighting, temperature control, and equipment are still in use: “more electricity
is used during non-‐working hours (56%) than during working hours (44%)” (p. 176). Yet
there are also opportunities to reduce energy consumption during work hours since,
according to a study of 48 offices in three buildings, nearly everything remains turned
on throughout the day even though occupants on average “spend more than 50% of the
time away from their work station” (Masoso & Grobler, 2010: p. 173). Zero-‐cost
measures like ensuring that items not in use are turned off could thus lead to dramatic
reductions in energy use and greenhouse gas emissions.
Webber et al. (2006) discovered that turn-‐off rates during non-‐working hours “vary
widely over the types of office equipment, from 0 percent (for fax machines) to 75
percent (for wide-‐format printers). For most equipment types, turn-‐off rates are under
50 percent” (p. 20). Moreover, it was found that “around one half of the electrical load
occurs when the building is unoccupied, due to lights and equipment being left on” (de

Behavioral opportunities for energy savings in office buildings: a London field experiment
Douglas Miller | 30
Wilde & Tian, 2010: p. 1679). In terms of temperature settings during non-‐work hours,
Korolija et al. (2013) “suggest the change in set point temperature during unoccupied
hours to 12°C in all zones in winter and to 28°C for office zones and 30°C in common
areas for summer” (p. 156).
Behavior change measures should build upon the values and aims held by employees
and their respective organizations. In a qualitative study by Lo et al. (2012-‐b) conducted
through semi-‐structured interviews and focus groups among office building facility
managers and employees in four Dutch organizations, several insights were discovered
that may prove useful in bringing about energy saving behavior. First and foremost,
behavior change interventions are more likely to be successful should they be
compatible with or supportive of the work-‐related interests (work quality, efficiency,
etc.) of an organization. Energy saving measures must not be perceived – as they often
are – as “harming the organizational interest indirectly through their employees” (Lo et
al, 2012-‐a: p. 238). Second, there must be clear communication of the desired behavior
changes, related skills training for new lower energy work routines, adjustments to work
procedures, and direct feedback on behavior. Each of these acts would reduce the
actual and perceived amount of effort required by employees. Finally, interventions that
change workplace norms may be more successful since norms often serve as a (most
often underreported) barrier to behavior change. Lo et al. (2012-‐b) also suggest that
behavior change measures are likely to be viewed by employees through three general
orientations: normative orientation (moral stances and individual responsibility), gain
orientation (cost-‐benefit analysis and efficiency), and hedonic orientation (personal
convenience and comfort). Varying forms of engagement that tailor to these employee
orientations towards change may hence be necessary to ensure behavioral measures
become ingrained across an organization.
Physical comfort in the workplace must be considered when designing and
implementing behavior change strategies. Survey research by Barlow & Fiala (2007)
suggest it is important to value occupant notions of physical comfort in the workplace,

Behavioral opportunities for energy savings in office buildings: a London field experiment
Douglas Miller | 31
as comfort levels will affect the favorability of occupant views towards energy saving
behaviors. Lakeridou et al. (2012) show in an experiment involving two floors of a
modern London office building in which the room temperature was increased during the
summer by 2.6˚C on average on one floor and the temperature for a second, ‘control’
floor was unchanged that while employees on the intervention floor noticed that it was
warmer, overall there was not a significant difference in comfort levels or satisfaction
between employees on both floors. However, the temperature set-‐point increase “only
lasted two days due to some occupants complaining, and hence if a policy is
implemented, facilities managers will need clear instructions on the complaint threshold
at which action should be taken” (Lakeridou et al, 2012: p. 347). This latter point is not
surprising given the finding from de Wilde & Tian (2010) that “indoor temperature is a
predominant stressor in office buildings” (p. 1676) and from Lo et al. (2012-‐b) that
“climate control is one of the most frequent sources of complaints among employees”
(p. 239). And if people become uncomfortable and feel that temperature settings are
outside their control, Herkel et al. (2008) show they will for instance be more likely to
open windows, which can lead to varying levels of energy losses over the course of a
year. Besides temperature, Yun et al. (2012) show that internal lighting affects the level
of comfort experienced by employees and reveal that the use of lighting cannot be
explained by external daylight.
Energy savings could be used as a method to increase physical comfort in office
buildings. de Wilde & Tian (2010) present an alternative way to frame energy saving
behavior. The costs associated with energy use are meager in relation to overall labor
costs: Pellegrini-‐Masini & Leishman (2011) suggest mechanical/electrical running and
maintenance costs represent 4 percent of the typical business’ total costs, while staff
salaries amount to about 85 percent of the total costs. De Wilde & Tian (2010) therein
focus their work on the sensitivity of employee work performance based on changes in
the physical office environment, placing particular emphasis on comfort associated with
temperature. Their research hints that behavioral measures taken to reduce energy use
may in fact improve employee work performance by increasing comfort levels through

Behavioral opportunities for energy savings in office buildings: a London field experiment
Douglas Miller | 32
various means. Hence, by framing energy savings around comfort levels it seems
possible for energy saving behaviors to not only reduce energy related costs but also
boost employee performance. As an example, Pino et al. (2012) argue that better
utilization of natural light, through measures such as ensuring blinds are used properly,
“can positively act on a user’s comfort, besides the reduction of artificial lighting use
which generates an internal gain of heat and increase in electricity consumption” (p.
448).
Research needs After conducting a review of relevant literature, it appears that there are several
important gaps in the literature that the experiment conducted as part of the present
study paper addresses:
• Metz et al. (2007) summarizes its contribution to the IPCC Fourth Assessment
Report: Climate Change 2007 by saying “there is a critical lack of understanding,
characterization and taxonomization of non-‐technological options to reduce
GHG [greenhouse gas] emissions” and that this lacking may lead to an
underestimation of potential ways to cut emissions (p. 437). The present study
places its central focus on the role of non-‐technological options in relation to
energy saving behavior in office buildings.
• Nisiforou et al. (2012) point to the general need for research on energy use and
energy savings in office buildings at the individual, behavioral level. While most
studies on energy saving behaviors focuses mainly on the residential sector,
studies “that quantify potential behavior savings at service buildings are scarce”
(Lopes et al, 2012: p. 4098). The present experiment directly investigates these
gaps in research by measuring the impact the impact of behavior change
strategies on energy use in an office setting.
• Lo et al. (2012-‐a) state that there are “no studies on organizational
environmental behavior which have integrated individual and organizational
variables in their analysis and used more than one organization in their sample”

Behavioral opportunities for energy savings in office buildings: a London field experiment
Douglas Miller | 33
(p. 2957). The present experiment addresses this by evaluating the impact of
behavior change interventions implemented in several office buildings operated
by different types of organizations (private sector, public sector, and university).
• In addition, Lo et al. (2012-‐a) stress the need for greater understanding on the
role of commitment, norms, social comparison as well as other variables such as
office culture on pro-‐environmental behavior. To contribute to the broader
literature, the present experiment invokes several of these variables within the
behavioral interventions that were implemented at office buildings participating
in the study.
• Azar & Menassa (2012) believe it would be useful to figure out the frequency of
various occupancy behaviors – such as leaving equipment ‘on’ during non-‐work
hours – in commercial buildings. The present experiment collected on-‐site
observational data of buildings participating in the study to get a grasp on the
major sources of energy waste within each building.
Moving forward, there are in sum various key themes in existing research that should be
incorporated into office based behavior change measures. More generally, it is essential
that interventions create an enabling choice environment that engages employees and
makes change easy. Active feedback and support, trust, bold leadership, consistent
communication, compatibility with work-‐related interests of employees, and an
emphasis on building new expectations and norms are also vital. These and other
findings from related research were considered in the methods developed to conduct
the behavior change experiment examined in the present paper as well as in the
interpretation of its results.

Behavioral opportunities for energy savings in office buildings: a London field experiment
Douglas Miller | 34
Methods In this section, the general framework of the experimental methodology is described to
highlight the manner in which the experiment was conducted. The behavioral
interventions used in the experiment were informed by the research presented in the
Literature Review and were developed in collaboration with the London-‐based
sustainability consultancy Carbon Smart.
The experiment A controlled field experiment was conducted in collaboration with Carbon Smart in
order to evaluate the potential scope for energy savings in office buildings through
behavior change. The experiment took place from July through August 2013 and
involved about 1,100 participants in five organizations across four office buildings in
London, UK.
The various components of the experimental process are listed below and then
explained in greater detail in the ensuing paragraphs:
• Recruitment of participants
• Initial meetings
• Observed potential energy savings and barriers assessment
• Behavioral strategy design and implementation
• Data collection
• Data analysis
Recruitment of participants Beginning in mid-‐May 2013, the recruitment of organizations and their respective
building(s) was the first and crucial step in the experimental process. Due to the limited
timeframe available to conduct the study, it was not possible to use a randomized
recruitment process. Many of those that were initially recruited were either a client of

Behavioral opportunities for energy savings in office buildings: a London field experiment
Douglas Miller | 35
Carbon Smart or an organization for which an employee at Carbon Smart suggested a
contact. Electronic messages were sent and/or phone calls were made to individuals in
charge of his or her respective organization’s estates management, environmental, or
energy management division. After this, organizations appearing to be likely to have
interest in an experiment aiming to reduce energy use – for example, an organization
that had CO2 targets or other climate change initiatives – were identified. Thus, those
that eventually became participants in the experiment were quite receptive to the
importance of reducing energy use and addressing climate change. While it would have
been ideal to include those both receptive and less receptive to reducing energy use,
the time constraints of the study period meant that it would be necessary to make the
recruitment process as quick and as successful as possible.
The like-‐mindedness of participants therein contributes a two sided twist to the
experiment and the broader interpretation of its findings. While on the one hand their
like-‐mindedness may mean that there could be more barriers at other organizations less
receptive to the need to reduce energy use, those participating in the study were
probably already ahead of the curve in terms of making efforts to save energy.
Participants in the experiment therefore likely had less potential to reduce energy use
than those who would have been more difficult to recruit.
The recruitment process began by cold-‐calling and/or sending emails to prospective
participants from the Carbon Smart office. The experiment was presented to
prospective participants as a free piece of staff engagement that would be used for the
present author’s master’s dissertation at Imperial College. It is worth noting that the
messages did not include any mention of climate change, carbon dioxide, or any related
terminology; only the themes of energy and cost savings, behavior change, and staff
engagement were presented. A description of the experiment was then given to
prospective participants, placing particular emphasis on the limited amount of time or
effort they would have to contribute. The description would resemble the following:

Behavioral opportunities for energy savings in office buildings: a London field experiment
Douglas Miller | 36
From June to August this year, Carbon Smart and Imperial College’s Centre for Environmental Policy are conducting an experiment to measure the effects of staff behavior interventions on energy use in an office environment.
The experiment is relatively straightforward: I am working together with Carbon Smart to carry out a number of communication and engagement activities to support new staff working practices and behavior. The study will take place in a defined space (a discrete office or site, for example) and will compare the impact on energy use in comparison to a similar space that is not subject to the interventions.
The results will be published at the conclusion of the experiment. This is an area in which little research has been undertaken, so we hope the work will greatly increase our collective understanding of what works to change staff behavior and reduce office energy use.
The study will involve just a small amount of your time and will likely lower your energy related costs. Furthermore, this is an opportunity for [Prospective Participant] to participate in the development of innovative strategies for addressing climate change. Carbon Smart will also write a briefing paper for [Prospective Participant] presenting key learning points for your staff engagement going forward.
Nearly all of the work will be carried out by us. On your end, we will need just two similar spaces as well as the cooperation of staff.
Follow-‐up calls and emails were then made in order to set up initial in-‐person meetings.
However, before meeting in person, further energy data would also be requested for
the prospective site. Buildings needed to be able to collect sub-‐metered electricity
readings in order to be considered for the study. Several prospective sites were
dismissed at this stage due to a lack of sub-‐metering capabilities, insufficient data
coverage, and due to overly variable data from previous summer months.
Initial meetings An initial meeting was held at the office of each organization interested in participating
in the study. The meetings typically lasted thirty to forty-‐five minutes. More details of
the experiment were explained to the person(s) representing the prospective
participant and then any questions were answered.
After the initial in-‐person meeting, the representative of the prospective participant
would speak with various people and engage in the actions necessary to determine
whether it would be possible to run the experiment in their building(s). Once any
required approvals and/or other measures were in order, the experiment then would
begin at the organization’s building(s). This bureaucratic hoop brought an end to
prospective participants, as the building’s main decision-‐maker(s) decided not to
proceed further.

Behavioral opportunities for energy savings in office buildings: a London field experiment
Douglas Miller | 37
Various challenges were encountered in the recruitment process. On several occasions,
it turned out that what seemed to be a promising site for the experiment ended up
falling through. These setbacks would render the experiment impractical at the site and
in sum occurred due to bureaucratic issues within the organization, internal time/work
pressures, or an insufficient/inadequate capability to collect electricity sub-‐metered
electricity readings.
Observed potential energy savings and barriers assessment The first step of process in developing behavioral opportunities for energy savings
involved the identification of potential sources of energy waste and related barriers to
behavior change. This knowledge contributed to the targeted behavioral strategies that
would eventually be implemented in the office to reduce energy use. At each office
building, an extensive set of observations were made to identify computers, lights, and
other electronic devices that appeared to be left on unnecessarily. These observations
took place at the end of the workday – a time expected to be full of opportunities to
reduce energy use – in order to discover what would be left on during non-‐work hours.
The ‘checklist’ used for the on-‐site evaluations was inspired by the office energy use
evaluations conducted by Webber et al (2006). Even though there are numerous
categories of office devices, the on-‐site assessments focused on a limited number of
devices, including personal computers (PCs), computer monitors, printers, copiers,
scanners, and fans.
The observations made while walking around the office were crucial in the initial stages
of developing the behavioral strategies to reduce energy use because they illuminated
various opportunities for energy savings. In addition, these observations enabled the
identification of physical barriers inhibiting energy saving behaviors, such as light
switches being hidden behind objects. After various sources of waste and possible
barriers were identified, the behavior change interventions were designed and then
approved with the points of contact at each participating site.

Behavioral opportunities for energy savings in office buildings: a London field experiment
Douglas Miller | 38
It is worth noting that the original plan for the study included holding focus groups at
each site. The reason for holding focus groups would be to directly engage and learn
from employees so that energy savings could be better captured. Focus groups also had
the potential to offer deeper insights on the barriers to and opportunities for energy
saving behavior in each office, as well as create a notion of ownership over the
implementation of the energy saving strategies. However, it would have been possible
to hold a focus group at only one participating site. Moreover, given the nature of the
specific behavior change that in the end was targeted for intervention in this
experiment, it was deemed that a focus group may do more harm than good. Making
participants step away from their work for a period of time to discuss and collaborate
over how to facilitate a single (and simple) behavior change might cause frustration.
Behavioral strategy design and implementation A set of behavioral strategies was designed for the experiment based on the insights
garnered through the observational assessment, discussions with contacts at each
building, and through a review of related literature. The strategies sought to capture the
opportunities to reduce wasted energy by both removing barriers and facilitating new
behaviors in order to create a new choice context. These strategies also incorporated
various components of behavioral insights described in the Literature Review. In so
doing, the aim was to create an enabling environment in which the new energy-‐saving
behavior became ingrained in the office culture and employee practices.
One of the two behavior change interventions developed for the experiment was
applied in each building. The interventions were applied on the experimental floor(s),
while no intervention was implemented on the control floor(s). Each participating site
had in place an open-‐plan office setup in which employees work in a shared space (there
were neither cubicles nor individual employee offices). Being that two strategies were
implemented across participating buildings and that there were participants from
several sectors, the overall approach of the experiment is in line with the view
presented by Steg & Vlek (2009) that studies aimed at evaluating an intervention’s

Behavioral opportunities for energy savings in office buildings: a London field experiment
Douglas Miller | 39
effectiveness “should follow solid experimental research designs that reveal the
effectiveness of single as well as combinations of interventions for one or more
‘treatment’ groups and a comparable control group” (p. 314).
It became increasingly clear during the observed potential energy savings and barriers
assessments that there was a shared, albeit relatively small, source of energy waste:
computer monitors (LCDs) left on or left in standby mode overnight. This became the
central focus of the intervention mapping process and behavioral intervention design
because capturing the opportunity for energy savings from the large share of computers
remaining on or in standby mode overnight required a simple change in repeated,
habitual behavior. The desired change was for more employees to simply press the
power button on their computer monitor(s). As such, this experiment evaluated the
potential for reductions in energy use and CO2 emissions that are – in the literal sense –
within an arm’s reach.
Even though computer monitors use much less energy than heating, cooling, lighting,
and various office equipment/devices, interventions focusing on monitors offer a ‘free’
source of potential reductions in energy use and CO2 emissions that are visible to and
can be easily addressed by everyone in the office. The simplicity of the change in
behavior – pressing a button within arm’s reach of each employee – suggests that the
reason for monitors not being turned off rests in the choice context rather than the
difficulty of executing the desired behavior. Thus by creating a new choice context, it
was expected that there would be a resulting increase in monitors being turned off by
employees.
An additional motive for selecting monitors as the focus of the behavioral interventions
was that monitors served as a common source of potential energy savings for each of
the participating organizations that could be addressed via behavior change
interventions. In some offices, for example, heating/cooling and lighting were
automated and outside the realm of employee behavior. In such situations, behavioral

Behavioral opportunities for energy savings in office buildings: a London field experiment
Douglas Miller | 40
strategies could not be applied. Moreover, the commonality of potential energy savings
from monitors left on or in standby mode allowed for greater comparability of
differences in the impact of behavior change interventions across organizations and
sectors.
In developing behavioral strategies to increase the number of monitors turned off
rather than left in standby mode (or left entirely ‘on’), Lockton et al. (2013) offer a
useful intervention mapping approach that incorporates System 1 cognition: their
approach accounts for the heuristics (or ‘rules of thumb’) that may keep people from
turning off their computer monitors and therein can be used to help identify possible
strategies to increase the rate of monitors turned off. Using Table 3 from Lockton et al.
(2013)6 as a way to organize the intervention mapping process and develop strategies
that engage employees by changing the decision making context around computer
monitors, the following table offers a set of possible heuristics that sustain current
practice and potential matching intervention design(s):
Table 1: Possible heuristics and intervention design implications
Possible heuristics Intervention design implications If I find out monitors left in standby mode continue to use energy, then I will turn mine off
Ensure employees know that monitors continue to use energy unless they are turned off by pressing the power button
If I learn how to turn off my monitor, then I will do it
Show employees how to turn off their computer monitor
If it is easy to turn off my monitor, then I will do it
Illustrate to employees the simple step required to turn off their monitors
If I remember to press the power button, then I will do it
Remind employees with prompts and make monitor energy use salient
If my colleagues turn off their monitors, then I should do it
Highlight to employees what their colleagues are doing
If everyone else in the office turns off their monitor, then I will do it
Show employees that lots of other people in the office turn off their monitors
If I want to be ‘normal’, then I will turn off my monitor
Emphasize that turning off computer monitors is ‘normal’ among colleagues in the office
If I say I will turn off my monitor, then I will do it
Have employees commit to turn off their monitors
6 See Appendix I for Table 3 from Lockton et al. (2013).

Behavioral opportunities for energy savings in office buildings: a London field experiment
Douglas Miller | 41
In order to address the aforementioned heuristics that may affect whether people turn
off their computer monitor, a set of prompts matching these heuristics were designed.
First of all, as shown in Figure 1, a Reminder Prompt was placed on each monitor directly
next to the power button to indicate that the power button must be physically pressed
to turn off the monitor, remind people to turn off their monitor, and show how to
accomplish the task. It was also expected that some employees might not have known
before the prompts were put in place that the power button must be pressed to turn off
the monitor.
Figure 1: The Reminder Prompt
Behavioral interventions were then developed with the aim of modifying the choice
context by creating a new set of expectations among employees. Two types of
behavioral approaches were implemented and sought to modify the choice context by
either (1) establishing public commitment to turn off monitors, highlighting the general
norm of the office that most people turn off their computer monitor or (2) providing
social feedback (feedback of individual behavior in comparison to others in the office).
This aim aligns with the argument made by Lockton et al. (2013) that the application of
visual comparisons of an individual’s energy use in relation to others can be used in
many contexts as well as their argument that commitment and consistency can facilitate
behavior change. Only one of the two prompts was applied in each building on the
desk/monitor of each employee. The Social Feedback Prompt shown in Figures 2a-‐i and
2a-‐ii was developed to provide feedback on whether an individual turned off his or her
computer monitor before leaving work the previous day. This feedback was shown in
relation to whether neighboring monitors were turned off or left on overnight. The total
number of monitors turned off in the experimental site was also shown at the bottom of
the prompt. The information about neighboring computers was handwritten in either

Behavioral opportunities for energy savings in office buildings: a London field experiment
Douglas Miller | 42
green (for ‘off’ monitors) or red (for ‘on’ monitors) individually for the monitor each
desk after data was collected for the entire floor of the building. This prompt created a
context in which the fact that a slight majority of employees – but not all – in the office
turned off their monitors, creating a situation where likely some would want to join the
side of the majority. While the prompt shown in Figure 2a-‐i was used on the first day of
feedback, the prompt shown in Figure 2a-‐ii was used during ensuing visits to the site to
show progress on monitor on/off rates compared to the previous week. Feedback was
provided for three consecutive weeks in July at the Royal Borough of Kensington and
Chelsea’s (RBKC) Town Hall, and indicated to employees whether progress was being
made towards increasing the number of monitors turned off.
The alternative prompt – the Public Commitment Prompt (illustrated in Figure 2b) – was
designed in order to engage individuals in publicly committing to turning off their
monitor and implemented at all other sites besides RBKC. For this prompt, the imagery
of a monitor’s power button being turned off (coloring the button in orange, as occurs
when the monitor goes into standby mode) and text (“I push buttons”) that was used
clearly demonstrated what was necessary to turn off the monitors and that a power
button illuminated in orange (indicating standby mode) meant that a monitor was still
on. The message “I push buttons” also invokes a sense of humor, embracing the fact
that behavior change around energy use can be seen by some as pushing people’s
buttons (i.e. be seen as annoying or petty). Moreover, because the Public Commitment
Prompt was placed above each monitor it could be observed by everyone, creating a
context in which everyone knew that everyone else in the office ‘committed’ to turn off
monitors and everyone knew that everyone else knew this. The Public Commitment
Prompt was complemented on the first day it was put in place with a brief Explanation
Prompt (shown in Figure 2c) to state why the prompts were installed and also to create
a situation where people could choose to ‘opt out’ of saving energy by removing the
prompts from their own monitor. An explanation prompt was not used to complement
the Social Feedback Prompt because it was believed that doubling the amount of
information placed at employees’ desks would yield a cognitive burden. It was also

Behavioral opportunities for energy savings in office buildings: a London field experiment
Douglas Miller | 43
believed that the Social Feedback Prompt was relatively self-‐explanatory compared to
the Public Commitment Prompt, and thus did not warrant further explanation.
Figure 2a-‐i: The initial Social Feedback Prompt
Figure 2a-‐ii: The ensuing Social Feedback Prompt
ON OFF ON ON
ON OFF OFF ON
OFF OFF ON OFF
ON OFF OFF ON

Behavioral opportunities for energy savings in office buildings: a London field experiment
Douglas Miller | 44
Figure 2b: The Public Commitment Prompt
Figure 2c: The Explanation Prompt Good morning.
You may have noticed the two new messages placed on your computer monitor.
Please help us save energy in the office by pressing the power button on your monitor when you leave your desk and when you leave to go home.
Energy continues to be used until you press the power button, even when the light is orange.
If you do not wish to join the rest of the office in our commitment to saving energy, you can remove the messages from your monitor.
Figures 3a and 3b are also provided below to demonstrate the appearance of the prompts as was observed by employees.
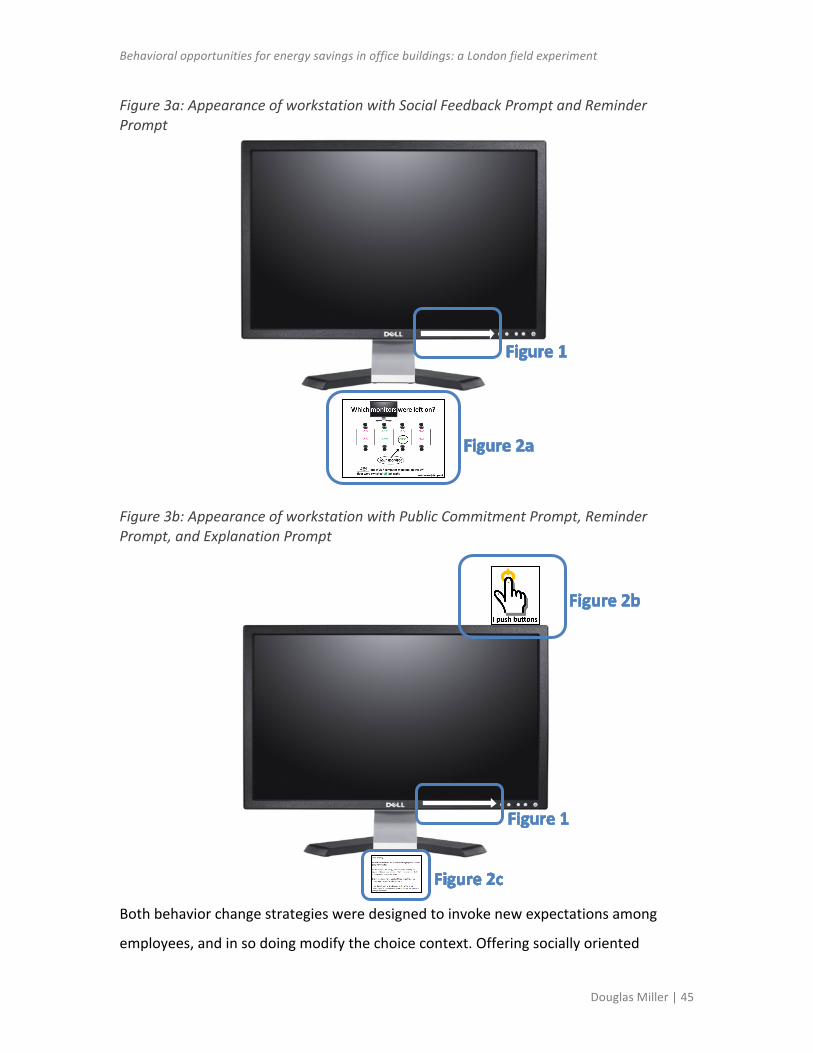
Behavioral opportunities for energy savings in office buildings: a London field experiment
Douglas Miller | 45
Figure 3a: Appearance of workstation with Social Feedback Prompt and Reminder Prompt
Figure 3b: Appearance of workstation with Public Commitment Prompt, Reminder Prompt, and Explanation Prompt
Both behavior change strategies were designed to invoke new expectations among
employees, and in so doing modify the choice context. Offering socially oriented

Behavioral opportunities for energy savings in office buildings: a London field experiment
Douglas Miller | 46
feedback created a new situation in which employees both could compare their own
behavior to those in their immediate vicinity and realized that their use of monitors was
a source of evaluation. On the other hand, creating an environment where people
commit to turning off their monitors posed a new situation in which each employee
would be more likely to expect that others would turn off their monitors as well as that
others would expect the employee to turn his or her monitor off. It was expected that
the implementation of interventions in which the focus was to facilitate new
expectations among employees would likely lead to enduring changes in behavior in
which a higher proportion of employees would turn off their monitor(s) and therein
achieve reductions in energy use and CO2 emissions.
As will be highlighted in greater detail in the following sections, the use of two
behavioral designs allowed for a comparison of strategies based on social feedback
versus public commitment in their ability to change the decision context and therein
facilitate energy saving behaviors. More specifically, because each prompt was
implemented in local council town hall (public) buildings, this permitted comparisons to
be made about the relative effectiveness of (1) providing social feedback versus (2)
using public commitment to establish the expectations and related norms conducive to
instilling a culture around turning off monitors and to create dissonance for those not
turning off their monitors which can only be relieved by engaging in the new behavior.
Additionally, as will also be explained further, comparisons were made about the
relative effectiveness of the public commitment prompt across public, private, and
university buildings as well as across organizational departments within a single
building.
Visits were made to each participating office on a weekly basis during non-‐working
hours – starting sometime between 5pm-‐7pm depending on when employees left the
particular office – throughout the implementation phase of the interventions to observe
the impact of the interventions and collect observational data. The timing of the visits

Behavioral opportunities for energy savings in office buildings: a London field experiment
Douglas Miller | 47
was not announced to employees besides the primary contact person that provided
access to enter the building.
Data collection Observational (proportion) data were collected from July through August 2013 on
computer monitors’ power status on experimental and control floors in participating
buildings. These data show counts of monitors being left on and those being turned off
during non-‐working hours, and thereby served the purpose of capturing the scale of
behavior change that took place due to the behavior change strategies. The
observational data was collected before the experiment began (the day the experiment
was launched at each site) and then – depending on the timeframe when the study was
launched at each site – between one to three weeks after the interventions were
introduced. These data help provide detail at the granular, individual level about
changes that may have occurred as a result of the interventions.
The collection of observational data also addressed the potential risk that changes in
monitor on/off rates may not – due to the lower amount of energy savings possible
from turning off computer monitors – be captured by electricity meter readings. Hence,
even if meter readings failed to show a statistically significant reduction in energy use,
the observational data ensured that it would possible to show whether changes in
employee behavior took place. Collecting this information in addition to meter readings
thereby would contribute to a better understanding of the potential impact of the
behavioral interventions in future applications.
Electricity meter readings were collected by sub-‐meters in each building. These sub-‐
meters were installed in some sites for the purpose of this experiment. This experiment
helped some of the building managers justify to their superiors their long-‐awaited wish
to install sub-‐meters. Kilowatt-‐hours (kWh) served as the unit of measurement provided
by the meter readings. The impact of behavior change on energy use was evaluated in
terms of kWh. Sub-‐metering made it possible to evaluate whether there was a

Behavioral opportunities for energy savings in office buildings: a London field experiment
Douglas Miller | 48
significant change in energy use on the experimental floor(s) relative to the control
floor(s). In order to create a common metric for comparison and applying the findings
from the study in the future, Nguyen & Aiello (2013) suggest the use of “better
evaluation metrics such as kWh/m2” (p. 253). However, because this study focused on
monitors rather than temperature controls or lighting, physical area was of little
relevance. Hence it seemed appropriate to use kWh as the evaluation metric. Due to the
focus of the behavior change interventions on monitors – a small source of potential
energy savings – it was not expected for there to be significant reductions in energy use
in participating sites.
At Imperial College London’s Sherfield Building, only the 5th floor could be used for the
experiment. It was, however, possible to separate the meter readings for this floor in
half. The intervention was applied on half of the 5th floor while the other half of the
floor operated normally (served as the control). Each half of the floor hosted a different
set of departments and was physically separated by a long hallway, thereby mitigating
the risk of contamination from the experimental half-‐floor to the control half-‐floor. It
was assured by the building’s contact person that little to no communication across the
two halves of the floors takes place, so it was likely that little to nothing was known
about the behavioral interventions on control half-‐floor.
There were differences in the frequency of meter readings taken in each building. Meter
readings were taken as often as every half-‐hour in some buildings, while in others it was
collected twice daily (once in the morning and a second time in the evening, in order to
capture non-‐working hours). For ease of analysis, meter readings were organized into a
standard format of two 12-‐hour windows to show energy use during work hours (6am-‐
6pm) and non-‐work hours (6pm-‐6am).
In the end, it turned out that only the Royal Borough of Kensington & Chelsea’s (RBKC)
Town Hall and Merton Council’s Civic Centre could provide sufficiently detailed meter

Behavioral opportunities for energy savings in office buildings: a London field experiment
Douglas Miller | 49
readings. The energy use data analysis thereby includes the meter readings from just
these two buildings.
Data analysis In order to assess whether the behavior change interventions brought about changes in
employee behavior and whether they led to significant reductions in electricity
consumption, statistical analyses were made using the statistics program R.
A quasi-‐binomial generalized linear model was made to evaluate the relative role of
various variables in observed changes in computer monitors’ non-‐working hours power
status. This model was selected because the data are – in line with Crawley (2007) – an
example of proportion data because it was known how many monitors were in both the
‘on’ category and in the ‘off’ category. According to Crawley (2007), model processes
involving proportional response variables should be assessed in R within the binomial
family. Moreover, the presence of a two-‐vector response variable (on and off) in the
collected data required these two vectors to be bound together into a binomial
denominator. A quasi-‐binomial function was used rather than a binomial function to
account for the potential of overdispersion in the data.
The purpose of producing this model was not for the purpose of the model itself but
rather to show whether the interventions brought about significant and lasting changes
in behavior, whether there was a significant difference in the impact of social feedback
or public commitment in changing behavior, and whether the interventions were
significantly more effective in public, private, or university buildings. More specifically,
four explanatory variables (each with several levels) were assessed:
(1) Visit (pre-‐experiment and within three weeks after introducing the interventions) (2) Treatment (control; public commitment; social feedback) (3) Sector (public; private; university) (4) Organization (Imperial College London; Merton Council – Environmental
Division; Merton Council – Children, Schools and Families Division; Royal Borough of Kensington & Chelsea; Workspace – Arlington Estates; Workspace – Clothes Aid)

Behavioral opportunities for energy savings in office buildings: a London field experiment
Douglas Miller | 50
It should be noted that the fourth variable, Organization, was included to evaluate
whether the interventions varied in effectiveness across different divisions within an
organization, namely in terms of Merton Council’s Environmental (13th and 14th floors)
and Children, Schools and Families (9th and 10th floors) divisions. The 9th/13th floors and
the 10th/14th floors served as the control and experimental floors, respectively, for each
division.
A general linear regression model was also used to analyze the electricity meter reading
data collected from the RBKC Town Hall and Merton Council Civic Centre for the first 19
days after the experiment began at each site to determine whether the behavior change
interventions led to a significant reduction in electricity consumption over the
experimental time period compared to the controls of the experiment. The response
variable was the electricity meter readings collected from participating buildings (in
terms of kWh). Five explanatory variables assessed:
(1) Treatment (experimental; control) (2) Days (number of days after beginning the experiment) (3) Hours (work hours; non-‐work hours) (4) Organization (RBKC; Merton Council’s Children, Schools and Families division;
Merton Council’s Environmental division) (5) Monitors (number of monitors in each group) In a similar vein as the observational data, the aim of the linear regression was to
determine whether behavioral interventions compel reductions in electricity
consumption, whether any observed changes fluctuated significantly over time, and
whether RBKC or Merton Council had significantly different reductions in electricity
consumption as a result of the interventions. As such, both main and interaction
effects were incorporated into the analysis of the meter readings.

Behavioral opportunities for energy savings in office buildings: a London field experiment
Douglas Miller | 51
Experimental results and discussion The experimental results, related statistical analyses, and an interpretation of the
results from the behavior change experiment conducted across four London office
buildings from July to August 2013 are presented in this section. The results are shown
both in terms of observed counts of monitors that were left on/turned off during non-‐
working hours and electricity meter readings. Before offering the analysis and
interpretation of the results, a summary is first provided of the recruitment process and
the participants involved in the experiment.
Recruitment process A total of 82 organizations were contacted during the participant recruitment process.
These organizations included private companies, government authorities, and
universities: 78 percent were private sector organizations while 16 percent were public
sector organizations, and 6 percent were universities. There was a large variation across
sectors in the recruitment success rate, as illustrated below. While only 3 percent of
recruited private sector organizations participated in the experiment, 15 percent of
recruited public sector organizations and 20 percent of recruited university buildings
participated in the experiment.

Behavioral opportunities for energy savings in office buildings: a London field experiment
Douglas Miller | 52
Figure 4: Participation among recruited organizations
Of the 82 organizations that were contacted by phone and/or email about participating
in the experiment, 57 organizations did not respond, 20 organizations responded but in
the end did not participate, and 5 organizations (2 of which are located within the same
building) participated. The three primary hindrances for the 20 organizations that
responded but did not participate in the experiment included a loss of interest (41
percent), an inability to participate for logistical or bureaucratic reasons (36 percent),
and insufficient historic building data and/or lack of sub-‐metered electricity readings (23
percent).
Figure 5: Recruitment summary
0
10
20
30
40
50
60
70
80
90
Private Public University Overall
Count
Sector
# Parxcipants
# Non-‐parxcipants
No response 70%
Parxcipant 6%
Loss of interest 41%
Unable 36%
Insufficient data 23%
Responded but not a parxcipant
24%

Behavioral opportunities for energy savings in office buildings: a London field experiment
Douglas Miller | 53
The process of recruiting participants for the experiment highlighted the great difficulty
associated with implementing the seemingly easy and ‘free’ behavior change
interventions. First of all, organizations possess a range of bureaucratic hoops that any
behavior change intervention must go through in order to be implemented. The strategy
might be thwarted outright at one of the levels of the bureaucratic structure, watered
down in such a way that renders the behavior change measure ineffective and/or
relatively meaningless, or may simply be placed at the bottom of the to-‐do pile. Second,
even if the behavior change intervention is agreed upon by all of the necessary players it
may fail to be implemented, be implemented poorly, or be implemented half-‐heartedly.
This includes the failure to engage staff on the need to adopt the given changes in
behavior and demonstrate how the new behaviors align with the values of the
organization and the daily work of employees. Finally, measuring the impact of
behavioral interventions may be difficult. The availability and type of energy use data at
the disposal of an organization will affect its ability to evaluate the success of any
behavior change measure. In hindsight, however, since the targeted behavior change
ended up involving computer monitors – a low source of energy use – organizations that
were dismissed due to a lack of electricity sub-‐meters could have been included for just
the observational (proportion) data component of the experiment.
Participants Five organizations across four buildings in London participated in the experiment. The
buildings included Imperial College London’s Sherfield Building, Merton Council’s Civic
Centre, the Royal Borough of Kensington & Chelsea’s (RBKC) Town Hall, and
Workspace’s LeRoy House. Buildings from the public, private, and university sector were
thus involved in this study. While the implementation of the experiment in the public
and university sector buildings included a large number of employees and monitors, the
private building (Workspace) included a relatively small sample. There was only so much
that could be done given the timeframe and recruitment process to have large samples
from each buildings sector. Each of the buildings made use of an open office plan,
meaning that all of employees worked in a shared space (where everyone is visible).

Behavioral opportunities for energy savings in office buildings: a London field experiment
Douglas Miller | 54
RBKC’s Town Hall had several distinguishing characteristics compared to the others. In
addition to being the only site where the social feedback prompts were used, the Town
Hall was recently renovated and had in place particularly energy efficient office
equipment, an automated lighting control system, and automated temperature control
system. Moreover, the building made use of ‘hot-‐desking’, meaning that no employees
had an assigned desk. Employees also did not have access to person computers (PCs);
each employee had a laptop that would be plugged into a monitor at the desk where
they happened to sit during a particular day. Employees at RBKC’s Town Hall for the
most part therefore sit in a different place (on the same floor) from one day to the next.
Table 2: A detailed summary of the participants in the experiment Organization Sector Building Floor/Office in Building Intervention type # of monitors
Imperial College London (IC)
University Sherfield Building
5th floor, non-‐Queen’s Tower side
Public commitment
110
5th floor, Queen’s Tower side Control 50
Merton Council (MC) Public Merton
Civic Centre
10th (CSF) & 14th (Env) floors
Public commitment
221
9th (CSF) & 13th (Env) floors Control 194
Royal Borough of Kensington & Chelsea (RBKC)
Public Kensington Town Hall
2nd floor Social feedback 317
3rd floor Control 288
Workspace (Work) Private LeRoy
House
Office 4B, Arlington Estates Public commitment
14
Office 4N/R, Clothes Aid Public commitment
5
Total computer monitors, Experimental Group 667
Total computer monitors, Control Group 532
Total computer monitors, overall 1,199
It should be clarified that the observational data collection from these sites was based
on the number of monitors rather than the number of employees for three reasons.
First, the number of monitors and number of employees was approximately the same
(except for about several dozen instances at Imperial College London and Merton
Council where employees had two or three monitors at their desk). Second, because the
focus of this study revolved around capturing energy savings from monitors it makes

Behavioral opportunities for energy savings in office buildings: a London field experiment
Douglas Miller | 55
sense for numbers to be collected on monitors. Lastly, not all organizations had easy
access to determining the number of employees working on each floor at a given time.
As indicated in the table above, the public commitment prompt was implemented in
three buildings (public, private, university) while the social feedback prompt was
implemented in one building. There were a total of 1,199 computer monitors across all
experimental groups included in the experiment, in which 667 were in experimental
groups and 532 were in control groups.
Behavior change: results and discussion Table 3 below displays the results of the observational data that was collected before
the behavioral interventions were implemented and then one to two weeks after the
interventions were implemented. The table indicates the proportion (in percentage
terms) of the monitors that were turned off during non-‐working hours at each site.
Figures 6 and 7 are also presented to provide a visual representation of the
observational data results. Figure 6 highlights the overall results across the control
group, public commitment, and social feedback groups. Figure 7 provides greater detail
by distinguishing between buildings in the impact of the behavioral interventions.

Behavioral opportunities for energy savings in office buildings: a London field experiment
Douglas Miller | 56
Table 3: Observational data results (Visit 1 versus Visit 2) Organization – Site (treatment group)
Visit 1, pre-‐intervention
Visit 2, post-‐intervention (1-‐3 weeks)
# ON # OFF % OFF # ON # OFF % OFF Imperial College London – 5th floor (control)
30 20 40.0% 24 26 52.0%
Imperial College London – 5th floor (experimental)
50 60 54.5% 31 79 71.8%
Merton Council – 9th floor (control)
26 30 53.6% 27 29 51.8%
Merton Council – 13th floor (control)
58 80 58.0% 67 71 51.4%
Merton Council – 10th floor (experimental)
55 79 59.0% 29 105 78.4%
Merton Council – 14th floor (experimental)
36 51 58.6% 18 69 79.3%
RBKC – 3rd floor (control) 97 191 66.3% 98 190 66.0% RBKC – 2nd floor (experimental)
129 188 59.3% 64 253 79.8%
Workspace – Arlington Estates (experimental)
4 1 20.0% 2 3 60.0%
Workspace – Clothes Aid (experimental)
8 6 42.9% 3 11 78.6%
Figure 6: Behavior change by experimental group (Visit 1 versus Visit 2)
0 100 200 300 400 500 600
Control (Visit 1)
Control (Visit 2)
Commitment (Visit 1)
Commitment (Visit 2)
Feedback (Visit 1)
Feedback (Visit 2)
# Off
# On

Behavioral opportunities for energy savings in office buildings: a London field experiment
Douglas Miller | 57
Figure 7: Behavior change by building and experimental group (Visit 1 versus Visit 2)
Both the observed number and proportion of monitors turned off increased sharply in
all experimental groups, while for the control groups across participating buildings the
number and proportion of monitors turned off either decreased, increased slightly, or
remained essentially unchanged. Overall, there were 40.4 percent and 50.4 percent
decreases across public commitment and social feedback groups, respectively, in
monitors left on during non-‐working hours. While these reductions in off monitors took
place in both experimental groups, there was at the same time a 2.4 percent increase in
monitors left on across control groups. At first glance it thus appeared that the
behavioral interventions were quite successful in facilitating behavior change.
The output from the quasi-‐binomial generalized linear model7 revealed that the
behavior change interventions led to a statistically significant change in behavior (at the
p < 0.05 level). There was a significant increase in the monitors turned off during non-‐
working hours in the experimental groups between the pre-‐ and post-‐intervention
stage, while during the same period of time there was no significant change in the
power status of monitors across control groups. The explanatory variable Visit therefore
helps explain the significant differences that were observed between the experimental
and control groups in the power status of monitors during non-‐working hours monitor.
7 See Appendix II for quasi-‐binomial generalized linear model output.
0 50 100 150 200 250 300 350
IC_Control (Visit 1) IC_Control (Visit 2)
IC_Treatment (Visit 1) IC_Treatment (Visit 2) MC_Control (Visit 1) MC_Control (Visit 2)
MC_Treatment (Visit 1) MC_Treatment (Visit 2) RBKC_Control (Visit 1) RBKC_Control (Visit 2)
RBKC_Treatment (Visit 1) RBKC_Treatment (Visit 2) Work_Treatment (Visit 1) Work_Treatment (Visit 2)
# Off
# On

Behavioral opportunities for energy savings in office buildings: a London field experiment
Douglas Miller | 58
The explanatory variable Treatment was significant only for the control group because
this group possessed a significantly higher proportion of monitors left on compared to
either of the two experimental groups (public commitment and social feedback). Thus,
although it was found that where public commitment or social feedback was
implemented that there was a significantly different proportion of monitors left
on/turned off – as indicated by the explanatory variable Treatment – neither was on its
own significantly better than the other in facilitating behavior change. Public
commitment and social feedback were therefore similar in their effectiveness in
achieving significant change in behavior.
These results strongly suggest that interventions modifying the choice context through
the creation of new expectations among employees will compel a significant change in
behavior. Since both the social feedback and public commitment approaches brought
about significant behavior change relative to control groups, it seems that it is not the
specific way in which new employee expectations is brought about that matters but
rather (and simply) the very creation of new expectations and workplace norms. A new
set of expectations hence appears to have provided an enabling environment wherein
the energy-‐saving behavior – in this instance, turning off computer monitors – would
become adopted by a large majority (70-‐80 percent) of employees.
These results are similar to those found in a controlled experiment conducted in the
residential sector by the company Opower: the inclusion of socially oriented feedback
(in this case, in comparison to neighboring homes) on home energy reports led to
significant behavior change, as indicated by an average 2 percent reduction in energy
use per home versus those in the control group (Allcott & Mullainathan, 2010-‐b).8
In a study yielding similar results and using an approach quite similar to the social
feedback approach used in the present experiment but in a different setting, Goldstein
et al. (2008) found in a controlled experiment that the use of descriptive norms is much
8 See Appendix II for a copy of the feedback letter that Opower provided to households.

Behavioral opportunities for energy savings in office buildings: a London field experiment
Douglas Miller | 59
more effective in increasing the reuse of towels in hotel rooms compared to appeals of
environmental protection. In other words, a sign saying stating how the majority of
hotel guests reuse their towels is more effective than asking people to reuse their
towels to save the environment. In a follow-‐up experiment, they also found that the
closer the match to the individual’s (hotel guest’s) immediate circumstances, the further
the increase in reuse rates. It was found that stating the percentage of previous guests
in the same hotel room that reused towels was the most effective approach, leading to
nearly half of guests receiving this message to reuse their towel. In comparison, the
standard ‘save the environment’ type approach yielded a reuse rate of about 37
percent. Perhaps the most interesting result was that towel reuse participation rates
“were actually highest for the reference group [same room identity descriptive norm]
that participants felt was the least personally meaningful to them (but most physically
proximate)” (Goldstein et al, 2008: p. 479). Individuals thus underestimate the impact of
norms on their behavior, even though norms can be the strongest predictor of individual
behavior.
The findings associated with Visit and Treatment also demonstrate that small
interventions can facilitate drastic change among employees. This suggests that other
small interventions that invoke new workplace norms could be implemented to address
other sources of potential energy savings in office buildings, namely those relating to
lighting, heating/cooling, and office electronics that consume greater levels of energy
compared to computer monitors when left on during non-‐working hours.
The output from the quasi-‐binomial model demonstrates that the third explanatory
variable Sector was statistically insignificant. The impact of the behavioral interventions
was hence relatively similar across the three sectors. The insignificance of Sector
indicates that small interventions can work equally well across sectors in changing
behavior. The behavioral strategies work in and of themselves in facilitating change,
regardless of the type of organization involved and energy saving efforts that have
already been implemented by an organization. Moreover, because similar proportions

Behavioral opportunities for energy savings in office buildings: a London field experiment
Douglas Miller | 60
of observed on/off monitors were found across sectors before and after beginning the
experiment, it appears that no sector is particularly better than the other in capturing
potential energy savings associated with behavior change.
Finally, it was found that the fourth explanatory variable Organization was also
statistically insignificant. The interpretation of this result should be similar to that of
sector: the interventions worked equally well in facilitating change across organizations.
However, it is true that what is captured by Organization will be related to Sector given
the nature of the number of organizations participating in this study. Yet it should be
recalled that the purpose of having the Organization variable was to make intra-‐
organizational analyses and, more specifically, to compare the impact of the
interventions on Merton Council’s Environmental versus Children, Schools and Families
divisions. The insignificance of the Organization variable therefore should be
interpreted as indicating that the behavioral interventions were similarly effective in
bringing about statistically significant behavior change in both divisions.
Electricity meter readings: results and discussion The general linear model output9 indicates that the impact of the behavior change
interventions on building electricity consumption were, as expected, insignificant. In
addition to Intervention being insignificant, the explanatory variables Days,
Organization, and Monitors (and any of their interactions) were also insignificant. Even
though energy savings were achieved through the significant changes in behavior that
were observed, these savings were too small to significantly change the participating
buildings’ overall energy use.
However, the explanatory variable Hours proved to be highly significant for RBKC but
not for Merton Council. The stark difference in electricity consumption between
working and non-‐working hours at RBKC and Merton Council can be visually observed in
Figure 8 below. RBKC tends to have much lower electricity consumption during non-‐
9 See Appendix II for general linear model output.

Behavioral opportunities for energy savings in office buildings: a London field experiment
Douglas Miller | 61
working hours compared to working hours, while Merton Council hovers a near zero
difference between working and non-‐working hours. It is worth noting that due to the
nature of how meter readings were collected, weekend days were included in the 19
days of RBKC’s data but not for Merton Council’s, hence helping to explain the sharp
dips in RBKC’s electricity use on days 4, 5, 11, 12, 18, and 19 after the experiment began.
While there was little difference in RBKC’s electricity consumption during these
weekend days between the AM and PM hours, though, the overall level of electricity
consumption was similar to (and often less than) non-‐working hours during weekdays10.
RBKC thus sharply reduced energy use during both non-‐working hours on weekdays as
well as all hours of weekend days. Merton Council, on the other hand, consumed similar
levels of electricity at all hours.
Figure 8: Difference in electricity consumption between working and non-‐working hours
RBKC’s recent energy efficiency retrofit, automated lighting controls throughout the
entire building, use of energy efficient office electronic devices, and lack of PCs
(employees use laptops that are connected to monitors during the day and then store
them at night) may explain the significant difference between energy use during
working and non-‐working hours. At Merton Council, which has not yet made these types
10 See Appendix II for electricity meter readings data.
-‐100
-‐50
0
50
100
150
200
250
300
350
400
1 2 3 4 5 6 7 8 9 10 11 12 13 14 15 16 17 18 19
kWh
Days aZer beginning the experiment
RBKC Control
RBKC Treatment
Merton Env Control
Merton Env Treatment
Merton CSF Control
Merton CSF Treatment

Behavioral opportunities for energy savings in office buildings: a London field experiment
Douglas Miller | 62
of investments, energy use is relatively similar during all hours of the day, whether or
not people are in the office. These results therein suggest the importance of using best
available practices and technologies in reducing energy use, as was shown to be the
case in RBKC’s Town Hall. It seems that greater investment should be made by other
organizations to ensure that – in addition to behavior change – that best available
technologies and practices are put in place.
Should this be of interest, the level of energy savings for the specific strategies used in
the experiment can be roughly estimated nonetheless based on the observed changes in
behavior. The estimates include the following assumptions: 0.5246kg CO2 per kWh and
£0.13/kWh for UK grid electricity (Carbon Smart & Ricardo-‐AEA, 2013), 14 hours per
weekday and 24 per weekend day that are non-‐working hours, and ~1 watt saved per
monitor turned off (Webber et al, 2006). Based on this, for every 100 computer
monitors it can be expected for the social feedback prompts to yield £33.50 in annual
cost savings plus 135.20kg reductions in CO2 emissions, the public commitment prompts
to yield £26.86 in annual cost savings plus 108.37kg reductions in CO2 emissions, and the
control (doing nothing) to yield an increase in annual costs by £1.60 and CO2 emissions
increase of 6.44kg. These values would be greater for less efficient monitors.
Experimental process: comments Several comments should be offered in regards to the implementation of the behavior
change interventions during the experiment. Unsurprisingly, given that the
interventions were put in place on each and every monitor in the experimental groups,
several employees submitted electronic messages were either asking questions or filing
a complaint in regards to the interventions. Yet, given the fact that there were over
1,100 employees involved in the experiment, it was surprising that only eight messages
were received by the author. Six messages were forwarded from employees at RBKC
and one message was forwarded from both Imperial College and Merton Council. The
six messages from RBKC largely reflected a frustration that – due to the use of hot-‐
desking and the fact that social feedback was provided based on monitors – individual

Behavioral opportunities for energy savings in office buildings: a London field experiment
Douglas Miller | 63
efforts to turn off monitors were not necessarily reflected on social feedback prompts at
the desk where an employee would choose to sit the following day. The pair of
messages submitted by employees from Imperial College and Merton Council – where
public commitment prompts were installed – expressed a disliking of the intervention
because it seen as antagonizing or a belief that the intervention would lead to more
harm than good.
Nevertheless, despite the (relatively few number of) messages submitted by employees,
the behavioral interventions led to a statistically significant change in behavior. While it
may have been interesting to have observed how employee beliefs and perception were
affected by the interventions, what matters more is that a significant change in behavior
occurred. Were the interventions designed differently so that computer monitor’s
energy use was less salient for employees, then such interventions may have been more
widely supported yet also less effective.
There was a potential risk in conducting the experiment that members of staff would
recognize the author. This could in turn compel employees – upon seeing the author
present in the office – to turn off monitors of other employees that had already left the
office. However, because site visits took place during non-‐working hours the offices
were in most cases entirely empty. There were a few employees (approximately five) at
RBKC’s Town Hall that happened to still be in the office when visits were made and
recognized the author, but they did not leave their desk during the time the author
observed the status of computer monitors in their respective area of the office.
Limitations and opportunities for future research There are several limitations of the experimental findings as well as the study more
broadly. The limitations must be considered in relation to what may be expected should
similar behavioral approaches used in the experiment be applied in other settings or on
a larger scale. By considering the limitations it can be ensured that the interpretation of

Behavioral opportunities for energy savings in office buildings: a London field experiment
Douglas Miller | 64
the experimental findings considers the scope of this experiment. Moreover, these
limitations present new research questions and thus opportunities for future research.
First and foremost, this experiment involved behavior change interventions targeting a
small source of potential energy savings and related reductions in CO2 emissions.
However, due to there being only three months to enact all of the components involved
in this experiment there was only so much time available to identify sources of potential
energy savings as well as design and implement the interventions. Furthermore,
computer monitors left on or in standby mode was a source of wasted energy in each of
the sites that agreed to participate and thus enabled cross-‐organizational comparisons.
The desired change in behavior was also easy for employees to adopt and thus provided
an opportunity to evaluate whether a small intervention could bring about dramatic
changes across different organization types.
The experiment only addressed the role of behavioral interventions in reducing energy
use. There are certainly many opportunities to boost energy savings through more
efficient technologies, such as insulation, double glazed windows, improved lighting and
lighting control systems, as well as more efficient computing systems. However, many of
these energy efficient technologies yield greater costs than behavioral measures and
sometimes possess a multi-‐year payback period that can be longer than an occupant
plans to stay in a given building. By focusing solely on behavior change the present study
therefore investigates to potential energy and related cost savings that any organization
can pursue with little to no financial cost.
Due to the limited timeframe of the experiment, it was not possible to determine
whether the changes in behavior were enduring much beyond several weeks. It would
have been ideal to see whether the new behaviors ‘stick’ over a longer period of time
and become ingrained habits, but only three months were available to recruit
participants, run the experiment, and interpret the findings. In accordance with the
literature review, it seems likely that the behavior change would stick if (and only if) the

Behavioral opportunities for energy savings in office buildings: a London field experiment
Douglas Miller | 65
norms/expectations, organizational culture, and broader organizational mission became
aligned with objective of reducing energy use. Because the interventions revolved
around creating a new set of expectations among employees and the fact that the
changes remained intact for several weeks, it seems fair to presume that a measurable
portion of changes will remain intact moving forward.
The nature of the timeframe available for the study also meant that the behavior
change interventions could only be implemented and observed during the summer
months. It would have been preferable to observe the impact of the interventions over
an entire year in order to see if there would be differences in the scale of energy savings
across seasons. There may have also been other potential opportunities for energy
savings during winter months and a related alternative possible behavior change
interventions that could be implemented.
The aim of the study was to assess the energy savings that could be achieved by
organizations within the context of office buildings. It did not assess opportunities for
energy savings in the physical goods or services that participating organizations provide.
The study did not assess the spillover effects in terms of how organizations use cost
savings from reduced energy consumption. It is possible that the cost savings from
reducing energy use could be invested in measures that lead to greater carbon dioxide
emissions than that which was saved through the energy reductions. This could occur
directly, such as more frequent business trips by plane, or indirectly, by employees using
higher salaries to buy new products or services that emit more carbon dioxide than
what was saved. This issue presents a topic of future research.
Different building types will have different levels of potential energy savings through
behavior change. The kinds of behavior change interventions involved in this study may
have a larger impact on buildings that are less efficient more generally in its use of
energy as well as buildings possessing occupants whose work is more energy intensive.
There is likely therefore less potential for behavior change to significantly reduce energy

Behavioral opportunities for energy savings in office buildings: a London field experiment
Douglas Miller | 66
use in some of newer, highly energy efficient buildings containing energy efficient
devices.
The participants in the experiment were those responding to the initial recruitment
related communications and thus may have certain characteristics uncommon to other
organizations. Participating organizations were hence receptive to reducing energy use
as well as CO2 emissions. Nevertheless, it is likely that organizations receptive to the
aims of the experiment would have already enacted at least some efforts to reduce
energy use. It is thus probable that behavioral opportunities for energy savings may be
greater among non-‐participants.
The findings may be limited because the experiment only involved buildings in London
and may capture neither the physical characteristics nor the workplace culture in office
settings found elsewhere across the globe. Nevertheless, this limitation may also serve
as a strength: since office buildings in London are likely to be more energy efficient
compared to other buildings across the globe and since the climate is relatively mild, the
scope for energy savings through behavior change is probably greater elsewhere. And
despite the fact that all participating buildings were located in London, because the
experiment focused on the broader opportunities for energy savings through behavior
change in office buildings and involved participants from several sectors it is fair to
presume that similar behavioral interventions focusing on creating new expectations
and norms among employees could be applied in buildings across the globe to capture
the various forms of behavioral opportunities for energy savings.
Finally, the present study does not raise deeper questions regarding the broader
relationships between employees and the various ways in which energy has become
structurally embedded in the office. Future research should investigate methods for
completely reorganizing office work and reducing the structurally embedded energy use
found in the typical workplace.

Behavioral opportunities for energy savings in office buildings: a London field experiment
Douglas Miller | 67
Policy recommendations There are significant opportunities to capture energy savings in office buildings,
especially during non-‐working hours. Existing research and the experimental results
from the present study indicate that these savings can be reigned in through both
behavioral and technological means. Moreover, the potential reductions in energy use
and related costs generally range from ‘free’ or low cost measures to ones that pay back
in just a few years. The empirical evidence, however, is that many organizations are
reluctant to take advantage of these opportunities, meaning that currently available and
major climate change mitigation opportunities rest on the shelf. In other words,
organizations appear at present to be generally failing in capturing the so-‐called low-‐
hanging fruit of climate change mitigation. As such, there is a need for new approaches
that unleash a wave in the adoption of both behavioral and technological energy savings
in office buildings.
Any organization that plans to remain in place for longer than at least a handful of years
has a basic financial incentive to adopt measures that save energy as well as address
climate change, due to the expected scope and interlinkages of its impacts. Yet it
appears that the financial incentive is largely insufficient on its own. The adoption of
voluntary measures to reduce energy use and CO2 emissions seems to have reached a
plateau. It therefore appears that a wide gap exists between the private and social costs
associated with energy consumption and related greenhouse gas emissions. The
negative externalities associated with greenhouse gas emissions that organizations
impose on society by failing to adopt energy saving measures inflict too small a cost on
organizations. In other words, polluting is cheap. And thus the solution is quite simple:
all that is required of policymakers is to simply resolve this instance of market failure by
establishing more accurate prices. Thus all that policymakers need to do is establish a
price on greenhouse gas emissions. Such a law could be written in a few sentences
(unlike for strategies like cap-‐and-‐trade). In order to ensure the simplicity and market

Behavioral opportunities for energy savings in office buildings: a London field experiment
Douglas Miller | 68
efficiency, these prices should be implemented through a tax on greenhouse gases
across the entire economy, without exceptions, without asterisks. Otherwise failed
markets will continue to exist and reap unnecessary financial, environmental, and other
social costs.
It is likely that a (steep) tax on greenhouse gases would encourage organizations of all
shapes and sizes to quickly find ways to reduce their energy consumption. This would be
achieved in as efficient a manner as is possible. Unlike one-‐size-‐fits-‐all strategies like
technology standards, a universal greenhouse gas tax inherently possesses the flexibility
that allows organizations to choose the strategies that best ‘fit’. While both a tax and,
for example, setting new standards for buildings would likely compel organizations to
encourage their employees to adopt new energy saving behaviors, the tax better
enables organizations to do what makes sense given the context of its particular
office(s). A tax does not confine the options taken to reduce emissions. The behavior
change – as well as technological – measures that work in one office context may not
work in another. And if an organization does not wish to adopt the changes, then it just
pays a tax to better account for the social costs associated with its activities.
However, due to the lack of willingness by policymakers on all parts of the political
spectrum to do what is necessary to create a more properly functioning market – which
yields fewer social costs and greater future prosperity by mitigating the effects of
climate change – it is likely that a tax on greenhouse gases will not be established in the
near future. It is therein worth exploring second-‐best policy measures. As was indicated
in the meter readings collected for the present study, buildings where the latest energy
efficiency improvements are made significantly reduce energy use during non-‐working
hours compared to working hours. All buildings should make similar improvements. In
addition to requiring all new office buildings to meet a certain level of energy efficiency
– both in terms of materials (insulation, windows, lighting fixtures, etc.) and
technologies (automated controls for temperature, lighting, electrical outlets, printers,
etc.) – policymakers should also require any office space put on the market to meet

Behavioral opportunities for energy savings in office buildings: a London field experiment
Douglas Miller | 69
similar energy efficiency standards before it can exchange hands. Many office buildings
will thus require energy efficiency retrofits before they can be sold, leading to higher
prices for office spaces. This essentially is a roundabout way to implement a tax on
greenhouse gas emissions, under the name of ‘building standards’. While the creation of
buildings standards is less economically efficient than a carbon tax, it may be more
palatable to policymakers and therein in fact be implemented.
The recruitment and experimental process undertaken here has highlighted the
challenge of change within organizations. The forces of organizational inertia combined
with bureaucratic obstacles and feelings of reluctance among employees to adopt new
habits render behavior change measures in office buildings even more difficult that may
have been expected. Because behavior change in organizations is more difficult to
implement in practice than in theory, the easiest route to reducing the energy use
directly associated with individual behavior is to remove the ‘behavior’ from the
equation. For instance, in the case of the present experiment, were monitors to turn off
entirely on their own without needing the power button to be pressed than the
behavior change targeted in the experiment would become irrelevant. There would be
nothing left to change; the energy would be saved through the technological
improvement. Similarly, the use of automated temperature settings, lighting controls,
printer settings, and electrical outlet timers would reduce the need for behavior change
in office settings. These technical switches would likely be installed by organizations
should a tax be established for greenhouse gases. Otherwise, they should be included
within the proposed office building standards requirements for new and existing
buildings.
The recruitment and experimental process in the present study indicated that
organizations – no matter how much they may or may not like the sound of behavior
change – shirk to wholeheartedly embrace behavior change measures. It was certainly
the case that universities and public sector organizations were much more receptive to
being involved in the experiment in comparison to private sector organizations. From

Behavioral opportunities for energy savings in office buildings: a London field experiment
Douglas Miller | 70
the various conversations that took place with representatives of universities and public
sector organizations, it appeared that these organizations place greater value on the
need to reduce greenhouse gas emissions and reduce operating costs, even if these
reductions are relatively small and achieved in relatively ‘boring’ ways. It seemed that
these organizations were eager to find ways to reduce costs, especially if the cost
reductions measures were ‘free’ in financial terms. The recruitment results may thereby
compel a favorable opinion of the functioning of universities and public sector
organizations, while also an unfavorable opinion of the lacking participation among
private sector organizations. Perhaps because universities and governments increasingly
have their own CO2 emission reduction targets helps explain why they are making more
efforts to reduce emissions and related costs. However, an increasing number of private
sector organizations – including many of those that did not participate in this study –
also have their own internally set CO2 emission reduction targets and aims to reduce
waste throughout their organization. This then suggests several potential explanations
for a lack of interest by private sector organizations to participate in the experiment.
One may then conclude that perhaps private sector organizations are confident that
they already have in place best practices in terms of efficient use of resources in their
office buildings, that they place much more emphasis on increasing revenues than
reducing costs in evaluating their bottom line and do not want to distract employees
from core tasks, that they have realized the difficulties associated with organizational
change and decided it was not worth investing time and effort in behavior change
measures, that they find the energy use and cost savings from behavior change to be
meager in comparison to those associated with new technologies and thus not worth
adopting, and/or perhaps that behavior change is simply not sufficiently exciting to
warrant attention. Nevertheless, whatever the rationale, the lack of expressed interest
by private sector organizations was stark.
Yet the experiment revealed the interesting result that there are few differences in the
impact of energy saving – in this case, behavioral – measures once they were
implemented. Strategies that sought to create new expectations and norms among

Behavioral opportunities for energy savings in office buildings: a London field experiment
Douglas Miller | 71
employees in private sector, public sector, and university buildings led to significant
reductions in the targeted wasteful energy practice. This suggests that for at least some
behavior change measures that the impact will be similar across sectors. The lack of
receptivity in the recruitment and experimental process should thus be the center of
focus; the focus should be placed on how to effectively spur widespread energy saving
measures in office buildings. This signal does not appear to reflect the scale of impact of
energy saving measures. Because it appeared in the recruitment process that
organizations have largely plateaued in the efforts they are willing to make on their own
to reduce greenhouse gas emissions, it seems that an external force – primarily, law – is
essential to capture the full scale of opportunities to address climate change through
energy efficiency.
Voluntary efforts are insufficient on their own to compel the change needed to alleviate
the scale and scope of the expected impacts from climate change. There is a dire and
justifiable need for strong, expansive policy measures that better resolve the collective
action problem known as climate change and provide public goods like environmental
quality. The point of having a government in the first place is to address those – and
primarily those – situations where no individuals have the direct interest to contribute,
yet where if no one contributes then everyone is worse off. If it is not possible for
government action to be made to resolve collective action problems and provide public
goods that directly supports the foundation upon which all of society rests, then one
should doubt the legitimacy of government and its institutions.

Behavioral opportunities for energy savings in office buildings: a London field experiment
Douglas Miller | 72
Conclusions Small interventions in office buildings can compel dramatic change in behavior
associated with energy use. With a minimal set of conditions being met – i.e. by creating
a new choice context, which in the case of the present experiment involved employee
expectations and workplace norms – behavior change measures can bring about energy
saving behavior.
Organizations appear to be generally failing to capture the low-‐hanging fruit of energy
savings. There exist behavioral opportunities to reduce energy use in office buildings,
especially during the non-‐working hours when they are empty, that organizations could
– and should – fully seize but at present are not. The question therein becomes how
best to encourage organizations to capture these savings so that they reduce energy use
and associated negative externalities such as greenhouse gas emissions. Based on the
observations made both during the recruitment and experimental process suggest that
efforts by organizations to address energy use have plateaued. Policymakers (and other
stakeholders) should find ways to ensure that organizations reduce energy use,
especially the often ‘free’ or minimal cost low-‐hanging fruit that organizations do not
even appear to be fully capturing.
While organizations are composed of a unique set of individuals and vary in the way
they go about their work, there are certain components of behavior change measures
conducive to increasing adoption rates as well as their ‘stickiness’, or their endurance
over time. People will behave in relation to the context of their respective
organization’s workplace culture and thus it is unlikely for a large share of employees to
capture behavioral opportunities for energy savings in office buildings in a context
where energy use fails to be salient or important. Similarly, by bringing about a new
context wherein energy use is salient and important it is likely that organizations can
facilitate energy saving behaviors.

Behavioral opportunities for energy savings in office buildings: a London field experiment
Douglas Miller | 73
Behavioral interventions involving a social dimension (such as norms and socially
oriented feedback) that modify what people expect of each other and what each
individual thinks others expect of them – and therefore bring about a new decision-‐
making context – appear to be likely to facilitate lasting behavior change. Even though
the way in which an organization might go about making existing pro-‐environmental
behavioral norms salient or facilitating new pro-‐environmental behavioral norms in an
office setting may very well differ, the need to engage in these types of actions is critical
across all organizations to reduce energy use and related greenhouse gas emissions.
Should the objective be to instill lasting behavior change, it is therein essential that
interventions directly address the values, meanings, and expectations that shape the
context of individual decision-‐making in the office. Otherwise – as is at present most
often the case with the general approach pursued by organizations to encourage pro-‐
environmental behaviors – the desired changes in behavior will merely be adopted by a
fraction of employees in an inconsistent fashion.
It is difficult to say exactly how further behavioral measures should be implemented to
capture energy savings. They can likely be applied to address various sources of
unnecessary energy waste existing in office buildings. The behavioral interventions used
in the present experiment provide insights such as the role of modifying employee
expectations and norms in creating a new choice context that is conducive to energy
saving behavior. However, the particularities of each potential energy saving behavior
imply that different factors should be taken into account when designing behavioral
interventions. For example, behavioral interventions associated with temperature or
lighting may involve greater coordination between employees. These questions present
an offering for future research.
The field experiment presented in this paper highlights one step that organizations can
take to reduce energy use. By creating a new set of expectations among employees,
organizations across various sectors can expect change to occur in the behaviors
associated with energy use in the workplace. There are likely other and larger measures

Behavioral opportunities for energy savings in office buildings: a London field experiment
Douglas Miller | 74
that organizations can pursue – such as investments in energy efficient technologies and
the enactment of automated controls for lighting, temperature, electrical outlets, and
office electronics – to dramatically modify relationships employees have with energy in
office buildings as well as the choice context associated with office energy use. The
potential energy savings in office buildings is therefore rife with opportunities for
further research, both in terms of how energy use can be transformed in office
environments as well as how best to ensure that such transformations are in fact
implemented by organizations.
Barring a transformational transition to non-‐carbon energy sources in the very near
future, energy efficiency rests at the core of climate change mitigation strategies. Yet
despite widespread knowledge about how to save energy, the availability of energy
saving technologies, and broad support to adopt energy efficiency measures,
organizations are failing to capture the low-‐hanging fruit of climate change mitigation.
The clock keeps ticking with each passing day as the accumulation of greenhouse gases
in the atmosphere continues due to fossil fuel-‐based energy sources and as the period
of time passes in which mitigation strategies like energy efficiency will have their
greatest impact. It seems quite clear that strong policy measures such as a tax on
greenhouse gases or, as a second-‐best approach, greater energy efficiency requirements
for both new and existing office buildings are needed to catalyze the adoption of the
vast array of mitigation strategies currently available. Otherwise the positive impacts
associated with the low-‐hanging fruit of climate change mitigation may very well sour
over time and therein demand a larger scale of adaptation measures to be taken than
should be necessary.

Behavioral opportunities for energy savings in office buildings: a London field experiment
Douglas Miller | 75
References (2013) Culture of purpose: A business imperative -‐ 2013 core beliefs & culture survey. Deloitte.
(2012) Buildings Energy Data Book -‐ Chapter 3: Commercial Sector. [Online] US Department of Energy (DOE). Available from: http://buildingsdatabook.eren.doe.gov/ChapterIntro3.aspx [Accessed 28 May 2013].
(2012) Sustainable Energy for All: Opportunities for the Professional Services Industry. Accenture.
(2012) World Energy Outlook 2012. Paris, International Energy Agency.
Allcott, H. & Mullainathan, S. (2010-‐a) Behavior and Energy Policy. Science Magazine. 327, 1204.
Allcott, H. & Mullainathan, S. (2010-‐b) Behavioral Science and Energy Policy. 1.
Attari, S., DeKay, M. & Davidson, C. & de Bruin, W. (2011) Changing Household Behaviors to Curb Climate Change: How Hard Can it Be? Sustainability. 4 (1), 9.
Azar, E. & Menassa, C. (2012) A comprehensive analysis of the impact of occupancy parameters in energy simulation of office buildings. Energy and Buildings. 55, 841.
Barlow, S. & Fiala, D. (2007) Occupant comfort in UK offices -‐ How adaptive comfort theories might influence future low energy office refurbishment strategies. Energy and Buildings. 39, 837.
Bicchieri, C. (2006) The Grammar of Society -‐ The Nature and Dynamics of Social Norms. Cambridge, Cambridge University Press.
Bonini, S. (2011) McKinsey Global Survey results: The business of sustainability. McKinsey & Co.
Bonini, S. & Görner, S. (2011) The business of sustainability: Putting it into practice. McKinsey & Co.
Bouton, S., Creyts, J., Kiely, T. & Livingston, J. & Naucler, T. (2010) Energy efficiency. A compelling global resource. McKinsey & Co.
Brown, Z., Johnstone, N., Hascic, I. & Vong, L. & Barascud, F. (2012) Testing the Effect of Defaults on the Thermostat Settings of OECD Employees. OECD Environment Working Papers/OECD Publishing. 51.
Cabinet Office – Behavioral Insights Team. (2011) Behaviour Change and Energy Use. Department of Energy and Climate Change, & Department for Communities and Local Government.

Behavioral opportunities for energy savings in office buildings: a London field experiment
Douglas Miller | 76
Carbon Smart & Ricardo-‐AEA. (2013) UK Government conversion factors for Company Reporting. 1 Defra / DECC.
Carrico, A. & Riemer, M. (2011) Motivating energy conservation in the workplace: An evaluation of the use of group-‐level feedback and peer education. Journal of Environmental Psychology. 31, 1.
Chatterton, T. & Wilson, C. RAND Europe (ed.) (2012) What Works in Changing Energy-‐Using Behaviours in the Home? A Rapid Evidence Assessment. UK Department of Energy & Climate Change (DECC).
Colmenar-‐Santos, A., de Lober, L. & Borge-‐Diez, D. & Castro-‐Gil, M. (2013) Solutions to reduce energy consumption in the management of large buildings. Energy and Buildings. 56, 66.
Conger, J. & Kanungo, R. & Memon, S. (2000) Charismatic Leadership and Follower Effects. Journal of Organizational Behavior. 21 (7), 747.
Crawley, M. (2007) Proportion Data. In: Anonymous The R Book. Chichester, England, John Wiley & Sons, Ltd. pp. 569.
Creyts, J. & Granade, H. & Ostrowski, K. (2010) US energy savings: Opportunities and challenges. Climate Change Special Initiative McKinsey & Co.
Darnton, A. (2008) Reference Report: An overview of behaviour change models and their uses. Centre for Sustainable Development, University of Westminster, Government Social Research.
Davis-‐Peccoud, J. & Allen, J. & Artabane, M. (2013) The big green talent machine. Bain & Company.
de Wilde, P. & Tian, W. (2010) Predicting the performance of an office under climate change: A study of metrics, sensitivity and zonal resolution. Energy and Buildings. 42, 1674.
Department for Food, Environment and Rural Affairs (Defra). (2013) Greenhouse Gas Conversion Factor Repository. [Online] Available from: http://www.ukconversionfactorscarbonsmart.co.uk/ [Accessed 02/07/2013].
Dietz, T., Gardner, G., Gilligan, J. & Stern, P. & Vandenbergh, M. (2009) Household actions can provide a behavioural wedge to rapidly reduce US carbon emissions. Proceedings of the National Academy of Sciences of the United States of America. 106 (44), 18452.
Dolan, P., Hallsworth, M., Halpern, D. & King, D. & Vlaev, I. (2009) MINDSPACE: Influencing behaviour through public policy. London, Cabinet Office, Institute for Government.
Farrell, D. & Remes, J. (2008) How the world should invest in energy efficiency. McKinsey & Co.
Farrell, D. & Nyquist, S. & Rogers, M. (2007) Curbing the growth of global energy demand. McKinsey & Co.

Behavioral opportunities for energy savings in office buildings: a London field experiment
Douglas Miller | 77
Goldstein, J. & Cialdini, R. & Griskevicius, V. (2008) A Room with a Viewpoinnt: Using Social Norms to Motivate Environmental Conservation in Hotels. Journal of Consumer Research. 35 (3), 472.
Guarraia, P. & Saenz, H. & Fallas, E. (2012) Sustained cost transformation: Delivering savings that stick. Bain & Company.
Hatherall, R. & Azzarello, D. & Debruyne, F. (2012) The chemistry of engagement. Bain & Company.
Herkel, S. & Knapp, U. & Pfafferott, J. (2008) Towards a model of user behaviour regarding the manual control of windows in office buildings. Building and Environment. 43, 588.
Johnson, E., Shu, S., Dellaert, B., Fox, C., Goldstein, D., Häubl, G., Larrick, R., Payne, J., Peters, E., Schkade, D. & Wansink, B. & Weber, E. (2012) Beyond nudges: Tools of a choice architecture. Marketing Letters. 23, 487.
Johnson, S. Communicating sustainability: lessons from public health. The Guardian.
Kahneman, D. (2011) Thinking, Fast and Slow. New York, Farrar, Straus and Giroux.
Keenan, P., Powell, K., Kurstjens, H., Shanahan, M. & Lewis, M. & Bussetti, M. (2012) Changing Change Management: A Blueprint That Takes Hold. Boston Consulting Group.
Kok, G., Lo, S. & Peters, G. & Ruiter, R. (2011) Changing energy-‐related behavior: An Intervention Mapping approach. Energy Policy. 39, 5280.
Korolija, I., Marjanovic-‐Halburd, L. & Zhang, Y. & Hanby, V. (2013) UK office buildings archetypal model as methodological approach in development of regression models for predicting building energy consumption from heating and cooling demands. Energy and Buildings. 60, 152.
Kunreuther, H. & Weber, E. (2012) Facilitating and Aiding Human Decisions to Adapt to or Mitigate the Impacts of Climate Change. To be Published. [Preprint].
Lakeridou, M., Ucci, M. & Marmot, A. & Ridley, I. (2012) The potential of increasing cooling set-‐points in air-‐conditioned offices in the UK. Applied Energy. 94, 338.
Lo, S. & Peters, G. & Kok, G. (2012-‐a) A Review of Determinants of and Interventions for Proenvironmental Behaviors in Organizations. Journal of Applied Social Psychology. 42 (12), 2933.
Lo, S. & Peters, G. & Kok, G. (2012-‐b) Energy-‐Related Behaviors in Office Buildings: A Qualitative Study on Individual and Organisational Determinants. Applied Psychology. 61 (2), 227.
Lockton, D., Harrison, D., Cain, R. & Stanton, N. & Jennings, P. (2013) Exploring Problem-‐framing through Behavioural Heuristics. International Journal of Design. 7 (1).

Behavioral opportunities for energy savings in office buildings: a London field experiment
Douglas Miller | 78
Lopes, M. & Antunes, C. & Martins, N. (2012) Energy behaviours as promoters of energy efficiency: A 21st century review. Renewable and Sustainable Energy Reviews. 16, 4095.
Loveday, D., Bhamra, T., Tang, T. & Holmes, M. & Green, R. (2008) The energy and monetary implications of the '24/7' 'always on' society. Energy Policy. 36, 4639.
Masoso, O. & Grobler, L. (2010) The dark side of occupants’ behaviour on building energy use . Energy and Buildings. 42, 173.
Metz, B., Davidson, O., Bosch, P. & Dave, R. & Meyer, L. (2007) Contribution of Working Group III to the Fourth Assessment Report of the Intergovernmental Panel on Climate Change, 2007. Cambridge, UK and New York, USA, Cambridge University Press.
Metzger, I. & Kandt, A. & van Geet, O. (2011) Plug Load Behavioral Change Demonstration Project. Golden, Colorado, Pacific Northwest National Laboratory, National Renewable Energy Laboratory (NREL).
Miller, D. (2012) A Study on Sustainable Behavior Inducement: The Role of Information and Feedback. Student Perspectives on Institutions, Choices, & Ethics – University of Pennsylvania.7, 7. Available from: http://www.sas.upenn.edu/ppe/Students/documents/SPICE_FINAL_May2.AY11-‐12.pdf.
Nesse, R., Baechler, M. & Roberts, C. & McDermott, J. (2011) Achieving Energy Efficiency Through Real-‐Time Feedback. Richland, Washington, Pacific Northwest National Laboratory.
Nguyen, T. & Aiello, M. (2013) Energy intelligent buildings based on user activity: A survey. Energy and Buildings. 56, 244.
Nisiforou, O. & Poullis, S. & Charalambides, A. (2012) Behavior, attitudes and opinion of large enterprise employees with regard to their energy use habits and adoption of energy saving measures. Energy and Buildings. 55, 299.
Owens, S. & Driffill, L. (2008) How to change attitudes and behaviours in the context of energy. Energy Policy. 36, 4412.
Pellegrini-‐Masini, G. & Leishman, C. (2011) The role of corporate reputation and employees' value in the uptake of energy efficiency in office buildings. Energy Policy. 39, 5409.
Peloza, J., Loock, M. & Cerruti, J. & Muyot, M. (2012) Sustainability: How Stakeholder Perceptions Differ from Corporate Reality. California Management Review. 55 (1), 74.
Pfafferott, J. & Herkel, S. (2007) Statistical simulation of user behaviour in low-‐energy office buildings. Solar Energy. 81, 676.
Pino, A., Bustamante, W. & Escobar, R. & Pino, F. (2012) Thermal and lighting behavior of office buildings in Santiago of Chile. Energy and Buildings. 47, 441.

Behavioral opportunities for energy savings in office buildings: a London field experiment
Douglas Miller | 79
Robinson, L. (2012) Bringing it all together: The uses of theory. In: Anonymous Changeology. Totnes, UK, Green Books. pp. 236.
Robinson, L. How the science of behaviour change can help with sustainability. The Guardian, Sustainable Business Network.
Robinson, L.Email interview Miller, D., 27 May 2013.
Roetzel, A. & Tsangrassoulis, A. (2012) Impact of climate change on comfort and energy performances in offices. Building and Environment. 57, 349.
Schweiker, M. & Shukuya, M. (2010) Comparative effects of building envelope improvements and occupant behavioural changes on the exergy consumption for heating and cooling . Energy Policy. 38, 2976.
Semenza, J. & Ploubidis, G. & George, L. (2011) Climate change and climate variability: personal motivation for adaptation and mitigation. Environmental Health. 10 (46), 1.
Shogren, J. (2012) Behavioural Economics and Environmental Incentives. OECD Environment Working Papers, no. 49, OECD Publishing.
Shove, E. (2010) Beyond the ABC: climate change policy and theories of social change. Environment and Planning A. 42 (6), 1273.
Steg, L. & Vlek, C. (2009) Encouraging pro-‐environmental behaviour: An integrative review and research agenda . Journal of Environmental Psychology. 29, 309.
US Department of Energy (DOE). (2008) Energy Efficiency Trends in Residential and Commercial Buildings. Energy Efficiency and Renewable Energy.
Van Dyne, L. & Pierce, J. (2004) Psychological Ownership and Feelings of Possession: Three Field Studies Predicting Employee Attitudes and Organizational Citizenship Behavior. Journal of Organizational Behavior. 25 (4), 439.
Wang, L. & Mathew, P. & Pang, X. (2012) Uncertainties in energy consumption introduced by building operations and weather for a medium-‐size office building. Energy and Buildings. 53, 152.
Webber, C., Robertson, J., McWhinney, M., Brown, R. & Pinckard, M. & Busch, J. (2006) After-‐hours Power Status of Office Equipment in the USA. Berkeley, CA, Energy Analysis Department, Environmental Energy Technologies Division, Lawrence Berkeley National Laboratory.
World Business Council for Sustainable Development. (2009) Transforming the Market: Energy Efficiency in Buildings.
Yun, G., Kong, H. & Kim, H. & Kim, J. (2012) A field survey of visual comfort and lighting energy consumption in open plan offices. Energy and Buildings. 46, 146.

Behavioral opportunities for energy savings in office buildings: a London field experiment
Douglas Miller | 80
Zhang, Y. & Barrett, P. (2012) Factors influencing occupants’ blind-‐control behaviour in a naturally ventilated office building. Building and Environment. 54, 137.
Zografakis, N. & Karyotakis, K. & Tsagarakis, K. (2012) Implementation conditions for energy saving technologies and practices in office buildings: Part 1. Lighting. Renewable and Sustainable Energy Reviews. 16, 4165.

Behavioral opportunities for energy savings in office buildings: a London field experiment
Douglas Miller | 81
Appendix I – Figures from background research Data from US Department of Energy’s Buildings Energy Data Book, 2012
Figure A: US primary energy consumption, by type
Figure B: Share of US primary energy consumption, by type
0% 10% 20% 30% 40% 50% 60% 70% 80% 90%
100%
1980 1985 1990 1995 2000 2005 2010
% of US Primary Energy Consump]on
Residenxal Commercial Industry Transportaxon
0%
5%
10%
15%
20%
25%
30%
35%
40%
45%
1980 1990 2000 2010
% share of US primary energy consump]on
Residenxal buildings Commercial buildings Industry Transportaxon

Behavioral opportunities for energy savings in office buildings: a London field experiment
Douglas Miller | 82
Figure C: Commercial buildings electricity consumption
Figure D: 2010 Commercial buildings energy consumption, by end use
0%
20%
40%
60%
80%
100%
0
3
6
9
12
15
1980 1990 2000 2005 2010
% share of total commercial building energy consump]on
Electriity use, quadrillion Btu
Total electricity use, quadrillion Btu
% share of total commercial building energy consumpxon
0
1
2
3
4
Quadrillion Btu
End use
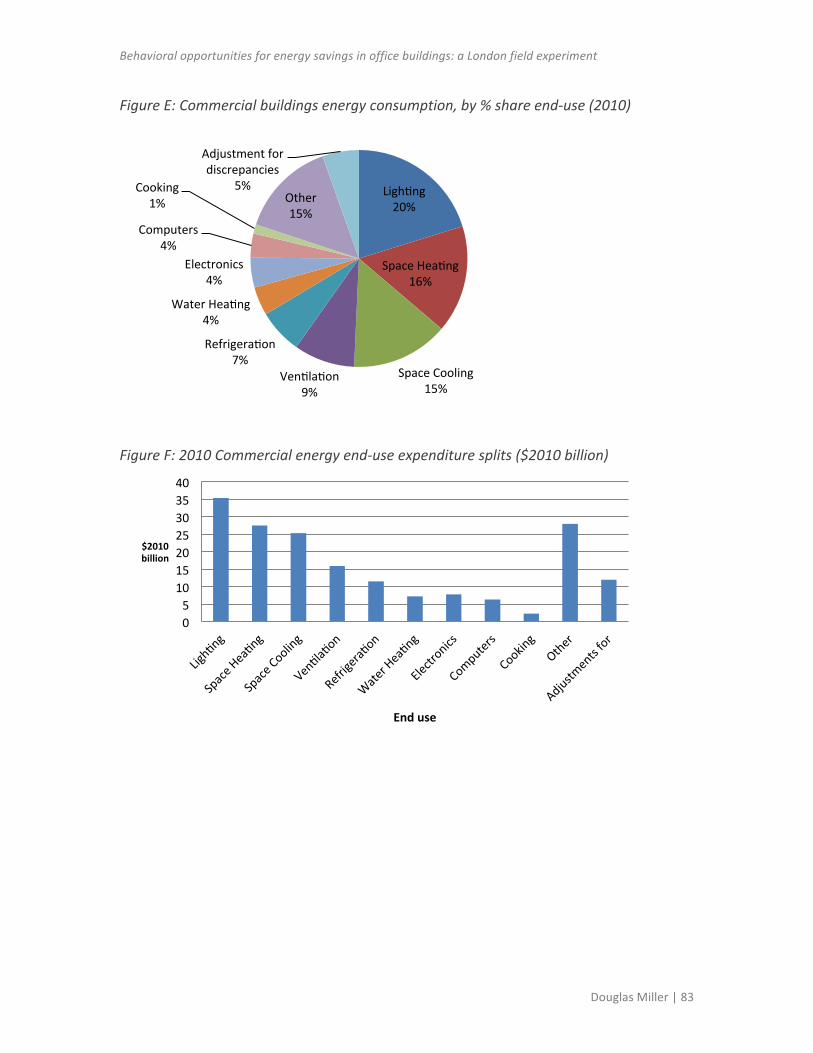
Behavioral opportunities for energy savings in office buildings: a London field experiment
Douglas Miller | 83
Figure E: Commercial buildings energy consumption, by % share end-‐use (2010)
Figure F: 2010 Commercial energy end-‐use expenditure splits ($2010 billion)
Lighxng 20%
Space Heaxng 16%
Space Cooling 15%
Venxlaxon 9%
Refrigeraxon 7%
Water Heaxng 4%
Electronics 4%
Computers 4%
Cooking 1% Other
15%
Adjustment for discrepancies
5%
0 5 10 15 20 25 30 35 40
$2010 billion
End use

Behavioral opportunities for energy savings in office buildings: a London field experiment
Douglas Miller | 84
Figure G: Commercial buildings energy expenditures, by % share end-‐use (2010)
Figure H: CO2 emissions from US commercial buildings energy consumption
Lighxng 20%
Space Heaxng 15%
Space Cooling 14%
Venxlaxon 9%
Refrigeraxon 6%
Water Heaxng 4%
Electronics 4%
Computers 4%
Cooking 1%
Other 16%
Adjustments for discrepancies
7%
0
200
400
600
800
1,000
1,200
1980 1990 2000 2005 2010
Million metric tons

Behavioral opportunities for energy savings in office buildings: a London field experiment
Douglas Miller | 85
Figure I: Commercial buildings energy end-‐use CO2 emissions, by end-‐use (2010)
Figure J: Commercial buildings energy end-‐use CO2 emissions, by % share of total (2010)
0
50
100
150
200
250
Million metric tons
End Use
Lighxng 20%
Space Heaxng 15%
Space Cooling 15%
Venxlaxon 9%
Refrigeraxon 7%
Electronics 4%
Water Heaxng 4%
Computers 4%
Cooking 1%
Other 15%
Adjust to SEDS* 6%

Behavioral opportunities for energy savings in office buildings: a London field experiment
Douglas Miller | 86
Figure K: Energy expenditures per square foot of office floor space ($2010/SF)
Figure L: Office buildings delivered energy end-‐use intensities, by building activity
0.00
0.50
1.00
1.50
2.00
2.50
3.00
3.50
Medical Offices
Financial Offices
Corporate Facilixes
Class A Class B Class C
$2010 per square foot
Of#ice type
0 5
10 15 20 25 30 35
Thousand Btu per square foot
End use

Behavioral opportunities for energy savings in office buildings: a London field experiment
Douglas Miller | 87
From Nguyen & Aiello (2013)
Figure M: Energy-‐unaware behavior uses twice as much energy as the minimum that can be achieved
(Nguyen & Aiello, 2013: p. 246)
Figure N: Energy saving potential
(Nguyen & Aiello, 2013: p. 251)

Behavioral opportunities for energy savings in office buildings: a London field experiment
Douglas Miller | 88
From Lopes et al. (2012)
Figure O: Potential behavioral energy savings and reduced emissions in residential and services buildings
(Lopes et al, 2012: p. 4099)

Behavioral opportunities for energy savings in office buildings: a London field experiment
Douglas Miller | 89
From Wang et al. (2012)
Figure P: Range of practice in building operations for a medium-‐size office building
(Wang et al, 2012: p. 154)
Figure Q: Uncertainties in annual site energy consumption by category
(Wang et al, 2012: p. 157)

Behavioral opportunities for energy savings in office buildings: a London field experiment
Douglas Miller | 90
Literature review A summary of the general themes from prior behavior change research, as applicable to
an office building setting, is presented below. Several of the themes directly served as
inspiration for the behavior change interventions developed for a field experiment
conducted in London office buildings.
Figure R: Themes from literature review General themes from the literature review
1. Tailored approach that fit for the people and organization involved 2. Emphasizing convenience: making change easy 3. Limiting the cognitive demand of behavioral changes 4. Utilizing heuristics and other cognitive biases in favor of behavior change 5. Leading change efforts with a non-‐prescriptive approach 6. Creating an enabling choice environment with conditions favorable to new
behaviors/habits 7. Showing the value of change and building a mission around it 8. Engaging actors directly through a team-‐based approach 9. Tying behavior change along with other changes/disruptions that may take place 10. Using participatory methods for decision-‐making and intervention design 11. Establishing new office norms as the glue which hold together the changes in behavior 12. Benefitting from the cost-‐effectiveness of the intervention 13. Engaging employees and establishing notions of (cognitive) ownership 14. Instilling notions of self-‐efficacy among employees 15. Mapping the barriers and related interventions 16. Barriers as both external and internal constructs 17. Providing active feedback and support to actors involved in intervention 18. Delineating the role of employees and mitigating pluralistic ignorance 19. Understanding the situation in the workplace from the actors’ perspective 20. Staying without the bounds of the actors’ tolerance for interventions 21. Building support/trust and engaging with both promoters and detractors 22. Setting realistic expectations 23. Attending to the desire for consistency and aversion of cognitive dissonance 24. Rehearsing new behaviors
Themes specifically from previous experiments on energy related behavior change in office buildings
1. Occupant behaviors significantly affect office building energy use 2. Occupant behaviors lead to significant variations from intended energy use for office
buildings 3. Behavior change measures to reduce energy use bear little to no financial costs to adopt 4. Opportunities for energy savings through behavior change vary based on climate as well
as the size and composition of the office building 5. While technological solutions typically lead to larger energy savings, behavior change
measures are also achieve significant energy savings

Behavioral opportunities for energy savings in office buildings: a London field experiment
Douglas Miller | 91
6. Potential energy reductions in office buildings can reach 35 percent of current consumption
7. Non-‐work hours as a major opportunity to reduce energy use in office buildings 8. An additional opportunity to reduce energy use during work hours when people leave
their work station 9. Group-‐level feedback facilitates energy saving behavior 10. Peer educators (‘coaches’) facilitate energy saving behavior 11. Moderate changes more likely to remain in place and be supported than drastic changes 12. Preference towards strategies promoting the adoption of new energy saving behaviors
rather than the reduction of wasteful energy behaviors 13. Behavioral interventions more likely to succeed when compatible with/supportive of
work-‐related interests of employees 14. Communication of desired behavior change must be clear, consistent and involve direct
feedback 15. Interventions targeting office norms increase the likelihood of success 16. Potential need to tailor behavioral interventions to engage different personality types
found in the office 17. Crucial role of physical comfort among employees while in the office and their
receptivity to/support of behavior change measures 18. Potential opportunity to develop energy saving interventions that focus on increasing
employees’ physical comfort and productivity

Behavioral opportunities for energy savings in office buildings: a London field experiment
Douglas Miller | 92
From Lockton et al. (2013)
Figure S: Possible heuristics, and design implications, extracted by workshop participants
(Lockton et al, 2013: p. 11)

Behavioral opportunities for energy savings in office buildings: a London field experiment
Douglas Miller | 93
From Allcott & Mullainathan (2010-‐b)
Figure T: Example of Opower social comparison letter
(Allcott & Mullainathan, 2010-‐b: p. 16)
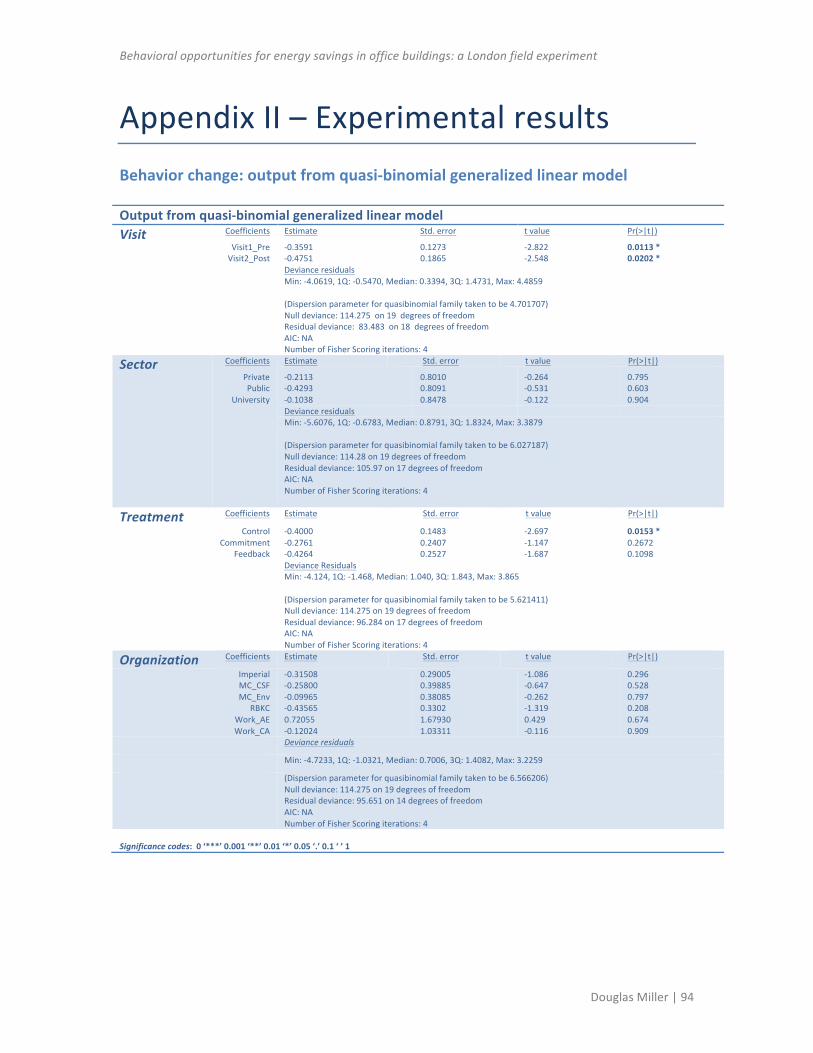
Behavioral opportunities for energy savings in office buildings: a London field experiment
Douglas Miller | 94
Appendix II – Experimental results Behavior change: output from quasi-‐binomial generalized linear model Output from quasi-‐binomial generalized linear model Visit Coefficients
Visit1_Pre Visit2_Post
Estimate Std. error t value Pr(>|t|)
-‐0.3591 -‐0.4751
0.1273 0.1865
-‐2.822 -‐2.548
0.0113 * 0.0202 *
Deviance residuals Min: -‐4.0619, 1Q: -‐0.5470, Median: 0.3394, 3Q: 1.4731, Max: 4.4859 (Dispersion parameter for quasibinomial family taken to be 4.701707) Null deviance: 114.275 on 19 degrees of freedom Residual deviance: 83.483 on 18 degrees of freedom AIC: NA Number of Fisher Scoring iterations: 4
Sector Coefficients
Private Public
University
Estimate Std. error t value Pr(>|t|)
-‐0.2113 -‐0.4293 -‐0.1038
0.8010 0.8091 0.8478
-‐0.264 -‐0.531 -‐0.122
0.795 0.603 0.904
Deviance residuals Min: -‐5.6076, 1Q: -‐0.6783, Median: 0.8791, 3Q: 1.8324, Max: 3.3879 (Dispersion parameter for quasibinomial family taken to be 6.027187) Null deviance: 114.28 on 19 degrees of freedom Residual deviance: 105.97 on 17 degrees of freedom AIC: NA Number of Fisher Scoring iterations: 4
Treatment Coefficients Estimate Std. error t value Pr(>|t|)
Control Commitment
Feedback -‐0.4000 -‐0.2761 -‐0.4264
0.1483 0.2407 0.2527
-‐2.697 -‐1.147 -‐1.687
0.0153 * 0.2672 0.1098
Deviance Residuals Min: -‐4.124, 1Q: -‐1.468, Median: 1.040, 3Q: 1.843, Max: 3.865
(Dispersion parameter for quasibinomial family taken to be 5.621411) Null deviance: 114.275 on 19 degrees of freedom Residual deviance: 96.284 on 17 degrees of freedom AIC: NA Number of Fisher Scoring iterations: 4
Organization Coefficients Estimate Std. error t value Pr(>|t|)
Imperial MC_CSF MC_Env
RBKC Work_AE Work_CA
-‐0.31508 -‐0.25800 -‐0.09965 -‐0.43565 0.72055 -‐0.12024
0.29005 0.39885 0.38085 0.3302 1.67930 1.03311
-‐1.086 -‐0.647 -‐0.262 -‐1.319 0.429 -‐0.116
0.296 0.528 0.797 0.208 0.674 0.909
Deviance residuals
Min: -‐4.7233, 1Q: -‐1.0321, Median: 0.7006, 3Q: 1.4082, Max: 3.2259
(Dispersion parameter for quasibinomial family taken to be 6.566206) Null deviance: 114.275 on 19 degrees of freedom Residual deviance: 95.651 on 14 degrees of freedom AIC: NA Number of Fisher Scoring iterations: 4
Significance codes: 0 ‘***’ 0.001 ‘**’ 0.01 ‘*’ 0.05 ‘.’ 0.1 ‘ ’ 1

Behavioral opportunities for energy savings in office buildings: a London field experiment
Douglas Miller | 95
Electricity meter readings: output from general linear model Output from general linear model
Coefficients
(Intercept) OrganizationMC
OrganizationRBKC InterventionY HoursWork
Days OrganizationMC:InterventionY
OrganizationRBKC:InterventionY OrganizationMC:HoursWork
OrganizationRBKC:HoursWork InterventionY:HoursWork
OrganizationMC:Days OrganizationRBKC:Days
InterventionY:Days HoursWork:Days
OrganizationMC:InterventionY:Hours:Work OrganizationRBKC:InterventionY:HoursWork
OrganizationMC:InterventionY:Days OrganizationRBKC:InterventionY:Days
OrganizationMC:HoursWork:Days OrganizationRBKC:HoursWork:Days
InterventionY:HoursWork:Days OrganizationMC:InterventionY:HoursWork:Days
OrganizationRBKC:InterventionY:HoursWork:Days Deviance residuals Min: -‐291.333, 1Q: -‐4.691, Median: 2.449, 3Q: 11.689, Max: 153.656 Residual standard error: 62.14 on 204 degrees of freedom Multiple R-‐squared: 0.7481, Adjusted R-‐squared: 0.7197 F-‐statistic: 26.34 on 23 and 204 DF, p-‐value: < 2.2e-‐16
Estimate
63.56667 31.57368 62.13018 5.28246 -‐2.32456 -‐0.48140 -‐34.14035 29.47491 -‐13.98947 290.38316 -‐8.66140 -‐0.09316 -‐0.25333 -‐0.11561 0.63772 22.06491 -‐50.19702 0.76088 -‐0.03560 0.42579 -‐5.50747 0.02140 -‐0.06754 -‐0.60935
Std. error t value Pr(>|t|)
29.67488 41.96662 41.96662 41.96662 41.96662 2.60266 59.34977 59.34977 59.34977 59.34977 59.34977 3.68072 3.68072 3.68072 3.68072 83.93325 83.93325 5.20532 5.20532 5.20532 5.20532 5.20532 7.36143 7.36143
2.142 0.752 1.480 0.126 -‐0.055 -‐0.185 -‐0.575 0.497 -‐0.236 4.893 -‐0.146 -‐0.025 -‐0.069 -‐0.031 0.173 0.263 -‐0.598 0.146 -‐0.007 0.082 -‐1.058 0.004 -‐0.009 -‐0.083
0.0334 * 0.4527 0.1403 0.9000 0.9559 0.8534 0.5658 0.6200 0.8139 2.02e-‐06 *** 0.8841 0.9798 0.9452 0.9750 0.8626 0.7929 0.5505 0.8839 0.9946 0.9349 0.2913 0.9967 0.9927 0.9341
Significance codes: 0 ‘***’ 0.001 ‘**’ 0.01 ‘*’ 0.05 ‘.’ 0.1 ‘ ’ 1

Behavioral opportunities for energy savings in office buildings: a London field experiment
Douglas Miller | 96
Electricity meter readings: RBKC and Merton Council data Organization Treatment Days Hours Reading Monitors RBKC Y 1 Work 430.31 317 RBKC Y 2 Work 426.77 317 RBKC Y 3 Work 401.65 317 RBKC Y 4 Work 168.31 317 RBKC Y 5 Work 139.72 317 RBKC Y 6 Work 416.09 317 RBKC Y 7 Work 436.56 317 RBKC Y 8 Work 427.96 317 RBKC Y 9 Work 419.37 317 RBKC Y 10 Work 382.42 317 RBKC Y 11 Work 184.74 317 RBKC Y 12 Work 144.63 317 RBKC Y 13 Work 402.81 317 RBKC Y 14 Work 405.1 317 RBKC Y 15 Work 387.66 317 RBKC Y 16 Work 380.49 317 RBKC Y 17 Work 362.8 317 RBKC Y 18 Work 150.01 317 RBKC Y 19 Work 130.74 317 RBKC Y 1 Non 174.12 317 RBKC Y 2 Non 177.37 317 RBKC Y 3 Non 164.56 317 RBKC Y 4 Non 113.58 317 RBKC Y 5 Non 119.26 317 RBKC Y 6 Non 163.74 317 RBKC Y 7 Non 186.13 317 RBKC Y 8 Non 170.06 317 RBKC Y 9 Non 159.71 317 RBKC Y 10 Non 149.21 317 RBKC Y 11 Non 103.34 317 RBKC Y 12 Non 109.46 317 RBKC Y 13 Non 156.11 317 RBKC Y 14 Non 168.19 317 RBKC Y 15 Non 177.52 317 RBKC Y 16 Non 180.63 317 RBKC Y 17 Non 183.48 317 RBKC Y 18 Non 109.63 317 RBKC Y 19 Non 114.20 317 RBKC N 1 Work 473.23 288 RBKC N 2 Work 487.72 288 RBKC N 3 Work 456.6 288 RBKC N 4 Work 116.1 288 RBKC N 5 Work 94.4 288 RBKC N 6 Work 462.79 288 RBKC N 7 Work 480.21 288 RBKC N 8 Work 465.03 288 RBKC N 9 Work 478.87 288 RBKC N 10 Work 448.82 288 RBKC N 11 Work 148.94 288 RBKC N 12 Work 107.23 288 RBKC N 13 Work 456.31 288 RBKC N 14 Work 481.65 288 RBKC N 15 Work 474.92 288 RBKC N 16 Work 477.74 288 RBKC N 17 Work 449.99 288

Behavioral opportunities for energy savings in office buildings: a London field experiment
Douglas Miller | 97
(Continued) RBKC N 18 Work 141.66 288 RBKC N 19 Work 94.29 288 RBKC N 1 Non 131.41 288 RBKC N 2 Non 129.46 288 RBKC N 3 Non 135.53 288 RBKC N 4 Non 87.71 288 RBKC N 5 Non 84.49 288 RBKC N 6 Non 134.29 288 RBKC N 7 Non 134.75 288 RBKC N 8 Non 136.6 288 RBKC N 9 Non 143.28 288 RBKC N 10 Non 126.6 288 RBKC N 11 Non 81.5 288 RBKC N 12 Non 81.95 288 RBKC N 13 Non 132.18 288 RBKC N 14 Non 132.06 288 RBKC N 15 Non 143.54 288 RBKC N 16 Non 126.81 288 RBKC N 17 Non 132.62 288 RBKC N 18 Non 86.94 288 RBKC N 19 Non 86.92 288 MC_CSF Y 1 Work 48.1 134 MC_CSF Y 2 Work 63.9 134 MC_CSF Y 3 Work 77 134 MC_CSF Y 4 Work 49.5 134 MC_CSF Y 5 Work 55 134 MC_CSF Y 6 Work 55.1 134 MC_CSF Y 7 Work 54.4 134 MC_CSF Y 8 Work 62.9 134 MC_CSF Y 9 Work 65.1 134 MC_CSF Y 10 Work 65.1 134 MC_CSF Y 11 Work 53.3 134 MC_CSF Y 12 Work 40.9 134 MC_CSF Y 13 Work 61.8 134 MC_CSF Y 14 Work 57.5 134 MC_CSF Y 15 Work 61.3 134 MC_CSF Y 16 Work 57.6 134 MC_CSF Y 17 Work 58.1 134 MC_CSF Y 18 Work 65.7 134 MC_CSF Y 19 Work 58.9 134 MC_CSF Y 1 Non 72.8 134 MC_CSF Y 2 Non 62.9 134 MC_CSF Y 3 Non 78.6 134 MC_CSF Y 4 Non 62.6 134 MC_CSF Y 5 Non 53.8 134 MC_CSF Y 6 Non 68.1 134 MC_CSF Y 7 Non 60 134 MC_CSF Y 8 Non 62.5 134 MC_CSF Y 9 Non 72.3 134 MC_CSF Y 10 Non 63.6 134 MC_CSF Y 11 Non 64.1 134 MC_CSF Y 12 Non 54.6 134 MC_CSF Y 13 Non 67.1 134 MC_CSF Y 14 Non 57.6 134 MC_CSF Y 15 Non 58 134 MC_CSF Y 16 Non 58.1 134

Behavioral opportunities for energy savings in office buildings: a London field experiment
Douglas Miller | 98
(Continued) MC_CSF Y 17 Non 60.5 134 MC_CSF Y 18 Non 62 134 MC_CSF Y 19 Non 55.5 134 MC_CSF N 1 Work 51.7 56 MC_CSF N 2 Work 68.9 56 MC_CSF N 3 Work 78.8 56 MC_CSF N 4 Work 47.8 56 MC_CSF N 5 Work 63.1 56 MC_CSF N 6 Work 58.3 56 MC_CSF N 7 Work 61.1 56 MC_CSF N 8 Work 64 56 MC_CSF N 9 Work 70.3 56 MC_CSF N 10 Work 70.3 56 MC_CSF N 11 Work 63.9 56 MC_CSF N 12 Work 46.5 56 MC_CSF N 13 Work 63.4 56 MC_CSF N 14 Work 59.9 56 MC_CSF N 15 Work 66 56 MC_CSF N 16 Work 59.9 56 MC_CSF N 17 Work 63 56 MC_CSF N 18 Work 70.4 56 MC_CSF N 19 Work 66 56 MC_CSF N 1 Non 66.6 56 MC_CSF N 2 Non 48.4 56 MC_CSF N 3 Non 76.9 56 MC_CSF N 4 Non 55 56 MC_CSF N 5 Non 52.5 56 MC_CSF N 6 Non 64.5 56 MC_CSF N 7 Non 58.8 56 MC_CSF N 8 Non 62.2 56 MC_CSF N 9 Non 72.7 56 MC_CSF N 10 Non 62.3 56 MC_CSF N 11 Non 59.3 56 MC_CSF N 12 Non 49.8 56 MC_CSF N 13 Non 60.1 56 MC_CSF N 14 Non 51.3 56 MC_CSF N 15 Non 52.6 56 MC_CSF N 16 Non 56.5 56 MC_CSF N 17 Non 57.5 56 MC_CSF N 18 Non 58.1 56 MC_CSF N 19 Non 51.2 56 MC_Env Y 1 Work 60.6 87 MC_Env Y 2 Work 86 87 MC_Env Y 3 Work 99.6 87 MC_Env Y 4 Work 64.9 87 MC_Env Y 5 Work 79.6 87 MC_Env Y 6 Work 73.9 87 MC_Env Y 7 Work 31 87 MC_Env Y 8 Work 36.8 87 MC_Env Y 9 Work 37.1 87 MC_Env Y 10 Work 85.8 87 MC_Env Y 11 Work 85.4 87 MC_Env Y 12 Work 62.2 87 MC_Env Y 13 Work 95.8 87 MC_Env Y 14 Work 85.6 87 MC_Env Y 15 Work 85.5 87

Behavioral opportunities for energy savings in office buildings: a London field experiment
Douglas Miller | 99
(Continued) MC_Env Y 16 Work 76 87 MC_Env Y 17 Work 88.2 87 MC_Env Y 18 Work 94.2 87 MC_Env Y 19 Work 82.6 87 MC_Env Y 1 Non 82.7 87 MC_Env Y 2 Non 69.3 87 MC_Env Y 3 Non 86.5 87 MC_Env Y 4 Non 71.6 87 MC_Env Y 5 Non 63.9 87 MC_Env Y 6 Non 24 87 MC_Env Y 7 Non 18.4 87 MC_Env Y 8 Non 73.7 87 MC_Env Y 9 Non 89.6 87 MC_Env Y 10 Non 73.8 87 MC_Env Y 11 Non 76.9 87 MC_Env Y 12 Non 61.8 87 MC_Env Y 13 Non 72.7 87 MC_Env Y 14 Non 66.9 87 MC_Env Y 15 Non 64 87 MC_Env Y 16 Non 66.3 87 MC_Env Y 17 Non 73.5 87 MC_Env Y 18 Non 71.5 87 MC_Env Y 19 Non 65.7 87 MC_Env N 1 Work 66.7 138 MC_Env N 2 Work 82 138 MC_Env N 3 Work 106 138 MC_Env N 4 Work 60.9 138 MC_Env N 5 Work 83.2 138 MC_Env N 6 Work 80.2 138 MC_Env N 7 Work 83.6 138 MC_Env N 8 Work 87.2 138 MC_Env N 9 Work 94.8 138 MC_Env N 10 Work 94.8 138 MC_Env N 11 Work 83.5 138 MC_Env N 12 Work 59.8 138 MC_Env N 13 Work 89.7 138 MC_Env N 14 Work 80.3 138 MC_Env N 15 Work 82.1 138 MC_Env N 16 Work 76.3 138 MC_Env N 17 Work 89.4 138 MC_Env N 18 Work 99.2 138 MC_Env N 19 Work 90.9 138 MC_Env N 1 Non 99.4 138 MC_Env N 2 Non 87.2 138 MC_Env N 3 Non 107.9 138 MC_Env N 4 Non 89.5 138 MC_Env N 5 Non 77.3 138 MC_Env N 6 Non 96.8 138 MC_Env N 7 Non 81.9 138 MC_Env N 8 Non 89 138 MC_Env N 9 Non 104.7 138 MC_Env N 10 Non 93.5 138 MC_Env N 11 Non 89.9 138 MC_Env N 12 Non 77.3 138 MC_Env N 13 Non 92.6 138 MC_Env N 14 Non 84.1 138

Behavioral opportunities for energy savings in office buildings: a London field experiment
Douglas Miller | 100
(Continued) MC_Env N 15 Non 85 138 MC_Env N 16 Non 80.5 138 MC_Env N 17 Non 87 138 MC_Env N 18 Non 90.7 138 MC_Env N 19 Non 84.2 138