behavioral/systems/cognitive ... · behavioral/systems/cognitive...
TRANSCRIPT

Behavioral/Systems/Cognitive
Functional Networks of Parvalbumin-ImmunoreactiveNeurons in Cat Auditory Cortex
Kexin Yuan,1,2 Jonathan Y. Shih,1 Jeffery A. Winer,2 and Christoph E. Schreiner1
1Coleman Memorial Laboratory and W. M. Keck Foundation Center for Integrative Neuroscience, Department of Otolaryngology, University of California,San Francisco, California 94143, and 2Department of Molecular and Cell Biology, University of California, Berkeley, California 94720-3200
Inhibitory interneurons constitute �20% of auditory cortical cells and are essential for shaping sensory processing. Connectivity pat-terns of interneurons in relation to functional organization principles are not well understood. We contrasted the connection patterns ofparvalbumin-immunoreactive cells in two functionally distinct cortical regions: the tonotopic, narrowly frequency-tuned module [cen-tral narrow band (cNB)] of cat central primary auditory cortex (AI) and the nontonotopic, broadly tuned second auditory field (AII).Interneuronal connectivity patterns and laminar distribution were identified by combining a retrograde tracer (wheat-germ agglutininapo-horseradish peroxidase colloidal gold) with labeling of the Ca 2� binding protein parvalbumin (Pv), a marker for the GABAergicinterneurons usually described physiologically as fast-spiking neurons. In AI, parvalbumin-positive (Pv�) cells constituted 13% of theretrograde labeled cells in the immediate vicinity of the injection site, compared to 10% in AII. The retrograde labeling of Pv� cells alongisofrequency countours was confined to the cNB. The spatial spread of labeled excitatory neurons in AI was more than twice that foundfor Pv� cells. By contrast, in the AII, the spread of Pv� cells was nearly equal to that of excitatory neurons. The retrograde labeling ofPv� cells was anisotropic in AI and isotropic in AII. This demonstration of inhibitory networks in auditory cortex reveals that theconnections of cat GABAergic AI and AII cells follow different anatomical plans and thus contribute differently to the shaping of neuralresponse properties. The finding that local connectivity of parvalbumin-immunoreactive neurons in AI is closely aligned with spectralintegration properties demonstrates the critical role of inhibition in creating distinct processing modules in AI.
IntroductionUnderstanding of the mechanisms of cortical processing of sen-sory information requires an examination of the relationshipsbetween excitatory and inhibitory cortical circuitry, functionalarchitecture, and receptive field properties (Gilbert, 1993; Kisvar-day et al., 1994; Read et al., 2001; Marino et al., 2005; Katzel et al.,2011). The functional contributions of inhibitory circuits in au-ditory cortex (AC) include sharpening of frequency and intensitytuning, and shaping of spectral modulation preferences (Sugaand Manabe, 1982; Shamma and Symmes, 1985; Calford andSemple, 1995; Sutter et al., 1999; Sutter and Loftus, 2003; Wehrand Zador, 2003; Oswald et al., 2006; Wu et al., 2008). Inhibitorycircuits dynamically coordinate with excitatory circuits to shapecortical spiking activities (Wehr and Zador, 2003; Zhang et al.,2003; Wu et al., 2006; Tan et al., 2007). However, little is known
regarding how inhibitory networks are organized with respect tothe functional organization of auditory cortex.
Fast-spiking (FS) parvalbumin-positive (Pv�) inhibitory cellsrepresent the largest inhibitory subpopulation (�40%) (Tamamakiet al., 2003). Their soma and axon initial segment targeting prefer-ence (Kisvarday et al., 1993; DeFelipe, 1997; DeFelipe et al., 1999;Markram et al., 2004) and fast-spiking behavior (McCormick et al.,1985; Bruno and Simons, 2002; Andermann et al., 2004; Bartho etal., 2004; Atencio and Schreiner, 2008) allow them to provide pow-erful feedforward and feedback inhibition for rapid control over therate and timing of action potentials (Buzsaki and Eidelberg, 1981;McBain and Fisahn, 2001; Pouille and Scanziani, 2001; Jonas et al.,2004; Pouille and Scanziani, 2004; Freund and Katona, 2007). Thespecific functional roles of Pv� inhibitory neurons in the auditorycortex have not been characterized, although fast-spiking neuronsshow some general functional differences from excitatory neurons(Atencio and Schreiner, 2008). How interneuronal distributions andconnectivities are related to receptive field properties and whethercortical areas at different hierarchical levels express similar organiza-tional principles of inhibition is still poorly understood (Yuan et al.,2010). To characterize such organizations, two functionallyvery disparate areas were chosen to assess and compare localinhibitory convergence patterns: the central narrow band(cNB) spectral integration module of the cat primary auditorycortex (AIcNB) (Read et al. 2001) and the second auditory field(AII) (Schreiner and Cynader, 1984).
Physiological differences between the primary region (AI) andthe nonprimary region (AII) include disparities in tonotopicity
Received Feb. 24, 2011; revised July 15, 2011; accepted July 31, 2011.Author contributions: K.Y., J.Y.S., J.A.W., and C.E.S. designed research; K.Y., J.Y.S., and C.E.S. performed research;
K.Y., J.Y.S., and C.E.S. analyzed data; K.Y., J.Y.S., and C.E.S. wrote the paper.This work was supported by NIDCD Grants R01DC02319 (J.A.W.) and R01DC2260 (C.E.S.). We thank Peter Ohara
and Brian Malone for critical reading of this manuscript. We also thank Robert Froemke, Craig Atencio, PatrickHullett, and Tom Babcock for comments and discussions; Katie Dorsch and David Larue for technical assistance; andKatie Fink, Heejae Kang, Weichen Xu, Ramy Salah, Johnny Kwon, Sawsan Dabilt, and Andy Noblet for assistance indata collection and analysis.
The authors declare no competing financial interests.Correspondence should be addressed to Kexin Yuan, Coleman Memorial Laboratory and W. M. Keck Foundation
Center for Integrative Neuroscience, Department of Otolaryngology, University of California, San Francisco, CA94143. E-mail: [email protected].
DOI:10.1523/JNEUROSCI.1000-11.2011Copyright © 2011 the authors 0270-6474/11/3113333-10$15.00/0
The Journal of Neuroscience, September 14, 2011 • 31(37):13333–13342 • 13333

(AI � AII), response threshold (AI � AII), and their spectralintegration across broad frequency ranges (AII � AI) (Schreinerand Cynader, 1984; Schreiner and Mendelson, 1990; Pandya etal., 2008). It is likely that differences in the extent of inhibitoryinfluences contribute to frequency tuning differences. Conver-gent horizontal connections between AI subregions with simi-larly narrow frequency tuning have been demonstrated (Read etal., 2001). How inhibitory connections contribute to the functionof AI and AII is still unknown. Moreover, these fields representdifferent levels of information processing (Rouiller et al., 1991).Thus, contrasting the organization patterns of inhibitory circuitsbetween these two physiologically and hierarchically distinct re-gions may help clarify the roles of local circuits in determiningfunctional properties.
Materials and MethodsSurgical preparation. Experiments were conducted on the right hemi-spheres of six female young adult cats. Surgical preparation, stimulusdelivery, and recording procedures have been described previously(Schreiner and Mendelson, 1990) with exceptions noted below. Ket-amine hydrochloride (30 mg/kg) and acetylpromazine maleate (0.15 mg/kg) were injected intramuscularly for initial sedation. After venouscannulation, pentobarbital sodium (15–30 mg/kg, i.v.) was administeredfor surgical procedures including tracheotomy and craniotomy. Aftersurgically exposing AI and AII, lactated Ringer’s solution (1–3 ml/kg/h),ketamine HCl (1–3 mg/kg/h), and diazepam (0.5–2 mg/kg/h) solutionwere infused continuously during physiological recording to maintain anareflexic level of anesthesia. All procedures were in accordance with anexperimental protocol approved by the University of California, SanFrancisco, Institutional Animal Care and Use Committee.
Stimulus generation and delivery. Experiments were conducted in adouble-walled sound-shielded room (IAC ). Auditory stimuli were pre-sented through calibrated STAX-54 headphones, which were insertedinto the external acoustic meatus via a sealed tube. The frequency re-sponse of the system was effectively flat from 100 Hz to 14 kHz, a rangethat included the preferred frequencies of most of the neurons in thisstudy, and did not have major resonances deviating �6 dB from theaverage level. Above 14 kHz, the output rolled off at a rate of 10 dB peroctave.
Tone bursts were generated and attenuated by a Tucker-Davis Tech-nologies system. Additional attenuation was provided by a pair of passiveattenuators. The duration of the tone bursts was 50 ms, including 3 msrise and fall time. The interstimulus interval was 500 ms. Sounds werepresented at equal sound pressure levels to each ear. Frequency responseareas (FRAs) were constructed from responses to 675 tone bursts, whichwere presented in a pseudorandom sequence of different combinationsof frequency (spanning three or four octaves) and level (5–75 dB SPL).
Recording procedure. A picture of the AC surface was captured anddigitized with a CCD digital camera (Cohu). Parylene-coated tungstendouble microelectrodes (MicroProbe) with 0.5–1.0 M� impedance at 1kHz were introduced into the auditory cortex orthogonally by a remote-controlled hydraulic microdrive (David Kopf Instruments). Recordingswere made at layers IIIb and IV (�800 –1,000 �m). Effects of dimpling ofthe cortical surface from electrode insertion on the depth estimate wereminimized by overinsertion and careful retraction of the electrode. Neu-ronal activity of multiple units was amplified, bandpass filtered, anddigitized (RA16 Multi-Channel Neurophysiology Workstation; Tucker-Davis Technologies). Multiunit activity was quantified by the number ofthreshold crossings set to two to three times the background recordingnoise.
Most of the recordings were conducted along midfrequency (5–20kHz) isofrequency contours to identify spectral integration modules inAI and were extended to the ventral border of AII. For each recordingsite, three response properties were measured and extracted from FRAs(Schreiner and Sutter, 1992): minimum threshold (the minimum soundpressure level evoking a response), characteristic frequency (CF; the tonefrequency evoking a response at minimum threshold), and Q40 (CF di-
vided by FRA bandwidth at 40 dB above minimum threshold; the higherthe Q value, the narrower the spectral bandwidth). On a digital picture,recording sites with Q40 � 1.2, Q40 � 1.2–1.5, and Q40 � 1.5 weremarked. A cluster of neurons centrally located in the isofrequency do-main with Q40 � 1.5 was considered part of the AIcNB region (Read et al.,2001). The border between ventral AI and AII was estimated by theoccurrence of loss of strict tonotopy, increased minimum responsethresholds, and a further broadening of spectral bandwidth (Schreinerand Cynader, 1984). The ventral border of AII was indicated by sitesunresponsive to pure-tone stimulation.
Connectional methods. A retrograde tracer, wheat-germ agglutininapo-horseradish peroxidase colloidal gold (WAHG) (Basbaum and Me-netrey, 1987), was injected into the cNB region of AI or AII. The tracer(EY Laboratories) was concentrated by centrifugation and delivered bypressure injection (Nanoliter Injector; World Precision Instruments).Five 4.6 nl pulses were delivered through a glass micropipette (tip diam-eter, 25 �m) at four depths targeting layers III–VI (400 –1600 �m) for atotal volume of �80 –100 nl. The exposed auditory cortex was then cov-ered with silicon oil, and animals were maintained for �36 h for tracertransport. Animals were then given pentobarbital sodium (40 mg/kg,i.v.) and perfused transcardially with formalin (Shandon Zinc FormolFixx; Thermo Electron). Cortex was dissected, stereotaxically blocked,cryoprotected, and cut transversely into slices of 30 to 40 �m thickness.
Immunohistochemistry. For Pv colocalization, one of the series of fro-zen sections (40 �m thickness) was incubated in normal horse serum andthen in primary monoclonal mouse anti-parvalbumin (Swant; 1:5000)with 2% N-hydroxysuccinimide overnight at 4°C. ABC immunoperoxi-dase processing (Vector Laboratories), and diaminobenzidine histo-chemistry revealed Pv� profiles with a dark brown soma and proximaldendrites. Sections were silver intensified on the slide (Kierkegaard andPerry Laboratories) for 60 min, rinsed, and fixed in sodium thiosulfate,and then dehydrated, cleared, and coverslipped. WAHG and Pv double-labeled (DL) neurons had black cytoplasmic granules in the same focalplane as the brown-stained somata. WAHG single-labeled (SL-G) neu-rons were only indicated by a cluster of gold granules. Even sparselylabeled neurons are highly refractile in dark-field illumination; double-and single-labeled profiles were always confirmed in bright-field illumi-nation. Nissl staining of an adjacent series was conducted to identify andplot the layers.
Analysis. Pv was colocalized with the WAHG in a subset of corticalneurons. Double- and single-labeled cells were plotted across the hemi-sphere. Controls included sections incubated for Pv alone and sectionssilver intensified for the WAHG localization that produced no doublelabeling. Labeled neurons were plotted with a 40� objective on the Neu-rolucida image-analysis system (MicroBrightField). Plots of layers fromadjacent Nissl sections were superimposed onto plotted cells to identifythe laminar distribution (Yuan et al., 2010). To minimize analytical bias,cells and laminar borders were plotted by different investigators. Posi-tions of blood vessels on the surface of cortex were used to align cellularplots with physiological maps. Each layer of auditory cortex was dividedinto 200-�m-wide bins throughout each injected hemisphere for quan-titative analysis of neuronal density. Statistical tests, such as Student’s ttest, one-way ANOVA, and the multiple comparison test, were per-formed with MATLAB and included corrections for multiple compari-sons (Bonferroni–Dunn or Tukey–Kramer procedures).
ResultsIn each animal, frequency response areas were reconstructed for30 – 40 double electrode penetrations across AI and AII to phys-iologically identify suitable locations for neuroanatomical tracerinjections (Fig. 1A,B). The dorsal and ventral AI and AII borders,and three subregions in AI [dorsal broadband (dBB), cNB, andventral broad band (vBB)], were reliably identified by using spec-tral integration bandwidth, response threshold, and the consis-tency of the tonotopic gradient (Schreiner and Mendelson, 1990;Read et al., 2001, 2011). To make these assessments, we used theCF and Q40 value derived from multiunit responses for each re-cording site. Two detailed distributions of CF and Q40 values
13334 • J. Neurosci., September 14, 2011 • 31(37):13333–13342 Yuan et al. • Functional Organization of Pv� Interneurons

across the surface of mapped auditory cortex are illustrated inFigure 1, C and D. Recording sites were marked with differentlycolored dots, corresponding to different Q40 ranges (Fig. 1A,B).Multiunit recordings were focused on a narrow frequency rangealong the dorsoventral axis to minimize potential tissue damageby multiple penetrations. AII is identified by the loss of tonotopy,significantly lower values of Q40 (i.e., broader frequency tuning),and higher response thresholds than in AI (Schreiner and Cyn-
ader, 1984). cNB was characterized by Q40
values of �1.5 (Fig. 1E,F) (Read et al.,2001). The ventral and dorsal boundariesof the cNB were defined as the locationswhere a polynomial fit of the Q40 distribu-tion fell below 1.5. The dorsoventralwidths of the cNB and vBB along the iso-frequency contour were 2162 � 40 �mand 1050 � 50 �m, respectively (n � 3).
To reveal the pattern of neural connec-tivity in AI and AII, injections of a retro-grade tracer, WAHG, were placed usinga microinjector at four cortical depths(�450, 900, 1350, and 1800 �m) acrossthe six cortical layers (see Materials andMethods) after extracellular mapping. Forthe example case shown in Figure 1A, aninjection was placed toward the dorsal re-gion of the cNB (Fig. 1A). Injections intoAII were �2 mm ventral to the AI/AIIborder approximately along the ventralextension of the 14 –20 kHz isofrequencycontours of AI (Fig. 1B). This locationwas at or near the crest of the ectosylviangyrus. Examples of a bright-field anddark-field injection track in AI and AII,respectively, are shown in Figures 2, A andB. SL-G cells were outlined by gold gran-ules. Pv� cells had brown somata andproximal dendrites. DL cells had black cy-toplasmic granules in the same focal planeas the brown-stained somata and were al-ways confirmed in bright-field illumina-tion (Fig. 2A).
Dorsoventral distribution patterns inAIcNB and AIITo characterize the distribution patternof single- and double-labeled cells in thedorsoventral dimension of AI and AII,coronal sections were plotted contain-ing an injection track (see Materials andMethods). SL-G and DL cells were plottedseparately; cortical layers were drawn us-ing adjacent Nissl-stained sections andthen superimposed to reveal the laminardistribution of the retrogradely labeledcells (Fig. 2C,D). In both AI and AII, DLcells, i.e., WAHG and Pv� cells, werefound in all layers except layer I (Fig.2C,D, red dots). According to the mor-phology of labeled cells, DL cells consti-tuted mainly basket multipolar cells andbipolar cells. Since the optical resolu-tion was limited by the dark background
caused by immunoprocessing, the ratio of specific subtypes of DLcells could not be reliably assessed.
In AI, SL-G cells from cNB injections extended from the dorsalzone of auditory cortex to the AI/AII border with only few cellsfound in AII (Fig. 2C, light blue dots). In AII, SL-G cells were spreadacross the whole area with only a few cells found in the central anddorsal zones of AI (Fig. 2D, light blue dots). This indicates weakcorticocortical interactions between AI and AII.
Figure 1. Representation of CF and frequency tuning bandwidth (Q40) in the AI and AII of two cats, 1903 and 1895. A, B, Lateral view ofright auditory cortex with multiunit mapping sites. Recording sites within different Q40 values are represented with dots of different colors.The small inset on the right corner of A is a schematic view of a right hemisphere, indicating the approximate mapping area, which coversAI and AII (shaded rectangle). Dashed lines show the physiological border between AI and AII. White arrows point to the physiologicallydefined dorsal and ventral boundaries of the AIcNB. Sulci: aes, anterior ectosylvian sulcus; pes, posterior ectosylvian sulcus; SSS, superiorsylvian sulcus; AAF, anterior auditory field; ED, posterior ectosylvian gyrus, dorsal part; In, insular cortex; P, posterior auditory cortex; Te,temporal cortex; VP, ventral posterior auditory area. Scale bar, 1 mm. C, D, Tessellated CF and Q40 maps for mapping area shown in A and B,respectively. Dashed lines and arrows correspond to those in A and B. E, F, Distribution of Q40 values as function of dorsoventral distancerelative to injection sites in AI and AII, respectively. Zero along thex-axis indicatesthepositionofaninjectionsite. Q40 valuesoftherecordingsites located between the two oblique lines in C (approximate isofrequency) and all recording sites in D are displayed. A fifth-degreepolynomial fit is applied to demonstrate the general distribution pattern of frequency tuning bandwidth (correlation coefficient is indicatedin the top right corner). Horizontal dashed lines indicates a Q40 value of 1.5; the vertical dashed line in F indicates the boundary between AIand AII. Arrows correspond to those in A and B, respectively.
Yuan et al. • Functional Organization of Pv� Interneurons J. Neurosci., September 14, 2011 • 31(37):13333–13342 • 13335

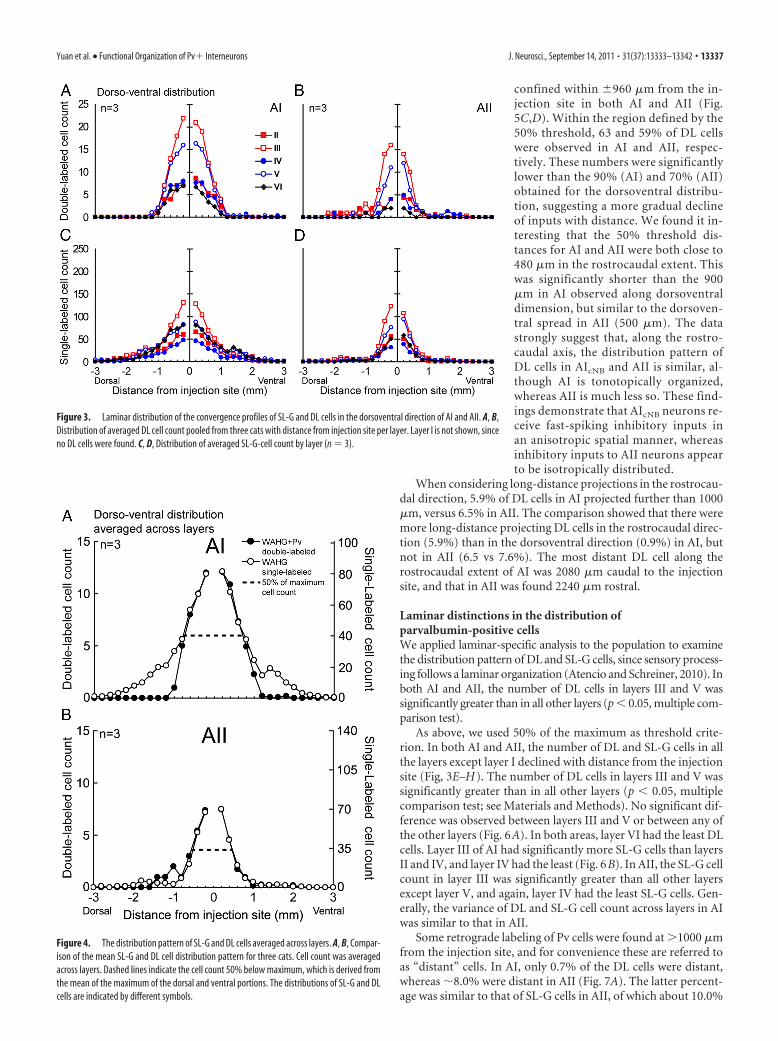
To quantify the spatial convergenceprofiles of both type of cells, we deter-mined the number and proportion of DLcells found at different distances from theinjection site along the dorsoventral di-mension. Since double-labeled cells werenot observed in layer I, further data anal-ysis does not include data from layer I. Wefound that, unsurprisingly, SL-G cellswere significantly more common than DLcells in both central AI and AII (n � 3; AI,3458 � 408 vs 382 � 21; AII, 1682 � 440vs 180 � 12; p � 0.01, one-way ANOVA)(Fig. 3A–D). In addition, the number ofboth cell types in central AI was signifi-cantly higher than in AII (n � 3; DL,382 � 21 vs 180 � 12; SL-G, 3458 � 408 vs1682 � 440; p � 0.01, one-way ANOVA)(Fig. 3A–D). The differences in dorsal–ventral distribution pattern between DLand SL-G cells and between central AI andAII became much clearer when numbersacross all the layers were averaged (Fig. 4).Generally, the highest density of both celltypes was observed near the injection sitein both areas; however, the number of DLand SL-G cells declined at different ratesas a function of distance from the injec-tion boundary. In AI, the total number oflabeled cells dropped to 50% of the maxi-mum cell count at �800 � 100 �m, whichis indicated by the dashed line in Figure4A. More than 80% of total DL cells werefound within this 800 �m range; however,only �60% of SL-G cells were observedwithin that range. The number of the DLand SL-G cells dropped to 20% of the totalat 1000 � 100 and 1600 � 100 �m, re-spectively, indicating that there are signif-icantly more long-distance projectingSL-G cells than DL cells. Functionally, thisdifference probably means the neurons inthe cNB integrate excitatory inputs from arange that is significantly wider than thatof inhibitory inputs.
In AII, the number of labeled cellsdropped to 50% at �500 � 100 �m,which indicates a spatially more restrictedconvergence range than in central AI (Fig.4B). In AII, more DL cells were found atdistances �1000 �m than in AI (7.6 �3.4% vs 0.9 � 0.4%) (Fig. 4A,B); however, the number of DLcells in AII dropped to 50% (20%) within 500 � 100 �m (700 �100 �m), from the injection site. These distances were signifi-cantly shorter than the corresponding distances of 800 � 100 �mand 1000 � 100 �m seen in AI (p � 0.05, Student’s t test). Thesedata suggest a more local innervation pattern by inhibitoryneurons in AII than in AI.
Although these data suggest that the majority of DL and SL-Gcells in AII were located much closer to the injection site thanthose in AI, the overall spatial spread of DL cells in AII was sig-nificantly wider than that in AI (p � 0.05, Student’s t test) due toa few DL cells with long-distance projections. For the population
shown in Figure 3, A and B, the most distant DL cells were foundat 1800 � 200 �m in AI and at 2133 � 116 �m in AII, respec-tively. DL cells in AII extended up to the AI/AII border, but didnot cross the border.
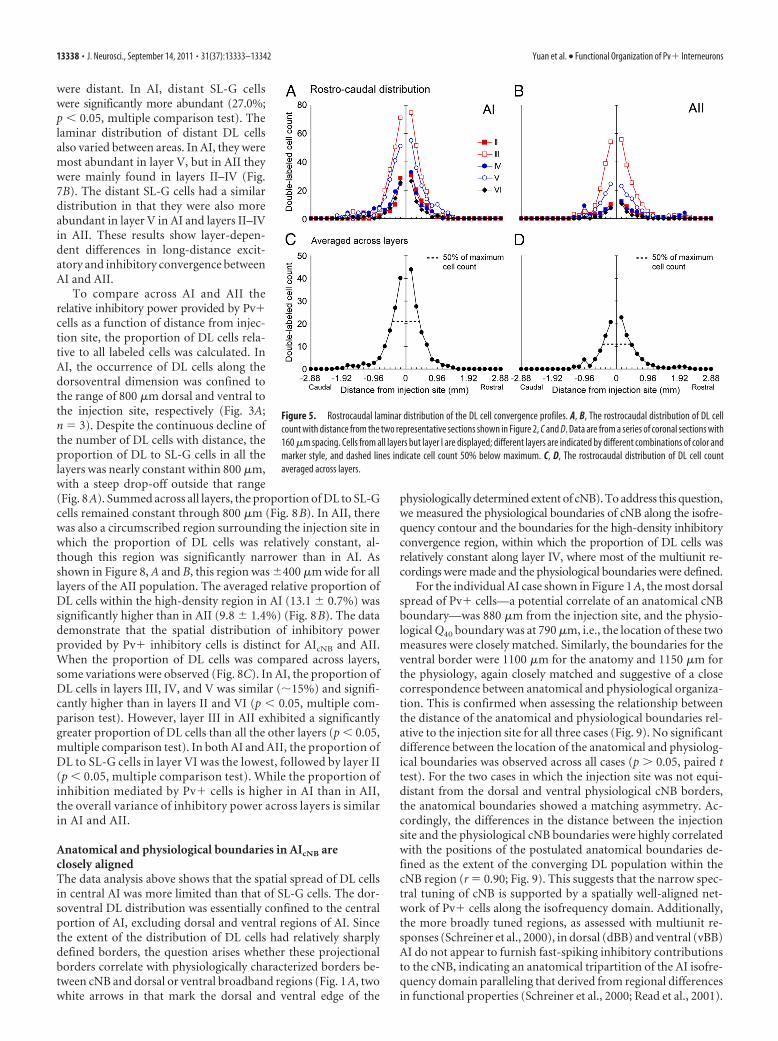
Rostrocaudal distribution patterns in AIcNB and AIITo estimate the distribution of DL cells along the rostrocaudaldirection (i.e., along the frequency gradient of AI), DL cells wereplotted for every fourth section, (i.e., every 160 �m) for one AIand one AII case (Fig. 5A,B). Again, the threshold of 50% of themaximum cell count was used to describe the distribution pat-tern of cells. Summed from layers II–VI, �95% of DL cells were
Figure 2. Dorsoventral spatial convergence profiles of SL-G and DL cells. A, Left to right, Bright-field view of a representativesection with tracer (WAHG) injection track in AIcNB; dark-field view of the same section; WAHG SL example cell outlined by blackgold granules (top); WAHG and Pv DL example cell (bottom). Dashed line indicates anatomical border between AI and AII. B, Leftto right, Bright- and dark-field views of a representative section with tracer injection track in AII (same scale as in A). C, D,Neurolucida plots of the dorsoventral and laminar distribution of SL-G and DL cells from the two sections depicted in A and B,respectively. Arrows point to the edge of the region with a high density of DL cells. Blue and red dots represent SL-G and DL cells,respectively. Cortical layers are indicated by roman numerals I–VI. Dashed lines indicate the anatomical border between AI and AII.Gray bars in C indicate blood vessels.
13336 • J. Neurosci., September 14, 2011 • 31(37):13333–13342 Yuan et al. • Functional Organization of Pv� Interneurons
confined within �960 �m from the in-jection site in both AI and AII (Fig.5C,D). Within the region defined by the50% threshold, 63 and 59% of DL cellswere observed in AI and AII, respec-tively. These numbers were significantlylower than the 90% (AI) and 70% (AII)obtained for the dorsoventral distribu-tion, suggesting a more gradual declineof inputs with distance. We found it in-teresting that the 50% threshold dis-tances for AI and AII were both close to480 �m in the rostrocaudal extent. Thiswas significantly shorter than the 900�m in AI observed along dorsoventraldimension, but similar to the dorsoven-tral spread in AII (500 �m). The datastrongly suggest that, along the rostro-caudal axis, the distribution pattern ofDL cells in AIcNB and AII is similar, al-though AI is tonotopically organized,whereas AII is much less so. These find-ings demonstrate that AIcNB neurons re-ceive fast-spiking inhibitory inputs inan anisotropic spatial manner, whereasinhibitory inputs to AII neurons appearto be isotropically distributed.
When considering long-distance projections in the rostrocau-dal direction, 5.9% of DL cells in AI projected further than 1000�m, versus 6.5% in AII. The comparison showed that there weremore long-distance projecting DL cells in the rostrocaudal direc-tion (5.9%) than in the dorsoventral direction (0.9%) in AI, butnot in AII (6.5 vs 7.6%). The most distant DL cell along therostrocaudal extent of AI was 2080 �m caudal to the injectionsite, and that in AII was found 2240 �m rostral.
Laminar distinctions in the distribution ofparvalbumin-positive cellsWe applied laminar-specific analysis to the population to examinethe distribution pattern of DL and SL-G cells, since sensory process-ing follows a laminar organization (Atencio and Schreiner, 2010). Inboth AI and AII, the number of DL cells in layers III and V wassignificantly greater than in all other layers (p � 0.05, multiple com-parison test).
As above, we used 50% of the maximum as threshold crite-rion. In both AI and AII, the number of DL and SL-G cells in allthe layers except layer I declined with distance from the injectionsite (Fig, 3E–H). The number of DL cells in layers III and V wassignificantly greater than in all other layers (p � 0.05, multiplecomparison test; see Materials and Methods). No significant dif-ference was observed between layers III and V or between any ofthe other layers (Fig. 6A). In both areas, layer VI had the least DLcells. Layer III of AI had significantly more SL-G cells than layersII and IV, and layer IV had the least (Fig. 6B). In AII, the SL-G cellcount in layer III was significantly greater than all other layersexcept layer V, and again, layer IV had the least SL-G cells. Gen-erally, the variance of DL and SL-G cell count across layers in AIwas similar to that in AII.
Some retrograde labeling of Pv cells were found at �1000 �mfrom the injection site, and for convenience these are referred toas “distant” cells. In AI, only 0.7% of the DL cells were distant,whereas �8.0% were distant in AII (Fig. 7A). The latter percent-age was similar to that of SL-G cells in AII, of which about 10.0%
Figure 3. Laminar distribution of the convergence profiles of SL-G and DL cells in the dorsoventral direction of AI and AII. A, B,Distribution of averaged DL cell count pooled from three cats with distance from injection site per layer. Layer I is not shown, sinceno DL cells were found. C, D, Distribution of averaged SL-G-cell count by layer (n � 3).
Figure 4. The distribution pattern of SL-G and DL cells averaged across layers. A, B, Compar-ison of the mean SL-G and DL cell distribution pattern for three cats. Cell count was averagedacross layers. Dashed lines indicate the cell count 50% below maximum, which is derived fromthe mean of the maximum of the dorsal and ventral portions. The distributions of SL-G and DLcells are indicated by different symbols.
Yuan et al. • Functional Organization of Pv� Interneurons J. Neurosci., September 14, 2011 • 31(37):13333–13342 • 13337
were distant. In AI, distant SL-G cellswere significantly more abundant (27.0%;p � 0.05, multiple comparison test). Thelaminar distribution of distant DL cellsalso varied between areas. In AI, they weremost abundant in layer V, but in AII theywere mainly found in layers II–IV (Fig.7B). The distant SL-G cells had a similardistribution in that they were also moreabundant in layer V in AI and layers II–IVin AII. These results show layer-depen-dent differences in long-distance excit-atory and inhibitory convergence betweenAI and AII.
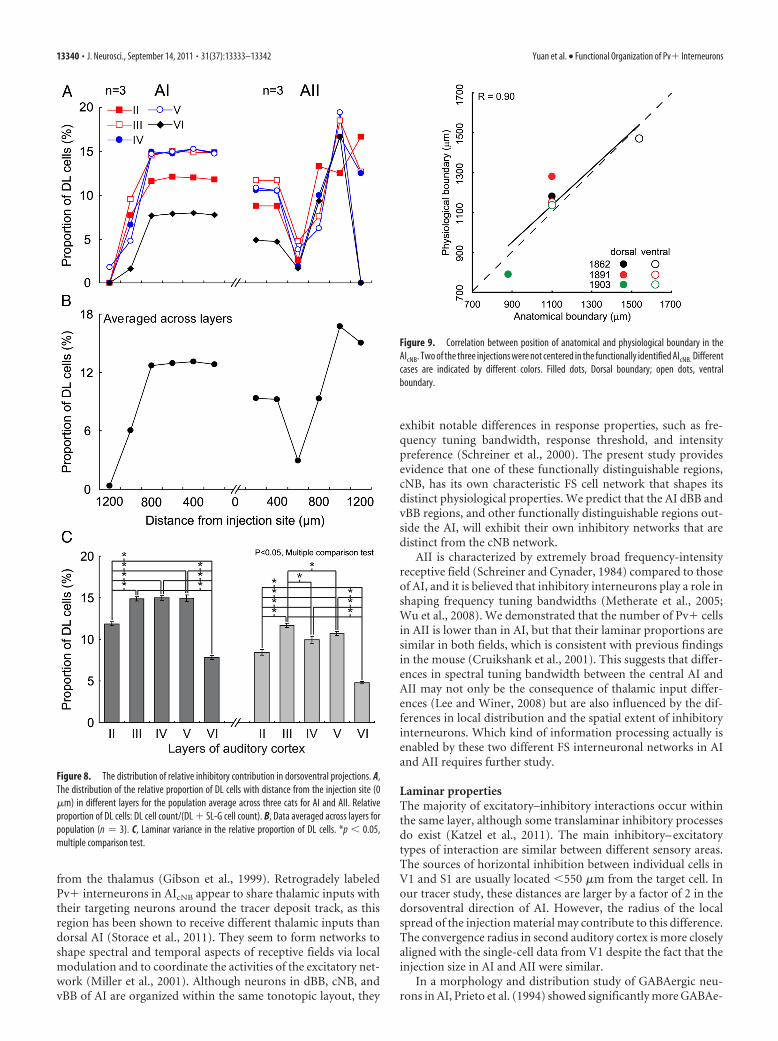
To compare across AI and AII therelative inhibitory power provided by Pv�cells as a function of distance from injec-tion site, the proportion of DL cells rela-tive to all labeled cells was calculated. InAI, the occurrence of DL cells along thedorsoventral dimension was confined tothe range of 800 �m dorsal and ventral tothe injection site, respectively (Fig. 3A;n � 3). Despite the continuous decline ofthe number of DL cells with distance, theproportion of DL to SL-G cells in all thelayers was nearly constant within 800 �m,with a steep drop-off outside that range(Fig. 8A). Summed across all layers, the proportion of DL to SL-Gcells remained constant through 800 �m (Fig. 8B). In AII, therewas also a circumscribed region surrounding the injection site inwhich the proportion of DL cells was relatively constant, al-though this region was significantly narrower than in AI. Asshown in Figure 8, A and B, this region was �400 �m wide for alllayers of the AII population. The averaged relative proportion ofDL cells within the high-density region in AI (13.1 � 0.7%) wassignificantly higher than in AII (9.8 � 1.4%) (Fig. 8B). The datademonstrate that the spatial distribution of inhibitory powerprovided by Pv� inhibitory cells is distinct for AIcNB and AII.When the proportion of DL cells was compared across layers,some variations were observed (Fig. 8C). In AI, the proportion ofDL cells in layers III, IV, and V was similar (�15%) and signifi-cantly higher than in layers II and VI (p � 0.05, multiple com-parison test). However, layer III in AII exhibited a significantlygreater proportion of DL cells than all the other layers (p � 0.05,multiple comparison test). In both AI and AII, the proportion ofDL to SL-G cells in layer VI was the lowest, followed by layer II(p � 0.05, multiple comparison test). While the proportion ofinhibition mediated by Pv� cells is higher in AI than in AII,the overall variance of inhibitory power across layers is similarin AI and AII.
Anatomical and physiological boundaries in AIcNB areclosely alignedThe data analysis above shows that the spatial spread of DL cellsin central AI was more limited than that of SL-G cells. The dor-soventral DL distribution was essentially confined to the centralportion of AI, excluding dorsal and ventral regions of AI. Sincethe extent of the distribution of DL cells had relatively sharplydefined borders, the question arises whether these projectionalborders correlate with physiologically characterized borders be-tween cNB and dorsal or ventral broadband regions (Fig. 1A, twowhite arrows in that mark the dorsal and ventral edge of the
physiologically determined extent of cNB). To address this question,we measured the physiological boundaries of cNB along the isofre-quency contour and the boundaries for the high-density inhibitoryconvergence region, within which the proportion of DL cells wasrelatively constant along layer IV, where most of the multiunit re-cordings were made and the physiological boundaries were defined.
For the individual AI case shown in Figure 1A, the most dorsalspread of Pv� cells—a potential correlate of an anatomical cNBboundary—was 880 �m from the injection site, and the physio-logical Q40 boundary was at 790 �m, i.e., the location of these twomeasures were closely matched. Similarly, the boundaries for theventral border were 1100 �m for the anatomy and 1150 �m forthe physiology, again closely matched and suggestive of a closecorrespondence between anatomical and physiological organiza-tion. This is confirmed when assessing the relationship betweenthe distance of the anatomical and physiological boundaries rel-ative to the injection site for all three cases (Fig. 9). No significantdifference between the location of the anatomical and physiolog-ical boundaries was observed across all cases (p � 0.05, paired ttest). For the two cases in which the injection site was not equi-distant from the dorsal and ventral physiological cNB borders,the anatomical boundaries showed a matching asymmetry. Ac-cordingly, the differences in the distance between the injectionsite and the physiological cNB boundaries were highly correlatedwith the positions of the postulated anatomical boundaries de-fined as the extent of the converging DL population within thecNB region (r � 0.90; Fig. 9). This suggests that the narrow spec-tral tuning of cNB is supported by a spatially well-aligned net-work of Pv� cells along the isofrequency domain. Additionally,the more broadly tuned regions, as assessed with multiunit re-sponses (Schreiner et al., 2000), in dorsal (dBB) and ventral (vBB)AI do not appear to furnish fast-spiking inhibitory contributionsto the cNB, indicating an anatomical tripartition of the AI isofre-quency domain paralleling that derived from regional differencesin functional properties (Schreiner et al., 2000; Read et al., 2001).
Figure 5. Rostrocaudal laminar distribution of the DL cell convergence profiles. A, B, The rostrocaudal distribution of DL cellcount with distance from the two representative sections shown in Figure 2, C and D. Data are from a series of coronal sections with160 �m spacing. Cells from all layers but layer I are displayed; different layers are indicated by different combinations of color andmarker style, and dashed lines indicate cell count 50% below maximum. C, D, The rostrocaudal distribution of DL cell countaveraged across layers.
13338 • J. Neurosci., September 14, 2011 • 31(37):13333–13342 Yuan et al. • Functional Organization of Pv� Interneurons

DiscussionThis investigation of the pattern of inhibitory networks in audi-tory cortex shows that functionally and hierarchically differentareas in cat auditory cortex have different organizations oftheir parvalbumin-immunoreactive neurons, suggesting dis-tinct functional consequences of local inhibitory networks.Furthermore, in AI, the distribution of Pv� inhibitory con-nections is highly correlated with the extent of a physiologi-cally definable region, the spectrally narrowly tuned cNBmodule. This establishes a correspondence of neuroanatomi-cal and functional organization principles and supports thenotion of three distinct processing modules in AI (Schreiner etal., 2000; Read et al., 2001).
In addition, we found that, in AII, Pv� cells innervate excit-atory cells over a more restricted spatial range. Furthermore, thedensity of Pv� neurons in AII is lower than in AI; however,laminar differences in cell number and proportion are similar forAI and AII. Our findings suggest that the connection pattern ofthe inhibitory circuit is tailored to cooperate with excitatory cir-cuits to enable specific local computations and to create func-tional modules. Even for the same type of cortical inhibitoryneurons, the rules in which they are wired can vary within andacross different cortical fields, sensory modality, and species. Byrevealing the organization principle of certain cortical circuits,the modeling of cortical function should become more realistic.
Inhibitory networksMost cortical GABAergic interneurons do not project far andmainly function locally (Markram et al., 2004). In cat primaryvisual cortex (V1), inhibition provided by local inhibitory neu-rons balances excitation from local and distant excitatory neu-rons to generate invariant tuning of the spiking response,independent of location in the orientation preference map(Marino et al., 2005). In rat primary somatosensory cortex(S1), inhibitory neurons in most layers mainly innervate ex-citatory neurons in their home column, although some neu-rons in layer II/III influence activity in neighboring columns(Helmstaedter et al., 2009). Here we demonstrated that Pv�inhibitory connections in cat AI are also local and coincidewith the extent of functional groups with common spectralintegration bandwidths. Thus, across different sensory corti-ces, the organization of fast-spiking inhibitory circuits appearsfunctionally and organizationally specific.
Pv� and fast-spiking GABAergic interneurons are closely as-sociated (Kawaguchi and Kubota, 1993; Chow et al., 1999;Toledo-Rodriguez et al., 2004). Networks of FS cells generatelarge, synchronous inhibitory postsynaptic potentials in local ex-citatory neurons (Wang and Buzsaki, 1996; Hasenstaub et al.,2005). Cortical FS cells are most likely the only subtype of inhib-itory interneurons receiving monosynaptic and strong excitation
Figure 6. Laminar mean and variance in SL-G- and DL- cell count in the dorsoventral direc-tion. A, DL cells. Left, AI; right, AII. The number of DL cells in layers III and V of both AI and AII issignificantly greater than in all other layers (*p � 0.05, multiple comparison test). B, SL-G cells.Left, AI; right AII. The number of SL-G cells in layers III and V of both AI and AII is also significantlygreater than in all other layers (*p � 0.05, multiple comparison test). Figure 7. Long-distance projection profiles of SL-G and DL cells in the dorsoventral direction.
A, Proportion of SL-G and DL cells �1000 �m from injection site. Light gray, SL-G cells; darkgray, DL cells. *p � 0.05, multiple comparison test. B, Laminar variance in the proportion oflong-distance DL and SL-G projections (�1000 �m) in AI and AII.
Yuan et al. • Functional Organization of Pv� Interneurons J. Neurosci., September 14, 2011 • 31(37):13333–13342 • 13339
from the thalamus (Gibson et al., 1999). Retrogradely labeledPv� interneurons in AIcNB appear to share thalamic inputs withtheir targeting neurons around the tracer deposit track, as thisregion has been shown to receive different thalamic inputs thandorsal AI (Storace et al., 2011). They seem to form networks toshape spectral and temporal aspects of receptive fields via localmodulation and to coordinate the activities of the excitatory net-work (Miller et al., 2001). Although neurons in dBB, cNB, andvBB of AI are organized within the same tonotopic layout, they
exhibit notable differences in response properties, such as fre-quency tuning bandwidth, response threshold, and intensitypreference (Schreiner et al., 2000). The present study providesevidence that one of these functionally distinguishable regions,cNB, has its own characteristic FS cell network that shapes itsdistinct physiological properties. We predict that the AI dBB andvBB regions, and other functionally distinguishable regions out-side the AI, will exhibit their own inhibitory networks that aredistinct from the cNB network.
AII is characterized by extremely broad frequency-intensityreceptive field (Schreiner and Cynader, 1984) compared to thoseof AI, and it is believed that inhibitory interneurons play a role inshaping frequency tuning bandwidths (Metherate et al., 2005;Wu et al., 2008). We demonstrated that the number of Pv� cellsin AII is lower than in AI, but that their laminar proportions aresimilar in both fields, which is consistent with previous findingsin the mouse (Cruikshank et al., 2001). This suggests that differ-ences in spectral tuning bandwidth between the central AI andAII may not only be the consequence of thalamic input differ-ences (Lee and Winer, 2008) but are also influenced by the dif-ferences in local distribution and the spatial extent of inhibitoryinterneurons. Which kind of information processing actually isenabled by these two different FS interneuronal networks in AIand AII requires further study.
Laminar propertiesThe majority of excitatory–inhibitory interactions occur withinthe same layer, although some translaminar inhibitory processesdo exist (Katzel et al., 2011). The main inhibitory– excitatorytypes of interaction are similar between different sensory areas.The sources of horizontal inhibition between individual cells inV1 and S1 are usually located �550 �m from the target cell. Inour tracer study, these distances are larger by a factor of 2 in thedorsoventral direction of AI. However, the radius of the localspread of the injection material may contribute to this difference.The convergence radius in second auditory cortex is more closelyaligned with the single-cell data from V1 despite the fact that theinjection size in AI and AII were similar.
In a morphology and distribution study of GABAergic neu-rons in AI, Prieto et al. (1994) showed significantly more GABAe-
Figure 8. The distribution of relative inhibitory contribution in dorsoventral projections. A,The distribution of the relative proportion of DL cells with distance from the injection site (0�m) in different layers for the population average across three cats for AI and AII. Relativeproportion of DL cells: DL cell count/(DL � SL-G cell count). B, Data averaged across layers forpopulation (n � 3). C, Laminar variance in the relative proportion of DL cells. *p � 0.05,multiple comparison test.
Figure 9. Correlation between position of anatomical and physiological boundary in theAIcNB. Two of the three injections were not centered in the functionally identified AIcNB. Differentcases are indicated by different colors. Filled dots, Dorsal boundary; open dots, ventralboundary.
13340 • J. Neurosci., September 14, 2011 • 31(37):13333–13342 Yuan et al. • Functional Organization of Pv� Interneurons

rgic somata in layers III and IV in the central part of the AI, alongthe dorsoventral axis, where physiological studies report that theneurons are most sharply tuned (Schreiner and Mendelson,1990). The current local projection study provides functionallyverified evidence for a regional and laminar structural frameworkof the modular spectral integration organization of AI.
In visual and somatosensory cortex, lateral inhibition con-strains the flow of information to columnar units in supragranu-lar and infragranular layers, although columns in the granularlayers are largely defined by the parcellation of the thalamocorti-cal projections. In V1, the widest horizontal input is found inlayers II/III and V, and the narrowest in layer IV (Katzel et al.,2011). In AI, our data indicate that the proportion of Pv� long-distance projections (�1000 �m) is relatively high in layer V,whereas in AII, the proportion of long-distance projections issignificantly higher in layers II, III, and IV. This laminar-specificdifference between cortical fields may reflect difference in thecomposition of subtypes of Pv� interneurons (Hasenstaub andCallaway, 2010) and establishes structural distinctions betweenAI and AII that likely contribute to different shaping of receptivefield properties and their evolution within the laminar circuit.Furthermore, in V1, Pv� cells receive strong and preferentiallyfeedforward connections from thalamus and layer IV. As a con-sequence, they can provide a temporally precise control of spik-ing, likely providing fast and strong gain control (Ma et al., 2010).Similar properties in AI may help in generating precise responseproperties (Runyan et al., 2010) and maintaining sharpness oftuning of special relevance in the region of the narrowly fre-quency tuned AIcNB. The functional role of Pv� interneurons inAII remains unclear at this time, in part due to the limited knowl-edge of AII functional properties.
Species differencesSome variations in the cellular and neural network architecturemay exist across different species. In rat AI (Yuan et al., 2010), theextent of the high-density region of labeled Pv� cells (�90%)was �500 �m, closely matching findings of a single unit channel–rhodopsin study in mice V1 and S1 (Katzel et al., 2011). By con-trast, in cat AI, this range was �900 �m, despite the use of nearlyidentical tracer volume in both studies. Cat AI showed an aniso-tropic distribution of Pv� cells with a narrower range in thedirection of the frequency gradient. In rat AI, the distribution ofPv� cells was more isotropic, whereas the WAHG-only cellsshowed a wider convergence range along the frequency axis.Combined with the more isotropic pattern of Pv� convergencein cat AII, this further supports the notion of physiological andneuroanatomical covariations in field organization.
Methodological considerationsDamage to the cortex caused by multiple electrode penetrationscould interfere with the retrograde transportation of tracer. Forthis reason we kept our mapping density to a minimum. As aconsequence, the dorsal narrow band (dNB) region that has beenphysiologically and anatomically characterized in cat AI(Schreiner and Mendelson, 1990; Read et al., 2001) was not iden-tified in the present study, although it has not been consistentlyreported in more densely mapped animals. Anatomically, corti-cocortical connections between the dNB and cNB have beendemonstrated (Read et al., 2001). In the current study, WAHG-labeled neurons were found dorsal of cNB, potentially reflectingconnections with dNB. However, essentially no retrogradely la-beled Pv� cells have been observed dorsal of the cNB, suggestingthat connectivity between the cNB and dorsal AI is restricted to
Pv-negative neurons, likely corresponding to excitatory inputs.The probability that other subtypes of inhibitory interneurons,for example, somatostatin-positive interneurons, may projectbetween the two narrow band modules still cannot be ruled out,since it has been shown that those interneurons tend to providemuch longer distance projections than Pv� neurons (Tomioka etal., 2005; Tomioka and Rockland, 2007).
ReferencesAndermann ML, Ritt J, Neimark MA, Moore CI (2004) Neural correlates of
vibrissa resonance; band-pass and somatotopic representation of high-frequency stimuli. Neuron 42:451– 463.
Atencio CA, Schreiner CE (2008) Spectrotemporal processing differences be-tween auditory cortical fast-spiking and regular-spiking neurons. J Neurosci28:3897–3910.
Atencio CA, Schreiner CE (2010) Laminar diversity of dynamic sound pro-cessing in cat primary auditory cortex. J Neurophysiol 103:192–205.
Bartho P, Hirase H, Monconduit L, Zugaro M, Harris KD, Buzsaki G (2004)Characterization of neocortical principal cells and interneurons by net-work interactions and extracellular features. J Neurophysiol 92:600 – 608.
Basbaum AI, Menetrey D (1987) Wheat germ agglutinin-apoHRP gold: anew retrograde tracer for light- and electron-microscopic single- anddouble-label studies. J Comp Neurol 261:306 –318.
Bruno RM, Simons DJ (2002) Feedforward mechanisms of excitatory andinhibitory cortical receptive fields. J Neurosci 22:10966 –10975.
Buzsaki G, Eidelberg E (1981) Commissural projection to the dentate gyrusof the rat: evidence for feed-forward inhibition. Brain Res 230:346 –350.
Calford MB, Semple MN (1995) Monaural inhibition in cat auditory cortex.J Neurophysiol 73:1876 –1891.
Chow A, Erisir A, Farb C, Nadal MS, Ozaita A, Lau D, Welker E, Rudy B (1999)K(�) channel expression distinguishes subpopulations of parvalbumin- andsomatostatin-containing neocortical interneurons. J Neurosci 19:9332–9345.
Cruikshank SJ, Killackey HP, Metherate R (2001) Parvalbumin and calbin-din are differentially distributed within primary and secondary subre-gions of the mouse auditory forebrain. Neuroscience 105:553–569.
DeFelipe J (1997) Types of neurons, synaptic connections and chemicalcharacteristics of cells immunoreactive for calbindin-D28K, parvalbuminand calretinin in the neocortex. J Chem Neuroanat 14:1–19.
DeFelipe J, Gonzalez-Albo MC, Del Rio MR, Elston GN (1999) Distributionand patterns of connectivity of interneurons containing calbindin, calre-tinin, and parvalbumin in visual areas of the occipital and temporal lobesof the macaque monkey. J Comp Neurol 412:515–526.
Freund TF, Katona I (2007) Perisomatic inhibition. Neuron 56:33– 42.Gibson JR, Beierlein M, Connors BW (1999) Two networks of electrically
coupled inhibitory neurons in neocortex. Nature 402:75–79.Gilbert CD (1993) Circuitry, architecture, and functional dynamics of vi-
sual cortex. Cereb Cortex 3:373–386.Hasenstaub AR, Callaway EM (2010) Paint it black (or red, or green): opti-
cal and genetic tools illuminate inhibitory contributions to cortical circuitfunction. Neuron 67:681– 684.
Hasenstaub A, Shu Y, Haider B, Kraushaar U, Duque A, McCormick DA(2005) Inhibitory postsynaptic potentials carry synchronized frequencyinformation in active cortical networks. Neuron 47:423– 435.
Helmstaedter M, Sakmann B, Feldmeyer D (2009) Neuronal correlates oflocal, lateral, and translaminar inhibition with reference to cortical col-umns. Cereb Cortex 19:926 –937.
Jonas P, Bischofberger J, Fricker D, Miles R (2004) Interneuron diversityseries: fast in, fast out—temporal and spatial signal processing in hip-pocampal interneurons. Trends Neurosci 27:30 – 40.
Katzel D, Zemelman BV, Buetfering C, Wolfel M, Miesenbock G (2011) Thecolumnar and laminar organization of inhibitory connections to neocor-tical excitatory cells. Nat Neurosci 14:100 –107.
Kawaguchi Y, Kubota Y (1993) Correlation of physiological subgroupings ofnonpyramidal cells with parvalbumin- and calbindinD28k-immunoreactiveneurons in layer V of rat frontal cortex. J Neurophysiol 70:387–396.
Kisvarday ZF, Beaulieu C, Eysel UT (1993) Network of GABAergic largebasket cells in cat visual cortex (area 18): implication for lateral disinhi-bition. J Comp Neurol 327:398 – 415.
Kisvarday ZF, Kim DS, Eysel UT, Bonhoeffer T (1994) Relationship be-tween lateral inhibitory connections and the topography of the orienta-tion map in cat visual cortex. Eur J Neurosci 6:1619 –1632.
Yuan et al. • Functional Organization of Pv� Interneurons J. Neurosci., September 14, 2011 • 31(37):13333–13342 • 13341

Lee CC, Winer JA (2008) Connections of cat auditory cortex: III. Cortico-cortical system. J Comp Neurol 507:1920 –1943.
Ma WP, Liu BH, Li YT, Huang ZJ, Zhang LI, Tao HW (2010) Visual repre-sentations by cortical somatostatin inhibitory neurons–selective but withweak and delayed responses. J Neurosci 30:14371–14379.
Marino J, Schummers J, Lyon DC, Schwabe L, Beck O, Wiesing P, ObermayerK, Sur M (2005) Invariant computations in local cortical networks withbalanced excitation and inhibition. Nat Neurosci 8:194 –201.
Markram H, Toledo-Rodriguez M, Wang Y, Gupta A, Silberberg G, Wu C(2004) Interneurons of the neocortical inhibitory system. Nat Rev Neu-rosci 5:793– 807.
McBain CJ, Fisahn A (2001) Interneurons unbound. Nat Rev Neurosci2:11–23.
McCormick DA, Connors BW, Lighthall JW, Prince DA (1985) Compara-tive electrophysiology of pyramidal and sparsely spiny stellate neurons ofthe neocortex. J Neurophysiol 54:782– 806.
Metherate R, Kaur S, Kawai H, Lazar R, Liang K, Rose HJ (2005) Spectralintegration in auditory cortex: mechanisms and modulation. Hear Res206:146 –158.
Miller LM, Escabi MA, Read HL, Schreiner CE (2001) Functional conver-gence of response properties in the auditory thalamocortical system. Neu-ron 32:151–160.
Oswald AM, Schiff ML, Reyes AD (2006) Synaptic mechanisms underlyingauditory processing. Curr Opin Neurobiol 16:371–376.
Pandya PK, Rathbun DL, Moucha R, Engineer ND, Kilgard MP (2008)Spectral and temporal processing in rat posterior auditory cortex. CerebCortex 18:301–314.
Pouille F, Scanziani M (2001) Enforcement of temporal fidelity in pyrami-dal cells by somatic feed-forward inhibition. Science 293:1159 –1163.
Pouille F, Scanziani M (2004) Routing of spike series by dynamic circuits inthe hippocampus. Nature 429:717–723.
Prieto JJ, Peterson BA, Winer JA (1994) Morphology and spatial distribu-tion of GABAergic neurons in cat primary auditory cortex (AI). J CompNeurol 344:349 –382.
Read HL, Winer JA, Schreiner CE (2001) Modular organization of intrinsicconnections associated with spectral tuning in cat auditory cortex. ProcNatl Acad Sci U S A 98:8042– 8047.
Read HL, Nauen DW, Escabi MA, Miller LM, Schreiner CE, Winer JA (2011)Distinct core thalamocortical pathways to central and dorsal primaryauditory cortex. Hear Res 274:95–104.
Rouiller EM, Simm GM, Villa AE, de Ribaupierre Y, de Ribaupierre F (1991)Auditory corticocortical interconnections in the cat: evidence for paralleland hierarchical arrangement of the auditory cortical areas. Exp Brain Res86:483–505.
Runyan CA, Schummers J, Van Wart A, Kuhlman SJ, Wilson NR, Huang ZJ,Sur M (2010) Response features of parvalbumin-expressing interneu-rons suggest precise roles for subtypes of inhibition in visual cortex. Neu-ron 67:847– 857.
Schreiner CE, Cynader MS (1984) Basic functional organization of secondauditory cortical field (AII) of the cat. J Neurophysiol 51:1284 –1305.
Schreiner CE, Mendelson JR (1990) Functional topography of cat primaryauditory cortex: distribution of integrated excitation. J Neurophysiol64:1442–1459.
Schreiner CE, Sutter ML (1992) Topography of excitatory bandwidth in catprimary auditory cortex: single-neuron versus multiple-neuron record-ings. J Neurophysiol 68:1487–1502.
Schreiner CE, Read HL, Sutter ML (2000) Modular organization of fre-quency integration in primary auditory cortex. Annu Rev Neurosci23:501–529.
Shamma SA, Symmes D (1985) Patterns of inhibition in auditory corticalcells in awake squirrel monkeys. Hear Res 19:1–13.
Storace DA, Higgins NC, Read HL (2011) Thalamocortical pathway special-ization for sound frequency resolution. J Comp Neurol 519:177–193.
Suga N, Manabe T (1982) Neural basis of amplitude-spectrum representa-tion in auditory cortex of the mustached bat. J Neurophysiol 47:225–255.
Sutter ML, Loftus WC (2003) Excitatory and inhibitory intensity tuning inauditory cortex: evidence for multiple inhibitory mechanisms. J Neuro-physiol 90:2629 –2647.
Sutter ML, Schreiner CE, McLean M, O’Connor KN, Loftus WC (1999)Organization of inhibitory frequency receptive fields in cat primary audi-tory cortex. J Neurophysiol 82:2358 –2371.
Tamamaki N, Yanagawa Y, Tomioka R, Miyazaki J, Obata K, Kaneko T(2003) Green fluorescent protein expression and colocalization with cal-retinin, parvalbumin, and somatostatin in the GAD67-GFP knock-inmouse. J Comp Neurol 467:60 –79.
Tan AY, Atencio CA, Polley DB, Merzenich MM, Schreiner CE (2007) Un-balanced synaptic inhibition can create intensity-tuned auditory cortexneurons. Neuroscience 146:449 – 462.
Toledo-Rodriguez M, Blumenfeld B, Wu C, Luo J, Attali B, Goodman P,Markram H (2004) Correlation maps allow neuronal electrical proper-ties to be predicted from single-cell gene expression profiles in rat neo-cortex. Cereb Cortex 14:1310 –1327.
Tomioka R, Rockland KS (2007) Long-distance corticocortical GABAergicneurons in the adult monkey white and gray matter. J Comp Neurol505:526 –538.
Tomioka R, Okamoto K, Furuta T, Fujiyama F, Iwasato T, Yanagawa Y, ObataK, Kaneko T, Tamamaki N (2005) Demonstration of long-rangeGABAergic connections distributed throughout the mouse neocortex.Eur J Neurosci 21:1587–1600.
Wang XJ, Buzsaki G (1996) Gamma oscillation by synaptic inhibition in ahippocampal interneuronal network model. J Neurosci 16:6402– 6413.
Wehr M, Zador AM (2003) Balanced inhibition underlies tuning and sharp-ens spike timing in auditory cortex. Nature 426:442– 446.
Wu GK, Li P, Tao HW, Zhang LI (2006) Nonmonotonic synaptic excitationand imbalanced inhibition underlying cortical intensity tuning. Neuron52:705–715.
Wu GK, Arbuckle R, Liu BH, Tao HW, Zhang LI (2008) Lateral sharpeningof cortical frequency tuning by approximately balanced inhibition. Neu-ron 58:132–143.
Yuan K, Fink KL, Winer JA, Schreiner CE (2010) Local connection patternsof parvalbumin-positive inhibitory interneurons in rat primary auditorycortex. Hear Res 274:121–128.
Zhang LI, Tan AY, Schreiner CE, Merzenich MM (2003) Topography andsynaptic shaping of direction selectivity in primary auditory cortex. Na-ture 424:201–205.
13342 • J. Neurosci., September 14, 2011 • 31(37):13333–13342 Yuan et al. • Functional Organization of Pv� Interneurons