behavioural change and greenhouse gas mitigation … change and greenhouse gas mitigation ... p2...
TRANSCRIPT

Behavioural change and greenhouse gas mitigation
Klaus Glenk, Vera Eory, Andrew Barnes (all SRUC)

2 2
Outline
• What to change?
• Case study – dairy farmers’ perception of GHG
mitigation practices
• Outlook

3 3
What to change?
• GHG mitigation on dairy farms – plenty of suggested
management practices
• How to prioritise?
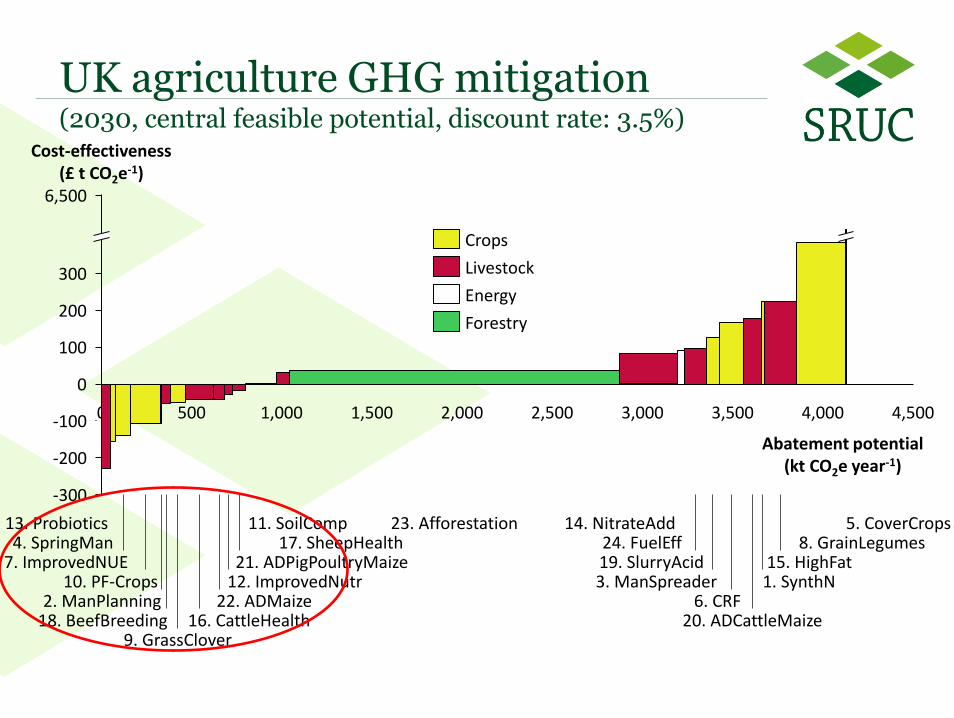
• Cost-effectiveness and mitigation potential: Marginal
abatement Cost Curves (MACC curves)
4 4
UK agriculture GHG mitigation (2030, central feasible potential, discount rate: 3.5%)
0 4,500 500 1,000
-300
-200
300
6,500
1,500 2,000 2,500 3,500 4,000
200
0
-100
100
3,000
20. ADCattleMaize
1. SynthN 15. HighFat
8. GrainLegumes 5. CoverCrops
22. ADMaize 12. ImprovedNutr 21. ADPigPoultryMaize
18. BeefBreeding
11. SoilComp 17. SheepHealth
23. Afforestation 14. NitrateAdd
3. ManSpreader
24. FuelEff
Cost-effectiveness (£ t CO2e-1)
19. SlurryAcid
6. CRF 2. ManPlanning 10. PF-Crops
7. ImprovedNUE 4. SpringMan
13. Probiotics
9. GrassClover 16. CattleHealth
Abatement potential (kt CO2e year-1)
Livestock
Forestry
Energy
Crops

5 5
Questions
• How do farmers perceive and evaluate the GHG
management practices that MACCs identify as
‘win-wins’?
• What is the current level of (policy) support for
uptake of positively evaluated practices?

6 6
GHG mitigation practices: dairy
• Important agricultural sector globally and in Scotland
• Contribution of dairy supply chain to global GHG
emissions 4%, to Scottish GHG emissions 3%
• Dairy sector increasingly relevant

7 7
GHG mitigation practices: dairy Animal nutrition
P1 Planting high sugar content (high WSC) ryegrass (e.g. Aber HSG)
P2 Reducing grass in the diet and feeding more concentrates/grains/total mixed rations
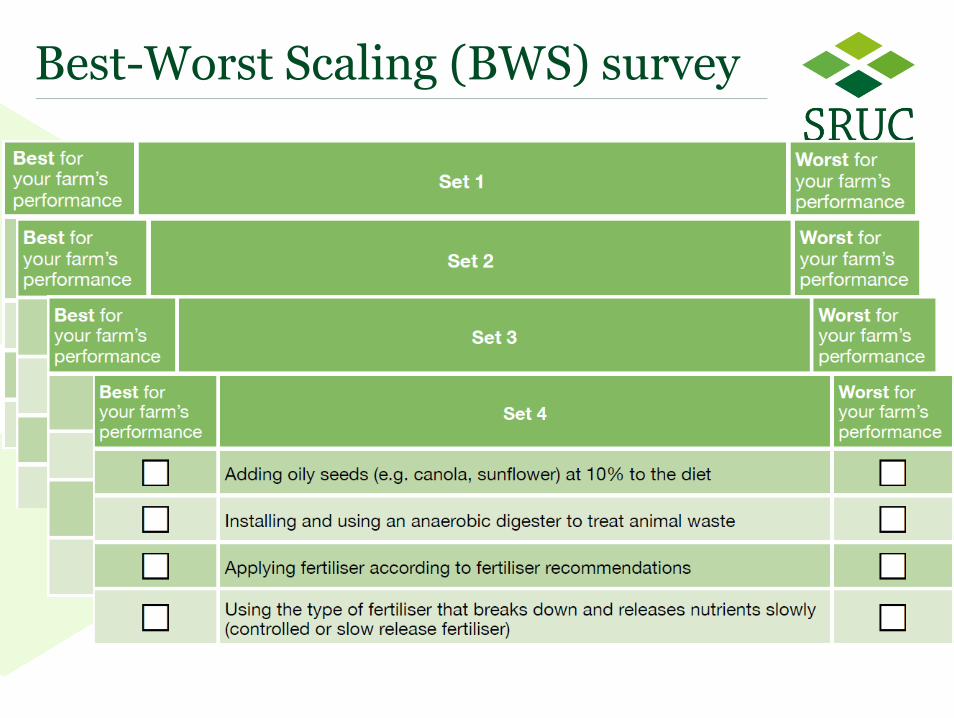
P3 Adding oily seeds (e.g. canola, sunflower) at 10% to the diet
P4 Adding a live microbial feed supplement (e.g. Lactobacillus sp.) to the complete diet directly
P5 Applying feed and ration management (including forage/fodder analysis) with a feed company or advisor involved to
optimise nutrient use of animals
Animal productivity
P6 Working with veterinary surgeons to optimise biosecurity, vaccination and herd health
P7 Using bull semen from high PLI indexed bulls
P8 Using sexed semen to increase proportion of females born
P9 Moving from 2 to 3 times milking per day
Soil and fertiliser management
P10 Using high-clover swards (20% of dry matter)
P11 Applying fertiliser according to fertiliser recommendations
P12 Make manure management plans taking full account of nutrients available in the manure
P13 Maintaining old drainage system (or installing a new one if needed) to improve drainage on fields
P14 Preventing soil compaction (e.g. avoiding heavy machinery and livestock poaching when soils are wet or saturated)
P15 Using the type of fertiliser that breaks down and releases nutrients slowly (controlled or slow release fertiliser)
P16 Using chemicals to prevent loss of N due to nitrification (nitrification inhibitors)
P17 Changing to crops which require less nitrogen fertilisation
Manure storage
P18 Frequently (twice-a-week) removing manure from the cattle shed to outside storage (e.g. to manure heap; slurry tank)
P19 Installing and using an anaerobic digester to treat animal waste
P20 Covering the manure storage (e.g. straw, plastic film, tent, or lid in case of slurry and plastic film for farm yard manure)
8 8
Best-Worst Scaling (BWS) survey

9 9
Best-Worst Scaling (BWS)
• Derive relative preference ranking of mitigation practices
• We take current adoption rates into account: most
informative is how practices are perceived by non-
adopters
• Relative ranking can be compared with available
information on effectiveness and policy support

10 10
BWS choice data: modelling
• Probability that an individual chooses a GHG
mitigation practice as ‘best’ in a given set of
practices
• Sample-level or individual-specific ‘impact scores’
- 0-100 point scale; e.g. score for j1 = 10; j2 =5 then j1 is
perceived to contribute twice as much to farm performance
• Promising practices: high impact scores of non-
adopters & low to modest rate of current adoption

11 11
Sample
• Sample derived from Agricultural Census database
• All dairy farms (incl. mixed) > 5 dairy cows: 1,290
• Mail survey, two waves, 5 weeks between waves
• Response rate: 18% (235 responses)
• Sample representative with respect to standard
gross margin, economic size unit, standard labour
requirement, area (ha)

12 12
Results: Adoption Measure Short descriptor Currently adopted (%)
Animal nutrition
P1 High sugar content ryegrass 51.9 P2 Reducing grass and more concentrates in diet 30.2 P3 Adding oily seeds to diet 3.8 P4 Adding live microbial feed supplement to diet 20.9 P5 Applying feed and ration management 94.9
Animal productivity P6 Working with veterinary surgeons 93.2 P7 Semen from high PLI indexed bulls 60.4 P8 Sexed semen 51.9 P9 3 times milking per day 9.8
Soil and fertiliser management P10 High-clover swards 34.9 P11 Following fertiliser recommendations 86.4 P12 Manure management plans 79.6 P13 Improve drainage on fields 89.4 P14 Preventing soil compaction 92.8 P15 Controlled/slow release fertiliser 26.8 P16 Nitrification inhibitors 4.3 P17 Lower N-requiring crops 20.9
Manure storage P18 Frequent removal of manure 46 P19 Anaerobic digester 0.9 P20 Covering the manure storage 3.8
• On average, nine practices were reported to be currently adopted
• Plenty of heterogeneity in adoption patterns
• Probit regressions to explain adoption were run for all practices
• Only few significant factors, inconsistent across practices
• E.g. age, education and experience only significant for P8,P11,P16,P18
13 13
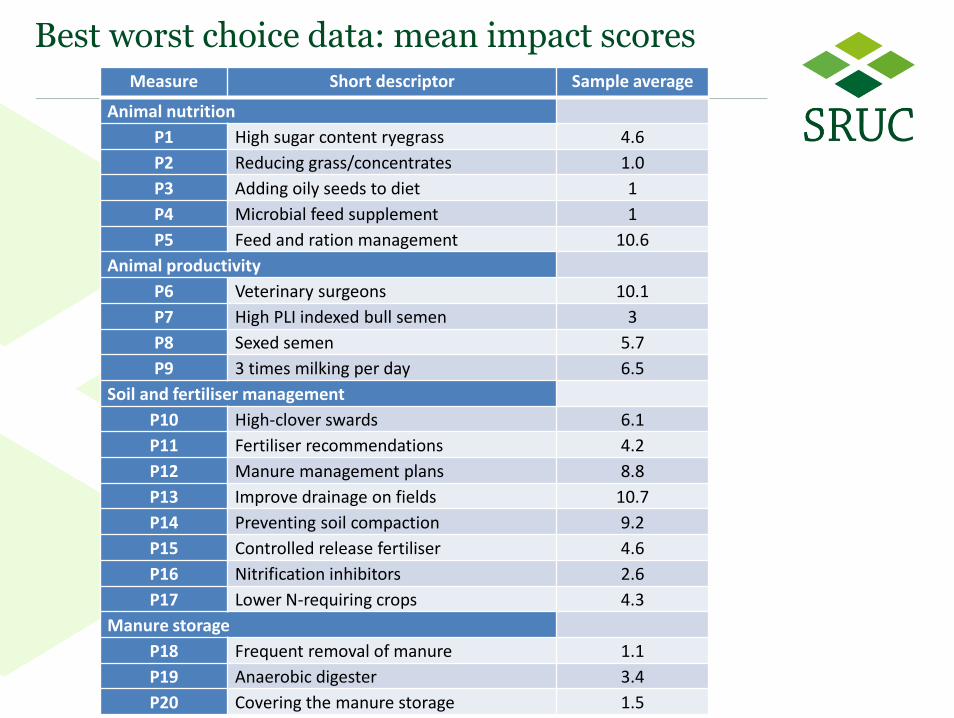
Best worst choice data: mean impact scores Measure Short descriptor Sample average
Animal nutrition
P1 High sugar content ryegrass 4.6
P2 Reducing grass/concentrates 1.0
P3 Adding oily seeds to diet 1
P4 Microbial feed supplement 1
P5 Feed and ration management 10.6
Animal productivity
P6 Veterinary surgeons 10.1
P7 High PLI indexed bull semen 3
P8 Sexed semen 5.7
P9 3 times milking per day 6.5
Soil and fertiliser management
P10 High-clover swards 6.1
P11 Fertiliser recommendations 4.2
P12 Manure management plans 8.8
P13 Improve drainage on fields 10.7
P14 Preventing soil compaction 9.2
P15 Controlled release fertiliser 4.6
P16 Nitrification inhibitors 2.6
P17 Lower N-requiring crops 4.3
Manure storage
P18 Frequent removal of manure 1.1
P19 Anaerobic digester 3.4
P20 Covering the manure storage 1.5
14 14
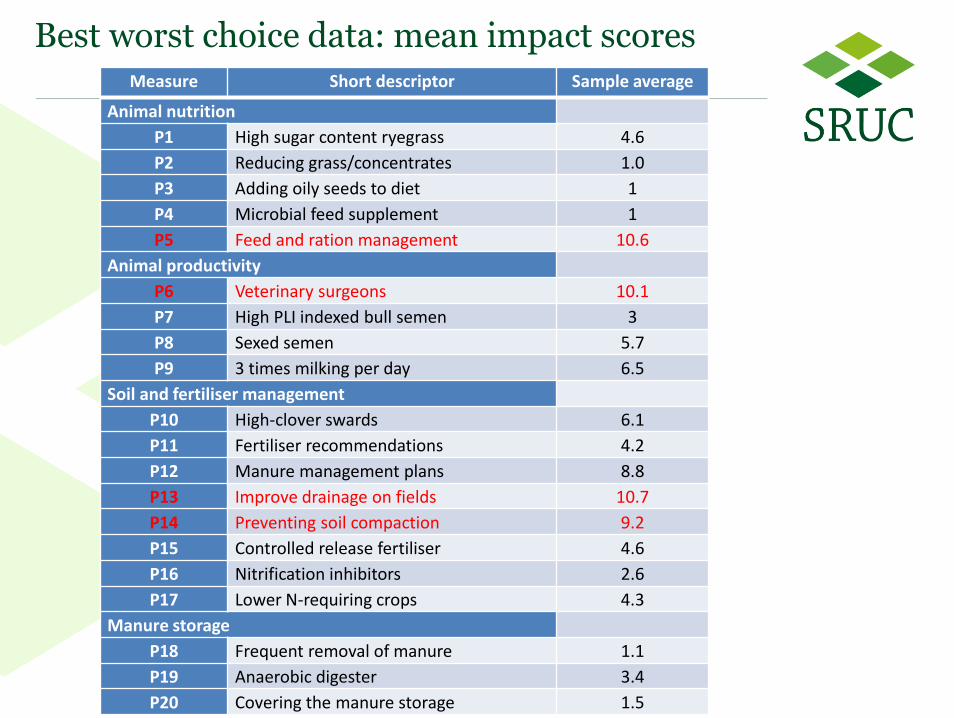
Best worst choice data: mean impact scores Measure Short descriptor Sample average
Animal nutrition
P1 High sugar content ryegrass 4.6
P2 Reducing grass/concentrates 1.0
P3 Adding oily seeds to diet 1
P4 Microbial feed supplement 1
P5 Feed and ration management 10.6
Animal productivity
P6 Veterinary surgeons 10.1
P7 High PLI indexed bull semen 3
P8 Sexed semen 5.7
P9 3 times milking per day 6.5
Soil and fertiliser management
P10 High-clover swards 6.1
P11 Fertiliser recommendations 4.2
P12 Manure management plans 8.8
P13 Improve drainage on fields 10.7
P14 Preventing soil compaction 9.2
P15 Controlled release fertiliser 4.6
P16 Nitrification inhibitors 2.6
P17 Lower N-requiring crops 4.3
Manure storage
P18 Frequent removal of manure 1.1
P19 Anaerobic digester 3.4
P20 Covering the manure storage 1.5

15 15
Best worst choice data: mean impact scores Measure Short descriptor Sample average
Animal nutrition
P1 High sugar content ryegrass 4.6
P2 Reducing grass/concentrates 1.0
P3 Adding oily seeds to diet 1
P4 Microbial feed supplement 1
P5 Feed and ration management 10.6
Animal productivity
P6 Veterinary surgeons 10.1
P7 High PLI indexed bull semen 3
P8 Sexed semen 5.7
P9 3 times milking per day 6.5
Soil and fertiliser management
P10 High-clover swards 6.1
P11 Fertiliser recommendations 4.2
P12 Manure management plans 8.8
P13 Improve drainage on fields 10.7
P14 Preventing soil compaction 9.2
P15 Controlled release fertiliser 4.6
P16 Nitrification inhibitors 2.6
P17 Lower N-requiring crops 4.3
Manure storage
P18 Frequent removal of manure 1.1
P19 Anaerobic digester 3.4
P20 Covering the manure storage 1.5
16 16
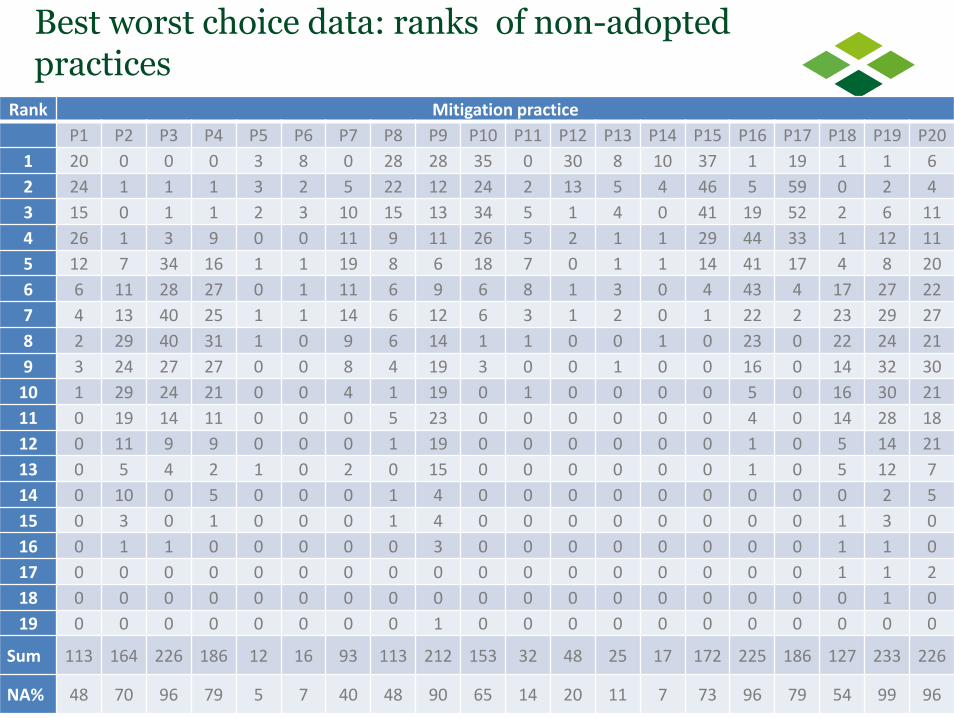
Best worst choice data: ranks of non-adopted practices
Rank Mitigation practice
P1 P2 P3 P4 P5 P6 P7 P8 P9 P10 P11 P12 P13 P14 P15 P16 P17 P18 P19 P20
1 20 0 0 0 3 8 0 28 28 35 0 30 8 10 37 1 19 1 1 6
2 24 1 1 1 3 2 5 22 12 24 2 13 5 4 46 5 59 0 2 4
3 15 0 1 1 2 3 10 15 13 34 5 1 4 0 41 19 52 2 6 11
4 26 1 3 9 0 0 11 9 11 26 5 2 1 1 29 44 33 1 12 11
5 12 7 34 16 1 1 19 8 6 18 7 0 1 1 14 41 17 4 8 20
6 6 11 28 27 0 1 11 6 9 6 8 1 3 0 4 43 4 17 27 22
7 4 13 40 25 1 1 14 6 12 6 3 1 2 0 1 22 2 23 29 27
8 2 29 40 31 1 0 9 6 14 1 1 0 0 1 0 23 0 22 24 21
9 3 24 27 27 0 0 8 4 19 3 0 0 1 0 0 16 0 14 32 30
10 1 29 24 21 0 0 4 1 19 0 1 0 0 0 0 5 0 16 30 21
11 0 19 14 11 0 0 0 5 23 0 0 0 0 0 0 4 0 14 28 18
12 0 11 9 9 0 0 0 1 19 0 0 0 0 0 0 1 0 5 14 21
13 0 5 4 2 1 0 2 0 15 0 0 0 0 0 0 1 0 5 12 7
14 0 10 0 5 0 0 0 1 4 0 0 0 0 0 0 0 0 0 2 5
15 0 3 0 1 0 0 0 1 4 0 0 0 0 0 0 0 0 1 3 0
16 0 1 1 0 0 0 0 0 3 0 0 0 0 0 0 0 0 1 1 0
17 0 0 0 0 0 0 0 0 0 0 0 0 0 0 0 0 0 1 1 2
18 0 0 0 0 0 0 0 0 0 0 0 0 0 0 0 0 0 0 1 0
19 0 0 0 0 0 0 0 0 1 0 0 0 0 0 0 0 0 0 0 0
Sum 113 164 226 186 12 16 93 113 212 153 32 48 25 17 172 225 186 127 233 226
NA% 48 70 96 79 5 7 40 48 90 65 14 20 11 7 73 96 79 54 99 96

17 17
Best worst choice data: ranks of non-adopted practices
Rank Mitigation practice
P1 P2 P3 P4 P5 P6 P7 P8 P9 P10 P11 P12 P13 P14 P15 P16 P17 P18 P19 P20
1 20 0 0 0 3 8 0 28 28 35 0 30 8 10 37 1 19 1 1 6
2 24 1 1 1 3 2 5 22 12 24 2 13 5 4 46 5 59 0 2 4
3 15 0 1 1 2 3 10 15 13 34 5 1 4 0 41 19 52 2 6 11
4 26 1 3 9 0 0 11 9 11 26 5 2 1 1 29 44 33 1 12 11
5 12 7 34 16 1 1 19 8 6 18 7 0 1 1 14 41 17 4 8 20
6 6 11 28 27 0 1 11 6 9 6 8 1 3 0 4 43 4 17 27 22
7 4 13 40 25 1 1 14 6 12 6 3 1 2 0 1 22 2 23 29 27
8 2 29 40 31 1 0 9 6 14 1 1 0 0 1 0 23 0 22 24 21
9 3 24 27 27 0 0 8 4 19 3 0 0 1 0 0 16 0 14 32 30
10 1 29 24 21 0 0 4 1 19 0 1 0 0 0 0 5 0 16 30 21
11 0 19 14 11 0 0 0 5 23 0 0 0 0 0 0 4 0 14 28 18
12 0 11 9 9 0 0 0 1 19 0 0 0 0 0 0 1 0 5 14 21
13 0 5 4 2 1 0 2 0 15 0 0 0 0 0 0 1 0 5 12 7
14 0 10 0 5 0 0 0 1 4 0 0 0 0 0 0 0 0 0 2 5
15 0 3 0 1 0 0 0 1 4 0 0 0 0 0 0 0 0 1 3 0
16 0 1 1 0 0 0 0 0 3 0 0 0 0 0 0 0 0 1 1 0
17 0 0 0 0 0 0 0 0 0 0 0 0 0 0 0 0 0 1 1 2
18 0 0 0 0 0 0 0 0 0 0 0 0 0 0 0 0 0 0 1 0
19 0 0 0 0 0 0 0 0 1 0 0 0 0 0 0 0 0 0 0 0
Sum 113 164 226 186 12 16 93 113 212 153 32 48 25 17 172 225 186 127 233 226
NA% 48 70 96 79 5 7 40 48 90 65 14 20 11 7 73 96 79 54 99 96
High sugar content ryegrass
Sexed semen
High-clover swards
Controlled/slow release fertiliser
Lower N-requiring crops

18 18
Best worst choice data: ranks of non-adopted practices
Rank Mitigation practice
P1 P2 P3 P4 P5 P6 P7 P8 P9 P10 P11 P12 P13 P14 P15 P16 P17 P18 P19 P20
1 20 0 0 0 3 8 0 28 28 35 0 30 8 10 37 1 19 1 1 6
2 24 1 1 1 3 2 5 22 12 24 2 13 5 4 46 5 59 0 2 4
3 15 0 1 1 2 3 10 15 13 34 5 1 4 0 41 19 52 2 6 11
4 26 1 3 9 0 0 11 9 11 26 5 2 1 1 29 44 33 1 12 11
5 12 7 34 16 1 1 19 8 6 18 7 0 1 1 14 41 17 4 8 20
6 6 11 28 27 0 1 11 6 9 6 8 1 3 0 4 43 4 17 27 22
7 4 13 40 25 1 1 14 6 12 6 3 1 2 0 1 22 2 23 29 27
8 2 29 40 31 1 0 9 6 14 1 1 0 0 1 0 23 0 22 24 21
9 3 24 27 27 0 0 8 4 19 3 0 0 1 0 0 16 0 14 32 30
10 1 29 24 21 0 0 4 1 19 0 1 0 0 0 0 5 0 16 30 21
11 0 19 14 11 0 0 0 5 23 0 0 0 0 0 0 4 0 14 28 18
12 0 11 9 9 0 0 0 1 19 0 0 0 0 0 0 1 0 5 14 21
13 0 5 4 2 1 0 2 0 15 0 0 0 0 0 0 1 0 5 12 7
14 0 10 0 5 0 0 0 1 4 0 0 0 0 0 0 0 0 0 2 5
15 0 3 0 1 0 0 0 1 4 0 0 0 0 0 0 0 0 1 3 0
16 0 1 1 0 0 0 0 0 3 0 0 0 0 0 0 0 0 1 1 0
17 0 0 0 0 0 0 0 0 0 0 0 0 0 0 0 0 0 1 1 2
18 0 0 0 0 0 0 0 0 0 0 0 0 0 0 0 0 0 0 1 0
19 0 0 0 0 0 0 0 0 1 0 0 0 0 0 0 0 0 0 0 0
Sum 113 164 226 186 12 16 93 113 212 153 32 48 25 17 172 225 186 127 233 226
NA% 48 70 96 79 5 7 40 48 90 65 14 20 11 7 73 96 79 54 99 96
Manure management plans
3 times milking per day

19 19
Best worst choice data: ranks of non-adopted practices
Rank Mitigation practice
P1 P2 P3 P4 P5 P6 P7 P8 P9 P10 P11 P12 P13 P14 P15 P16 P17 P18 P19 P20
1 20 0 0 0 3 8 0 28 28 35 0 30 8 10 37 1 19 1 1 6
2 24 1 1 1 3 2 5 22 12 24 2 13 5 4 46 5 59 0 2 4
3 15 0 1 1 2 3 10 15 13 34 5 1 4 0 41 19 52 2 6 11
4 26 1 3 9 0 0 11 9 11 26 5 2 1 1 29 44 33 1 12 11
5 12 7 34 16 1 1 19 8 6 18 7 0 1 1 14 41 17 4 8 20
6 6 11 28 27 0 1 11 6 9 6 8 1 3 0 4 43 4 17 27 22
7 4 13 40 25 1 1 14 6 12 6 3 1 2 0 1 22 2 23 29 27
8 2 29 40 31 1 0 9 6 14 1 1 0 0 1 0 23 0 22 24 21
9 3 24 27 27 0 0 8 4 19 3 0 0 1 0 0 16 0 14 32 30
10 1 29 24 21 0 0 4 1 19 0 1 0 0 0 0 5 0 16 30 21
11 0 19 14 11 0 0 0 5 23 0 0 0 0 0 0 4 0 14 28 18
12 0 11 9 9 0 0 0 1 19 0 0 0 0 0 0 1 0 5 14 21
13 0 5 4 2 1 0 2 0 15 0 0 0 0 0 0 1 0 5 12 7
14 0 10 0 5 0 0 0 1 4 0 0 0 0 0 0 0 0 0 2 5
15 0 3 0 1 0 0 0 1 4 0 0 0 0 0 0 0 0 1 3 0
16 0 1 1 0 0 0 0 0 3 0 0 0 0 0 0 0 0 1 1 0
17 0 0 0 0 0 0 0 0 0 0 0 0 0 0 0 0 0 1 1 2
18 0 0 0 0 0 0 0 0 0 0 0 0 0 0 0 0 0 0 1 0
19 0 0 0 0 0 0 0 0 1 0 0 0 0 0 0 0 0 0 0 0
Sum 113 164 226 186 12 16 93 113 212 153 32 48 25 17 172 225 186 127 233 226
NA% 48 70 96 79 5 7 40 48 90 65 14 20 11 7 73 96 79 54 99 96
Semen from high PLI indexed bulls
Nitrification inhibitors
20 20
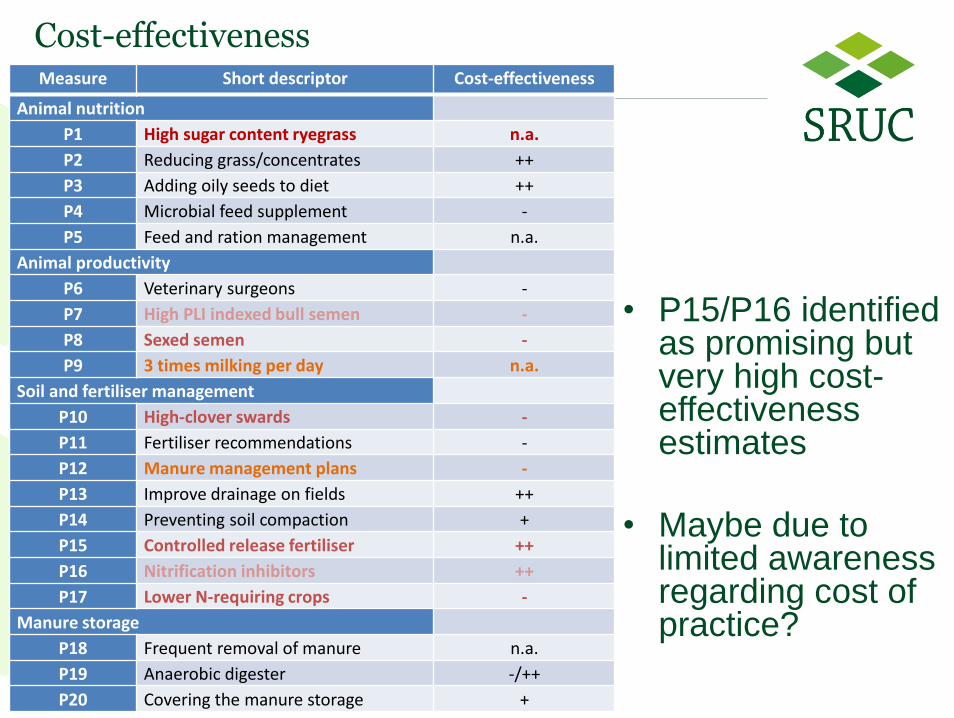
Cost-effectiveness
• P15/P16 identified as promising but very high cost-effectiveness estimates
• Maybe due to limited awareness regarding cost of practice?
Measure Short descriptor Cost-effectiveness
Animal nutrition
P1 High sugar content ryegrass n.a.
P2 Reducing grass/concentrates ++
P3 Adding oily seeds to diet ++
P4 Microbial feed supplement -
P5 Feed and ration management n.a.
Animal productivity
P6 Veterinary surgeons -
P7 High PLI indexed bull semen -
P8 Sexed semen -
P9 3 times milking per day n.a.
Soil and fertiliser management
P10 High-clover swards -
P11 Fertiliser recommendations -
P12 Manure management plans -
P13 Improve drainage on fields ++
P14 Preventing soil compaction +
P15 Controlled release fertiliser ++
P16 Nitrification inhibitors ++
P17 Lower N-requiring crops -
Manure storage
P18 Frequent removal of manure n.a.
P19 Anaerobic digester -/++
P20 Covering the manure storage +

21 21
Policy support?
V = voluntary
M = mandatory (to some degree)
FI = financial incentives
Measure Short descriptor Current support
Animal nutrition
P1 High sugar content ryegrass -
P2 Reducing grass/concentrates -
P3 Adding oily seeds to diet -
P4 Microbial feed supplement -
P5 Feed and ration management V
Animal productivity
P6 Veterinary surgeons -
P7 High PLI indexed bull semen FI
P8 Sexed semen -
P9 3 times milking per day -
Soil and fertiliser management
P10 High-clover swards V
P11 Fertiliser recommendations V, M
P12 Manure management plans V, M
P13 Improve drainage on fields V
P14 Preventing soil compaction V
P15 Controlled release fertiliser -
P16 Nitrification inhibitors -
P17 Lower N-requiring crops V
Manure storage
P18 Frequent removal of manure -
P19 Anaerobic digester V, FI
P20 Covering the manure storage V, FI

22 22
Conclusions
• Information on current adoption is important – previously ignored
• Successful identification of promising practices based on
- low to moderate current levels of non-adoption (potential)
- positive perception among non-adopters
• Useful to inform short-term decision making and motivate in-depth investigations of promising practices

23 23
… more questions
• How do farmers perceive and evaluate the GHG
management practices that MACCs identify as ‘win-
wins’?
• What is the current level of (policy) support for uptake
of positively evaluated practices?
• What is the role of information, expectations and
constraints in adoption?
• How to encourage farmers to take up the practices?

24 24
• Trade-offs in implementing mitigation measures
• Effectiveness of FFBC
• Uptake Nutrient Management and Social
Networks
• Evaluation of KE and Monitor Farm Networks
• Examinations of intensification and
extensification preferences (intentions survey)
Outlook – research ahead

25 25
Beyond economically rational decision makers
Moran, D., Lucas, A. and Barnes, A.P. (2013). Mitigation Win win. Nature Climate Change
• Social learning
• Can use prestige to
influence carbon
behaviours?

26 26
Motivating Behavioural Change
• Behaviour change in farmers can be facilitated:
- at a geographical level
- by paying attention to farmers’ social networks
- by targeting individuals and institutions known to
influence farmers’ opinions.

27 27
Best worst choice data: model results MXL
Base effects Interactions with
stated adoption
dummy
Standard deviation
of random
parameters
P1 -0.07 1.81 *** 0.96 ***
P2 -2.37 *** 2.74 *** 1.14 ***
P3 -1.89 *** 1.67 *** 0.70 ***
P4 -1.90 *** 1.81 *** 0.86 ***
P5 0.41 4.09 *** 2.42 ***
P6 1.18 ** 2.28 *** 1.67 ***
P7 -1.06 *** 2.61 *** 0.86 ***
P8 -0.32 2.87 *** 1.43 ***
P9 -2.13 *** 6.81 *** 2.85 ***
P10 -0.05 2.63 *** 1.01 ***
P11 -0.74 ** 2.82 *** 0.67 **
P12 1.26 *** 1.44 *** 1.08 ***
P13 0.51 3.93 *** 1.96 ***
P14 1.24 ** 1.75 *** 1.52 ***
P15 0.02 1.63 *** 0.13
P16 -1.20 *** 2.56 *** 0.75 ***
P17 0 (fixed) 1.48 *** -
P18 -1.91 *** 2.12 *** 1.03 ***
P19 -2.29 *** 4.97 *** 1.56 ***
P20 -2.01 *** 2.84 *** 1.56 ***
• Adoption consistently
increases likelihood of
choosing practice as
‘best’

28 28
GHG mitigation practices: dairy
• Long list of 85 identified mitigation practices
• Narrowed down to 20 – exclude practices if
- legal restrictions exist at present (e.g. growth hormones)
- further technological advances are required (e.g.
vaccination against methanogens)
- the contribution to dairy farm GHG emissions is relatively
minor