belize marine conservation science report 161
TRANSCRIPT

BZM 161
1
BELIZE BEACH CONSERVATION, MARINE
CONSERVATION AND DIVING PROGRAMME
Caye Caulker, Belize
BZM Phase 161 Science Report
December – February 2015/16

BZM 161
2
Staff Members and Authors
Name Position
Holly Connolly (HC) Principal Investigator (PI)
Alex Sullivan (AS) Assistant Research Officer (ARO)

BZM 161
3
Contents
1.0 Introduction.................................................................................................................................. 5
1.1 Project Background and Location ....................................................................................... 5
1.2 Caye Caulken Marine Reserve (CCMR) ................................................................................. 6
1.3 Aims of the Project .............................................................................................................. 9
1.4 Phase 161 Achievements .................................................................................................. 10
Camp and logistical achievements: .......................................................................................... 10
Scientific development/achievements: .................................................................................... 10
Community engagement: ......................................................................................................... 10
2.0 Field Training .............................................................................................................................. 11
2.1. Science Training and Volunteer Briefings ........................................................................ 11
2.2 Dive Training ...................................................................................................................... 12
2.3 BTEC ................................................................................................................................... 12
3.0 SMP coral reef diving surveys .................................................................................................... 13
3.1 Introduction....................................................................................................................... 13
3.2 Survey Sites ....................................................................................................................... 15
Site 1: North Back-reef (NB): .................................................................................................... 15
Site 2: South Back-reef (SB): ..................................................................................................... 15
3.3 Methodology ..................................................................................................................... 16
3.4 Coral abbreviations ........................................................................................................... 17
3.5 Coral Results ...................................................................................................................... 17
Benthic community compositions ............................................................................................ 18
Coral characterisation .............................................................................................................. 21
3.6 Discussion .......................................................................................................................... 25
3.7 Fish Results ........................................................................................................................ 27
3.8 Discussion .......................................................................................................................... 29
4.0 Caribbean Spiny Lobster Surveys ............................................................................................... 30
4.1 Introduction....................................................................................................................... 30
4.2 Methodology ..................................................................................................................... 31
4.3 Results ............................................................................................................................... 32
BZM 161
4
5.0 Seagrass Monitoring ................................................................................................................... 33
5.1 Introduction....................................................................................................................... 33
5.3 Methodology ..................................................................................................................... 35
Seagrass mapping (preliminary) ............................................................................................... 35
5.4 Results ............................................................................................................................... 36
Seagrass coverage .................................................................................................................... 36
Discussion ................................................................................................................................ 38
4.0 Queen Conch Surveys ..................................................................... Error! Bookmark not defined.
4.1 Introduction...........................................................................Error! Bookmark not defined.
4.2 Aims & Objectives .................................................................Error! Bookmark not defined.
4.3 Methodology .........................................................................Error! Bookmark not defined.
4.4 Results ...................................................................................Error! Bookmark not defined.
8.0 Marine Debris Monitoring .............................................................. Error! Bookmark not defined.
8.1 Introduction...........................................................................Error! Bookmark not defined.
8.2 Aims and Objectives ..............................................................Error! Bookmark not defined.
8.3 Methodology .........................................................................Error! Bookmark not defined.
8.4 Results ...................................................................................Error! Bookmark not defined.
No results on marine debris collected during this phase. ...........Error! Bookmark not defined.
7.0 Mangrove Monitoring .................................................................... Error! Bookmark not defined.
7.1 Introduction...........................................................................Error! Bookmark not defined.
7.2 Aims and Objectives ..............................................................Error! Bookmark not defined.
7.3 Methodology .........................................................................Error! Bookmark not defined.
7.4 Results ...................................................................................Error! Bookmark not defined.
No mangrove data collected during this phase. .........................Error! Bookmark not defined.
6.0 References ......................................................................................................................... 39
7.0 Appendices ................................................................................................................................. 44
7.1 Appendix 1......................................................................................................................... 46

BZM 161
5
1.0 Introduction
1.1 Project Background and Location
The Frontier Belize Marine Conservation and Diving (BZM) Project was established in April 2014
within the Caye Caulker Forest and Marine Reserve (see figure 1). The Frontier Belize camp hosts
Marine Conservation and Diving and Beach Conservation volunteers. It is located on the n
0 W c ast of Central Belize in the
Caribbean Sea. The project aims to conduct long term monitoring of key habitats and species
through the work of international volunteers and in collaboration with: the governmental Belize
Fisheries Department (BFD), and the non-governmental Forest and Marine Reserve Association of
Caye Caulker (FAMRACC), whom co-ma g m v .
Belize is a small tropical Caribbean country located at the northeast end of Central America with
Mexico to the north and Guatemala to the west and south. The Belize Barrier Reef System (BBRS)
is the largest barrier reef in the northern hemisphere, and consists of a number of offshore coral
atolls, sand cays, mangrove forest and coastal lagoons. In fact, Belize boasts three of the four
coral atolls of the Caribbean: Lighthouse Reef (location of the famous Great Blue Hole), Turneffe
I G v R (Gibson et al. 1998). BBRS is the largest single section of the
Mesoamerican barrier reef system (MBRS), which extends ~950 kilometres from Mexico all the
way down to the Honduran Bay Islands In all, Belize provides a unique breadth of biological and
geological diversity.
CC is a small limestone coral island which spans approximately 8km from north to south and
approximately 1.5km east to west at its widest part. The small island is located approximately
35km east of the mainland. CC p b w w w ‘ p
creating a north and south divide of the island. The small local population, tourists and the
majority of infrastructure are located on the smaller south island which holds a population of
approximately 1700 residents and many transient visitors (CZMAI 2016). Many tourists visit the
island due to the abundance of marine flora and fauna, which provide excellent snorkelling and
diving opportunities b ‘G S w b m Caribbean culture.
Unfortunately, as with much of our natural world, the marine life around CC is under threat from
many anthropogenic factors; especially coastal development, which has occurred rapidly over
recent years in CC (CZMAI 2016). Other factors include climate change, overfishing, disturbance
from tourism and related activities, and ecological disturbances due to invasive organisms. Of the
many species affected, several are of substantial international concern such as staghorn and

BZM 161
6
elkhorn corals (Acropora cervicornis and A. palmata) and hawksbill turtle (Eretmochelys
imbricata), which are all liste ‘c c g . T green (Chelonia mydas) and
loggerhead (Caretta caretta) turtles, are also at considerable risk of extinction, being listed as
‘ g (IU 20 ). CC is also home to West Indian manatees (Trichechus manatus), which
are c ‘vulnerable , and common bottlenose dolphins (Tursiops aduncus), currently
c ‘ c c , yet are a charismatic species which are understudied and threatened
by many anthropogenic factors (Belize Fisheries Department, 2010; IUCN, 2014).
The coastal waters around Caye Caulker provide rich fishery grounds for two of the most
important commercial fisheries in Belize: the Caribbean spiny lobster (Panulirus argus) and the
queen conch (Strombus gigas). Currently there is a strict management regime in place to regulate
the fishing seasons for each species, size and gear restriction (CZMAI 2016). The hope is that these
regulations will maintain healthy and sustainable populations within the area. Size (length and
weight) is a useful parameter to control and manage the overfishing of conch or lobster
populations since the shell of the queen conch and the carapace of the spiny lobster provide an
important vector for estimating sexual maturity (Huitric 2005).
1.2 Caye Caulker Marine Reserve (CCMR)
Caye Caulker does not only boast temporal marine management initiatives, but also spatial
marine management: The Caye Caulker Marine Reserve (CCMR) is 11km long, extending to the
Belize Barrier Reef from the northern tip of Caye Caulker. The CCMR was established in the early
1990s but did not become completely recognized as a marine reserve until 1998 at which point it
was included alongside the Caye Caulker Forest Reserve (CCFR) as part of a single management
unit. CCMR and CCFR encompass an area of 40 square kilometres and 0.5 square kilometres
respectively (CZMAI 2016). This unit was set up with the aim of ensuring protection of the littoral
forest, reef lagoon, reef crest and fore reef areas.
CCMR encompasses five ecologically-related but distinct habitats: mangrove forest, littoral
forests, lagoon marsh-lands, seagrass beds and coral reefs. The marine reserve is managed via
three regulated zones: The General Use Zone (GZ) comprises 6,199 acres, the Conservation Zone
(CZ) 2,029 acres, and the Preservation Zone (PZ) 1,442 acres (Belize Fisheries Department 2010).
Both CZ and PZ are non-extractive and do not allow fishing. However, CZ allows recreational use
which primarily includes snorkelling and diving. Whereas, PZ does not allow recreational use and
is principally set aside for the recovery of overexploited populations of marine life. The GZ permits
commercial and sports fishing alongside recreational use. The GZ also acts as a buffer-zone for the

BZM 161
7
rest of the marine reserve. Use of CCMR is charged at $10 Belize dollars per tourist, locals may use
the reserve for free. Outside of CCMR there is no charge to marine users and less monitored by
the Caye Caulke Fisheries Department. However, even though strict fishery management
practices are in place, overfishing and illegal fishing is a still considerable issue in Caye Caulker,
and across Belize. In fact, many fishermen have reported that their catch per unit effort (time
spent fishing) has decreased noticeably in recent years (CZMAI 2016).
CCMR mp c c m b c m g g m,
evident with residents of Caye Caulker being almost solely dependent upon tourism as a source of
income. Furthermore, all users of the marine reserve are charged for the privilege and this income
helps to subsidise management of the area. The reserve also provides essential ecosystem
services, through protecting the reef habitat which local populations of important commercial
species rely upon, also by protecting Caye Caulker from storm damage and the erosive force of
waves (Belize Fisheries Department, 2010). Consequently, research into the sustainability and
effectiveness v c m g ment plan is essential for stakeholders involved, and
is something that is relatively understudied. Management of the Belize Barrier reef was originally
envisioned through the creation of marine protected areas (MPAs), however, the influence of
land-based activities was not accounted for within these programs. As a result the focus was
shifted towards the previously described integrated, multi-sectoral approach currently used in
Belize's marine reserves (Cho, 2005), including Caye Caulker Marine Reserve.
The research conducted by Frontier within the CCMR lies within the MBRS and therefore involves
methods adapted from the MBRS Regional Synoptic Monitoring Program (SMP), a multi-level
methodology designed to monitor changes in ecosystem health for research and management
purposes. Standard Frontier methodology is also incorporated to provide an effective and yet
reliable way of utilizing volunteers as a resource for data collection during surveys.
Surveys carried out as part of BZM include MBRS SMP surveys (fish, benthic, coral colony
characterization, and invertebrates), conch, lobster, mangrove, seagrass, and beach clean surveys.
It is important to note that some surveys are seasonally dependent. See figure 1 for a map of
established survey sites.

BZM 161
8
Figure 1: Map of the island of Caye Caulker showing the location of Frontier base camp and survey
sites.
N

BZM 161
9
1.3 Aims of the Project
1. To establish new fixed survey sites in addition to the sites suggested and used by BFD and
FAMRACC.
2. Continue to collect data on the health of the coral reef via the Mesoamerican Barrier Reef
system (MBRS) synoptic monitoring programme (SMP) methodology. This currently includes the
benthic point intercept transect surveys, coral colony characterisation surveys and the
adult/juvenile reef fish surveys.
3. Continue to collect data on the abundance, sex ratios, maturity and size-frequency distributions
of the commercially important Caribbean spiny lobster throughout the year, in order to
supplement the current biannual data collection of the FD and FAMRACC.
4. Reinstate and establish sites for data collection on the abundance, sex ratios and size-frequency
distributions of the commercially important Queen conch alongside FD and FAMRACC.
5. To continue and improve the current seagrass surveys on species composition, %coverage,
abundance and health across the four established survey sites.
6. Initiate a mangrove mapping project within the forest reserve with the intention to collect
regular data on the long-term health of the mangrove habitat.
7. Reinstate the manatee monitoring project during manatee observation season.
8. Continue to build upon new connections with the local community, including local NGO Oceana
and the local private high school Ocean Academy.

BZM 161
10
1.4 Phase 161 Achievements
Camp and logistical achievements:
Improved boat security
Improved training resources
Boat licensing
Scientific development/achievements:
Re-continued lobster surveys after the close of Caribbean lobster season
Reworked seagrass survey methodology (apparent next phase)
Improved graphical and statistical analysis (use of new software)
Community engagement:
A pivotal consultancy v v b
Continued participation in the local beach clean (Saturday morning) with NGO Oceana
and other volunteers.
Made contact with Ocean Academy, a local high school with an interest in marine biology
and conservation.
Other participation in local cultural events

BZM 161
11
2.0 Field Training
2.1. Science Training and Volunteer Briefings
To achieve the above aims, all volunteers and staff members receive a combination of briefings,
science presentations and lectures and practical field training (Table 1) before conducting any
marine surveys. For all tests a 95% pass mark is required and in case of any failures, those
individuals will have to re-sit a different version of the test. All marine conservation and diving
volunteers are PADI scuba trained to at least Advanced Open Water level.
Table 1: Science Lectures, Field Training Lectures and Tests and Briefings
Lecture/Presentation/Test Lecturer
Health and safety and medical presentations
and tests
HC, AS
Dangers of the reef presentation HC, AS
Introductory science presentation for Frontier
Belize Project
HC, AS
Introduction to Coral Reefs Presentation HC, AS
Benthic identification and survey
methodology presentation
HC, AS
Coral health presentation HC, AS
Coral flash, revision slides HC, AS
Benthic test HC, AS
In water, practical benthic test HC, AS
Fish identification presentation HC, AS
Fish flash, revision slides HC, AS
Fish families test HC, AS
Fish ID test HC, AS
Juveniles and recruits fish ID test HC, AS
In water, practical fish test HC, AS
Practice mock survey HC, AS
Queen Conch Presentation HC, AS
Caribbean Spiny Lobster Presentation HC, AS
Mangrove Presentation HC, AS

BZM 161
12
Seagrass Presentation HC, AS
Beach Clean Presentation HC, AS
Invertebrate Presentation HC, AS
Invertebrate Test HC, AS
2.2 Dive Training
All volunteers are trained up to at least PADI Open Water Advanced. PADI dive training is
currently being outsourced to a local dive company, Blue Sea Diving and this will continue until
F b ‘ - .
2.3 BTEC
No BTECs were conducted during this phase (Table 2).
Table 2: BTEC projects conducted during BZM161
Name BTEC Project Duration

BZM 161
13
3.0 SMP coral reef diving surveys
3.1 Introduction
Coral reefs are highly valuable and productive marine ecosystems. They provide an essential
habitat/feeding ground for a diverse array of marine fauna such as fin-fish, sharks, rays, turtles,
birds and numerous invertebrates. They also provide us with an array of important ecosystem
services, most crucially fish production, but they also generate revenue through tourism (Hughes
et al. 2010). Yet, coral reefs remain one of the world's mostly heavily impacted marine
ecosystems, with the most widely accepted causes being overfishing, habitat destruction, increase
in sea surface temperatures (SSTs), coral disease, invasive species and poor land-use practices
leading to coastal eutrophication and heavy sediment loading (Harvell et al. 2007; Hughes et al.
2010). These human induced impacts result in the reef ecology being altered. Sedimentation and
nutrient pollution also impact coral reefs, as well as the direct and indirect impacts that result
from climate change (Schutte et al, 2010). Coral reefs are among the most threatened global
ecosystems, as well as the most vital in contributing to human survival in developing countries
(Bryant et al, 1998; Costanza et al, 2007).
Caribbean coral reefs have experienced numerous ecological changes recently, which are
frequently associated with the death of corals through disease, bleaching, extreme seasonal
weather events and human disturbance. The region was rampaged by hurricanes in 2000, 2001
and 2002, destroying many coral formations with recorded losses of up to 75% in Belize alone
(Almada-Villela et al, 2002). A point of note is that these impacts all followed closely after
Hurricane Mitch, a category-5 storm, and an extreme bleaching event in 1998. Many observations
of widespread bleaching within reefs of the tropics were documented in the Summer and Autumn
of 1998, which resulted from unprecedented elevations in sea surface temperatures due primarily
to a severe El Nino Southern Oscillation and likely enhanced by global warming (Goreau et al,
2001). Corals in all habitats along the Belizean area of the Mesoamerican Barrier Reef were
bleached as a result of these thermal anomalies (Mumby, 1999). By 1999, some fore-reef habitats
demonstrated signs of recovery. In contrast, coral populations amongst the sheltered lagoons of
the back reef displayed reduced coral cover, low coral recruitment and little indication of
recovery. Aronson et al (2002) determined that during this prolonged period of elevated sea
surface temperatures, anomalies peaked at 4.0°C above the local hotspot threshold, which is an
extraordinary increase compared to previous years' sea surface temperatures.

BZM 161
14
Traditionally, coastal and marine activities in the area have been relatively minor. However, this is
changing with a rapidly growing tourism industry, particularly in Caye Caulker (Almada-Villela et
al, 2002; CZMAI 2016). Increases in tourist numbers has been matched by continued coastal
development, increased levels trash and litter, more boat traffic and more numbers of tourists on
the reef itself. All these have combined to result in increased algal cover dominating the reefs
(McClanahan et al, 2001) and lead to a decline in coral cover (Schutte et al, 2010). This is
concerning as fish assemblages are often directly associated with coral reef health. Promisingly,
Belize boasts the highest fish species richness in the MBRS region, with over 320 recognised fish
species, but with fishing effort in the region intensifying this richness is under threat. This is
focused particularly towards spawning aggregations, as spawning location depends on the
recognisable characteristics of cayes and reefs, something which may be lost with overfishing. A
documented example of this is the Nassau grouper (Epinephalus striatus) which during the full
moons of December and January forms spawning aggregations annually in the same location. This
allows fishermen to become very familiar with these cycles, leading to overfishing of this species.
This species is currently listed as endangered on the IUCN Red List of Threatened Species and
despite its protected status in Belize is now seldom observed within the reefs of Caye Caulker
Marine Reserve (Almada-Villela et al, 2002). Worryingly, a study conducted by Hughes et al (2007)
established that the exclusion of large predatory and herbivorous fish, such as the Nassau
grouper, led to a dramatic explosion of macro-algae, which in turn suppressed the fecundity,
recruitment and survival of coral and ultimately reduced total coral cover within reef systems.
Consequently, the coordination and control of fish stocks is one of the primary components in
preventing phase shifts and managing reef resilience.
Disturbances to the invertebrate community have also profoundly influenced reef health in the
study area. Disease potentially caused by a water-borne pathogen has dramatically reduced
populations of the herbivorous sea urchin Diadema antillarum in the Caribbean, which
contributed to the increased abundance of macro-algae and reduced coral cover (Harbone et al,
2009). Many other macro-invertebrate species play an important role in reducing macro algae
cover, by grazing on the biofilms on substrate suitable for hard coral cover (Klumpp & Pulfrich,
1989). Furthermore, it is important to monitor the abundance and diversity of macro-
invertebrates which are prone to overfishing, such as the commercially important queen conch
(Strombus gigas), the Caribbean spiny lobster (Panulirus argus) (Theile, 2002; Perez & Garcia,
2012).

BZM 161
15
With the establishment of the MBRS Synoptic Monitoring Program (SMP), the MBRS Protocol was
designed to standardise data collection and management for ecosystem monitoring. It aims to
monitor changes in ecosystem health within priority protected areas, enabling quicker and more
effective responses to changes in reef health (Gomez, 2004). Ultimately the utilisation of this
protocol coupled with the long-term monitoring work conducted by Frontier will provide much
needed comparable baseline data on the state and associations of marine ecosystems.
3.2 Survey Sites
Site 1: North Back-reef (NB): (16Q 0393822 UTM 1966284) a shallow patch reef on the inside of
the MBRS located between the reef crest and a lagoon, with a maximum depth of approximately
5m and within the General Use Zone of CCMR. Current flow and wave energy are generally
moderate to high on days with greater wind force. Surveying of NB has continued during this
phase.
Site 2: South Back-reef (SB): (16Q 0392922 UTM 1959724) a shallow patch reef on the inside of
the MBRS which is situated between the reef crest and the lagoon, with a maximum depth of
approximately 5m and located in the Conservation Zone of CCMR. Due to moderately low current
flow this site is frequented regularly by tour operators and dive companies. Surveying of SB has
continued during this phase.
Site 3: North Fore-reef (NF): (16Q 0394839 UTM 1966980) a barrier reef on the inside of the MBRS
with a maximum depth of approximately 15m in the General Use Zone of CCMR. This site is only
accessible on moderately calm days, when the wind force and sea state is relatively low. Surveying
of NF was discontinued during this phase.
Site 4: South Fore-reef (SF): (16Q 0393628 UTM 1959502) A relatively deep reef on the outside of
the MBRS with a maximum depth of approximately 20m in the General Use Zone of CCMR. This
reef is subject to moderate levels of tourist activity, predominantly in the form of PADI dive
training and recreational scuba diving. This site is only accessible on moderately calm days, when
the wind force and sea state is relatively low. Surveying of SF was discontinued during this phase.

BZM 161
16
3.3 Methodology
The protocol for this survey was adopted from the MBRS Synoptic Monitoring Program as the
standard methodology used to monitor the coral reefs at established sites (Almada-Villela et al,
2003). Survey methods were adapted for the Belize Fisheries Department, FAMRACC and Frontier.
For each survey a minimum of three divers were required and each had a specific role (see below)
for which they had undergone the required training.
Physical surveyor
The physical surveyor collects coral community characterisation data. For each transect the
following information was recorded: v name, date and site name and/or GPS
coordinates. The physical surveyor lays a 30m transect line haphazardly within the general
confines of the site; seeking to avoid choosing places due to any sort of preference. Transect line
is weighted at one end with a 2lb dive weight so it remains in place. Using an underwater compass
the diver swims parallel to the reef in a straight line, releasing the transect line carefully on the
reef until the end of the reel. The diver then proceeds to swim back along the transect line,
stopping at the first coral colony located directly beneath the transect line which is at least 10cm
in diameter. For each colony surveyed the following information was recorded; the species of
coral, diameter (to the nearest cm) and maximum height (measured from the base of the
substratum) of the colony. The surveyor also estimates the percentage of dead coral along with
the presence of any diseases and/or bleached tissues (see table 1). The surveyor then moved on
to the next appropriate coral colony and repeated the above measurements until at least 10 coral
colonies were sampled from each site.
Table 1: Definitions of the codes used by the physical surveyor when identifying coral diseases or
bleaching (where applicable).
Disease codes Bleaching codes
BB = Black band disease PB = Partially bleached
WB = White band disease BL = Bleached, fully-bleached
RB = Red band disease P = Pale, signs of colour loss.
YB = Yellow band disease
WP = White plague disease
DS = Darkspot disease

BZM 161
17
Fish surveyor
The fish surveyor swam alongside the physical surveyor whilst the transect line was reeled out,
trying to minimise any changes in depth. Whilst the full 30m transect line was laid out the
surveyor counted and recorded the defined fish species observed within a 2m wide visually
estimated belt transect (1m either side of the line). The size of each fish recorded was estimated
by assigning them to the following size categories (<5cm, 5-15, 16-30, 31-40, >40cm). A two
minute pause was taken once the surveyor reached the end of the transect line before the
surveyor returned along the line looking for any additional recruits (Almada-Villela et al, 2003). On
the return journey, the surveyor swam along the 30m transect recording only selected juvenile
fish, fish species <5cm and Diadema sp. sea urchins. The latter was recorded as part of the fish
survey whenever an Invertebrate Surveyor was not present.
Benthic Surveyor
The benthic surveyor swims the 30m transect line with the aim of identifying and counting the
benthos at every 25 cm, providing 120 records of data. This data can then be used to calculate
percentage coverage of substratum (as (# records/120) * 100). SMP target benthos includes:
coralline algae (code = COR), turf algae (TURF), target macro algae species, sponges (SPN),
gorgonians (GG) and target stony corals (see appendix for full species list). The surveyor should
also record any abiotic substrate including: sand (SN), bare rock (BR) and dead coral (DC).
3.4 Coral abbreviations
All target coral species are abbreviated from their scientific names as per Atlantic and Gulf Rapid
Reef Assessment (AGRRA), where the first letter of the genus is the first letter in the abbreviation
and the last three letters of the abbreviation are from the first three letters of the species. For
example: lettuce coral, Agaricia agaricites= AAGA. For a full list of target corals and their
abbreviations see appendix 1.
3.5 Coral Results
For SB there are currently 9 full coral characterisation surveys, 4 completed recently (Phase 161)
and 5 from previous phases. 9 point intercept transect surveys (PITs) have also been conducted at
SB; 4 completed this phase and 5 from previous phases. SB PIT provided n = 1089 points of data.

BZM 161
18
The NB survey site has 9 coral characterisation surveys, 3 completed this phase and 6 from
previous phases. There has been 7 full PITs conducted at NB; 3 from this phase and 4 from
previous phases. NB PIT provided n = 847 points of data.
Benthic community compositions
Table 1 provides the total counts for the 6 major benthic assemblages enumerated as part of
point intercept transect survey methodology. The results suggest that hard corals are the most
numerous benthic assemblage at South Back-reef survey site (SB) with percent coverage of 37.7%;
whereas, abiotic benthos (sand and bare rock) was most frequently counted at North Back-reef
survey site (NB). The most dominant biotic benthos at North Back however, was macro algae
which had a % coverage of 25.6%. The most dominant macro alga at NB is Dictyota sp. which was
counted 111 times.
Table 1: The total counts and % of total for the six benthic assemblages enumerated as part of the
point intercept transect surveys at SB and NB survey sites.
Benthic compositions South Back survey site
(n = 1089)
North Back survey site
(n = 847)
Hard coral 410 (37.7%) 190 (22.4%)
Gorgonians (Soft corals) 181 (16.6%) 109 (12.9%)
Micro algae 63 (5.8%) 61 (7.2%)
Macro algae 168 (15.4%) 217 (25.6%)
Sponges 27 (2.5%) 15 (1.8%)
Abiotic 240 (22%) 255 (30.1%)
Hermatypic (Hard corals)
Across the two survey sites a total of 600 hard corals were counted. SB boasted considerably
more hard coral, 410 (68.3%) then NB 190 (31.7%) (see figure 1; table 1). The total coverage of
hard corals at SB (n=1089 intercept points) was 37.7%, whereas the total coral coverage at NB
(n=847 intercept points) was 22.4%.
Of the two sites SB had the most notable dominance of a single hard coral species, OANN
(Orbicellia annularis). At SB OANN was counted 153 times, accounting for approximately 37% of
the total hard coral (n=410) population at the site. In comparison, NB appears to have a more
even and balanced community of hard coral species, with no obvious species dominating the site.

BZM 161
19
This is supported by the species evenness index which gave a higher evenness value for NB of 0.91
compared to the lower evenness value at SB of 0.68.
The Shannon Wiener diversity index was also calculated for the hard coral community at SB and
B. B g v x H = 2.6 c mp SB w c H = 2. Y b
had 19 different hard coral species.
Acropora abundances
One of the most threatened and important hermatypic corals in the Caribbean belong to the
genus Acropora. Acropora cervicornis and A. palmata (codes: ACER; APAL), which were once the
dominant reef-building corals in the Caribbean (Young et al. 2012). In all, ACER was counted 8
times at SB from 1089 points, giving a count abundance of 0.73%; at NB, ACER was counted only 4
times from 847 points, giving an abundance of 0.47%. APAL was counted 0 times at SB site, thus
had no abundance. However, at NB site APAL was counted 32 times giving a % abundance of
3.79% across the data collected.

BZM 161
20
Figure 1: Hard coral point counts in descending order. Top graph is the frequency data of South
Back-reef (n=1089 points) and the bottom graph is data from North Back-reef (n= 847).

BZM 161
21
SB vs NB hard coral coverage
South Back-reef (SB) had significantly more hard coral coverage than North Back-reef (see figure
2) (ANOVA: F = 5.102, P = 0.04).
Survey sites
SB NB
Har
d c
ora
l co
vera
ge (
%)
0
10
20
30
40
50
60
70
Figure 2: Hard coral coverage for South Back-reef (SB) and North Back-reef (NB) SMP survey sites.
SB was surveyed n = 9 times and NB was surveyed n = 7 times.
Coral characterisation
SB was surveyed 8 times where 72 coral colonies were identified and described. NB was surveyed
9 times where 73 coral colonies were described. Coral characterisation surveys provided size,
disease and bleaching data on 15 different coral species at SB survey site and 22 different coral
species at NB survey site. Similar to the PITs data, the most characteristic coral colony at SB was
the boulder-forming Orbicellia annularis (OANN), which had an average width of 70.3 cm ± 78.2
S.D whereas, at NB there were two equally characteristic coral colonies: the blade-forming
Agaricia tenufoilia (ATEN) and the encrusting Porites asteroides (PAST).
BZM 161
22
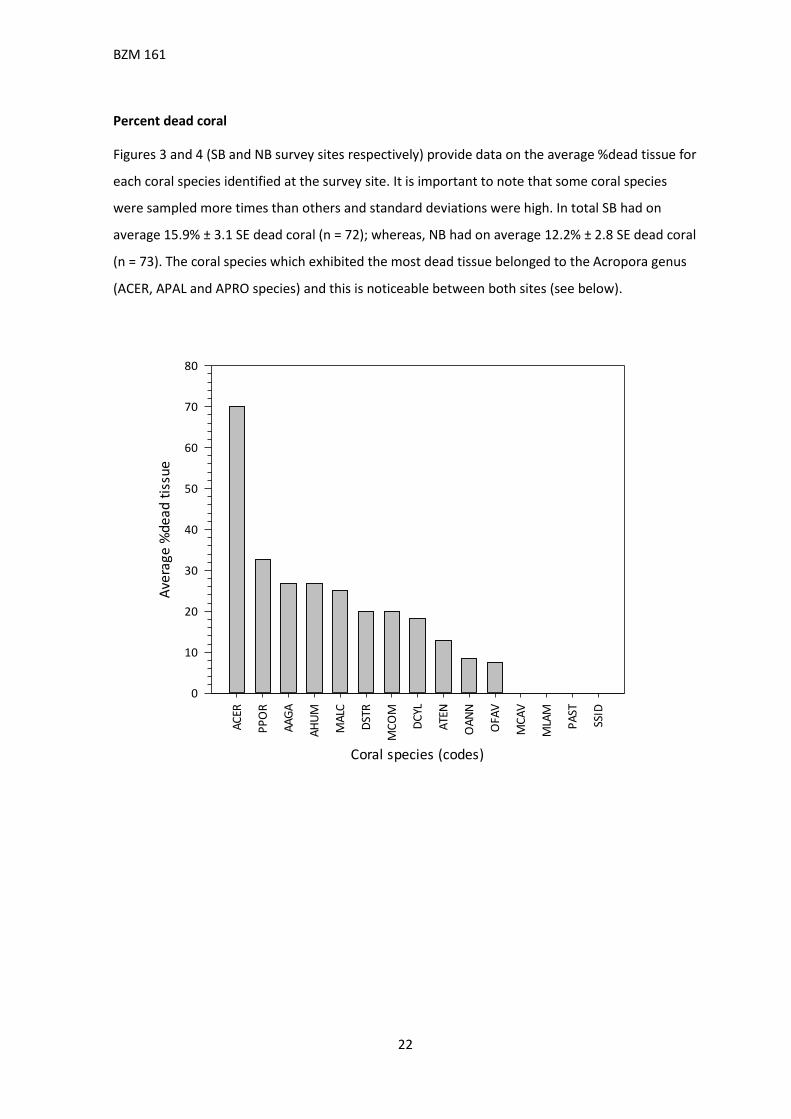
Percent dead coral
Figures 3 and 4 (SB and NB survey sites respectively) provide data on the average %dead tissue for
each coral species identified at the survey site. It is important to note that some coral species
were sampled more times than others and standard deviations were high. In total SB had on
average 15.9% ± 3.1 SE dead coral (n = 72); whereas, NB had on average 12.2% ± 2.8 SE dead coral
(n = 73). The coral species which exhibited the most dead tissue belonged to the Acropora genus
(ACER, APAL and APRO species) and this is noticeable between both sites (see below).
South Back
Coral species (codes)
AC
ER
PP
OR
AA
GA
AH
UM
MA
LC
DST
R
MC
OM
DC
YL
ATE
N
OA
NN
OFA
V
MC
AV
MLA
M
PA
ST
SSID
Ave
rage
%de
ad t
issu
e
0
10
20
30
40
50
60
70
80

BZM 161
23
Figure 5: A comparison between coral disease proliferation at South
Back and North Back survey sites. WP = white plague disease, WB =
white band disease and DS = dark spot.
Figure 3 & 4: Average %dead tissue for each coral species identified at South Back (figure 3) and
North Back survey sites (figure 4). Coral species recorded at the site but never seen to exhibit any
dead tissue were simply left as 0.
Coral disease
Only three of a possible six coral
diseases monitored as part of
SMP were present at SB and NB
survey sites: white plague disease
(WP), white band disease (WB)
and dark spot disease (DS). Of the
two sites NB coral colonies
appeared to be affected by
disease(s) more than the coral
colonies at SB; this is clear in
figure 5. Of all the diseases
present, WP was the most
prolific, affecting approximately
7% of corals at SB (n=72) and 12.5% of
North Back Coral species (codes)
AC
ER
AP
RO
OA
NN
AA
GA
SSID
OFA
V
ATE
N
PA
ST
DLA
B
PP
OR
AH
UM
MLA
M
AP
AL
DC
LI
DST
O
DST
R
MA
LC
MA
RE
MC
AV
MC
OM
MM
EA
SRA
D
Ave
rage
%de
ad t
issu
e
0
10
20
30
40
50
60
70
80
90
100
Disease (Code)
WP WB DS
0
1
2
3
4
5
6
7
8
9
10
11
12
13
South Back
North Back
Perc
enta
ge o
f af
fect
ed c
oral

BZM 161
24
corals at NB (n=73). There was no statistically significant difference in the amount of diseased
coral between the two sites (ANOVA: F = 0.393, P = 0.565).
Coral bleaching
Level of coral bleaching was categorised into three distinct, yet subjective groups: pale (P), part-
bleached (PB) and bleached (B). Of the three categories pale coral was the most common, with
~ % SB c c x b g m p ~ 2.5% B c ( g 6).
Percentages of bleached corals was relatively low for both sites, but especially at SB where only
~1.5% of the coral colonies were bleached, compared to ~7% at NB. Yet SB had noticeable more
part-bleached corals at 15.5% compared to 8.2% at NB. Yet, there was no statistically significant
difference in coral bleaching between the two sites (ANOVA: F = 0.000819, P = 0.979)
Figure 6: Comparison between amount of coral bleaching at South Back and North Back site. P =
pale, PB = part-bleached and B = bleached.
Amount of bleaching (Code)
P PB B0
1
2
3
4
5
6
7
8
9
10
11
12
13
14
15
16
17
South Back
North Back
Perc
enta
ge o
f af
fect
ed c
oral

BZM 161
25
3.6 Discussion
Both South Back reef (SB) survey site and North Back reef (NB) survey site are shallow patch-reefs
located approximately 2 miles apart. Due to the shallowness of the survey sites coral is likely to
experience relatively high wave action as well as strong currents from the nearby channels: South
Channel and North Channel (Komyakova et al. 2013).
Hard coral coverage
Hard corals (hermatypic) are the cornerstone of tropical coral reefs. South Back (SB) and North
Back (NB) survey sites had average hard coral coverages of 37.7% and 22.4% respectively, which is
relatively good when compared to previous datasets: for example, during a collaborative MBRS
monitoring effort in 2001, researchers found that MBRS reefs had an average live coral cover of
15.2% (with a range 2.6% to 39.7%) (see Almada-Villela et al. 2002). In all, a live coral coverage of
more than 20% is considered to be good while less than 10% is considered to be poor (Neal et al.
2007).
The difference in hard coral coverage between the two sites was significant, which is interesting,
considering they are only a small distance apart and have similar physical characteristics. It is
possible that proximity to the channel and prevailing currents make the NB reef site less
favourable for coral settlement, due to higher levels of mechanical forcing from stronger currents
and waves (Almada-Villela et al. 2002; McField et al. 2005; Chollett & Mumby 2012). Furthermore,
NB also had higher algal abundance (32.8% in total) than SB (21.2%), which may also explain why
hard coral coverage at NB survey site is lesser(McField et al. 2005; Hughes et al. 2007). This may
also be due to different wave and current regimes, which has been observed to have an effect on
back-reef macroalgal communities (Lilliesköld Sjöö et al. 2011). NB also likely had more algae than
SB due to its location within the Caye Caulker Marine Reserve (CCMR): SB is located in the
Conservation Zone, where no commercial fishing is permitted; whereas, NB is located in the
General Use Zone, where commercial and recreational fishing is permitted. Due to this it is likely
that there are less herbivorous fish, such as the current primary reef grazer parrotfish (family:
Scaridae) at NB, leading to less herbivorous activity and thus an increase in macroalgae coverage
(ROtMumby 2006; Hughes et al. 2007; Sotka & Hay 2009; Edmunds 2013). The fish survey data
supports this to an extent; parrotfish were less prevalent at NB (37% abundance) than SB (43%),
however, this difference is only small. None the less, a further level of protection for the NB reef
site is likely to protect the herbivorous fish population, reducing the abundance of algae and
increasing the coverage of hard coral (Mumby 2006; Hughes et al. 2007; Komyakova et al. 2013).

BZM 161
26
Although hermatypic coral coverage was highest at SB, NB was the site with the higher coral
species richness. Contrary to its lower hard coral coverage, having high coral diversity suggests
that NB is not an unhealthy reef site (Sale et al. 1994). However, it is important to mention that
this difference was slight, and 19 different coral species were identified at both sites. The
difference in diversity likely lay in SB being dominated by a single coral species, Orbicella annularis
(formally Montastraea); which is a key reef-building coral known to dominate Caribbean coral
assemblages. However, in reefs where OANN is less dominant, more novel non-framework (often
‘w b ) coral assemblages are known to prosper (Perry et al. 2015). This may have
been the case with NB, which had higher species evenness and richness.
Acropora sp. abundance
Of the two survey sites NB had a higher abundance of the critically endangered Elkhorn coral
(Acropora palmata). This was likely because the site provided more favourable habitat for the
coral species, as it is a shallow patch-reef with more turbulent water conditions than SB (Miller et
al. 2008).
Dead coral
There was little difference in average %dead coral between the two survey sites. SB had 15.6%
dead coral on average whereas NB had 12.2%. In fact coral mortality between 0 – 15% is
considered optimal (Neal et al. 2007). However, a few coral species exhibited more dead tissue
than others, the most notable being the high levels of dead Acropora s at both sites. This is not
p g w v Ac p w c m b mp c p c
the Caribbean, yet they have declined in abundance significantly, with some estimates higher
than 97% (NMFS 2014). Acropora s are highly sensitive to an increase in sea surface temperatures
(SSTs) and other environmental conditions spurred by climate change, which likely affects both
sites. They are also susceptible to physical damage, especially from anthropogenic sources (such
as boats and humans); being a popular snorkel and dive location, this may explain their high levels
of mortality on the reef in Caye Caulker (NMFS 2014). Yet all is not lost, Ac p m ne of
the fastest growing corals in the Caribbean. A recent study suggested that their annual growth
rates can exceed 5cm of new growth for every cm of living coral tissue (Lirman et al. 2014).
Because of this, a further level of protection for sites with healthy Acropora is likely to have a
noticeable difference on the population, and relatively quickly. H g b c Ac p s are
also known to increase coral habitat complexity, which has been found to be directed positively
correlated with fish abundance and species richness (Komyakova et al. 2013).

BZM 161
27
Coral diseases and bleaching
Coral bleaching and disease was present at both survey sites (see table 1). Although the
difference between the two sites was not statistically significant in both cases, the raw data
suggested that disease was more prolific at NB survey site. It is difficult to pinpoint the exact
cause of this difference between the sites with the data collected, as coral disease proliferation is
likely more dependent on large-, rather than small-scale factors, such as thermal stress and the
c xp p g c (Bruno et al. 2007; Mora 2009). Despite this, NB had a
higher abundance of algae which can be linked to an increase in disease outbreaks (Harvell et al.
2007).
Table 1: A like-for-like percentage of coral comparison of bleaching and disease at the two survey
sites
Bleaching and disease South Back North Back
Pale coral 11% 12%
Part-bleached 15% 8%
Bleached 1% 7%
White plague disease 7% 12%
White band disease 1% 3%
Dark spot disease 0% 1%
3.7 Fish Results
South Back, located in the Conservation zone had the higher abundance of fish of the two sites
studied (NB = 252, SB = 300) the total number of species for each site was very similar at both
sites (NB = 33, SB = 34). In order to calculate species richness, Shannon Weiner diversity was used.
Results show that there was no significant difference between the two sites in regards to diversity
(North Back H = 2.93, South Back H = 2.72).

BZM 161
28
Figure 7: The total abundance of each fish family at South Back
Figure 8: The total abundance of each fish family at North Back
Parrotfish made up the highest percentage of fish for both sites (Fig 8. NB = 37%, Fig 7. SB = 43%)
with Striped parrotfish being the most abundant overall at both sites (16% at South Back and
15.07% at North Back). Grunts were the second most dominant family for both sites (Fig 2. NB =
27%, Fig 1. SB = 11%) however a Kruskal Wallace test showed there was no statistical difference
0
20
40
60
80
100
120
140
0
10
20
30
40
50
60
70
80
90
100

BZM 161
29
between the two sites (P = 0.626). The second most dominant species at North Back was French
Grunt (9.92%) and Princess Parrotfish at South Back (11%).
The results show no statistical difference between the North and South Back site in regards to
overall fish diversity.
3.8 Discussion
No statistical difference in fish abundance and diversity would suggest that the Marine Reserve;
particularly the Conservation Zone is not effective. However, even though the South Back site is
located in the marine reserve, it right on the south border, and hence is likely to act as a buffer
zone between the middle of the reserve and the general use zone. In order to gain more accurate
results we would need to survey more sites, particularly on the fore reef as well as within the
preservation zone of the reserve.

BZM 161
30
4.0 Caribbean Spiny Lobster Surveys
4.1 Introduction
The Caribbean Spiny Lobster (Panulirus argus) is the most important commercial marine species
in the Caribbean due to its economic value, both as a source of income and employment for the
local population, as well as foreign exchange for national government (Acosta and Robertson,
2003). Furthermore, due to the high unit prices, the international trade of lobster provides
improvements to the livelihoods of fisheries-dependent populations (Monnereau & Pollnac,
2012). Ecologically, Caribbean spiny lobsters are keystone species that serve as prey for a wide
range of marine animals, such as sharks, rays, turtles and moray eels (Seudeal, 2013). They are
also important predators, their primary diet consists of molluscs (especially gastropods, chitons
and bivalves) and arthropods (Cox et al, 1997). Caribbean spiny lobsters are found in a wide range
of habitats including sand, seagrass, coral reefs and coral rubble. Due to lack of abundance data,
c ‘ c IU R L . This is likely
due to their cryptic nature (Butler et al, 2013). Unsustainable fishing of this species could lead to
population declines and ultimately collapse of the industry, particularly in Belize, where a decline
in catch per unit effort is being noticed by fishermen (Butler et al. 2013; CZMAI 2016).
P. argus are social, and when there is an abundance of food they are known to form high
population densities, similar to that of the American lobster (Homarus americanus) (Behringer &
Butler 2006). This suggests healthy, sustainable local lobster populations can be maintained
through effective fishery management. Protected areas, similar to the Conservation Zones found
within CCMR can function as refuge for the Caribbean lobster. In these protected areas lobsters
are often found in higher populations, have a larger mean size and thus are often more
reproductively successful due to increased fecundity (Acosta & Robertson, 2003). These
protections should result in increased regional larval supply and net movements of adult
individuals from the reserve to adjacent fishing grounds. In addition to the protection granted by
marine reserves, the Belize lobster fishery is seasonal. The fishery is closed between February 14th
to June 15th country-wide; this protects the lobster populations throughout their reproductive
season. Furthermore, P. argus landings must adhere to a minimum size limit/carapace length of
7.6 cm and tail weight of 4 ounces (113 g), which is applied throughout the year. There is also a
ban on the use of SCUBA for catching lobsters and other gear restrictions and license limitations.
Despite this there is no current total allowable catch quota for lobsters (Babcock, 2012).

BZM 161
31
Given the importance of the Caribbean spiny lobster at both an economic and ecosystem level, it
is essential to assess the effectiveness of the conservation efforts mentioned above, in order to
gain an insight into the sustainability of the lobster fishery. Frontier aims is to carry out long-term
monitoring and assessment of the local population size structure and sex ratios of P. argus.
Surveys are conducted and compared between each zone of CCMR (where possible), in order to
provide data on the effectiveness of spatial management on the local lobster population.
In addition to vital information on the sustainability of the lobster fishery, data on lobster
distribution could potentially provide insight into the level of complexity and structure of the local
coral reef systems. This is because higher densities of Caribbean spiny lobster have been
associated with areas of higher habitat complexity, where the reef is intricate and creates crevices
and hidden sites for lobsters (Rios-Lara et al, 2007). Higher lobster densities could therefore be a
used as an indicator of reef habitat complexity and general health.
4.2 Methodology
In line with the aim of this study, surveys were carried out within the Caye Caulker Marine
Reserve (CCMR). GPS location of the survey sites were recorded, to ensure the same sites were
surveyed each time. Surveys were carried out using an active search approach, which consisted of
a team of snorkelers actively searching for lobsters without the use of fixed transects. The
rationale behind this method was to simulate local fishing practices and get an estimate of Catch
Per Unit Effort (CPUE); the effort unit was time (minutes).
Each individual snorkelled for 30 minutes looking for lobsters. Each individual lobster found was
measured using a ruler to approximate its total carapace length. Sex was also recorded, which
was carried out by determining if two extra claws were present on the back legs, or if there was
an extra pair of swimming legs underneath the tail in females. Despite best efforts it was often
p b v m b x b ock
crevices, with their abdomen not visible to the surveyor. Lobsters were not handled in order to
minimize disturbance. If lobsters escaped before measurements could be made, then their
carapace length was estimated by sight.
BZM 161
32
4.3 Results
Only three lobster surveys were completed during this phase, two in the conservation zone and
two in the preservation zone of the Caye Caulker Marine Reserve (CCMR).
No lobsters were found within either location. This was likely due to the surveys beginning just
after the close of the lobster season, which occurred on the 15th February.

BZM 161
33
5.0 Seagrass Monitoring
5.1 Introduction
Seagrasses are primary producers and marine angiosperms that account for 0.1-0.2% coverage of
ocean habitat worldwide (Duarte, 2002). Seagrasses act as ecosystem engineers, profoundly
influencing the physical, chemical and biological environments within coastal waters. They alter
water flow, nutrient cycling and food web dynamics and stabilise sediments (Orth et al. 2006).
They are also a vital food source for mega-herbivores in the Caribbean, including the green,
loggerhead and hawksbill sea turtles (Chelonia mydas, Caretta caretta and Eretmochelys imbricata
respectively) and West Indian Manatees (Trichechus manatus), of which all are of international
conservation concern (Beck et al, 2001). Seagrasses provide a critical habitat for juveniles of both
commercially and recreationally important fishery species that depend upon the habitat for
nursery and refuge areas (Heck et al. 2003).
Seagrasses are common in shallow coastal waters across most continents; however, there has
been a noticeable loss of seagrass coverage worldwide for many decades equating to a scale of
hundreds of square kilometres (Heck et al. 2003). This is mostly due to rapid environmental
changes as a consequence of increased coastal development and a growing global population
(Lotze 2006). The most widely accepted disturbances include sediment and nutrient runoff,
physical damage, invasive species, disease, commercial fishing practices, aquaculture,
overgrazing, algal blooms and increased sea surface temperatures (Orth et al., 2006). Such
disturbances have resulted in the recent decline of seagrass meadows in Belize, which has
increased the necessity for the protection, as well as monitoring and management of seagrass
beds.
Coastal ecosystems have the ability to sequester huge amounts of Carbon (C). These ecosystems
include mangroves, coral reefs, saltmarshes and seagrasses, with seagrasses having a
disproportionately large C storage potential relative to their global area (Laffoley et al., 2009).
These ecosystems cover <0.5% of b m b c b w c cc
for more than 50%, perhaps as much as 71%, of all carbon storage in ocean sediments (Nellman et
al., 2009). There has been a recent surge in interest of carbon sequestration due to increasing
global pressure to mitigate the effects of climate change brought on by carbon emissions. The
recent focus on carbon trading and carbon pricing has resulted in considerable interest in
quantifying the capacity of the w c m p q carbon (Lavery et al.,
2013). Blue carbon is also the name of a new strategic approach to make use of the large carbon

BZM 161
34
capture and storage potential of coastal ecosystems. If this carbon could be quantified and sold
on international carbon trading markets then this could help fund preservation and restoration
projects, which would also help capture more carbon and ease the effects of climate change.
There are three species of seagrass found in Caribbean waters; Turtle grass (Thalassia
testudinum), Manatee grass (Syringodium filiforme) and shoal grass (Halodule wrightii), with turtle
grass being the most abundant in the waters around Caye Caulker.
The implementation of monthly seagrass surveys in Caye Caulker will allow monitoring of the
health of the seagrass beds during the continued coastal development plans of Caye Caulker
(CZMAI 2016). This is a great opportunity to study anthropogenic effects on seagrass beds, and in
particular, how coastal development affects this important habitat. By comparing seagrass
coverage and health between north Caye Caulker (non-developed) and south Caye Caulker
(developed/developing), we hope to provide data on the adverse effects of coastal development
on seagrass communities. It is hypothesised that there will be a decrease in seagrass coverage in
seagrass beds closest to coastal development.
Another prospective project is to conduct GIS mapping of the seagrass beds around Caye Caulker.
This habitat has never been mapped in this area and so a detailed survey to examine the extent of
seagrass beds would prove extremely beneficial. It would provide key logistical information for
the management of this habitat and also starting baseline data which will enable monitoring of
changes over time. In addition to mapping the seagrass beds, it has been suggested to us by
FAMRACC that finding a large area of seabed along the north coast of Caye Caulker could be very
beneficial, as it could be used as an area for the farming of algae. If a suitable area was found, this
could be used as an incentive to allow the designation of an extended area of protection. This
would continue north from the northern limit of the current MPA, which has already been
proposed by FAMRACC. The proposed extension includes an area of reef which includes the
critically endangered Acropora and also an area which manatees are known to frequent. A
suitable area of seabed, for example, within the general use area in the northern extent of the
MPA could be proposed as an area of algae farming for the local fishermen in return for the
extension of the protected zone area. The area allotted for algae farming will need to be where
the seabed is barren substrate and not in close proximity to seagrasses or coral, which the algae
could smother and kill through inhibiting photosynthesis. An extensive mapping survey would not
only allow vital mapping of crucial habitats but would also allow GIS spatial analysis to present
any potential sites for algae farming.

BZM 161
35
5.3 Methodology
The method for the seagrass surveys was adapted from the Seagrass Monitoring Network
protocol, which has also been used by The Belize Fisheries Department. Transects were 30m long
and not permanently marked so that data collection is feasible with the resources and time
available to Frontier.
Three transects of 30m were carried out at each site within water no deeper than 3m due
comfortable snorkelling depth. For each site there will be a 'peg' to mark the start point of the
first transect and each following transect will be placed at a distance of 10 fin kicks from the
previous transect. The transect line was laid perpendicular to the shore and starting from the first
point on the transect line at 0m. The 50cm x 50cm quadrat was then placed at 10 m intervals to
the right of the transect line. For each quadrat, the total percentage cover of each sea grass
species present was recorded, followed by the maximum canopy height of each species and the
presence of grazing. Within each quadrat another 25cm x 25cm quadrat was placed within the
bottom left corner closest to the beginning of the meter mark. Within this quadrat the presence
and number of any flowers observed on each species was recorded, as well as the total number of
rhizome nodes for each species. If the rhizome node was beneath the surface individual blades
were counted. Each site should be surveyed every 6 weeks (Short et al, 2006). Percent coverage
of non-epiphytic algae was also estimated within each quadrat.
Seagrass mapping (preliminary)
Surveyors, location, date and time will be recorded prior to commencing. Using a handheld GPS
device, waypoints will be recorded to mark the perimeter of seagrass beds. Surveyors may use a
canoe to follow the perimeter of the seagrass beds however, as the beds here are very extensive,
it may prove unfeasible to use a canoe and so a boat may be a better vehicle of choice. Waypoints
will be uploaded to GIS for mapping and spatial analysis. Personal judgment will be used when
recording waypoints, for example, GIS creates polygons by joining waypoints using straight lines,
so if the perimeter of a seagrass bed continues in a straight line for a large distance, it is only
necessary to mark the start and end point of that line. Another surveyor will conduct a snorkel
survey alongside the mapping surveyor in order to determine the species of seagrass and a rough
estimate of the density within each seagrass bed. This will allow for future comparisons on the
coverage of each seagrass bed. A useful aid in the monitoring of these areas in the future will be
to take photographs of the seagrass beds, recording the location of each photograph. During

BZM 161
36
surveys, any notably large areas of sandy seabed will also have waypoints taken as potential sites
for algae farming.
5.4 Results
Seagrass coverage
The most common seagrass species at all sites was turtle grass (Thalassia testudinum), which
accounted for >90% of seagrass species for each transect. The seagrass survey can be split into
four distinct sites: southern seagrass survey sites (southeast and southwest) and northern
seagrass survey sites (northeast and northwest). Each survey site was surveyed three times, each
survey encompassing three transects (n = 12 per site). Figure 1 provides a comparison between
the %seagrass cover of each site. On average the NE seagrass site had the highest %coverage with
an average of 87% ± 14 standard deviation (S.D.), while the SW seagrass site had the lowest
average %coverage at 55% + 10 S.D (table 1).
Table 1: Descriptive statistical comparisons between the four seagrass survey sites. All values
calculated from %coverage data.
Site Average
coverage
Standard
deviation
Standard error
(n=12)
Range
Southeast 55.83% 19.05 5.50 25 – 85%
Southwest 55.42% 10.10 2.92 40 – 70%
Northeast 86.83% 13.60 3.93 50 – 95%
Northwest 72.50% 28.40 8.20 5 – 95%

BZM 161
37
Figure 1: Comparison of percent seagrass coverage at each site
Figure 2 provides a visual comparison of how average %seagrass coverage differs along a transect
line for each site. Seagrass coverage appears to increase along the transect line for the southern
Distance along transect (m)
0 5 10 15 20 25 30
Ave
rage
%se
agra
ss c
over
age
30
40
50
60
70
80
90
100
South east South west
North east North west
Sites
%Se
agra
ss c
over
age
0
10
20
30
40
50
60
70
80
90
100
SE SW NE NW

BZM 161
38
sites SE and SW, whereas the northern sites appear to show a gradual decrease in seagrass
coverage along the transect. The noticeable decline of average coverage at 20m for site NW is due
to a sole data point where %coverage dropped to 5%. It is likely that this is an outlier in the
dataset (table 1).
Discussion
As aforementioned seagrass beds are an important structural and functional component of
coastal ecosystems (Herrera-Silveira et al. 2010). The seagrass data collected during these surveys
can be split into two distinct areas: northern Caye Caulker, which has little to no coastal
development; and southern Caye Caulker, which has considerable coastal development, especially
during the last few years (CZMAI 2016). The difference between the four survey sites was
significant, and northern Caye Caulker had considerably healthier (higher %coverage) seagrass
beds than the south. Our data is corroborative with research from similar studies, and lower
seagrass %coverage can be closely associated with coastal development, which is known to have
deleterious effects on local seagrass beds due to increased sediment loading and nutrient run-off
(Hauxwell et al. 2001; Herrera-Silveira et al. 2010). Unfortunately, attempting to protect seagrass
beds while continuing with coastal development is a particularly difficult issue facing policy-
makers and resource managers. This is due to the diffusive nature of coastal sedimentation and
nutrient runoff (Orth et al. 2009). In order to protect the seagrass habitat around CCMR improved
water quality standards would have to be implemented (Orth et al. 2009; CZMAI 2016).

BZM 161
39
6.0 References
Acosta, C. A. and Robertson, D. N. (2003) 'Comparative Spatial Ecology of Fished Spiny lobster
Panulirus argus and an Unfished Coneger P. guttatus in an Isolated Marine Reserve at Glover's
Reef Atoll, Belize.' Coral Reefs. 22. Pages 1-9.
Aiken, K., Kong, A., Smikle, S., Appeldoorn, R. and Warner, G. (2006). ‘Managing Jamaica's queen
conch resources Ocean & Coastal Management, 49(5-6), Pages 332-341.
Almada-Villela, P., Mcfield, M., Kramer, P., Kramer, P. R. and Arias-Gonzalez, E. (2002) 'Status of
Coral Reefs of Mesoamerica- Mexico, Belize, Guatemala, Honduras, Nicaragua and El Salvador.'
Status of Coral Reefs of the World. 16.
Almada-Villela, P.C., Sale, P.F., Gold-Bouchot, G., and Kjerfve, B. (2003). ‘Manual of methods for
p c m g p g m Mesoamerican Barrier Reef Systems Program, Belize City,
Belize.
APAMO, (2015). Forest & Marine Reserves Association of Caye Caulker (FAMRACC). [online]
Apamo.net. Available at: http://apamo.net/index.php/forest-a-marine-reserve-association-of-
caye-caulker-fmracc [Accessed 5 Jan. 2015].
Aronson, R., Precht, W., Toscano, M. and Koltes, K. (2002) 'The 1998 Bleaching Event and its
Aftermath on a Coral Reef in Belize.' Marine Biology. 141(3). Pages 435-447.
Avila-Poveda, O.H. & Baqueiro-Cardenas E.R. (2006). ‘Size at sexual maturity in the queen conch
Strombus gigas from Colombia. Boletin de Investigaciones Marinas y Costeras, 35, Pages 223-233.
Babcock, E. A. (2012) 'Toward Catch Quotas for Spiny Lobster (Panulirus argus) at Glover's Reef
Marine Reserve. Wildlife Conservation Society, Belize.
Badola, R.; Hussain, S.A (2005) ‘Valuing ecosystem functions: An empirical study on the storm
protection function of Bhitarkanika mangrove ecosystem I . Environ. Conserv., 32, Pages 85–
92.
Barnett, A. (2015). [online] Available at:
http://www.projectaware.org/sites/default/files/DiveAgainstDebrisSurveyGuide_Vs2.1.pdf
[Accessed 4 Jan. 2015].
Beck, M., Heck, K., Able, K., Childers, D., Eggleston, D., Gillanders, B., Halpern, B., Hays, C.,
Hoshino, K., Minello, T., Orth, R., Sheridan, P. And Weinstein, M. (2001). ‘The Identification,
Conservation, and Management of Estuarine and Marine Nurseries for Fish and
Invertebrates. BioScience, 51(8), Pages 633.
Behringer, D. C. and Butler, M. J. (2006) 'Density-Dependent Population Dynamics in Juvenile
Panulirus argus (Latreille): The Impact of Artificial Density Enhancement.' Journal of Experimental
marine Biology and Ecology. 334(1). Pages 84-95.
Belize Fisheries Department (2010). Directory of Protected Areas in Belize. Online at:
http://www.fisheries.gov.bz/Caye%20Caulker.pdf

BZM 161
40
Belize Fisheries Department (2007) ‘Catch report for lobster, conch and finfish for Area 5 within
2000-2002 . P g 10.
Bryant, D., L. Burke, J. McManus, and M. Spalding (1998) ‘Reefs at risk: a map-based indicator of
w c . World Resources Institute, Washington, D.C.
Butler, M., Cockcroft, A., MacDiarmid, A. & Wahle, R. (2013). Panulirus argus. The IUCN Red List of
Threatened Species. Version 2014.3. <www.iucnredlist.org>. Downloaded on 29 December 2014
Chan, I., Tseng, L., Dahms, H. and Hwang, J. (2013) 'Population and Growth of Queen Conch
(lobatus gigas 1758) in the Sapodilla Cayes Marine Reserve of Belize.' Zoological Studies. 52(46)
Cho, L. (2005) Marine Protected Areas: 'A tool for integrated coastal management in Belize'.
Ocean and Coastal Management. 48(11-12). Pages 932-947
Chong-Seng, K., Mannering, T., Pratchett, M., Bellwood, D. and Graham, N. (2012). ‘The Influence
of Coral Reef Benthic Condition on Associated Fish Assemblages. PLoS ONE, 7(8), page 42167.
CITES (2003). CITES suspends trade in queen conch shellfish. [Online]. Available at:
http://cites.org/eng/news/pr/2003/031001_queen_conch.shtml. Accessed on: 04/01/2015.
CITES (2014). What is CITES? [Online] Available at: http://www.cites.org/eng/disc/what.php.
Accessed on: 04/01/15.
Costanza, R., et al. ( 99 ) ‘T v w c m v c c p .
Nature, 387: Pages 253–260.
Cox, C., Hunt, J.H., Lyons, W.G. D v G.E. ( 99 ) ‘Nocturnal foraging of the Caribbean spiny
lobster (Panulirus argus) on offshore reefs of Florida, USA. Marine and Freshwater Research, 48
(8), Pages 671-680.Ellison A. F w E. ( 996) ‘Anthropogenic Disturbance of Caribbean
Mangrove Ecosystems: Past Impacts, Present Trends, and Future Predictions. Biotropica, 28(4),
pages 549.
English, S., Wilkinson. C. & Baker. V. (1994) (eds.) Survey manual for Tropical Resources.
Austrailian Institute for Marine Science, Townsville
FAO F R p . 5 W A c F mm (2002) ‘R p
SECOND WORKSHOP OF THE MANAGEMENT OF CARIBBEAN SPINY LOBSTER FISHERIES IN THE
WE AF AREA
Frontier Madagascar (2005) Biddick K, Brown L. F., Markham K, Mayhew E.M., Robertson A., &
Smith V. (eds.) A field manual for survey methods in tropical marine ecosystems. Frontier
Madagascar Environmental Research Report 17. Society for Environmental Exploration, UK
Gibson, J., Mcfield, M. and Wells, S. (1998) 'Coral Reef Managment in Belize: An Approach
Through Integrated Coastal Zone Management.' Ocean and Coastal Management. 39. Pages 229-
244.

BZM 161
41
Gilmore, M., Hall, B. (1976) ‘L H G w H b A c R f Acropora
v c P c R E v m . Journal of Sedimentary Petrology Vol. 46 (1976)No. 3.
(September), Pages 519-522
Gomez, G.M. (2004) 'A Rapid Ecological Assessment (REA) of Coral Reefs and Reef Fishes of Barrier
Islands within central Belize Barrier Reef Complex utilising the Mesoamerican Barrier Reef
Systems (MBRS) Protocol.' Belize Coastal Zone Management Authority.
Goreau, T., McClananhan, T., Hayes, R. and Strong, A. L. (2001) 'Conservation of Coral Reefs after
the 1998 Global Bleaching Event. Conservation Biology. 14(1). Pages 5-15.
G g M.R. (2009) ‘Environmental implications of plastic debris in marine settings—
entanglement, ingestion, smothering, hangers-on, hitch-hiking and alien invasions. Philosophical
Transactions of the Royal Society. 364(1526). Pages 2013-2025. Harborne, A. R., Renaud, P.G.,
Tyler, E. H. M. and Mumby, P. J. (2009) 'Reduced density of the Herbivorous Urchin Diadema
antillarum inside a Caribbean Marine Reserve Linked to Increased Predation Pressure by Fishes.'
Coral Reefs. 28(3). Pages 783-79.
Heck Hay, K. H G. O R. (200 ) ‘Critical evaluation of the nursery role hypothesis for
seagrass meadows. Marine Ecology Progress Series, 253. Pages 123-136.
Horsford, I., Ishida, M., Looby, G., Archibald, M., Simon, M., Edwards, T., Lovell, T., James, P.,
W bb J. & App . (20 ) ‘The Morphology of the Queen Conch (Strombus gigas) from
the Antigua and Barbuda Shelf – Implications for Fisheries Management. [Online] Available at:
http://www.strombusgigas.com/Panama%202014%20para%20QCweb/Antigua/GCFI_64%282012
%29%20Horsford%20et%20al%20Morphology%20of%20the%20Queen%20Conch%20from%20the
%20Antigua%20&%20Barbuda%20Shelf.pdf
Keck, J., Houston, R., Purkis, S., Riegl, B. (2005) ‘U xp c g c v Ac p c v c
R H . Coral Reefs November 2005, Volume 24, Issue 3, pp 509-
509
Hughes, T.P., Rodrigues, M.J., Bellwood, D.R., Ceccarelli, D., Hoegh-Guldberg, O., McCook, L.,
Moltschaniwskyi, N., Pratchett, M.S., Steneck, R.S. and Willis, B. (2007) 'Phase Shifts, Herbivory,
and the Resilience of Coral Reefs to Climate Change.' Current Biology. 17(4). Pages 360-365.
Huitric, M. (2005) 'Lobster and Conch Fisheries of Belize: a History of Sequential Exploitation'.
Ecology and Society. 10(1).
IUCN Red List (2014) [Online] Available at: http://www.iucnredlist.org/
K K. (20 2) ‘Imp c m g v c m. International Journal of Marine
Science, 10(2), Pages 70-89.
King, D.T. and Petruny, L. (2012) 'Belize Onshore Petroleum Exploration Activity North of the 17th
Parallel' Belize Petroleum Office Ministry of Natural Resources, Belmopan. Pages 104-116.
Klumpp D. P c A. ( 9 9) ‘Trophic significance of herbivorous macroinvertebrates on the
c G B R . Coral Reefs, 8(3), Pages135-144.

BZM 161
42
K m v V. M P.L. J G.P. (20 ) ‘R v Imp c v H b
mp x D v D m g S c R F mm Plos One, 8(12).
Lirman, D. et al., 2014. Growth Dynamics of the Threatened Caribbean Staghorn Coral Acropora cervicornis: Influence of Host Genotype, Symbiont Identity, Colony Size, and Environmental Setting P. A. Todd, ed. PLoS ONE, 9(9), pp.1–9. Available at: http://dx.plos.org/10.1371/journal.pone.0107253.
McClanahan, T.R., McField, M., Huitric, M., Bergman, K., Sala, E., Nystrom, M., Nordemar, I.,
Elfwing, T. and Muthiga, N.A. (2001) 'Responses of algae, corals and fish to the reduction of
macroalgae in fished and unfished patch reefs of Glover Reef Atoll, Belize.' Coral Reefs. 19. Pages
367-379.
McRae, E., (2010) ‘ F v : A -R H b R Reef Currents,
March, 2(1), page 3.
Monnereau, I. and Pollnac, R. (2012) 'Which Fishers are satisfied in the Caribbean? A Comparative
analysis of Job Satisfaction Among Caribbean Lobster Fishers.' Social Indicators Research. 109(1).
Pages 95-118.
M .J. (200 ) ‘Synthetic polymers in the marine environment: A rapidly increasing, long-term
threat. Environmental Research, 108 (2), Pages 131-139.
Mumby, P.J., Edwards, A.J., Arias-González, J.E., Lindeman, K.C., Blackwell, P.G., Gall, A.,
Gorczynska, M.I., Harborne, A.R., Pescod, C.L., Renken, H., Wabnitz, C.C.C. and Llewellyn, G.
(200 ) ‘M g v c b m c c mm bb . Nature,
427, Pages 533-536.
M L. M P.D. ( 992) ‘T M g m R R c S m : P c g
W p. A I M Sc c Townsville, Australia.
Nagelkerken, I., van der Velde, G., Gorissen, M., Meijer, G., Van't Hof, T. and den Hartog, C. (2000)
‘Importance of Mangroves, Seagrass Beds and the Shallow Coral Reef as a Nursery for Important
Coral Reef Fishes, Using a Visual Census Technique. Estuarine, Coastal and Shelf Science, 51(1),
pages 31-44.
Navarrete, A. D. J. and Valencia-Hernandez, A. (2013) 'Declining Densities and Reproductive
Activities of the Queen Conch Strombus gigas (Mesogastropoda: Strombidae) in Banco
Chinchorro, Eastern caribbean, Mexico.' Rev. Biol. Trop. 61(4). Pages 1671-1679.
OAA (20 ) ‘W m b ? [O ] Av b :
http://oceanservice.noaa.gov/facts/marinedebris.html. Accessed March 3rd, 2015.
Orth, R. J., Carruthers, T. J. B., Dennison, W. C., Duarte, C. M., Fourqurean, J. W., Heck, K. L.,
Hughes, A. R., Kendrick, G. A. and kenworthy, W. J. (2006) 'A Global Crisis for seagrass
Ecosystems.' Bioscience. 56(12). Pages 987-996.

BZM 161
43
Peel, J.R. and Aranda, D.A. (2012) 'Growth and Population Assessment of the Queen Conch
Strombus giga (Mesogastropoda: Strombidae) by Capture Mark-Recapture Sampling in a Natural
Protected Area of the Mexican Caribbean.' Rev. Biol. Trop. 60(1). Pages 127-137.
Perez, A.A & Garcia, O. (2012) Socioeconomic Assessment of the Sea Cucumber Fishery in
Belize. Technical Report.
P c D. ( 99 ) ‘Recruitment overfishing and resilience in spiny lobster populations. ICES
Journal of Marine Science, 50(1), Pages 9-14.
P .V. . R b .M. ( 99 ) ‘G b m v g c -reef fishes in two
m bb m v . M Ec g P g S V . 00; 6 -176, 1993
Rios-Lara, V., Salas, S., Javier, B.P. and Ayora, P. I. (2007) 'Distribution Patterns of Spiny lobster
(Panulirus argus) at Alacranes Reef, Yucatan: Spatial Analysis and Inference of Preferential
Habitat.' Fisheries Research. 87(1). Pages 35-45.
Russ, G. and Alcala, A. ( 996) ‘Marine Reserves: Rates and Patterns of Recovery and Decline of
Large Predatory Fish. Ecological Applications, 6(3), Pages 947
Sale, P.F., Guy, J.A., Steel, W.J. ( 99 ) ‘Ec g c c mb g c
isola p c . O c g 9 :83-99
Schutte, V. G., Selig, E. R. and Bruno, J. F. (2010) 'Regional spatio-temporal trends in Caribbean
coral reef benthic communities.' Marine Ecology Progress Series. 402. Pages 115-122.
Seudeal, . (20 ) ‘P g [O ], Animal Diversity Web. Available at:
http://animaldiversity.org/accounts/Panulirus_argus. Accessed January 3rd, 2015.
Sheavly, S.B. R g K.M. (200 ) ‘Marine debris & plastics: Environmental concerns, impacts
and solutions. Journal of Polymers and the Environment. 15 (4), Pages 301-305.
Short, F.T., McKenzie, L.J., Coles, R.G., Vidler, K.P., Gaeckle, J.L. (2006) SeagrassNet Manual for
Scientific Monitoring of Seagrass Habitat, Worldwide edition. University of New Hampshire
Publication. Page 75.
Stallings, C.D. (2009) 'Fishery-Independent Data Reveal Negative Effect of Human population
Density on Caribbean Predatory Fish Communities.' Plos one. 4(5).
S A. R M. ( 99 ) ‘Aggregation dynamics in juvenile queen conch (Strombus gigas):
population structure, mortality, growth, and migration. Marine Biology, 116(4), Pages 571-582.
Stoner, A.W., Davis, M. H. and Booker, C.J. (2012) 'Abundance and Population Structure of Queen
Conch Inside and Outside a Marine Protected Area: Repeat Surveys Show significant Declines'.
Marine Ecology Progress Series. 460. Pages 101-114.
Theile, S. (2002) ‘Queen conch and the review of significant trade. CITES World Official
Newsletter of the Parties 10: 3-4. [Online] Available at: www.cites.org/eng/news/world/10.pdf.
Accessed December 2014.
BZM 161
44
U.S. Fi W S v c (20 2) ‘Importing Queen Conch. What you need to know. [Online]
Available at: http://www.fws.gov/international/pdf/factsheet-import-queen-conch-2013.pdf.
Accessed on: 04/01/2015.
V m S. P mb S. (2006) ‘R c G F w bb S g Acropora
cervicornis: Implications for the Recovery E g R . Journal of Heredity 98 (1): 40-50
---IMPORTED REFERENCES TO BE SORTED---
Almada-Villela, P. et al., 2002. Status OF Coral Reefs OF Mesoamerica–Mexico, Belize, Guatemala,
Honduras, Nicaragua and El Salvador,
Bruno, J.F. et al., 2007. Thermal Stress and Coral Cover as Drivers of Coral Disease Outbreaks C. Roberts, ed. PLoS Biology, 5(6), p.e124. Available at: http://dx.plos.org/10.1371/journal.pbio.0050124.
Chollett, I. & Mumby, P.J., 2012. Predicting the distribution of Montastraea reefs using wave exposure. Coral Reefs, 31(2), pp.493–503. Available at: http://link.springer.com/10.1007/s00338-011-0867-7.
Harvell, D. et al., 2007. Coral Disease, Environmental Drivers, and the Balance Between Coral and Microbial Associates. Oceanography, 20(1), pp.172–195. Available at: http://tos.org/oceanography/article/coral-disease-environmental-drivers-and-the-balance-between-coral-and-micro.
Hauxwell, J. et al., 2001. Macroalgal Canopies Contribute to Eelgrass (Zostera marina) Decline in Temperate Estuarine Ecosystems. Ecology, 82(4), p.1007. Available at: http://www.jstor.org/stable/2679899?origin=crossref.
Herrera-Silveira, J.A. et al., 2010. Evidence of negative impacts of ecological tourism on turtlegrass (Thalassia testudinum) beds in a marine protected area of the Mexican Caribbean. Aquatic Ecology, 44(1), pp.23–31. Available at: http://link.springer.com/10.1007/s10452-009-9260-9.
Hughes, T.P. et al., 2007. Phase Shifts, Herbivory, and the Resilience of Coral Reefs to Climate Change. Current Biology, 17(4), pp.360–365. Available at: http://linkinghub.elsevier.com/retrieve/pii/S0960982207008822.
Hughes, T.P. et al., 2010. Rising to the challenge of sustaining coral reef resilience. Trends in Ecology & Evolution, 25(11), pp.633–642. Available at: http://linkinghub.elsevier.com/retrieve/pii/S0169534710001825.
Lilliesköld Sjöö, G. et al., 2011. Differences in top-down and bottom-up regulation of macroalgal communities between a reef crest and back reef habitat in Zanzibar. Estuarine, Coastal and Shelf Science, 91(4), pp.511–518. Available at: http://linkinghub.elsevier.com/retrieve/pii/S0272771410004038.
McField, M. et al., 2005. Status of the Mesoamerican Reef after the 2005 Coral Bleaching Event,
Mora, C., 2009. Degradation of Caribbean coral reefs: focusing on proximal rather than ultimate drivers. Reply to Rogers. Proceedings of the Royal Society B: Biological Sciences, 276(1655), pp.199–200. Available at:
BZM 161
45
http://rspb.royalsocietypublishing.org/cgi/doi/10.1098/rspb.2008.0606.
Mumby, P.J., 2006. Fishing, Trophic Cascades, and the Process of Grazing on Coral Reefs. Science, 311(5757), pp.98–101. Available at: http://www.sciencemag.org/cgi/doi/10.1126/science.1121129.
Neal, D., Ariola, E. & Muschamp, W., 2007. Vulnerability Assessment of the Belize Coastal Zone, Belmopan.
Perry, C.T. et al., 2015. Regional-scale dominance of non-framework building corals on Caribbean reefs affects carbonate production and future reef growth. Global Change Biology, 21(3), pp.1153–1164. Available at: http://doi.wiley.com/10.1111/gcb.12792.
Sale, P.F., Guy, J.A. & Steel, W.J., 1994. Ecological structure of assemblages of coral reef fishes on isolated patch reefs. Oecologia, 98(1), pp.83–99. Available at: http://link.springer.com/10.1007/BF00326094.
Sotka, E.E. & Hay, M.E., 2009. Effects of herbivores, nutrient enrichment, and their interactions on macroalgal proliferation and coral growth. Coral Reefs, 28(3), pp.555–568. Available at: http://link.springer.com/10.1007/s00338-009-0529-1.

BZM 161
46
7.0 Appendices
7.1 Appendix 1. Species lists.
Fish Species List
Angelfish - Pomacanthidae
Queen Angelfish Holacanthus ciliaris
Blue Angelfish Holacanthus bermudensis
French Angelfish Pomacanthus paru
Gray Angelfish Pomacanthus arcuatus
Rock Beauty Holacanthus tricolor
Butterflyfish - Chaetodontidea
Banded Butterflyfish Chaetodon striatus
Foureye Butterflyfish Chaetodon capistratus
Spotfin Butterflyfish Chaetodon ocellatus
Reef Butterflyfish Chaetodon sedentarius
Longsnout Butterflyfish Prognathodes aculeatus
Surgeonfish - Acanthuridae
Blue Tang Acanthurus coeruleus
Ocean Surgeonfish Acanthurus tractus
Doctorfish Acanthurus chirurgus
Jacks - Carangidae
Bar Jack Caranx ruber
Permit Trachinotus falcatus
Grunts - Haemulidae
French Grunt Haemulon flavolineatum
Bluestriped grunt Haemulon sciurus
Smallmouth Grunt Haemulon chrysargyreum
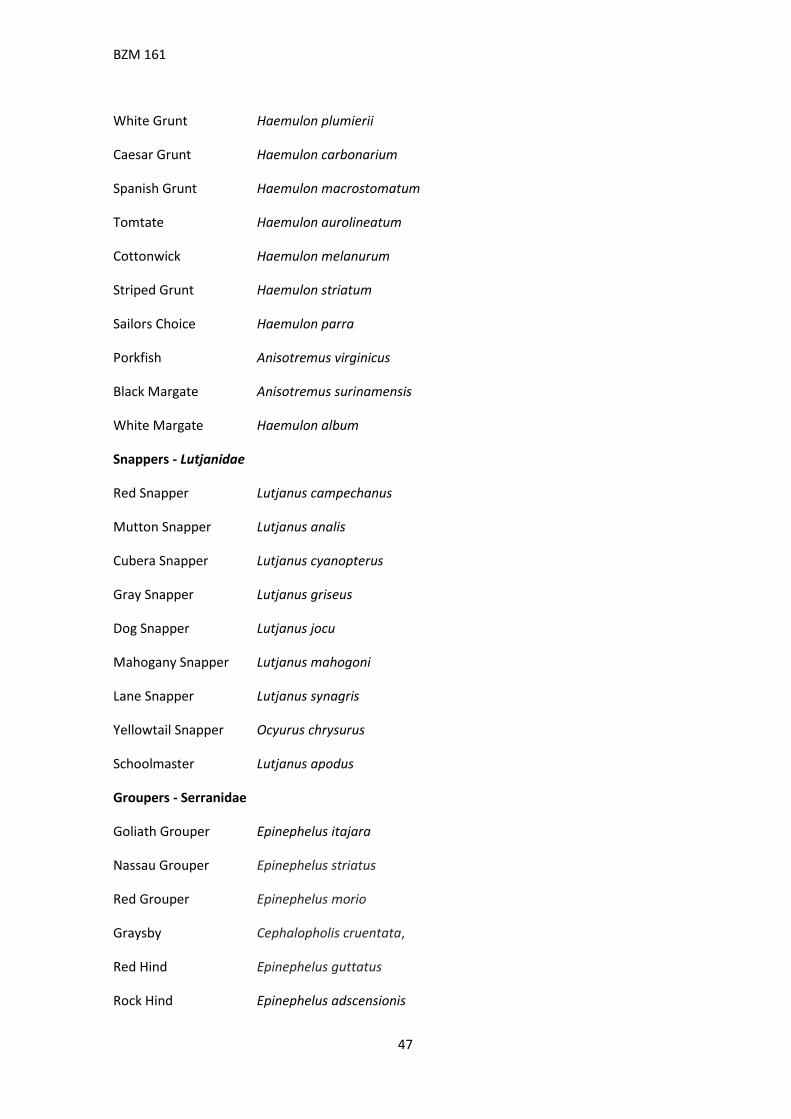
BZM 161
47
White Grunt Haemulon plumierii
Caesar Grunt Haemulon carbonarium
Spanish Grunt Haemulon macrostomatum
Tomtate Haemulon aurolineatum
Cottonwick Haemulon melanurum
Striped Grunt Haemulon striatum
Sailors Choice Haemulon parra
Porkfish Anisotremus virginicus
Black Margate Anisotremus surinamensis
White Margate Haemulon album
Snappers - Lutjanidae
Red Snapper Lutjanus campechanus
Mutton Snapper Lutjanus analis
Cubera Snapper Lutjanus cyanopterus
Gray Snapper Lutjanus griseus
Dog Snapper Lutjanus jocu
Mahogany Snapper Lutjanus mahogoni
Lane Snapper Lutjanus synagris
Yellowtail Snapper Ocyurus chrysurus
Schoolmaster Lutjanus apodus
Groupers - Serranidae
Goliath Grouper Epinephelus itajara
Nassau Grouper Epinephelus striatus
Red Grouper Epinephelus morio
Graysby Cephalopholis cruentata,
Red Hind Epinephelus guttatus
Rock Hind Epinephelus adscensionis

BZM 161
48
Coney Epinephelus fulvus
Black Grouper Mycteroperca bonaci
Tiger Grouper Mycteroperca tigris
Yellowmouth Grouper Mycteroperca interstitialis
Yellowfin Grouper Mycteroperca venenosa
Parrotfish - Scaridae
Blue Parrotfish Scarus coeruleus
Midnight Parrotfish Scarus coelestinus
Rainbow Parrotfish Scarus guacamaia
Queen Parrotfish Scarus vetula
Stoplight Parrotfish Sparisoma viride
Princess Parrotfish Scarus taeniopterus
Striped Parrotfish Scarus iseri
Redband Parrotfish Sparisoma aurofrenatum
Redtail Parrotfish Sparisome chrysopterum
Yellowtail Parrotfish Sparisoma rubripinne
Greenblotch Parrotfish Sparisoma atomarium
Trunkfish - Ostraciidae
Spotted Trunkfish Lactophrys bicaudalis
Triggerfish & Filefish - Balistidae
Queen Triggerfish Balistes vetula
Ocean Triggerfish Canthidermis sufflamen
Black Durgon Melicthys niger
Scrawled Filefish Aluterus scriptus
Whitespotted Filefish Cantherhines macrocerus
Orangespotted Filefish Cantherhines pullus
Miscellaneous

BZM 161
49
Hogfish Lachnolaimus maximus
Spanish Hogfish Bodianus rufus
Chub Kyphosus sectatrix/incisor
Great Barracuda Sphyraena barracuda
Yellowtail Damselfish Microspathodon chrysurus
Lionfish Pterois volitans
Juveniles and Recruits Fish Species List
Damselfish (<3.5cm)
Longfin Damselfish Stegastes diencaues
Dusky Damselfish Stegastes adustus
Threespot Damselfish Stegastes planifrons
Cocoa Damselfish Stegastes variabilis
Bicolor Damselfish Stegastes partitus
Blue Chromis Chromis cyanea
Brown Chromis Chromis multilineata
Surgeonfish (<5cm)
Blue Tang Acanthurus coeruleus
Ocean Surgeonfish Acanthurus tractus
Butterflyfish (<2.5cm)
Banded Butterflyfish Chaetodon striatus
Foureye Butterflyfish Chaetodon capistratus
Parrotfish
Princess Parrotfish Scarus taeniopterus
Striped Parrotfish Scarus iseri
Redband Parrotfish Sparisoma aurofrenatum
Greenblotch Parrotfish Sparisoma atomarium
Stoplight Parrotfish Sparisoma viride

BZM 161
50
Others (<3.5cm)
Spanish Hogfish Bodianus rufus
Slippery Dick Halichoeres bivittatus
Clown Wrasse Halichoeres maculipinna
Rainbow Wrasse Halichoeres pictus
Yellowhead Wrasses Halichoeres garnoti
Bluehead Wrasse Thalassoma bifasciatum
Fairy Basslet Gramma loreto
Benthos species list
Sponges SPN
Corals
Branching Fire Coral Millepora cervicornis MALC
Blade Fire Coral Millepora complanata MCOM
Gorgonian GG
Staghorn Coral Acropora cervicornis ACER
Fused Staghorn Coral Acropora prolifera APRO
Elkhorn Coral Acropora palmata APAL
Clubtip Finger Coral Porites porites PPOR
Pillar Coral Dendrogyra cylindrus DCYL
Blushing Star Coral Stephanocoenia intersepta SINT
Lobed Star Coral Orbicella annularis OANN
Mountainous Star Coral Orbicella faveolata OFAV
Great Star Coral Montastraea cavernosa MCAV
Elliptical Star Coral Dichocoenia stokesi DSTO

BZM 161
51
Mustard Hill Coral Porites asteroids PAST
Massive Starlet Coral Siderastrea siderea SSID
Lesser Starlet Coral Siderastrea radians SRAD
Symmetrical Brain Coral Pseudodiploria strigosa PSTR (was Diploria sp.)
Knobby Brain Coral Pseudodiploria clivosa PCLI (was Diploria sp.)
Grooved Brain Coral Diploria labyrinthiformis DLAB
Maze Coral Meandrina meandrites MMEA
Rose Coral Mancina areolata MARE
Boulder Brain Coral Colpophyllia natans CNAT
Whitestar Sheet Coral Agaricia lamarcki ALAM
Lettuce Coral Undaria agaricites UAGA (was Agaricia sp.)
Low Relief Lettuce Coral Undaria humilis UHUM (was Agaricia sp.)
Thin Relief Lettuce Coral Undaria tenufoila UTEN (was Agaricia sp.)
Ridged Cactus Coral Mycetophyllia lamarckiana MLAM
Sinuous Cactus Coral Isophyllia sinuosa ISIN
Spiny Flower Coral Mussa angulosa MANG
Smooth Flower Coral Eusmilia fastigiata EFAS
Marine algae
Thalassia sp. TH
Dictyota sp. DT
Lobophora sp. LOB
Halimeda sp. HM
Blue/Green Algae BGA

BZM 161
52
Turf Algae TURF
Macro Algae MAC
Coralline Algae COR
Other Substrates
Sand SN
Bare Rock BR