bellingham climate adaptation plan · web viewbellingham climate adaptation plan avoiding the...
TRANSCRIPT

Bellingham Climate Adaptation Plan
Avoiding the Unmanageable and Managing the Unavoidable
January 2012

ContentsPreface & Next Steps...................................................................................................................................3
Executive Summary.....................................................................................................................................4
Climate Action Plan Phase III.......................................................................................................................7
Climate Change Adaptation.........................................................................................................................7
Regional History of Adaptation................................................................................................................8
Temperature, Precipitation, and Sea Level Rise Models.............................................................................9
Hydrology/Water Resources.....................................................................................................................11
Water Quantity......................................................................................................................................11
Water Quality........................................................................................................................................13
Ecosystem/Habitat................................................................................................................................14
Infrastructure........................................................................................................................................15
Adaptation Strategies............................................................................................................................15
Oceanographic Changes............................................................................................................................18
Inundation/Flooding..............................................................................................................................20
Landslides / Erosion / Sediment Transport............................................................................................21
Acidification...........................................................................................................................................22
Increased Harmful Algal Blooms............................................................................................................23
Infrastructure........................................................................................................................................23
Adaptation Strategies............................................................................................................................24
Protection..........................................................................................................................................24
Accommodation................................................................................................................................25
Retreat...............................................................................................................................................25
Ocean Acidification and Harmful Algal Blooms..................................................................................26
Additional Measures..........................................................................................................................26
Energy........................................................................................................................................................28
Energy Conservation/Efficiency.............................................................................................................31
Energy Production/Development..........................................................................................................31
Infrastructure........................................................................................................................................31
References.................................................................................................................................................32
Appendix...................................................................................................................................................37
2

Preface & Next StepsThis document is not intended to provide project level detail for climate adaptation. Rather it is intended to provide a framework for evaluating vulnerabilities posed by climate change and identifying strategies to increase the community’s resilience to such vulnerabilities. Seldom, if ever, will these strategies take the form of large capital projects, with the sole purpose of climate adaptation. A vast majority of adaptation actions will likely be relatively minor changes in planning or project design, and nearly all will have additional benefits outside of increasing resiliency to climate change. Indeed, many actions currently occurring, such as water conservation and stormwater management, already have beneficial adaptation characteristics outside of their formal scope. Identifying these co-benefits will enable the City to maximize the efficiency of funds as well as aid in leveraging additional resources for projects.
While this plan is not intended to provide detail for future projects, it is intended to help aid future decisions for a myriad of projects. Environmental Resources staff have developed a Sea Level Rise Vulnerability Analyses tool for city planners and engineers to use during project development. This tool is available online, and a worksheet from this is included in the appendix.
The science investigating climate change is continually evolving. The level of certainty amongst all influences of climate change is not currently uniform. For example, there is very high confidence in temperature warming predictions. However, precipitation changes, particularly for the Pacific Northwest, are less certain. Many studies indicate there will be an increase, and a shift in patterns, however there is less confidence in these estimates. Like all sciences, climate science is not static, and more precision and confidence will be gained in coming years and decades. Due to this inherent state of motion, climate adaptation strategies need to be equally dynamic. At a bienniel review of this plan is necessary to ensure that it utilizes the “best available science”. Significant updates should be appended as warranted.
Included in future updates should be an evaluation of sectors which have not been analyzed in detail within this plan. A reprioritization of remaining sectors will likely be necessary as scientific understanding expands as well as climate change impacts begin to occur.
While this plan focuses on Bellingham, climate change will not recognize jurisdictional boundaries. There are aspects in which Bellingham stands vulnerable, but may have little capacity to act. For example, over 80% the Lake Whatcom watershed is under Whatcom County jurisdiction. Collaborating with staff from Whatcom County and other nearby entities such as Skagit County, British Columbia as well as local Tribal agencies would create a more holistic, efficient and effective approach to climate change adaptation. Likewise, ensuring adaptation goals and strategies do not dwell solely in the Environmental Resources Division, and are distributed to all staff whose work, or future work, will be affected is essential to adequate preparation.
3

Executive Summary
Despite global greenhouse gas emission reduction efforts, climate change is occurring and will continue to do so for several decades, if not centuries. It is therefore critical to identify probable climate change impacts at a local level, and plan and prepare for the projected impacts.
City of Bellingham Environmental Resources staff conducted an analysis of climate change vulnerabilities to identify which sectors are most at risk from a changing climate. Each sector was evaluated, scored, and subsequently ranked to identify highest priorities. Based on available resources, three high priority sectors were chosen for extensive analysis: hydrology/water resources, sea level rise, and energy. Sectors that were not included in this analysis merit future discussion and planning as resources permit and as science gains better understanding of climate change impacts.
Adapting to climate change will require a concerted effort by the community and elected officials. There is no one size fits all approach to climate change adaptation, nor is it a onetime action. Flexibility will be necessary as changes continue to manifest and as science continues to gain a better understanding of the impacts of climate change.
Water Resources
Climate Change Impacts:Bellingham’s water resources face two main threats due to climate change: decreased water quantity and lowered water quality, both affecting human and ecosystem health. Much of the Pacific Northwest (PNW) relies on deep seasonal snowpacks to store winter precipitation for use in the warmer, drier months. Models indicate that Pacific Northwest snowpack will decrease significantly, up to 40%, over the next century (Payne et al., 2004). Although Lake Whatcom’s natural watershed relies minimally on snowpack, the Middle Fork (MF) of the Nooksack River, which augments water supply, will likely see a fundamental change in streamflow regime, with higher winter flows followed by lower summer flows. Summer stream flows are projected to decrease by 8.6%-15.7% in the coming decades (Donnell, 2007). The MF contains two Endangered Species Act (ESA) listed species, Chinook Salmon and Bull Trout, further limiting diversion capability. Increased temperatures and decreased summer precipitation will reduce water volume in Lake Whatcom during periods of highest demand.
Water quality is intricately linked to water quantity, particularly in the PNW, where salmon require abundant, clean, cold water. Increasing water temperatures not only negatively affect salmon; it also increases biotic activity, such as algal growth in Lake Whatcom. As organic matter increases in water, so too do treatment costs and use of chlorine, which leads to an increase in unwanted treatment byproducts. Increased winter precipitation and elevated stream flows will likely increase stream bank erosion as well as contribute to landslides in the watershed, further increasing the phosphorus and sediment burden on Lake Whatcom. Water dependent wildlife will be affected from decreased water quality, as will recreationalists using the lake.
Adaptation Strategies:Adapting to these new conditions will require a diverse response. Water conservation efforts will be vital in maximizing the use of each gallon of water. Water conservation takes a variety of forms, including community outreach, infrastructure upgrades, sustainable water use/reuse, and regulatory changes.
4

Ensuring stormwater treatment facilities are designed to account for potential higher intensity precipitation events will help prevent overflows and assist with ensuring appropriate water quality levels in Lake Whatcom. Expanding the Department of Natural Resource’s Landscape Plan to encompass all logging activities within the Lake Whatcom watershed will reduce risks associated with mass wasting events further protecting water quality in Lake Whatcom. Continued implementation and funding of the Lake Whatcom Management Plan, particularly regarding property acquisition and invasive species control, will lessen the burden on aquatic and terrestrial wildlife dependent on the lake for survival.
Oceanographic Changes
Climate Change Impacts:Global sea levels have risen 1.0 – 2.5mm annually over the past century, and models predict this rate of rise to increase to 2.0-8.6mm annually by 2100 (IPCC, 2007). Models vary, but by 2100, sea levels in Puget Sound have potential to rise by as much as 50 inches (Mote, et al., 2008). This will have profound impacts on coastal communities locally and around the world. Local sea level rise will likely manifest first in more frequent and extreme episodic coastal flood events. Low-lying marshes, wetlands, and beaches face high vulnerability, so too do coastal bluffs and hardened infrastructure. Both municipal and private infrastructure are threatened by rising sea levels.
Ocean acidity levels have increased 30% worldwide over the past century (Feely, et al., 2008). This increase has and will continue to impact calcium-carbonate dependent species, such as shellfish and plankton. Increasing acidity is expected to increase mortality in many species, affecting commercially harvested shellfish as well as disrupting a vital aspect of the food web in plankton.
Changing ocean characteristics have been correlated to an increase in both frequency and intensity of harmful algal blooms (HAB) (Patz et al., 2006). HABs have the potential to cause human illness or death, as well as deteriorate local ecosystem health for other marine species (US Center for Disease Control, 2004).
Adaptation Strategies:Adapting to sea level rise will force difficult decisions in shoreline management. Three general responses to sea level rise exist: accommodation (e.g. houses on stilts), protection (e.g. bulkheads, ripraps, etc), and retreat (e.g. abandoning inundated or soon to be inundated facilities). Each response has benefits and challenges, and all will likely be utilized to varying degrees. Accommodation is rarely used alone or as a permanent option, often it is combined with protection to prevent damages. Hardening of a shoreline (protection) eliminates all capacity of nearshore habitat to adapt to sea level rise. Physical structures fundamentally alter sediment transport along a shoreline, potentially causing both local and distant erosion. These structures can also increase vulnerability to extreme events, such as a strong storm surge. Abandoning structures and facilities where inundation is imminent (retreat) provides the greatest margin of error and allows tidal zones to adapt to higher sea levels. However, this approach can be expensive and may be difficult to achieve large-scale community support.
Altered ocean chemistry poses a difficult challenge, as it is impossible to reduce acidity levels without a significant reduction in global CO2. Reducing other external stresses on marine life will be essential to species survivability. Monitoring and educating the public regarding HABs will help protect human and ecosystem health. Reviewing and supporting local research will better prepare Bellingham for future changes.
5
Energy
Climate Change Impacts:According to the Bonneville Power Administration, climate change is the overarching issue for the entire utility industry, with potential to change nearly every facet of operations. In the Pacific Northwest, approximately 70% of all electricity is generated at hydroelectric dams, mostly in the Columbia River watershed (Hamlet et al., 2009). Changes in precipitation patterns will likely increase power generation in the winter and decrease generation in the summer, with an annual net loss of 1%-4% by 2020. At the same time, demand for electricity is expected to increase significantly. Despite a warmer climate, heating energy demand in the Pacific Northwest is forecasted to increase 22% by 2020 and 35% by 2040. Cooling energy demand is expected to increase 240% by 2020 and 400% by 2040 (Hamlet et al., 2009).
Energy derived from fossil fuels will face changes as well. Generation capabilities will be affected by competing water demands, emission reduction standards, increased ambient air temperature, and extreme weather events. These changes will create significant challenges for energy producers and managers.
Adaptation Strategies:Energy conservation and renewable energy development will be essential to ensure an adequate energy supply for Bellingham. Many conservation efforts are outlined in Phase I and II of the City of Bellingham’s Climate Action Plan, however additional measures will also be necessary. Expanding energy efficiency efforts will also reduce demand and maximize each kW used.
Developing local renewable energy sources will help buffer Bellingham from regional and national fluctuations in electrical supply and associated cost implications. Several efforts are already being evaluated for both municipal operations and the community. A hydroelectric generator utilizing the former Georgia Pacific intake is currently being evaluated by the City, as is the use of solar panels on select municipal buildings. Several private sector organizations have adopted solar and wind power generation. Additional measures will be necessary if Bellingham is to work towards energy independence.
6

Climate Action Plan Phase III In May 2007, the Bellingham City Council approved the Greenhouse Gas Inventory and Climate Protection Action Plan. This plan outlines the City’s approach to curb greenhouse gas (GHG) emissions from both municipal operations and the community. It is organized in three phases: the first phase identifies actions in progress or planned to begin in the near future. The second phase identifies areas in which additional progress in reducing GHGs could be achieved, and outlined steps to accomplish these goals. Phase three was intentionally left undeveloped to incorporate more discussion and suggestions from the community as well as allowing the goals and plans set forth to mature.
After several years of implementing the first two phases of the Climate Action Plan, and incorporating feedback from the community, Phase III of the Climate Action Plan has been completed. This phase addresses climate change adaptation; a different but equally important response to climate change.
Phase I and II are focused on climate change mitigation; reducing the amount of GHGs emitted in order to reduce future impacts. Scientists agree however, that even if all carbon emissions ended today, the climate would continue current trends for several decades, if not centuries, before reaching equilibrium. Therefore, planning and preparing for future conditions is a vital
aspect of ensuring a resilient and sustainable community. It is important to note that mitigation and adaptation actions are rarely mutually exclusive; often times reducing GHG emissions simultaneously results in a better-prepared individual or community. Household water conservation, for example, reduces the energy demand for pumping and treating, while also reducing water demand from a water body, which may be experiencing altered flows or decreased water quality. There are actions however, that may not reduce carbon footprints, but will allow an identified sector to be better prepared to operate in a changing climate.
Climate Change AdaptationAnticipating and preparing for future climatic conditions offers several advantages when compared to a reactionary approach. Climate change impacts will likely manifest in more frequent episodic extreme events, such as storms and floods, requiring emergency responses. Taking action to limit impacts before an event occurs greatly reduces risk to human health, infrastructure, and the environment. Whereas emergency response is reactionary by nature, taking an anticipatory approach to climate change allows for more robust planning, public review, and discussion (Whitely Binder et al., 2010). Furthermore, anticipatory responses provide a greater suite of adaptation tools to climate change. It is impossible to remove all vulnerability to climate change, but by creating a framework to address vulnerability in the community, the City of Bellingham has an opportunity to greatly reduce projected future impacts from climate change.
Identifying the most vulnerable sectors of our community and environment was the first step in prioritizing adaptation efforts. Eight sectors were selected to be evaluated: hydrology/water resources, oceanographic changes, forests, energy, transportation, human health, social disruption and severe weather. While these sectors overlap in many ways, it was deemed appropriate to consider them as distinct entities for the purpose of evaluation. Sectors were then evaluated and scored by eight
7
“A critical need is the dissemination of current scientific information to decision makers, resource managers, stakeholders, and the public.”
-Department of Ecology

weighted criteria: system sensitivity, infrastructure impact, ecological impact, community impact, time-scale of impacts, scientific certainty, jurisdictional capacity, and associated costs. Due to limited resources, staff did not conduct a comprehensive analysis for each sector and instead chose to focus on the three sectors with the highest scores: water resources, oceanographic changes, and energy. Although ranking lower in priority, sectors not in the top three still merit future discussion and planning, especially as science gains better understanding and as impacts begin to occur. One specific area that should be investigated further in future studies is the potential social disruption associated with climate change. This perhaps is the area of most uncertainty in climate change scenarios. While little research is available, it can reasonably be expected that if more extreme models hold true, significant social disruption is possible, especially with effects exacerbated by the closely related peak oil phenomena.
Adaptation strategies are focused as much as possible on “no regret” scenarios, meaning even if climate predictions were erroneous, these actions will still provide benefit to the community. By identifying and confronting future risks and vulnerabilities, the city has the opportunity to not only limit economic and societal hardship, but also create a more vibrant and resilient community. Climate predictions are dire however; this is by no means a “dooms-day” report. While changes and difficulties are predicted, Bellingham is well positioned to address these challenges and will continue to be a highly desirable location to live.
Regional History of AdaptationIn 2007, Governor Christine Gregoire directed the Directors of the Washington State Department of Ecology (DOE) and Department of Commerce to determine specific steps Washington should take to prepare for impacts of climate change. Five sectors were chosen for extensive evaluation including public health, agriculture, coastline, forestry, infrastructure and water supply. Five Topic Advisory Groups (TAGs) were formed with experts and representatives in each respective topic. Recommendations from these task forces have been considered and included where applicable in this plan.
King County collaborated with Local Governments for Sustainability (ICLEI) to prepare a guidebook to local climate change preparations. The City of Seattle has worked with the University of Washington staff to better identify local vulnerabilities to climate change and are drafting a climate vulnerability analysis. Olympia is conducting studies to forecast sea level rise impacts more precisely. While these and other efforts are occurring, climate change adaptation is still very much in its infancy, with few organizations undertaking the challenge. Bellingham once again has the opportunity to provide leadership and foresight into climate change adaptation.
8
Figure 1 Comparison of observed year-to-year variability and projected shifts in average temperature and precipitation from 20 climate models. (http://cses.washington.edu/cig/fpt/ccscenarios.shtml#table1)
Temperature, Precipitation, and Sea Level Rise Models
Figure 1 Northwest Temperature Change Models
Season 2020s: Temperatures in °C (°F) 2040s: Temperatures in °C (°F)B1 A1B Range B1 A1B Range
Annual +1.2 +1.3 +0.6 to +1.9 +1.7 +2.3 +0.9 to +2.9(2.1) (2.3) (1.1 to 3.4) (3.1) (4.1) (1.6 to 5.2)
Winter +1.0 +1.0 +0.4 to +2.0 +1.4 +1.8 +0.6 to +2.8Dec-Feb (1.8) (1.8) (0.7 to 3.6) (2.5) (3.3) (1.0 to 5.1)Spring +1.1 +1.1 +.02 to +2.0 +1.5 +1.8 +0.6 to +3.0Mar-May (2.1) (1.9) (.04 to 3.6) (2.7) (3.3) (1.0 to 5.4)
Summer +1.4 +1.8 +0.5 to +2.9 +2.1 +2.8 +0.9 to +4.4Jun-Aug (2.5) (3.2) (1.0 to 5.2) (3.7) (5.0) (1.5 to 7.9)Autumn +1.0 +1.0 +0.1 to +1.8 +1.4 +1.9 +0.8 to +2.9Sep-Nov (1.8) (1.8) (0.1 to 3.2) (2.6) (3.5) (1.4 to 5.2)
Figure 2 Northwest Precipitation Change Models
Season 2020s: Precipitation change, % 2040s: Precipitation change, %B1 A1B Range B1 A1B Range
Annual +1.8 +0.1 -9 to +10 +2.1 +2.0 -10 to +11
Winter+2.0 +2.1 -14 to +23 +2.6 +5.1 -13 to + 27
Dec-FebSpring
+1.3 -0.3 -11 to + 9 +3.3 +3.9 -11 to +16Mar-May
Summer-3.0 -7.9 -30 to +13 -4.6 -12.0 -30 to +17
Jun-AugAutumn
+5.1 +2.8 -11 to +20 +5.1 +4.7 -10 to +21Sep-Nov
Figure 3 Sea Level Rise in Washington StateSLR
Estimate By the year 2050 By the year 2100
NW Olympic Peninsula
Central & Southern
Coast
Puget Sound
NW Olympic Peninsula
Central & Southern Coast
Puget Sound
Very Low -5" (-12cm) 1" (3cm) 3" (8cm) -9" (24cm) 2" (6cm) 6" (16cm)
Medium 0' (0cm) 5" (12.5cm) 6" (15cm) 2" (4cm) 11" (29cm)14" (34cm)
Very High 14" (35cm) 18" (55cm) 22" 35" (88cm) 43" (108cm) 50"
9

(55cm) (128cm)Figure 4*
* Figure 3 illustrates a “bathtub model” for sea level rise in Bellingham. It illustrates general vulnerability and topography, however It is not precise enough to allow for detailed decision making.
10
Hydrology/Water Resources
11

Lake Whatcom is the drinking water source for approximately 96,000 residents of Bellingham and Whatcom County (Total Maximum Daily Load, 2008). It is a large natural lake, which consists of three connected basins and contains approximately 250 billion gallons of fresh water (TMDL, 2008). It is drained via Whatcom Creek at the northwest end of the lake. A diversion dam on the Middle Fork (MF) of the Nooksack River was constructed in 1962, which tunnels water 8900 feet, through Bowman Mountain, to augment lake levels during drier months. The MF headwaters are the Deming Glacier on Mt. Baker’s west face and flows 7.4 miles west until reaching the dam. In the summer, this diversion supplies approximately 80% of the inflow to Lake Whatcom (Donnell, 2008). The MF Nooksack contains two Endangered Species Act (ESA) listed species: Chinook salmon (Oncorhynchus tshawytscha) and Bull Trout (Salvelinus confluentus). The MF helps control Lake Whatcom Levels, as does a control dam at the entrance of Whatcom Creek. By law, the maximum lake level height is 314.94 ft above sea level.
Lake Whatcom faces several threats due to climate change. Northwest climate models suggest that higher cool season temperatures (October-March) will result in more precipitation falling as rain rather than snow in higher elevations (Marketa et al., 2009). This increase of winter rain and subsequent decrease in spring and summer snow pack will change flow regimes of streams and rivers (Hamlet et al., 2005). These changes have already begun. April 1 snowpack, a key indicator of water storage for dry months, has declined almost 25% in the past 40-70 years in the Cascade Mountains (Mote, 2006). Snowpack decline is expected to accelerate with as much as a 40% reduction by 2040 (Payne et al., 2004). This change in precipitation patterns will result in a shift of streamflow regimes, with increased winter and early spring flows, and significant declines in summer and fall flows (Stewart et al., 2004). These effects will manifest themselves locally with impacts on water quantity, water quality, wildlife/habitat, and infrastructure damages.
Water QuantityLake Whatcom is a low elevation watershed where ridgelines reach 3000 feet in elevation. Shallow seasonal snowpack develop in the upper reaches, however most precipitation in the watershed falls in the form of rain. Since the snowpack is relatively shallow, the potential loss of this melt-off in spring and summer is unlikely to have a significant impact on water level (Greenburg, personal communication 2011). However, the MF Nooksack has a much higher watershed; particularly the sub-watershed located above the diversion dam, which is heavily
reliant upon snow and glacier melt for flows during warmer months. Simulation results suggest that late summer streamflow in the Middle Fork could be reduced by as much as 8.6% as the direct result of glacier shrinkage predicted in the next fifty years, or by as much as 15.7% as the result of glacier shrinkage and predicted climate change for the same time period (Donnell, 2007). This drainage will likely follow the scenario projected for snow-dominated watersheds and shift towards a rain and snow dominated watershed (see figure 6). This will result in increased cool season flows (November-March) and decreased flows during summer and early fall. Higher winter flows and increased rain on snow events may result in flooding and structural damage at the diversion dam. The resulting low summer
12
Figure 5. April 1 snowpack has declined throughout the Northwest. In the Cascade Mountains, April 1 snowpack declined by an average of 25 percent, with some areas experiencing up to 60 percent declines. On the map, decreasing trends are in red and increasing trends are in blue.
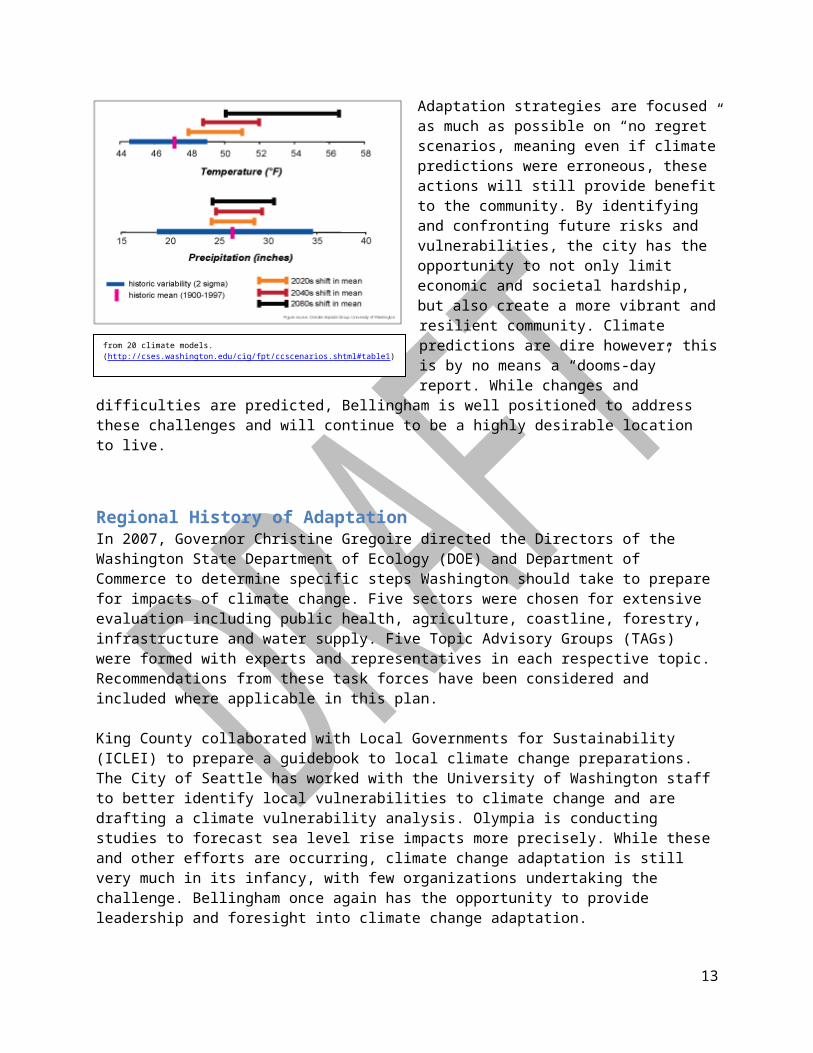
Figure 6. Seasonal hydrologic response for three types of PNW rivers (normalized monthly average streamflow): snowmelt dominated, rain dominated, and mixed. MF Nooksack may transition from snow dominated to rain and snow dominated. (UW Climate Impacts Group, 2009)
streamflows will limit the capability of diverting water to Lake Whatcom. Compounding this is the ESA listed species in the MF, which require sufficient water for habitat. The City is currently in on-going negotiations with other stakeholders to agree on water withdrawals for competing water interests and to ensure adequate fish habitat.
Additional water quantity threats are likely to manifest as well. The potential decrease in summer precipitation in the PNW will result in less water additions to the lake in the time of highest water demand. Adding further stress is the predicted increase in summer temperatures (Elsner et al., 2009). In 2009-2010, evaporation accounted for 8.8% of total hydraulic output from Lake Whatcom, with an estimated 88% occurring between April and September (Matthews, 2011). During warm days, up to 20 million gallons of water can be evapotranspired from the Lake Whatcom watershed (City of Bellingham, 2002). The increased summer temperatures will increase total evaporation from the lake and transpiration from the watershed, further reducing supply.
Despite a 47% population increase since 1991, water demand in Bellingham has remained consistent, with an average daily demand of around 11 million gallons per day (MGD), and a maximum daily demand of nearly 20 MGD. However, even with further conservation efforts, average daily and maximum daily demand are expected to increase 54% and 65% respectively by 2028 (City of Bellingham, 2008). If water conservation efforts were stopped, average and maximum water demand is estimated to increase 66% and 87% respectively. These estimates are based on a constant demand scenario and consumption factors are unchanged. However, with the predicted temperature rise of 3-5 degrees, demand has potential to increase. Early reports from climatic effects on water demand study in Portland, Oregon, suggest per household water demand will increase over 100 gallons per month per degree Celsius temperature raise.
Water Quality
131990
1992
1994
1996
1998
2000
2002
2004
2006
2008
0.002.004.00
6.008.00
10.00
12.00
0
20,000
40,000
60,000
80,000
100,000
Water Consumption and Population, Bellingham, WA1990-2008
Average Daily Consump-tionPopulation
milli
on g
allo
ns/d
ay (
mgd
)
popu
latio
n
Figure 7

Lake Whatcom currently is on the Washington State 303(d) list of impaired water bodies due to high phosphorus levels and associated low dissolved oxygen (DO) levels. Although climate change is not considered a significant cause of elevated phosphorus levels, it will likely exacerbate the problem by strengthening the internal phosphorus cycle. Phosphorus acts as a fertilizer to algae, which photosynthesizes, thereby emitting oxygen (Matthews, 2011). However, this oxygen is then consumed by the various organisms during the night. When algae die and sink to the substrate, it is decomposed by oxygen consuming bacteria, thus creating an anoxic or hypoxic condition (Matthews, 2010). These bacteria also release phosphorus back into the water column, enabling a self-reinforcing cycle of algal growth and oxygen depletion. These affects are exacerbated by the annual stratification of the lake, in which the lake forms two distinct layers with minimal mixing. This causes the hypolimnion (lower layer), particularly in Basin One and Two, to become extremely oxygen deficient (TMDL, 2008). Algal blooms can cause structural damages. In July 2009, a large algal bloom caused massive clogging at intake pipes and treatment facilities, resulting in water shortages and mandated water conservation efforts, the first such occasion the City has encountered. This increase of algae also makes water purification more difficult and chemical intensive, which results in an increase in unwanted treatment byproducts.
Predicted increases in summer temperatures in the northwest will strengthen this cycle. Algae growth will likely be stimulated by the increase in solar energy due to warmer days and potentially less precipitation. Exact algal bloom changes, however, are particularly difficult to predict. Algae respond quickly to temperature and precipitation influences, and climate change science is not precise enough to forecast at such a detailed level (Matthews, Personal Communication, 2011).
Water quality faces other threats from climate change as well. The potential increase in winter precipitation and raising snowline elevation will create higher stream and stormwater flows. Bank erosion due to high water flows will contribute phosphorus-laden sediment to the lake, further stimulating algal growth. An increase in stormwater runoff will also
likely increase phosphorus and other chemical loading into the lake. In addition,
an increase in precipitation as well as a potential increase in rain-on-snow events
will create more favorable conditions for mass wasting events in the Lake Whatcom watershed. These events are well documented in the watershed, with the most recent major event happening in 2008 when large amounts of soil and debris flooded through Austin Creek into Lake Whatcom.
14
Figure 8. Nonlinear relationship between dissolved oxygen and time at Site 1, 12 m. All correlations were significant (Matthews, 2011)

Ecosystem/HabitatWater quality and quantity are both intrinsically linked to ecosystem and species health. Countless plant, fish and animal species rely on Lake Whatcom and its watershed for their health and habitat. Impacts to this ecosystem will reach beyond ecological damage and has the potential to affect local and regional economies as well. Lake Whatcom is distinguished as one of the largest suppliers of Kokanee Salmon in the nation, with two-thirds of the state stocked fisheries hatched at the Brannian Creek Hatchery. 36 lakes in Washington State rely on this operation, contributing an estimated $20.7 million to the state economy (Whatcom County, 2003). Salmon require abundant, cold and well-oxygenated waters to survive and spawn. Effects from climate change threaten all three of these requirements, and periodic fish kills have already been observed in the lake. As mentioned above, ESA listed Chinook
salmon and Bull Trout inhabit the MF Nooksack, which may limit water diversion. Salmon have a societal and economic value matched by few other species, and while there are many other creatures that rely on Lake Whatcom for survival, Kokanee Salmon act as a keystone and indicator species for others in the watershed. Due to their direct reliance on a high quality water environment, they will likely
be among the first and most affected from climate change.
Water temperature of Lake Whatcom will increase with atmospheric warming. This warmer water, along with the additional nutrient loading outlined above, will create more favorable conditions for non-native, invasive species (US Army Corps of Engineers, 2009). Control costs for invasive species nationwide are estimated at $137 billion annually (Washington Invasive Species Council, 2009). Invasive species cause structural damages such as clogged pipes, are deleterious to the native ecosystem, and hinder recreational opportunities (Lake Whatcom Invasive Species Plan, 2011). The Great Lakes region has seen a near total collapse of commercial and recreational fishing industries,
due to the Zebra and Quagga Mussels. These mussels, native to Eurasia, were introduced via ship ballast water in the late 1980’s and have since spread to 33 states (100th Meridian Initiative, 2010). Most invasive species are spread passively, by attaching to a boat, trailer or wildlife (US Fish and Wildlife, 2007).
Streams throughout Bellingham will experience changes due to climate change. The four largest perennial creeks within City limits are Chuckanut, Fairhaven, Padden, Whatcom and Squalicum Creek. All are salmon bearing, and provide habitat to a myriad of other aquatic and terrestrial species. These streams are low elevation watersheds which will likely follow a similar pattern outlined above, with higher winter flows and decreased summer flows. Significantly higher flows pose threats to salmon as redds (egg nests) can become asphyxiated or crushed with increased sediment and debris. Additionally, juvenile fish unable to contend with the increased velocity can be carried to the ocean before reaching adequate age.
15
Figure 9 Average summertime temperature estimates for the 1980s (left map), and the 2040s (right map). Continuous colors indicate air temperatures and colored dots represent water temperature sites (Mantua et al.).
Climate change is likely to make its most dramatic initial impact on fish and wildlife, pushing some species closer to extinction.
-Department of Ecology

InfrastructureBoth public and private infrastructure face threats because of hydrologic changes. If models predicting higher winter precipitation are correct, flows throughout Bellingham, in both creek beds and stormwater drainages face an increased threat of flood and overflow. This will be exacerbated if models showing increased storm intensity hold true. Additionally, if flows are continuously elevated, as would be the case with increased winter precipitation, increased scouring and erosion rates are likely along creek banks.
The diversion dam on the MF Nooksack will likely see an increase of winter flows in the coming decades. Debris flow into the river may increase as well; as more rain on snow events produce landslides and avalanches, contributing rocks, soil, and trees into the river. Elevated river flows and increase sediment and debris poses threats to the functional capacity of the dam and may ultimately reduce its expected lifespan. Included in the risk to the dam is risk to nearby infrastructure, particularly access roads, which have sustained recent damages due to flooding. Removing debris and repairing roads will be costly due to its remote location and difficult access.
Stormwater infrastructure, including detention ponds, filter systems and pipes stand vulnerable to increased precipitation. However, uncertainty in this field is still relatively high. Some models have shown significant disruptions to stormwater facilities, while others have shown modest changes (Rosenberg et al., 2009). Due to this, retrofitting existing structures to accommodate
higher flows appears unnecessary at this time. Taking a precautionary approach with future stormwater projects, and including increased flows in design, would improve adaptive capacity, at a relatively modest cost.
Heavy rain events lead to saturated soil, increasing threat of landslides on unstable slopes. This poses threats to infrastructure on and below these areas, including houses, roads, water/sewer pipes and electrical transmissions. Due to its built environment, most of Bellingham will likely not see an increase in these events. However, landslides may cause power outages and disrupt traffic traveling in/out of city limits.
Bellingham’s main thoroughfare is Interstate 5, which runs north/south along the city. This, and all parallel traffic ways, cross two large drainages: the Skagit River to the south, and the Nooksack River to the north. Both may see increased flood occurrence and intensity, with a potential to disrupt vehicle and rail accessibility, and isolating Bellingham.
Increased phosphorus levels in Lake Whatcom pose threats to water intakes and treatment centers. Large algal blooms have already caused intake clogging and increased the level of treatment needed to ensure water potability. Climate change will likely exacerbate both phosphorus contributions and algal survivability.
Adaptation StrategiesEnsuring sufficient and high quality water supply for both the community and wildlife will be a challenge. Many reservoirs with similar threats have the luxury of increasing water storing capacity to accommodate for high winter/spring flows while also ensuring sufficient water supplies for summer and
16
“Consequences of inadequate stormwater facilities can be severe, but adaptation strategies are available and relatively straightforward if anticipated well in advance.”
-UW Climate Impacts Group

fall. Unfortunately, Lake Whatcom cannot increase lake capacity due to the legal maximum level set by law.
Artificial water storage would enable winter precipitation detainment, which would limit erosion and increase storage capacity. Residential on-site water storage would help alleviate demand for outdoor water use, particularly if water is detained for use in summer. Streamlining permitting and incentivizing rain and grey water reuse would decrease stress on the water system as well as reduce affects of stormwater runoff. The Stormwater Utility provides an avenue to encourage residential infiltration and water detainment.
According to the Washington State Natural Resources Topic Advisory Group (TAG) report, conserved water is likely to be the cheapest source of new water. Continuing and expanding water conservation outreach will be imperative to ensuring sufficient water supply for Bellingham. Per state law, residential water utility customers will be converted to metered water billing by 2017. This is expected to decrease water usage and provide tools for encouraging water conservation. Seattle Public Utilities, for example, has a two season, three-tier billing system, where customers are charged different rates depending on season and on water consumption. Winter carries a flat rate, where all water usage is billed equally; however in the summer customers are charged 16% and 200% more for water used after 24 hundred cubic feet (CCF) and 36 CCF respectively. This is an effective means of discouraging water waste, while limiting impact on low-income households.
Reducing additional external stresses on wildlife will lessen the impacts associated with climate change. Low DO levels pose a large threat to fish, and several fish kill events have been documented
already. According to the Department of Ecology TMDL report (2008), residential development is the largest contributor of phosphorus-laden runoff to the lake. DOE prescribed an 85% reduction in development related runoff in order to achieve acceptable water quality levels. Whatcom County, City of Bellingham and Lake Whatcom Water and Sewer District have formed the Lake Whatcom Management Program, to work towards Lake Whatcom restoration. The Management Program has undertaken many projects thus far, such as stormwater treatment, property acquisition and residential infiltration. Continuing and increasing these efforts will be pivotal in reducing stress to the aquatic ecosystem. The Property Acquisition Program will be particularly helpful as it provides terrestrial habitat and increased natural water filtration.
Limiting potentially unstable slopes is vital to ensuring a minimal influx of new phosphorus and sediment. While logging is considered to degrade water quality significantly less than development (TMDL, 2008), it is important to limit what influences it does have. The Lake Whatcom Landscape Plan, from the Department of Natural Resources (DNR), sets forth more stringent regulations for logging operations on DNR land in the watershed. This plan was developed over several years and was drafted and approved by experts through a public review process. By increasing stream buffers, limiting harvest on potentially unstable slopes and limiting road runoff, the Landscape Plan limits phosphorus loading on Lake Whatcom associated with logging activity. These protections, however, are not required by private logging operations within the watershed, which accounts for a significant proportion of total watershed logging. Approximately 430 acres not protected under the Landscape Plan have been harvested since 2005. Extending protection to these areas would help prevent additional phosphorus and sediment loading into Lake Whatcom.
17
“Conserved water is likely to be the cheapest source of new water.”
-Washington State Water Preparation Adaptation Work Group (PAWG)

With the potential increase in heavy storm events, it will be important to ensure that stormwater treatment facilities are capable of processing the extreme flows. The new climactic “normal” should be taken into account when designing stormwater facilities to ensure that overflow events are minimized and the maximum amount of water is treated before entering Lake Whatcom.
Preventing additional invasive species from entering Lake Whatcom will be imperative due to the economic and environmental threat they pose. Many local governments throughout the country, including the City of Bellingham, have adopted Invasive Species Plans, which outline the risk posed from specific species to specific water bodies. Water bodies with elevated risks have adopted prevention plans to actively keep invasive species from entering a water body. Examples of protection include voluntary vessel inspections, mandatory vessel decontamination, and vessel exclusion. Eliminating all risk from invasive species is not possible; however, by regulating higher risk vessels from entering the lake, the potential for accidental introduction is greatly reduced. If a harmful invasive species, such as a zebra or quagga mussel, were to become established, eradication would be extremely difficult, if not impossible.
Since past climates are no longer indicative of the future, reliance on historical data may prove insufficient in preparing for future natural disasters. Emergency planners should incorporate the most current climactic forecasts into planning. These plans should also provide flexibility, to incorporate the best available science. Absolute certainty should not be a prerequisite for emergency planning; rather recognition that large-scale changes and impacts are possible and should be prepared for.
18

Oceanographic ChangesBellingham enjoys a rich history as a coastal community, with many historical and current uses of its waterfront. With its proximity to the Strait of Juan de Fuca and as the nearest port to British Columbia, Bellingham has a diverse economy dependent upon the ocean. The Fairhaven Port is the southern-most port for the Alaska Marine Highway System and hosts other ships throughout the year; an estimated 200,000 passengers use this terminal annually (Port of Bellingham). Squalicum Harbor, at the northern
end of the city, is home to more than 1,400 pleasure and commercial boats as well as a public park and business center. Several parks and open spaces exist along the Bellingham shoreline, as does residential development, commercial use and industrial use. 140 acres in the heart of the City’s waterfront was acquired in 2005 by the Port of Bellingham. This area, the former Georgia Pacific mill, is expected to be developed during the next thirty years to sustain mixed-use residential
and commercial zoning, with waterfront parks and public access points. Also in close proximity to the ocean is the Post Point Wastewater Treatment Center in Fairhaven.
Bellingham is connected by railroad running north to Vancouver BC and south to Seattle and California. These railways operate both commercial and passenger traffic, with the railway running along the coast almost continuously through Bellingham. These rails are often only a few feet above high tide level. Amtrak operates a station in Fairhaven, adjacent to the Alaska Ferry terminal, with several trains running through daily. With a proposed large coal terminal just north of Bellingham, rail traffic through the city may increase significantly in the coming decade(s).
Because of Bellingham’s current and historic use of the ocean, it stands vulnerable to changes in oceanographic dynamics. The ocean has absorbed roughly 80% of the heating associated with rising greenhouse gases during the past 50 years (IPCC, 2007) and is expected to warm 2.2° F by 2040 (Washington State TAG 3, 2011). Because seawater expands slightly when warmed, this has led to an
increase of global ocean volume. Ocean levels have been rising for the past century, on average, at a rate of 1.0-2.5mm per year (IPCC, 2007). This is expected to increase to 2.0-8.6mm per year depending on models (IPCC, 2007). According to “moderate” local modeling, mean sea level is expected to rise 2-13 inches by 2100. However, if the melting trends of
Greenland and Antarctica from the mid-2000s continue, models show a sea level rise of as much as 50 inches by 2100 (Mote et al., 2008).
The manifestations of eustatic sea level rise will vary spatially; even within Puget Sound, relative sea level rise is expected to range. Southern Puget Sound for example, where earth is slowly sinking, is expected to suffer more severe impacts from sea level rise (Huppert et al., 2009). Further west, on the Olympic Peninsula, land is slowly rising due to isostatic rebound and other tectonic forces, thus helping
19
“Pro-active policy choices have the potential to decrease the economic costs of responding to sea level rise and limiting future impacts.”
-Washington Coastal PAWG

to ameliorate sea level rise. In Bellingham, land rise has been found neutral, with negligible uplifting or sinking (Shipman, 2004).
Oceans also act as enormous sinks for CO2. It is estimated that since the beginning of the industrial revolution, oceans have absorbed over 127 billion metric tons of CO2 (Huppert et al., 2009). This has resulted in a global change in the pH balance of oceans by increasing acidity levels nearly 30%. This change in chemistry will affect ecosystems locally and the world around.
Five global consequences are expected from oceanographic changes: inundation, salt-water incursion to aquifers, flooding, landslide/erosion and acidification of the oceans. All but aquifer disturbances are likely to affect Bellingham over the coming century.
Figure 10SLR
Estimate By the year 2050 By the year 2100
NW Olympic Peninsula
Central & Southern
Coast
Puget Sound
NW Olympic Peninsula
Central & Southern Coast
Puget Sound
Very Low -5" (-12cm) 1" (3cm) 3" (8cm) -9" (24cm) 2" (6cm) 6" (16cm)
Medium 0' (0cm) 5" (12.5cm) 6" (15cm) 2" (4cm) 11" (29cm)14" (34cm)
Very High 14" (35cm) 18" (55cm)22" (55cm) 35" (88cm) 43" (108cm)
50" (128cm)
20
Figure 11. Historic sea level rise. Blue indicates observed and black indicates measured via satellite (IPCC, 2007)

Inundation/FloodingInundation and flooding are perhaps the most obvious examples of impacts from sea level rise, however even within the 11.5 miles of shoreline in the City; affects will vary depending on localized geography, geology, and infrastructure. While inundation and flooding are distinct events, their causes and consequences are very similar, as are their adaptation methods. Because of this, they have been assessed together in this report.
Topography and geology are important to be considered together with regards to sea level rise. Long, gradual rise beaches and wetlands are likely to bear the first impacts from climate change. In Fairhaven, for example, low-lying wetlands and parks have high potential for future inundation (see SLR map, Figure 4*). This is also near the location of the municipal wastewater treatment, Post Point. Sea level changes will likely be experienced through an increase in episodic flooding events with increasing severity.
Figure 12.
It is estimated that every millimeter of sea level rise will result in a loss of 10cm of shoreline (Sverdup & Armbrust, 2008). Thus, even with moderate predictions, a sea level rise of 15 cm will reduce shoreline by 1.5 meters (nearly five feet). This is in part due to higher water level allowing waves to break closer to shore and expend more energy on the beach. In addition, when sea level rises, the effects of waves and currents reach farther up the beach
profile, causing a readjustment of the landward portion of the profile (Sverdup & Armbrust, 2008).
It is important to note that elevation is not the sole determining factor in sea level rise vulnerability; in fact, in certain instances increased elevation may increase susceptibility. Bluffs composed of fine, loose sediment or non-compacted rock will see increased erosion due to higher water levels. During major storm events, SLR will compound the effect of storm surges and will likely increase landslide rates. Due to anticipated increased winter precipitation, bluffs may become saturated and more prone to mass wasting. Figure 12 shows coastal landslide occurrences in Puget over the past century. Strong
** Figure 3 illustrates a “bathtub model” for sea level rise in Bellingham. It is not precise enough to allow for detailed decision making.
21
“Changes in sea level will predominately be experienced through increased episodic flooding as what are now considered extreme events become both less extreme relative to new sea levels and more frequent.”
-Washington Coastal PAWG
Figure 13. Landslide occurrences in Puget Sound. Extremes are closely aligned with strong El Nino events

La Nina seasons (indicative of high winter precipitation) correspond strongly to periods of high landslide occurrence.
Protecting against inundation often involves raising dikes, seawalls or other shoreline armaments. Many times these structures exacerbate erosion because the waves expend their energy over a very narrow portion of the beach. If only a portion of the coastline is protected, wave energy may concentrate at the ends of the seawall, and the wall may collapse. Seawalls can also reflect waves to combine with incoming waves and cause higher, more damaging waves at the seawall or at some other place along the shore (Sverdup & Armbrust, 2008). These structures also prevent any adaptation for the local ecosystem (DNR, 2009). A non-protected shoreline allows for shoreline creep and a gradual colonization within various tidal zones. However, when a physical barrier interrupts this process, intertidal life suffers
a significant loss of habitat. Statewide a 23” rise in sea level is estimated to cause significant detrimental impacts on coastal habitats including 65% loss of estuarine beaches, 61% loss of tidal swamps and 44% loss of tidal flats (Department of Ecology, Ecosystem TAG, 2011).
Marine nearshore habitat is critical for the Puget Sound ecosystem (DNR, 2009) and is a priority habitat per WDFW Priority Habitat and Species Program (WDFW, 2008). Juvenile salmon, rockfish, crab, herring, shellfish, waterfowl and many other species rely on the area defined as “the area comprising the beach, the upland adjacent to it and the intertidal area” (Puget Sound Partnership, 2002). An integral aspect of nearshore environments in the Puget Sound are healthy eelgrass beds. These beds provide shelter, food and rearing habitat to an enormous variety of ocean life. They also provide sediment stabilization (Ecology, 2011). In Bellingham Bay, it is estimated that eelgrass beds have decreased by up to 92% since the late 1800s (DNR, 2009). This is attributed to the hardening and industrialization of the waterfront and highlights the precarious and sensitive state of this critical habitat.
Landslides / Erosion / Sediment TransportCoastlines are in a constant state of change; sometimes this is can only be seen on a centurial or millennial timescale while other events are instantaneous and catastrophic. Sediment transport and subsequent beach formation/erosion is a complex process, one in which consequences of action in one location may only be realized miles up-beach and years later. Beach armoring, for example, reduces immediate erosion of a beach, but may limit sediment transport “downstream” thus reducing beach building capacity and increasing erosion (Sverdup & Armbrust, 2008). It also may limit immediate beach formation, thus causing a future instability at the site of armor. Climate change will influence this dynamic by increasing sea level as well as the potential for higher frequency and intensity of winter storms.
Placing armaments along a shoreline is a common defense against coastal inundation and beach erosion. Unfortunately, these protections such as ripraps, revetments and seawalls typically decrease the volume of sediment available to sustain beaches (Johannessen & MacLennan, 2007). These structures gradually lose sediment and shallow water habitat
22
Historical information demonstrates that major eelgrass losses have occurred along the industrialized shoreline of Bellingham area.
-DNR Bellingham Eelgrass Report
Figure 14

(Sverdup & Armbrust, 2008). Elevated sea levels as well as an increase in winter storms will intensify erosion (Huppert et al., 2009) and likely alter sediment transport dynamics. Coastal landslides help form beaches in both immediate shoreline changes as well as the sediment they provide for beach formation. With higher sea levels and the potential for increased winter precipitation and intensity, landslide occurrence is likely to increase (Huppert et al., 2009). Detailed models have not been created at this time and specific impacts are difficult to forecast, however, a fundamental shift in coastal erosion is possible with future climate scenarios.
Beach armoring structures are permitted through Washington State Department of Fish and Wildlife (WDFW) through a “Hydraulic Project Approval” (HPA) permit and reviewed via the Bellingham Shoreline Master Program (SMP). These structures are regulated as “In-Water Structures” with an objective of no net loss of existing shoreline ecological function for new and retrofitting structures. Specifically “
AcidificationAcidity is measured by the amount of hydrogen (H) and hydroxide (OH) ions in a solution; the more H ions, the more acidic the solution is, and conversely, the more OH ions, the lower the acidity and the more basic a solution is. The amount of H and OH ions is measured on a logarithmic pH scale which
measures the concentration of the hydrogen ions in a solution (pH= -log10(H+)). Thus, a decrease by 1 on the pH scale is equivalent to a tenfold increase in acidity (Doney et al., 2006). In pure water, the pH is 7. Oceans worldwide average between 7.5-8.5, thus they are slightly basic or alkaline. Oceans absorb Carbon dioxide (CO2) through a chemical reaction (CO2 + H20 → H2CO3 → HCO3 + H+ or CO3 + 2H), where it is then able be transported in the
water column by currents, waves and organisms.
Increasing CO2 results in lower pH levels (increase in acidity). This reaction releases carbonate ions (CO32)
that bond with hydrogen, resulting in a reduction of calcium carbonate (CaCO3) that shellfish and other crustaceans need to create their shells. Studies indicate that larval survival of many marine species, including commercial shellfish, is reduced with increased acidity. (Feely et al., 2008)
Oceans act as a large buffer for CO2 emissions worldwide. It is estimated that, worldwide, oceans have absorbed 127 billion metric tons of CO2 since the beginning of the industrial revolution (Feely et al., 2008). This has resulted in a lowering of global oceanic pH by .1, or about a 26% increase in acidity. Locally, upwelled waters off the Pacific Coast have been shown to have increased acidity, in levels higher than anticipated. Acidity levels are expected to continue the increasing trend through the century (Feely et al., 2008). By the end of the century, models point to a pH decrease of .3, or doubling the current acidity levels and creating oceans that are more acidic than any time in the past 20 million years. (Feely et al., 2008)
23
Figure 15
Increased acidity is expected to negatively affect both wild and farmed shellfish, particularly to species that have already been fragmented and are vulnerable. Shellfish facilities have shown low egg development and poor juvenile survival with more acidic water (Feely et al., 2008). Although there are many factors that could contribute to this, it is thought that the low pH has played a significant factor.
Several plankton species may be affected by greater mortality rates. Plankton forms a critical base of the biological food web, supplying food for many commercial and recreational fisheries. Studies have correlated increasing acidity levels with low survival rates for pteropods; a key diet constituent of juvenile salmon, including ESA listed Chinook salmon (Fabry et al., 2008).
Although detailed biological impacts of ocean acidification are still not certain, a recent study finds that sufficient information about ocean acidification exists “to state with
certainty that deleterious impacts on some marine species are unavoidable, and that substantial alteration of marine ecosystems is likely over the next century.” (Fabry et al. 2008)
Increased Harmful Algal BloomsHarmful Algal Blooms (HABs) are “algal blooms that causes negative impacts to other organisms via production of natural toxins, mechanical damage to other organisms, or by other means.” (Center for Disease Control, 2004) These events are also commonly referred to as “red tide”, although not all HABs are red nor do they correspond directly with tidal events. HABs are often associated with large-scale marine mortality events and have been associated with various types of shellfish poisonings. These algal blooms appear to be increasing in frequency both locally and globally, along with increased incidence of human health impacts. Sea surface temperature and upwelling have both been linked with HABs (Patz et al., 2006). Due to their ability to swim for deeper nutrients (opposed to other diatoms and phytoplankton), most marine HAB dinoflagellates are expected to be favored over other phytoplankton with future climate scenarios (Huppert et al., 2009).
The present occurrence of HAB is significantly higher than any time in the past 60 years (Patz et al., 2006). Research is ongoing, but studies in Sequim Bay suggest that paralytic shellfish poisoning toxicity increases when the climate is warm and dry, and decreases when the climate is cold and wet (Horner et al., 1997).
InfrastructureBuildings, roads and structures in close proximity to the shoreline face varying degrees of vulnerability to sea level rise. Sea level rise predictions indicate a slow creep of the ocean landward, ranging from 3”-50” by the end of the century. Infrastructure in closest proximity (both laterally and vertically) face more immediate and severe threats than those situated further from the sea. Figure 4 shows potential
24
“Over the past decade, evidence of a relationship between climate and the magnitude, frequency, and duration of HABs has suggested that the seasons when HABs occur may expand as a result of climate change.”
-UW Climate Impacts Group
Figure 16
inundation along the Bellingham waterfront. It should be noted that this represents sea levels at average high tide, thus areas colored with the corresponding rise in sea level rise are areas in which would be inundated at high tide. As outlined above, it is very likely these areas will be flooded by a storm event before they are slowly inundated by sea level creep. Likewise, even if sea level were to raise only 10”, storm surges would likely periodically flood areas that are higher, potentially preventing the use of a specific area.
Creating an inventory of assets and map along the coastline of Bellingham will better identify structures and facilities that are vulnerable to sea level rise. Included in this inventory should be asset values, lifespan, and adaptive capacity.
Adaptation Strategies
There is no “one size fits all” adaptation approach to sea level rise and other oceanographic changes. Adjusting to the fundamental shoreline change will be necessary to avoid repeated property damages and to reduce threats to human health and safety. There are three general adaptation approaches to sea level rise: accommodation, protection, and retreat. Accommodation allows for existing structures and facilities to remain by adjusting to higher water levels (e.g., a beach house on stilts). The protection approach involves engineering protective structures to prevent rising water levels to inundate a certain area (e.g. bulkheads, ripraps, seawalls, etc). The retreat approach abandons structures that have been or are likely to be inundated by sea level rise, allowing the ocean to slowly colonize the area. Converting a frequently flooded area into a park is an example of retreat.
There is no equation in determining which of these responses is most appropriate to a specific location; each of the approaches above are likely to be used throughout Washington State and Bellingham depending on many factors.
Protection
While a seawall is perhaps the most obvious example of protection, this approach can also include softer approaches, such as created dunes or planting vegetation (EPA, 1990). This approach ensures that, at least in the short term, land usage is not affected by rising sea levels. As outlined above, protection can cause significant environmental harm to tidal areas that are vital to many species, including
commercially harvested salmon and crab. Protecting a shoreline can also lead to difficulties in the future. As sea level continues to rise, a protected area becomes increasingly reliant on artificial structures for safety, and may eventually preclude the possibility of any other adaptive approach. This also increases
vulnerability to a catastrophic event, by essentially creating a city, or portion of a city, below sea level.
25
Figure 17

Accommodation
Accommodating sea level rise involves adapting to a new condition. This can be either with a structural modification, such as elevating a house onto stilts or converting use to one with more adaptive capacity. This approach allows for moderate use of the shoreline with less habitat degradation compared to protection. Due to the characteristics of shorelines in Bellingham (and Washington), this approach is seen less often in comparison to other coastal communities, particularly on the Atlantic Coast. Generally, accommodation is used with other responses to sea level rise, either protect or retreat.
Retreat
Retreating allows for maximum ecological resiliency as well as provides the greatest margin of safety for human life and structures. This is a common approach for frequently flooded rivers and estuaries. Often these areas are turned into a park or into an ecological preserve, thus when they are flooded, damage is limited. A calculated retreat poses several concerns, including private property loss, tax revenue loss, and potential tourism loss.
Accommodating sea level rise by retreat can often involve the use of easements. “Rolling easements” are a special type of easement placed along the shoreline to prevent property owners from holding back the sea but allow any other type of use and activity on the land. As the sea advances, the easement automatically moves or "rolls" landward. Because shoreline stabilization structures cannot be constructed, sediment transport remains undisturbed and wetlands and other important tidal habitat can migrate naturally. Private property owners are able to decide how to best use their property until it is inundated (Titus, 1998). This also provides dry or intertidal land for the public to walk along, preserving lateral public access to the shore (NOAA, 2010).
Developing criteria for determining which of these approaches is most appropriate would be a useful tool for the community and shoreline managers. At a minimum, criteria for evaluation should include anticipated infrastructure lifespan; proximity to shoreline, both vertical and horizontal; use of area, risk tolerance of City and/or owner.
26
“New scientific studies/information on tsunamis and sea level rise should be used to guide shoreline development as it becomes available and accepted as scientifically valid.”
-Bellingham Shoreline Master Plan
Figure 18
Figure 19
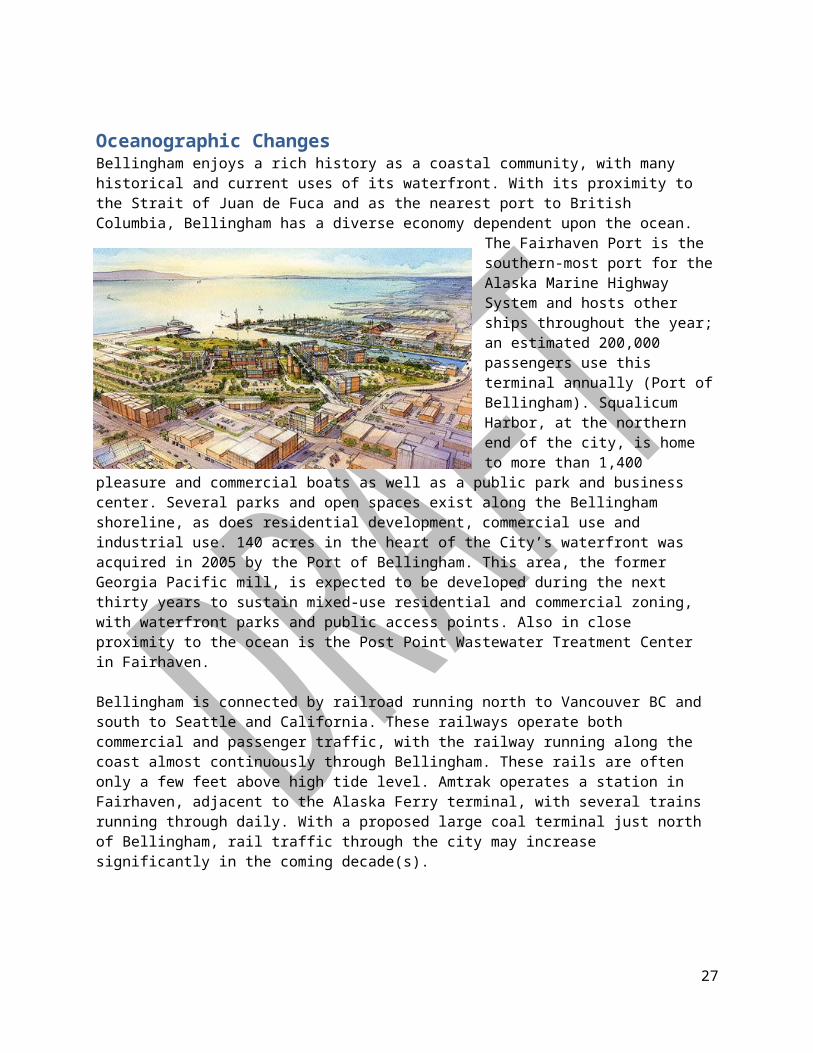
Figure 4 shows the estimated flooded areas from sea level rise. As shown, the areas of highest concern are the former GP site, Squalicum Harbor and the rail tracks running almost the length of the city. The waterfront redevelopment plans to address sea level rise in several ways. The new site will include a soft shoreline, with an emphasis on habitat development. This shoreline will also be elevated, by fill, to withstand the projected sea level rises from the University of Washington Climate Impacts Group report.
Ocean Acidification and Harmful Algal BloomsAdaptation efforts for ocean acidification are limited. Reducing carbon emissions is the only way to slow the amount of C02 entering the ocean. Like the atmosphere, oceans operate on a global scale, so even with Bellingham’s emissions reduction the acidification of the ocean will likely persist. Reducing other external pressures on sea life will increase resilience to elevated acidity levels. Protecting existing habitat will be critical to maximizing shellfish and other species survival. Ensuring strict compliance with ESA and CWA regulations will help protect fragile populations, as will continuing restoration efforts. Ensuring that the “no net ecological loss” aspect of the Shoreline Master Program is adhered to will also help protect essential habitat.
Reducing nutrient inflow to Bellingham Bay would help reduce excessive algal growth. The statewide phosphorus fertilizer ban (HB 1489), beginning in 2013, is expected to decrease the amount of phosphorus and other nutrient laden stormwater runoff entering Puget Sound and Bellingham Bay. Establishing education programs to promote community wide pollution reductions may also help abate the nutrient loading occurring.
Further research is necessary to accurately assess the risk of climate change and HABs. Monitoring and reacting to HABs will continue to be vital in ensuring public safety. If a more definitive link between climate change and HABs is established, further adaptation measures should be developed.
Additional MeasuresEducation is vital for community members, particularly waterfront property owners, to understand risks associated with climate change a sea level rise. Creating a real estate disclosure policy where landowners and investors are informed of risk during purchasing would help educate those at highest vulnerability. Continuing a community dialogue about new climate science and potential vulnerabilities will foster public participation in climate adaptation.
More precise modeling of local sea level rise is essential to future decision making. Local sea level rise is very complex and nuanced. Figure 3, illustrating potential inundation in Bellingham, is not intended for decision-making. Funding a local sea level rise study would provide reliable and valuable information for shoreline managers.
27
Bernie et al., 2010

Utilizing eelgrass mapping and monitoring would enable more accurate predictions on effects of these crucial areas. Developing a more thorough understanding of affects from on-shore activities will help guide future decisions. Research is on going for eelgrass transplantation and other restoration efforts. Results from research should be monitored and evaluated for use locally.
Sea level rise will manifest itself first in acute storm impacts. It is therefore important to collaborate with emergency responders and planners to ensure there are adequate planning and sufficient capability to address this issue. Working with property owners to educate them on the hazards of sea level rise as well as developing a response plan in case of inundation will better prepare individuals and communities for potential impacts.
Figure 20. Shoreline Response to Climate Change (adapted from Shipman 2009)Geomorphic Settings in Puget Sound
Type Description Response Impact
Rocky Bedrock, resistant to erosion Minimal erosion or change
Limited erosion and inundation
Bluff Erodible, often elevated
Accelerated toe erosion, mass-
wasting, accelerated bluff
retreat
Landslides and erosion,
modified bluff habitats
BeachLow lying spits and barriers. Dunes. Often back-barrier
wetlands.
Erosion, overwash, migration.
Breaching, shifting tidal inlets
Erosion, flooding, storm damage, altered
backshore habitat
Estuaries and Lagoons Small, Sheltered estuaries and lagoons. Stream mouths.
Tidal prism change, altered inlet
dynamics, marsh erosion/accretion
Marsh/habitat loss, shoreline
erosion
Delta Broad, low elevation alluvial features at river mouths.
Sedimentation patterns change, altered riverine
influences, marsh erosion/accretion,
inundation
Increase flood vulnerability,
damage to dikes and levees,
vegetation shifts, difficult drainage
ArtificialEngineered, fill, hardened.
Usually low elevation urban/industrial/residential
Limited change Storm damage, flooding
28

Energy
Energy supply and demand in the Pacific Northwest is expected to change in the coming century. Currently, hydropower supplies over 70% of the energy used in Washington (Hamlet et al., 2009). Puget
Sound Energy, Bellingham’s electrical utility provider, relies on hydropower for approximately 36% of its energy supply (Puget Sound Energy, 2009). Climate change, however, is expected to change hydropower production in the Pacific Northwest. Due to potential streamflow regime changes, power production on the Columbia River is forecasted to shift in the coming decades. Models suggest by 2020, winter generation will increase 0.5-4% and summer generation will decrease 9-11% (Hamlet, et al., 2009), with an annual decrease of 1-4%. These models do not
take into consideration possible loss of production to other environmental needs. Salmon, for instance, may require altered flow releases due to historic and future stressors.
Energy derived from fossil fuels will face changes as well. As air temperature increases, transmission line sag increases, decreasing the amount of power that can securely be transported through lines (Department of Energy, 2008). Thermoelectric power plants become less efficient with warmer ambient air temperature (Department of Energy, 2008). Additionally, thermoelectric power plants (mostly consisting of fossil fuel combustion) account for 49% of total water withdrawals in the United States (USGS, 2011). Demand for water from agriculture, residential, commercial, industrial, mining and environmental sectors will increase in the coming decades, limiting withdrawal abilities of power plants (US Climate Change Science Program, 2008).
Furthermore, as emission reduction efforts continue, focus will likely continue on electrical generation plants, especially those derived from fossil fuels. Power generation from these plants may reduce if emission standards cannot be met. Other legislation may alter electrical supply as well. Initiative 937, for example, passed by Washington voters in 2007, requires energy utilities to obtain 15% of their power from renewable sources.
The demand for energy will increase in the coming decades. Washington has had the seventh fastest population growth rate in the nation over the past decade (2000-2010) and population is expected to increase by 2.1 million people by 2030 (WSDOT, 2011). Cooling energy demand in the northwest is expected to increase 240% by 2020 and as much as 400% by 2040 (Hamlet et al., 2009). Although winters are forecasted to be warmer, heating energy demand is still expected to increase 22% by 2020 and 35% by 2040 (Hamlet et al., 2009). These models are simulating the Pacific Northwest, not solely western Washington. Energy demand in Bellingham will likely differ from these predictions, particularly in summer cooling demand. However, since Bellingham relies on distant energy generation, it is imperative to assess both supply and demand from a regional perspective.
29
“We are acutely aware that climate change could have profound effects on hydro operations and fish health. In fact, climate change is the overarching issue for the utility industry. It hasthe potential to change everything, including the price of electricity, the timing of hydropower generation, the resources utilities acquire and the way transmission operates because of the rise of variable resources.”
-Bonneville Power Administration
“The demand for water for thermoelectric generation will increasingly compete with demands from other sectors of the economy such as agriculture, residential, commercial, industrial, mining, and in-stream use.”
-US Climate Change Science Program, 2008

Creating greater energy autonomy would help distance Bellingham from regional and national fluctuations in energy production and prices. Achieving this will require a long-term approach to energy conservation and efficiency, as well as local renewable energy development.
It should be noted that this report has not taken into account energy demands from vehicles. While this sector represents a very large portion of the total energy usage of Bellingham, as of now, it relies almost exclusively on oil. Staff found little research assessing direct climate change affects on production and consumption of oil. Reducing emissions from vehicles will be vital in controlling GHG, but is not within the scope of this aspect of climate adaptation planning. The Energy Resource Scarcity/Peak Oil (ERSPO) Task Force outlined this issue with detail in 2009 including policy recommendations. These recommendations will be considered in future renditions of adaptation planning.
30

Figure 21. Mechanisms of Climate Impacts on Various Energy Supplies in the U.S.
Energy Impact Supplies Climate Impact Mechanisms
Fossil Fuels (86%)
Coal (22%)
Cooling water quantity and quality (T), cooling efficiency (T, W, H), erosion in surface mining
Percentages shown are of total domestic
consumption; (T = water/air
temperature, W = wind, H = humidity, P = precipitation, and E = extreme weather
events)
Natural Gas (23%)
Cooling water quantity and quality (T), cooling efficiency
(T,W,H), disruptions of off-shore extraction (E)
Petroleum (40%)
Cooling water quantity and quality, cooling efficiency (T, W,
H) disruptions of off-shore extraction and transport (E)
Liquefied Natural Gas (1%)
Disruptions of Import Operations (E)
Nuclear (8%)
Cooling water quantity and quality (T), cooling efficiency (T,
W, H)
Renewables (6%)
Hydropower
Water availability and quality, temperature-related stresses, operational modification from
extreme weather (floods/droughts), (T,E)
Biomass
Wood and forest products
Possible short-term impacts from timber kills or long term impacts from timber kills and
changes in tree growth rates (T, P, H, E, carbon dioxide levels)
Waste (municipal solid waste,
landfill gas, etc.)n/a
Agricultural resources
(included derived biofuels)
Changes in food crop residue and dedicated energy crop
growth rates (T, P, E, H, carbon dioxide levels)
Wind
Wind resource changes (intensity and duration), damage from
extreme weather
SolarInsolation changes (clouds),
damage from extreme weather
GeothermalCooling efficiency for air-cooled
geothermal (T)
31

Energy Conservation/EfficiencyEnergy conservation and increased energy efficiency are methods of both climate change mitigation as well as adaptation. Although Phase III is focused on adaptation strategies (rather than mitigation), the
two are intricately related in the energy sector. Regardless of avenue, energy use reduction reduces dependency on external energy supplies. Phase I and II of the Climate Action Plan address a multitude of energy use reduction options, which have reduced carbon emissions community wide.
Energy use reduction can take many forms, ranging from changing an incandescent to compact fluorescent light bulb, to converting an entire city to district heating, to implementing smart grid technology. Likely, both small and large-scale efforts will be necessary in the coming decades. City staff are continuing work from Phase I and II and are also implementing and exploring additional measures, such as district heating.
Energy Production/DevelopmentDeveloping local renewable energy sources will help buffer Bellingham against fluctuations in regional markets, reduce carbon emissions and help create local sustainable jobs. According to the National Renewable Energy Laboratory (NREL), future energy demands will likely be met with a multitude of sources, instead of the current dependence on relatively few.
Efforts to produce local renewable energy are already underway and are currently being evaluated by City staff. A hydroelectric project utilizing existing infrastructure from the Georgia Pacific intake is undergoing feasibility studies. This project, if implemented, will use diverted water from Lake Whatcom to spin turbines and generate electricity. Due to the projected increase of stream discharge in the
winter, an additional drainage from Lake Whatcom may benefit habitat in Whatcom Creek, by allowing for lower streamflows in the winter. Withdrawal may not be possible, however, during droughts or high water use.
A renewable energy assessment report is out of the scope of this document; however, it is an area that merits future discussion and consideration. Geographically, Bellingham has several potential renewable energy sources nearby. Tidal, geothermal, wind, and solar energy production are all currently being explored and in many cases implemented in northwest Washington (Snohomish PUD, 2011).
InfrastructureAlthough the City of Bellingham is not responsible for energy transmission facilities and infrastructure, the community is dependent on these systems functioning properly for nearly every facet of everyday life. It is therefore important to assess vulnerabilities to these facilities to help ensure a prepared community. Threats to electrical infrastructure will likely be evidenced through increased heat and extreme weather. Climate models are not accurate enough to project precise changes in weather extremes, but research suggest that more intense rain and windstorms are possible with an altered climate (McGuire et al., 2009). These pose threats to power and other utility transmission due to their ability to down trees, flood waterways, reduce stability of slopes and knock over transmission towers. While specific site vulnerability is out of the scope of this document, actively preparing for disruptions in power and other utility supply would help foster community resilience. Working with Puget Sound Energy and emergency planners/responders would increase awareness and preparedness for possible future events.
32
“Energy efficiency offers a vast, low-cost energy resource for the U.S. economy…but only with an innovative approach to unlock it”
-McKinsie Report, 2009
“Climate change presents a daunting challenge for regional power planners.”
-NW Energy Council

References
100th Meridian Initiative. Zap the Zebra. US Fish and Wildlife, 2010. Print.
Bellingham's Water System. Bellingham: City of Bellingham. Lake Whatcom Map Brochure. City of Bellingham GIS, 2002. Web. Mar. 2011.
Bernie, D., J. Lowe, T. Tyrrell, and O. Legge. Influence of Mitigation Policy on Ocean Acidification. Rep. American Geophsyical Union, 2010. Print
Bonneville Power Administration. 2010 Annual Report. Rep. Portland: Bonneville Power Administration, 2010. Print.
Breyer, Betsy, Heejung Chang, and Hossein Parandvash. "Modeling Spatiotemporal Nonstationarity in Urban Water Demand Under Climate Change." Lecture
Bull, Stanely R., Daniel E. Bilello, James Eckmann, Michael J. Sale, and David K. Schmalzer. Effects of Climate Change on Energy Production and Distribution in the United States. Rep. 4.5th ed. US Climate Change Science Program, 2008.
CCSP, 2007: Effects of Climate Change on Energy Production and Use in the United States. A Report by the U.S. Climate Change Science Program and the subcommittee on Global Change Research. [Thomas J. Wilbanks, Vatsal Bhatt, Daniel E. Bilello, Stanley R. Bull, James Ekmann, William C. Horak, Y. Joe Huang, Mark D. Levine, Michael J. Sale, David K. Schmalzer, and Michael J. Scott (eds.)]. Department of Energy, Office of Biological & Environmental Research, Washington, DC., USA, 160 pp.
City of Bellingham. Water Use Efficiency Program. Rep. Bellingham: City of Bellingham, 2008. Print.
"Climate Impacts Group." Center for Science in the Earth System. Web. May 2011. <http://cses.washington.edu/cig/pnwc/deadend_rivertypes.shtml>.
Davis, Timothy W., Dianna L. Berry, Gregory L. Boyer, and Christopher J. Gobler. The Effects of Temperature and Nutrients on the Growth and Dynamics of Toxic and Non-toxic Strains Microsystis during Cyanobacteria Blooms. Rep. Elsevier, 2009. Print.
"Decision and Information Sciences - Climate Change Impacts on the Electric Power System in the Western United States." Decision and Information Sciences | Develop. Apply. Transfer. US Department of Energy. Web. Aug. 2011. <http://www.dis.anl.gov/news/WECC_ClimateChange.html>.
Doney SC (2006) The dangers of ocean acidification. Science America (March) 294: 58-65
Donnell, Carrie B. "Quantifying the Glacial Meltwater Component of Steamflow in the Middle Fork of the Nooksack River, Whatcom County, WA, Using a Distributed Hydrology Model." Thesis. Western Washington University, 2007. Print.
"Electric Supply." Puget Sound Energy. Washington Department of Commerce, 2009. Web. July 2011.
33

Elsner, Marketa M., Lan Cuo, Nathalie Voisin, Jeffery S. Deems, Alan F. Hamlet, Julie A. Vano, Kristian EB Mickelson, Se-Yuen Lee, and Dennis P. Lattenmaier. Implications of 21st Century Climate Change for the Hydrology of Washington State. Rep. Seattle: University of Washington, 2009. Print.
Energy Resource Scarcity/Peak Oil Task Force Report. Rep. Bellingham: City of Bellingham/Whatcom County, 2009. Print
Fabry, V. J., Seibel, B. A., Feely, R. A., and Orr, J. C. (2008) Impacts of ocean acidification on marine fauna and ecosystem processes. – ICES Journal of Marine Science, 65: 414–432.
Feely RA, Sabine CL, Hernandez-Ayon JM, Ianson D, Hales B (2008) Evidence for upwelling of corrosive ‘acidified’ water onto the continental shelf. Science Express (May): 1-4
Gaeckle, Jeffrey. Eelgrass (Zostera Marina L.) Abundance and Depth Distribution along the City of Bellingham Waterfront Whatcom County, Washington. Rep. Washington State Department of Natural Resources, 2009. Print
Hamlet, Alan F., P.W. Mote, M. Clark, and D.P. Lettenmaier, 2005: Effects of temperature and precipitation variability on snowpack trends in the western United States. Journal of Climate, 18(21), 4545-4561.
Hamlet, Alan F., Se-Yuen Lee, Kristian EB Mickelson, and Marketa M. Elsner. Effects of Projected Climate Change on Energy Supply and Demand in the Pacific Northwest and Washington State. Rep. Seattle: University of Washington, 2009. Print.
Harmful Algal Blooms (HABs): About | CDC HSB." Centers for Disease Control and Prevention. US Center for Disease Control, Mar. 2004. Web. June 2011.
Holland, Jennifer S. "Marine Miniatures - Acid Threat." National Geographic Magazine. Web. June 2011
Horner RA, Garrison DL, Plumley FG (1997) Harmful algal blooms and Red Tide problems on the U.S. West Coast. Limnol and Ocean 42: 1076-1088
Huppert, Daniel D., Amber Moore, and Karen Dyson. Impacts of Climate Change on the Coasts of Washington State. Rep. Seattle: University of Washington, 2009. Print.
Granade, Hannah Choi, Jon Creyts, Anton Derkach, Phillip Farese, Scott Nyquist, and Ken Ostrowski. Unlocking Energy Efficiency in the U.S. Economy. Rep. McKinsey &, 2009. Print
Intergovernmental Panel on Climate Change (IPCC) (2007) Climate change 2007: Impacts, Adaptation and Vulnerability. Contribution of Working Group II to the Fourth Assessment Report of the Intergovernmental Panel on Climate Change, Parry ML, Canziani OF, Palutikof LP, van der Linden PJ, Hanson CE (eds), Cambridge University Press, Cambridge 36.
Intergovernmental Panel on Climate Change (IPCC), J. T. Houghton, L. G. Meira Fihlo, B. A. Callander, N. Harris, A. Kattenberg and K. Maskell (eds.). 1996a. Climate Change 1995: The Science of Climate Change: Contribution of Working Group I to the Second Assessment Report of the Intergovernmental Panel on Climate Change. New York: Cambridge University Press.
34

Intergovernmental Panel on Climate Change (IPCC). Strategies for Adaptation to Sea Level Rise. Rep. Netherlands: Coastal Management Subgroup, IPCC, 1990. Print.
"Invasive Species Council - Why Should You Care?" Washington Invasive Species Council. Washington Recreation and Conservation Office, 2009. Web. 2011.
Johannessen J, MacLennan A (2007) Beaches and bluffs of Puget Sound and the northern straits. Puget Sound Nearshore Partnership, 1-34
Lake Whatcom Aquatic Invasive Species Plan. Rep. Bellingham: City of Bellingham, 2011.
Langston, Jennifer. Northwest Ocean Acidification - The Hidden Costs of Fossil Fuel Pollution. Rep. Seattle: Sightline Institute, 2011. Print.
Matthews, Robin, Michael Hilles, and Joan Vandersypen. Lake Whatcom Monitoring Report 2009/2010 Final Report. Rep. Bellingham: Huxley College of the Environment, 2011. Print.
Mote, Phillip, Alexander Petersen, Spencer Reeder, Hugh Shipman, and Lara Whitely Binder. Sea Level Rise in the Coastal Waters of Washington State. Rep. Seattle: University of Washington Climate Impacts Group, 2008. Print.
Mote, Phillip., 2006: Climate-driven variability and trends in mountain snowpack in western North America. Journal of Climate, 19(23), 6209-6220.
National Renewable Energy Laboratory. Renewable Energy Data Book. Rep. Washington DC: US Department of Energy, 2010. Print
Northwest Power and Conservation Council. Conservation and Electric Power Plan. Rep. Sixth ed. 2010. Print.
Patz JA, Olson SH, Gray AL (2006) Climate change, oceans, and human health. Ocean 19: 52-59
Payne, J.T., A.W. Wood, A.F. Hamlet, R.N. Palmer, and D.P. Lettenmaier, 2004: Mitigating the effects of climate change on the water resources of the Columbia River basin. Climatic Change, 62(1-3), 233-256.
Pickett, Paul, and Steve Hood. Lake Whatcom Watershed Total Phosphorus and Bacteria Total Maximum Daily Loads. Rep. Vol. 1. Olympia: Washington State Department of Ecology, 2008. Print. 08-03-024.
Power Supply | Snohomish County PUD." Snohomish County PUD. Web. June 2011. <http://www.snopud.com/PowerSupply.ashx?p=1105>.
Preparation and Adaptation Working Groups. Preparing for the Impacts of Climate Change in Washington. Rep. Olympia: Washington State Department of Ecology, 2007. Print.
"Puget Sound Shorelines: Species - Eelgrass." Washington State Department of Ecology | Home Page | ECY WA DOE. Web. 26 July 2011. <http://www.ecy.wa.gov/programs/sea/pugetsound/species/eelgrass.html>.
35

Puget Sound Water Quality Action Team. Puget Sound's Nearshore Habitat. Rep. Seattle: Puget Sound Partnership, 2002. Print.
Rosenberg, Eric A., Patrick W. Keys, Derek B. Booth, David Hartley, Jeff Burkey, Anne C. Steinemann, and Dennis P. Lettenmaier. Precipitation Extremes and the Impacts of Climate Change on Stormwater Infrastructure in Washington State. Rep. Seattle: University of Washington Climate Impacts Group, 2009. Print.
Shipman, Hugh. Coastal Bluffs and Sea Cliffs on Puget Sound, Washington. Rep. 1693 ed. Denver: US Geological Survey, 2004. Print.
Shoreline Management: Utilize Erosion Control Easements." NOAA Office of Ocean and Coastal Resource Management. US Environmental Protection Agency, 6 Apr. 2010. Web. June 2011.
Snover, A.K., L. Whitely Binder, J. Lopez, Willmott, J. Kay, D. Howell, and J. Simmonds. 2007. Preparing for Climate Change: A guidebook for Local, Regional, and State Governments. In association with and published by ICLEI - Local Governments for Sustainability, Oakland, CA.
Stewart, I.T., D.R. Cayan, and M.D. Dettinger, 2004: Changes in snowmelt runoff timing in western North America under a ‘business as usual’ climate change scenario. Climatic Change, 62(1-3), 217-232
Sverdup, Keith A., and Virginia Armbrust. "12.3." An Introduction to the World's Oceans. 9th ed. New York: McGraw Hill, 2008. 307-16. Print
"Thermoelectric-power Water Use, the USGS Water Science School." Thermoelectric Power Water Use. United States Geological Survey, 6 Apr. 2011. Web. July-Aug. 2011. <http://ga.water.usgs.gov/edu/wupt.html>.
Titus, James G. Rising Seas, Coastal Erosion, and the Takings Clause; How to Save Wetlands and Beaches Without Hurting Property Owners. Rep. Vol. 57. Maryland Law Review, 1998. Print.
US Army Corps of Engineers, California Tahoe Conservancy. Sacramento. Lake Tahoe Region Aquatic Invasive Species Management Plan. September, 2009. Print.
US Fish and Wildlife Service. Western Quagga Mussels. Rep. US Fish and Wildlife, 2007. Print
Washington State Department of Natural Resources, and Angie Fredrickson. Preparing For Climate Change Impacts to State-Owned Aquatic Lands, a Climate Change Adaptation Strategy for the Washington State Department of Natural Resources. Rep. Olympia, 2009. Print.
WDFW. "Priority Habitats and Species (PHS)." Priority Habitat and Species (PHS). Washington Department of Fish & Wildlife, 2008. Web. Aug.-Sept. 2011. <http://wdfw.wa.gov/conservation/phs/>.
Whatcom Salmon Recovery. Whatcom Salmon Recovery. Facts About Kokanee. Whatcom County Water Resources, Dec. 2003. Web. Mar. 2011.
36

Whitely Binder, Lara C., Jennifer Krencick Barcelos, Derek B. Booth, Meriel Darzen, Marketa McGuire Elsner, Richard Fenske, Thomas F. Graham, Alan F. Hamlet, John Hodges-Howell, Daniel D. Huppert, J. Elizabeth Jackson, Catherine Karr, Ptrick W. Keys, Jeremy S. Littell, Nathan Mantua, Jennifer Marlow, Don McKenzie, Michael Robinson-Dorn, Eric A. Rosenberg, Claudio O. Stockle, and Julie A. Vano. Preparing for Climate Change in Washington State. Rep. Seattle: University of Washington Climate Impacts Group, 2009. Print.
"WSDOT - Population Growth." Welcome to the Washington State Department of Transportation. 2011. Web. 01 July 2011.
37

Appendix
38

Sea Level Rise Vulnerability Analysis ToolPurpose:The City plans, designs and builds projects with lifespans long enough to be impacted by future sea levels. Therefore, it is important to consider sea level rise (SLR) on projects that have potential to be adversely affected by elevated sea levels.
This document is intended to provide guidance for incorporating SLR into planning and decision making for City projects. Providing a framework for analysis ensures projects account for the current and future risks posed by sea level rise, and incorporate measures where necessary to increase resiliency to these risks. The projections in this document are based on the “best available science”. Climate change science is dynamic, thus this document will be updated as necessary to ensure the most accurate and up-to-date science is being utilized.
While this document focuses on SLR, additional changes are expected, including a temperature rise of 3-10 degrees F by the end of the century, as well as a potential increase of precipitation. Projects sensitive to temperature and/or precipitation should account for these changes in project design.
Understanding Sea Level Rise:Global sea level rise is a result of additional freshwater contributed to the oceans via melting glaciers and ice caps, as well as by the thermal expansion of water due to global warming. The rate of warming directly affects the quantity of water added as well as the degree of thermal expansion. The largest driver of this warming is anthropogenic greenhouse gas (GHG) emissions. The 2007 IPCC 4 th Assessment Report projected that global sea levels will rise 7”- 23” by 2100. This estimate did not include the accelerated rate at which ice sheets in Greenland, as data was insufficient at time of analysis.
Local sea level rise is largely determined by: the amount global sea level rise, land subsistence/uplift, which can exacerbate or moderate rising sea levels, and local wind patterns, which can push water or lower higher depending on prevalent wind patterns. These and additional factors were incorporated into the 2009 University of Washington Climate Impacts Group’s Climate Change Impact Assessment (WCCIA), a Washington State Legislative mandate, to evaluate the local impacts of climate change. The “high” values for this report do include accelerated ice loss from Greenland, as confidence has grown in this phenomenon as well as to capture the greatest range realistically possible. The following chart outlining projected sea level rise for the Puget Sound.
High Medium Low
2050 22” 6” 3”
2100 50” 13” 6”
Although these numbers are not Bellingham-specific estimates, a significant difference between the two locations is not expected.
The WCCIA report did not include probabilities or confidence intervals with these estimates as there are still sources of uncertainty regarding future global GHG emissions as well as contributions of freshwater from ice caps.
39

Potential Impacts from SLRSite specific impacts in Bellingham will vary depending primarily on magnitude of SLR, local geology, and shoreline usage. Potential impacts can include, but are not limited to:
Temporary or permanent inundation Storm surge damage to public/private property Loss of wetlands and nearshore habitat Salt water intrusion into stormwater systems Decreased efficacy of gravity-fed waste water and sewage systems in low-lying areas Increased infrastructure maintenance costs
General Adaptation Principles Adaptation refers to actions which reduce deleterious effects of, or increase resiliency to climate change.
Evaluating potential risk (potential for loss or harm) from SLR to a project Evaluating how likely the project is to be exposed to those risks Determining what the consequences of the risks would be Assessing whether there are options available to reduce the risk, impact or harm
General Adaptation Approaches Protect – Build protective barriers such as dikes or seawalls Retreat – Abandon or do not develop areas threatened by sea level rise Accommodate - Modify or retrofit a facility to enable functionality despite sea level rise
Sea Level Rise Vulnerability Analysis
Vulnerability Index = (Shoreline Proximity X Elevation) + (Project Lifespan X Cost)
An Excel spreadsheet has been created to assist project managers with determining risk posed to projects by rising sea levels. This tool is intended to expedite the process of assessing SLR, by identifying only those projects will be influenced. The analysis is based on the following:
Linear proximity to shorelineProximity to shoreline is significant for several reasons. A project with extreme proximity to the shoreline (1-10ft) may face impacts, even if it is at an elevation higher than projected SLR (e.g., atop a coastal bluff). However, a project a significant distance from the shore (100+ ft) faces significantly less threat, even at a very low elevation (<10 ft).
ElevationElevation plays an important role in determining vulnerability. Low lying projects face the highest threat, with higher elevations facing lower risk. Again, elevation and proximity are important to be considered together, as they may exacerbate or ameliorate vulnerability.
40
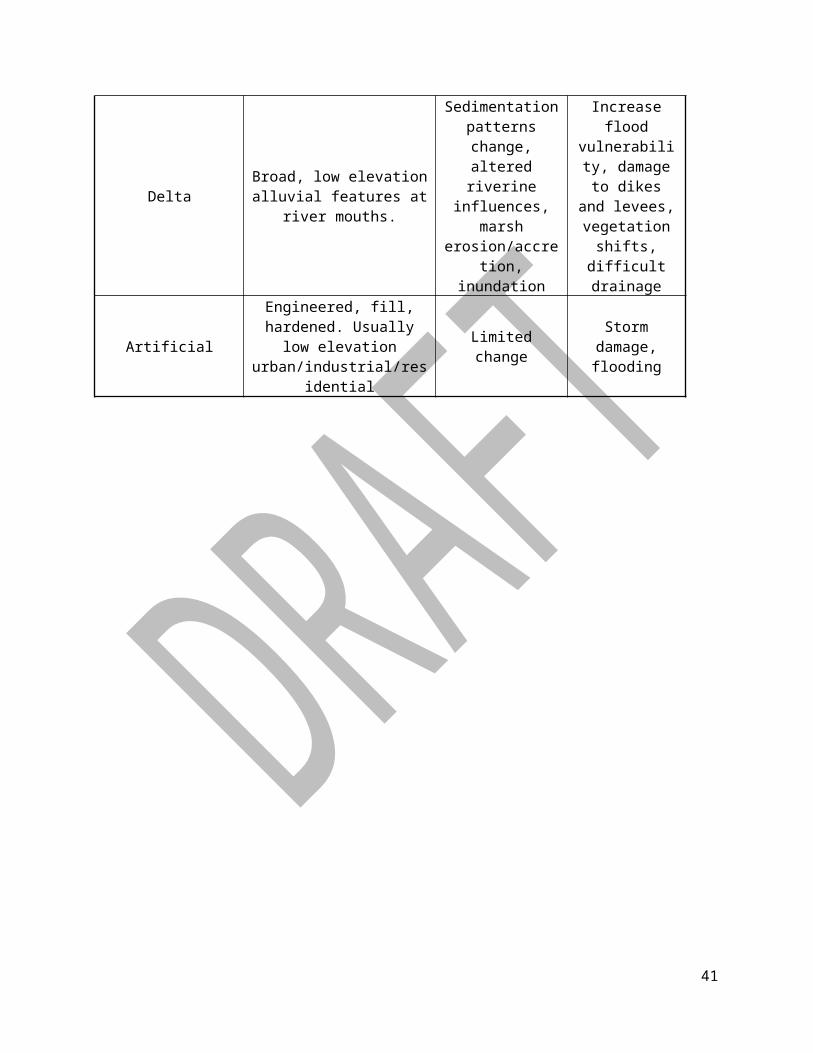
Project LifespanProjects with longer lifespans face greater risks from greater magnitude SLR, as well as greater risk from extreme high tides and storm events. Shorter-term projects have more capacity to be retrofitted or redesigned as they will be replaced/removed in less amount of time
Project CostProjects with significant cost are given more weight as the potential loss is greater.
Additional analysis is triggered if the vulnerability index is a score of 40 or greater. A triggering of this review does not necessitate specific adaptation action, rather it is intended to ensure potential harm from sea level rise has been identified in projects, as well as potential actions that could mitigate loss or harm.
Additional Resources:http://cses.washington.edu/db/pdf/moteetalSLR579.pdfhttp://cses.washington.edu/cig/res/ia/waccia.shtmlhttp://www.ipcc.ch/publications_and_data/publications_and_data_reports.shtml
41

Acronyms
SLR – Sea level riseSWE – Snow water equivalentDOE – Washington State Department of EcologyHAB – Harmful algal bloomWDFW – Washington State Department of Fish and Wildlife
42