ben graham and the growth investor
TRANSCRIPT

1
“Other Voices,” Barron’s, Sept. 12, 2005

HEWITT HEISERMAN JR. www.EarningsPower.com [email protected] Earnings Power Chart and Earnings Power Staircase are property of Hewitt Heiserman Jr. All rights reserved. Copyright 2015
Ben Graham and the Growth Investor

3 3
Microsoft in the 1990s: A Growth Investor’s Dream

4 4
Benefits of Growth Investing
Asymmetric reward-risk. Worst-case, investment goes to zero. Best-case, unlimited upside. During 1990s, a hypothetical $10K investment grew to almost $1 million
Defer capital gains taxes—your principal compounds faster
Save money on commissions, bid-ask slippage costs
Trade less, which improves investing results
No “exquisite timing” required; you can build a position over many years
5 5
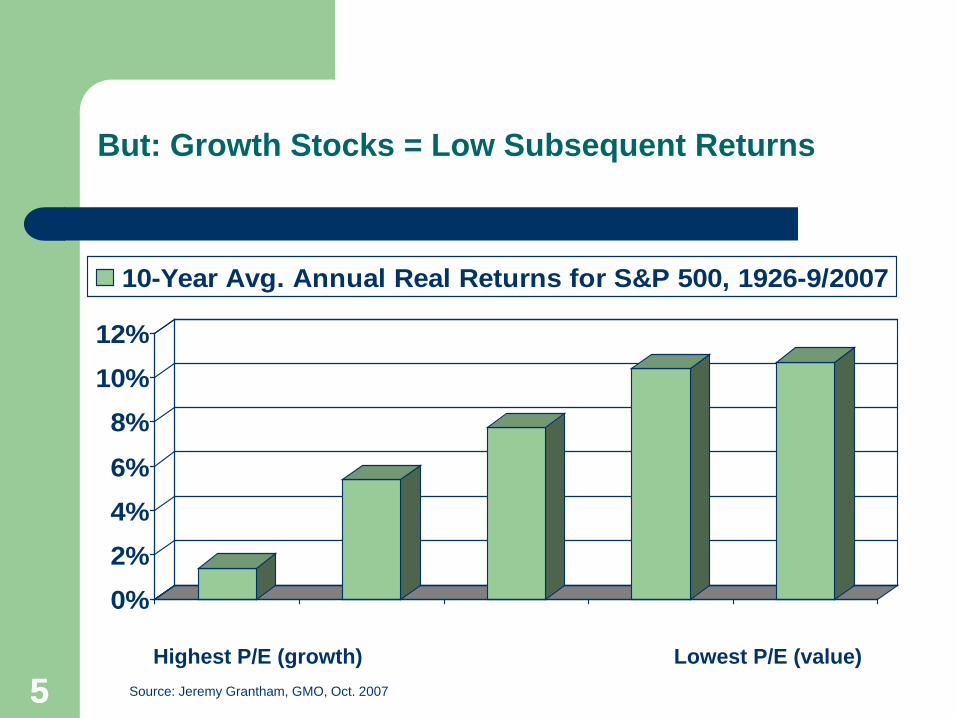
But: Growth Stocks = Low Subsequent Returns
0%2%4%6%
8%10%12%
10-Year Avg. Annual Real Returns for S&P 500, 1926-9/2007
Highest P/E (growth) Lowest P/E (value) Source: Jeremy Grantham, GMO, Oct. 2007

6 6
Also, Value Beats Growth (EBIT/TEV)
Source: Wesley R. Gray, “Never Buy Expensive Stocks. Period.,” http://www.alphaarchitect.com/blog/2014/07/01/never-buy-expensive-stocks-period/#.VKBrHUAKA

7 7
The Growth Trap – Three (3) Obstacles:
1. Poor earnings quality
GAAP income statement has four (4) structural limitations. So, just because a company is profitable in the accounting sense of the word does not mean that it has authentic earnings power.
2. Competitive advantage wanes
Successful companies attract imitators—good for consumers, bad for owners.
3. Premium to intrinsic value
We predict by extrapolation, so growth stocks often get pushed beyond intrinsic value (fair worth).

8 8
Obstacle #1: Poor Earnings Quality
To create comparability, all U.S. companies follow generally accepted accounting principals (GAAP)
GAAP is Robert’s Rules of Order for corporate America When you open an annual report, 10-K or 10-Q and look at
financials statements, that’s GAAP Many investors take GAAP net income at face value; they think
net income and EPS is a “hard” number…

…like height Fenway’s Green Monster (37’)

10 10
Wrong! GAAP P&L’s Four (4) Structural Limitations
1. Omits investment in fixed capital , so when capex is greater than depreciation, the net cash drain is excluded
2. Omits investment in working capital, so when receivables and inventory grow faster than payables and accrued expenses, the net cash drain is excluded.
3. Intangible growth-producing initiatives like R&D, promo/advertising, employee education, etc. are expenses (i.e., not investments) even though the benefits will last for several accounting periods.
4. Stockholders’ equity is free even though owners have an opportunity cost.

11 11
How Fix? In the 1990s Two Alternate P&L’s Emerged
Free Cash Flow Economic Value Added Adjustments: #1. Expenses investment in
fixed capital; #2. Expenses investment in working capital;
#3. Capitalize intangibles and then depreciate over useful life; #4. Stockholders’ equity is an expense
Profit type: Free cash flow Economic Value Added
Goal: Self-fund? A company does so when it produces more cash from ongoing operations than it consumes.
Create value? A company does so when it produces a return on capital that is greater than its cost.
Personality: Commercial banker Venture capitalist
Limitations: Intangibles are expensed; stockholders’ equity is free
Investment in fixed, working capital are expensed
12 12
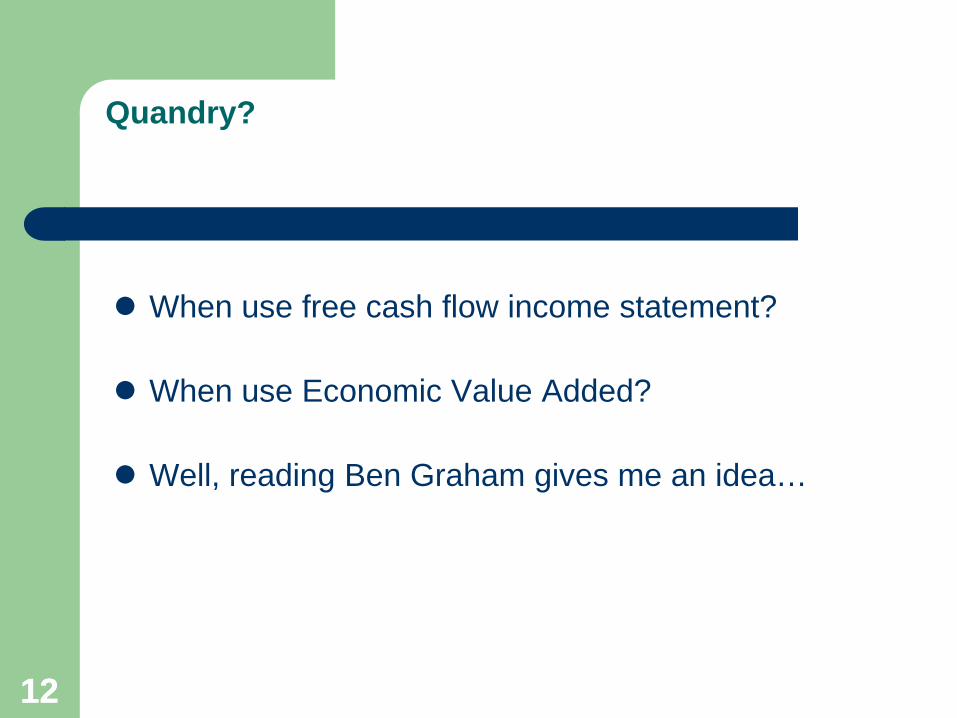
Quandry?
When use free cash flow income statement?
When use Economic Value Added?
Well, reading Ben Graham gives me an idea…

13
Not this Ben Graham!
*Jets punter 2005-2008

14
This fellow! (1894-1976
15 15
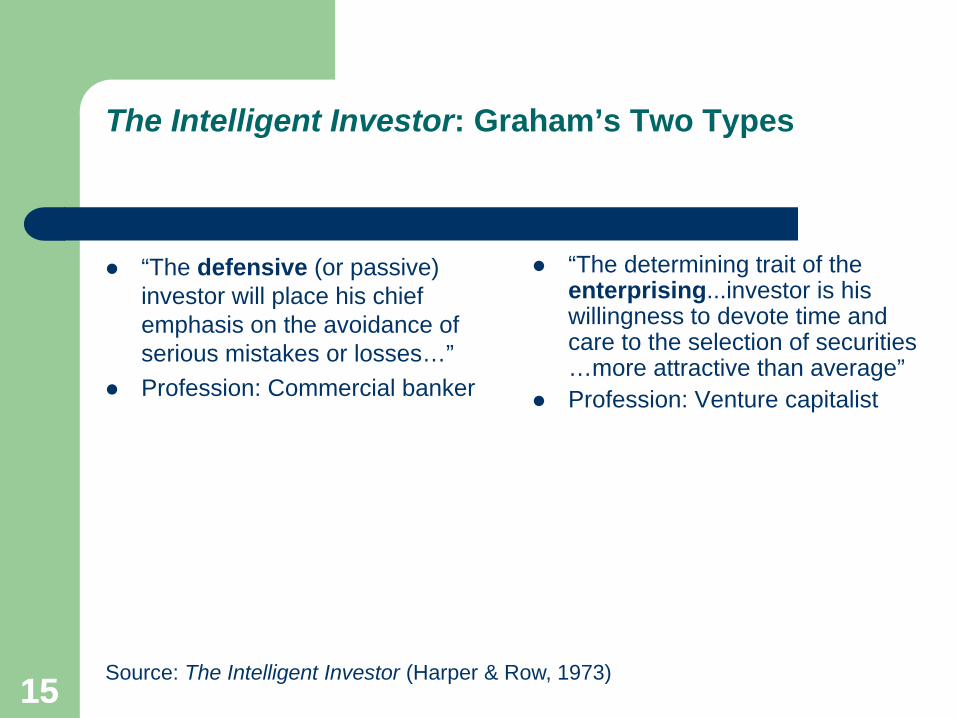
The Intelligent Investor: Graham’s Two Types
“The defensive (or passive) investor will place his chief emphasis on the avoidance of serious mistakes or losses…”
Profession: Commercial banker
“The determining trait of the enterprising...investor is his willingness to devote time and care to the selection of securities …more attractive than average”
Profession: Venture capitalist
Source: The Intelligent Investor (Harper & Row, 1973)
16 16
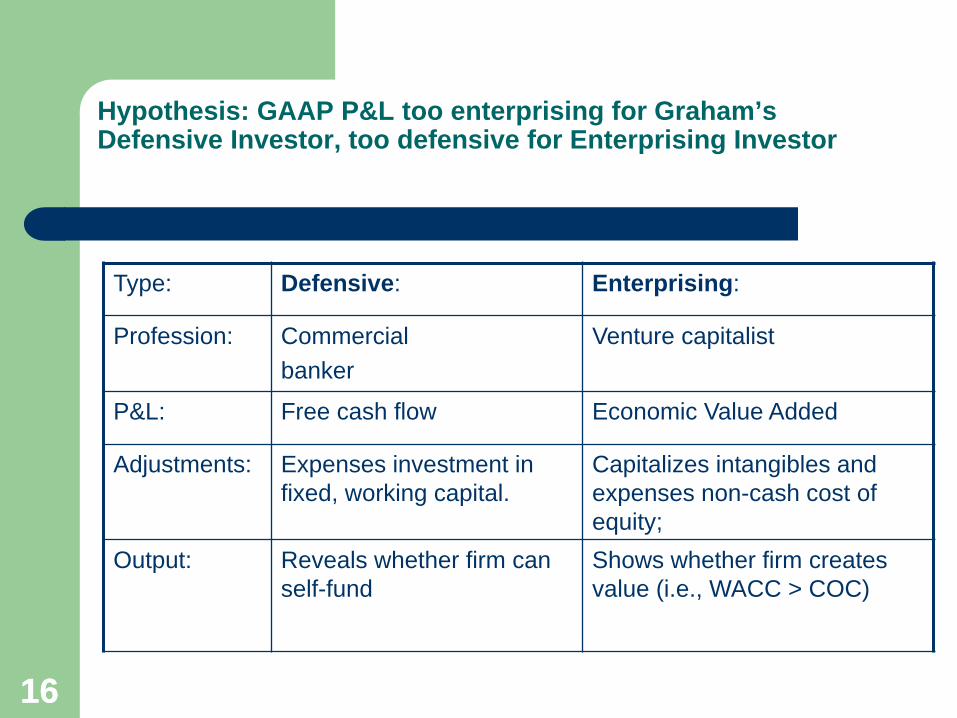
Hypothesis: GAAP P&L too enterprising for Graham’s Defensive Investor, too defensive for Enterprising Investor
Type: Defensive: Enterprising:
Profession: Commercial banker
Venture capitalist
P&L: Free cash flow Economic Value Added
Adjustments: Expenses investment in fixed, working capital.
Capitalizes intangibles and expenses non-cash cost of equity;
Output: Reveals whether firm can self-fund
Shows whether firm creates value (i.e., WACC > COC)
17 17
Case Study: Enron Corp.
Per-share GAAP earnings up 9 of 10 years ending 2000
During the ’90s, total return 1,415% vs. 383% for S&P 500
One of Fortune’s “10 Stocks to Last the Decade” (August 2000)
Board of directors rated among U.S.’s five best
Andrew Fastow gets “best” award from CFO Magazine

18 18
Step 1 of 3: Three Income Statements
Enron Corp. year ending Dec. 31, 2000 (millions except per-share)
Income statement Defensive (free cash flow)
GAAP Enterprising (Economic
Value Added) Revenue - COGS, SG&A, other - Investment fixed capital (#1) - Investment working capital (#2) - Intangibles (#3) - Interest expense (#4) - Other - Taxes Total expenses Profit (loss)
$100,789 98,836 3,555 1,071
0 838
(1,093) 684
$103,893 $(3,102)
$100,789 98,836
n/a n/a
0 838
(215) 434
$99,893 $896
$100,789 98,836
n/a n/a 72
2,609 (55) 765
$102,228 $(1,439)
Source: Company reports, EarningsPower.com

19 19
Step 2 of 3: Quality of Profits

20 20
Step 3 of 3: Earnings Power Chart

21 21
Coal Mine Canary
Defensive: Enterprising: Both:
Autozone (’92-’99) Bethlehem Steel (’96-’00) Allou Health & Beauty (’98-’02)
Centennial Technologies (’93-’97) Boston Market (’93-’97) Bombay Company (’91-’94)
CML Group (’92-’97) CKE Restaurants (’95-’97) Enron (’96-’00)
EDS (’00-’02) Crown Cork & Seal (’95-’00) Polaroid (’95-’00)
Fine Host (’95-’96) HealthSouth (’96-’01) Sunbeam (’93-’98)
Gap, The (’96-’02) Ikon Office (’93-’98) Warnaco (’94-’99)
Gateway (’97-’01) Rite-Aid (’95-’00) Xerox (’96-’00)
Krispy Kreme Donuts (’02-’04) Sherwin-Williams (’91-’00)
Lucent Technologies (’97-’00) WorldCom (’97-’01)
Measurement Specialties (’98-’01)
Tyco (3/00-12/01)
United Airlines (’94-’01)
Source: EarningsPower.com

22 22
Hallmark of Profitable Growth: The Earnings Power Staircase
23 23
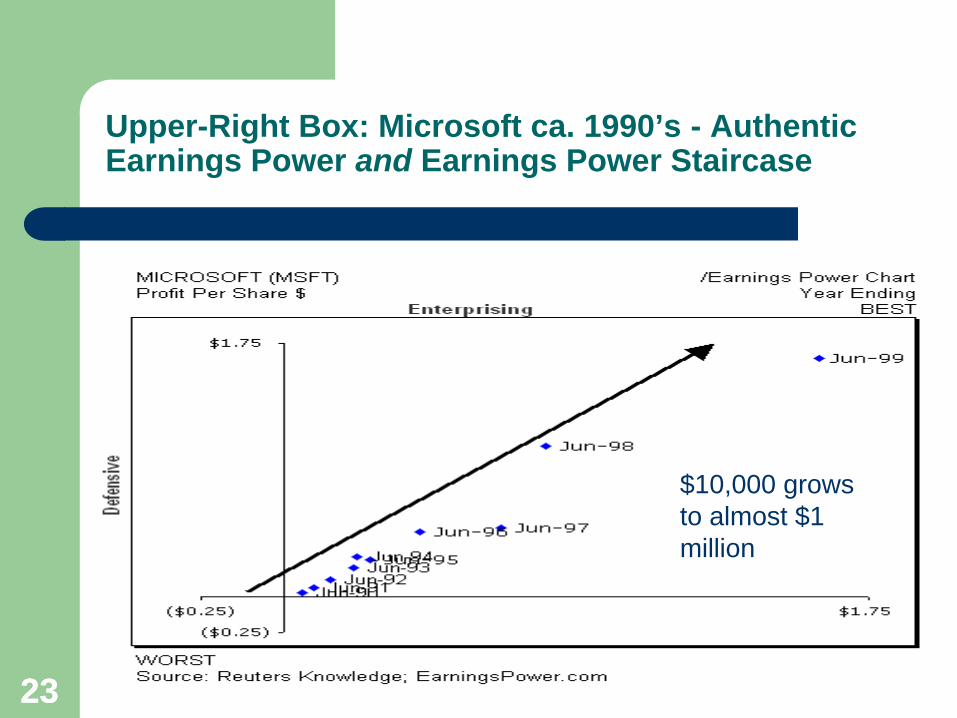
Upper-Right Box: Microsoft ca. 1990’s - Authentic Earnings Power and Earnings Power Staircase
$10,000 grows to almost $1 million

24 24
Apollo Group: $10,000 grows to $78,000

25 25
Cisco Systems: $10,000 grows to $631,000
26 26
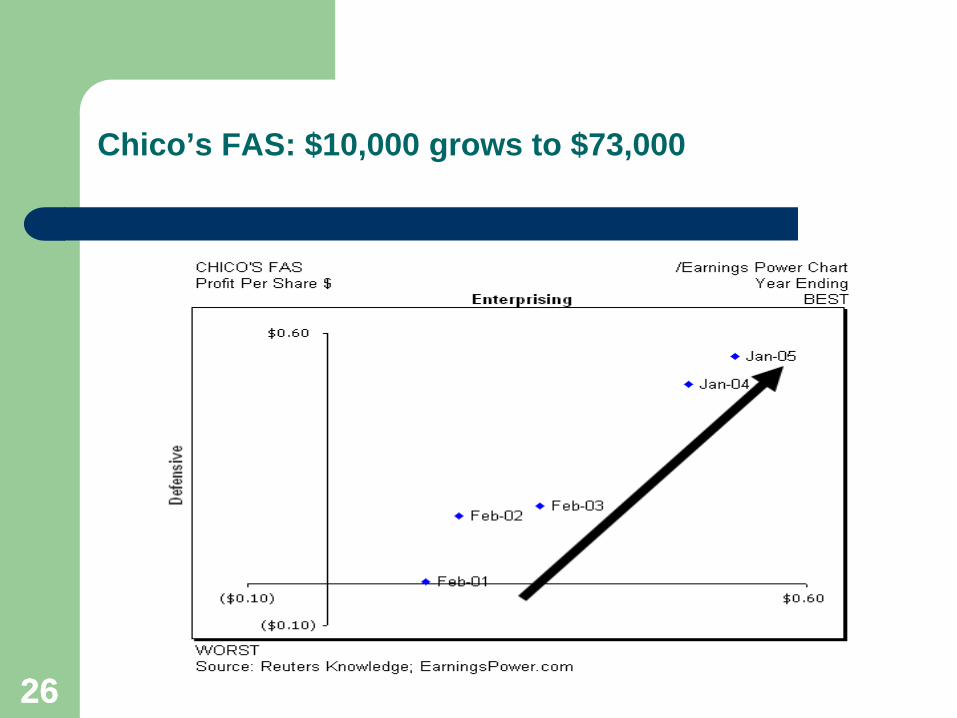
Chico’s FAS: $10,000 grows to $73,000

27 27
Dell Computer: $10,000 grows to $1.3 million

28 28
First Cash Financial: $10,000 grows to $86,000

29 29
Garmin: $10,000 grows to $44,000
30 30
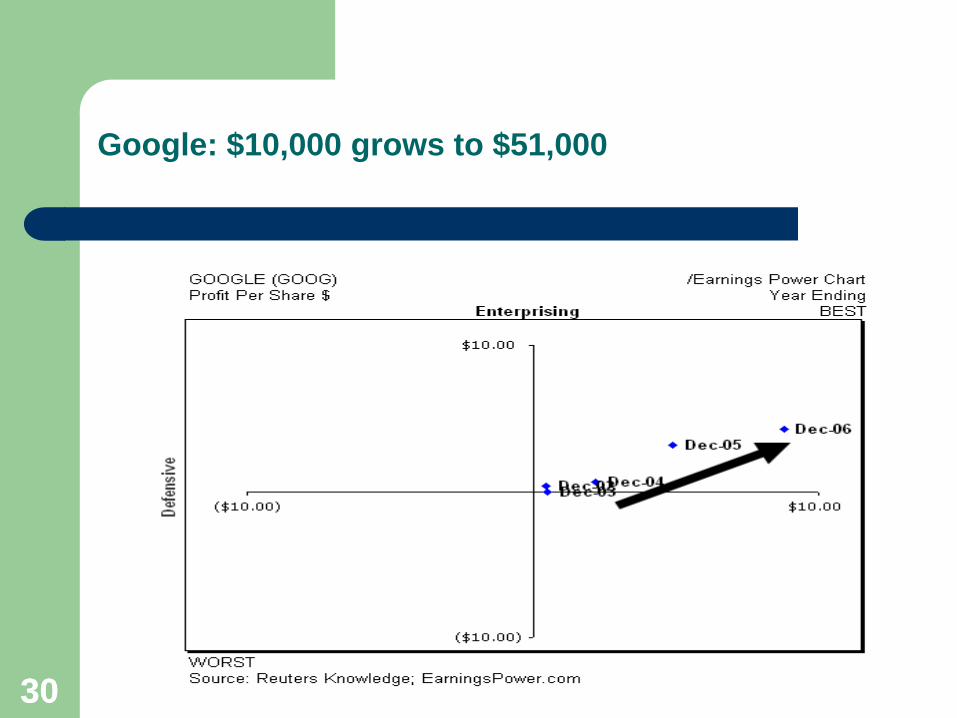
Google: $10,000 grows to $51,000

31 31
Paychex: $10,000 grows to $257,000

32 32
Quality Systems: $10,000 grows to $70,000
33
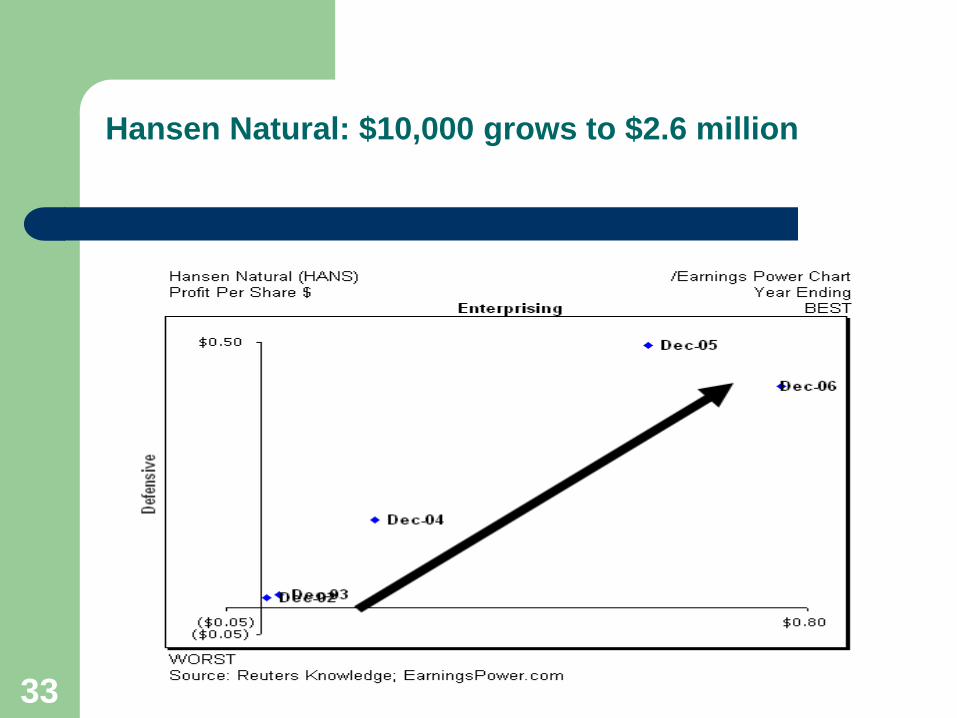
Hansen Natural: $10,000 grows to $2.6 million
34 34
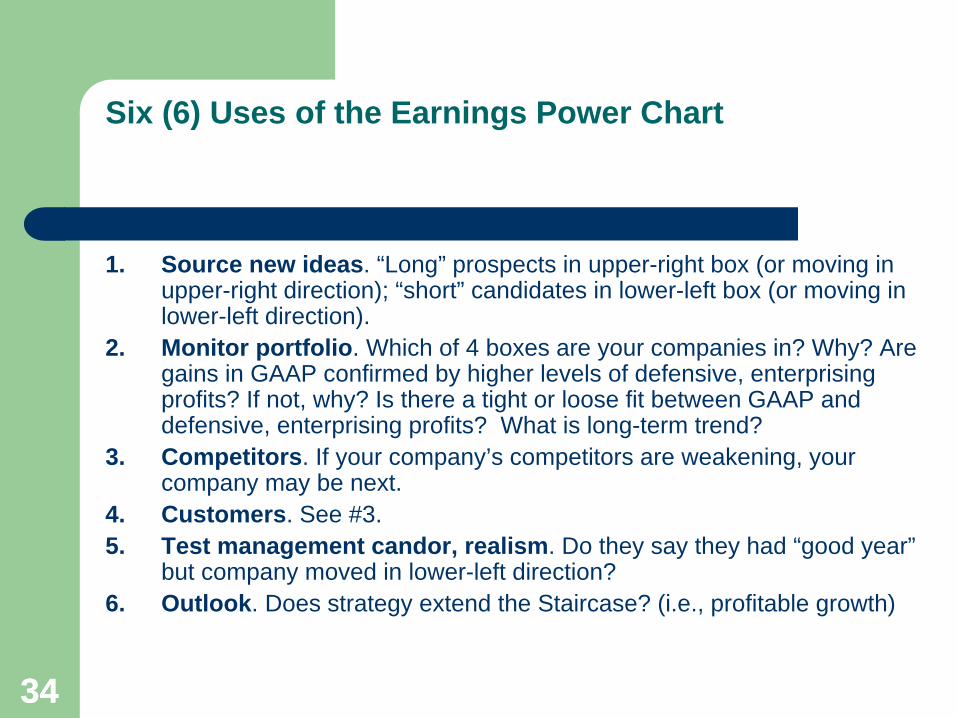
Six (6) Uses of the Earnings Power Chart
1. Source new ideas. “Long” prospects in upper-right box (or moving in upper-right direction); “short” candidates in lower-left box (or moving in lower-left direction).
2. Monitor portfolio. Which of 4 boxes are your companies in? Why? Are gains in GAAP confirmed by higher levels of defensive, enterprising profits? If not, why? Is there a tight or loose fit between GAAP and defensive, enterprising profits? What is long-term trend?
3. Competitors. If your company’s competitors are weakening, your company may be next.
4. Customers. See #3. 5. Test management candor, realism. Do they say they had “good year”
but company moved in lower-left direction? 6. Outlook. Does strategy extend the Staircase? (i.e., profitable growth)

35
Growth investor? Think “Earnings Power 1-2-3”
1. Earnings quality
2. Competitive advantage
3. Price-intrinsic value
• Upper-right box? • Staircase?
• Low-cost provider • High switching cost • Intangibles (e.g., brands, locations, patents, etc.) • Network effect • Ecosystem
• Fair worth? • Key assumptions? • Price-intrinsic value • Reward-risk? • Time-wtd. risk-adj. return?
36
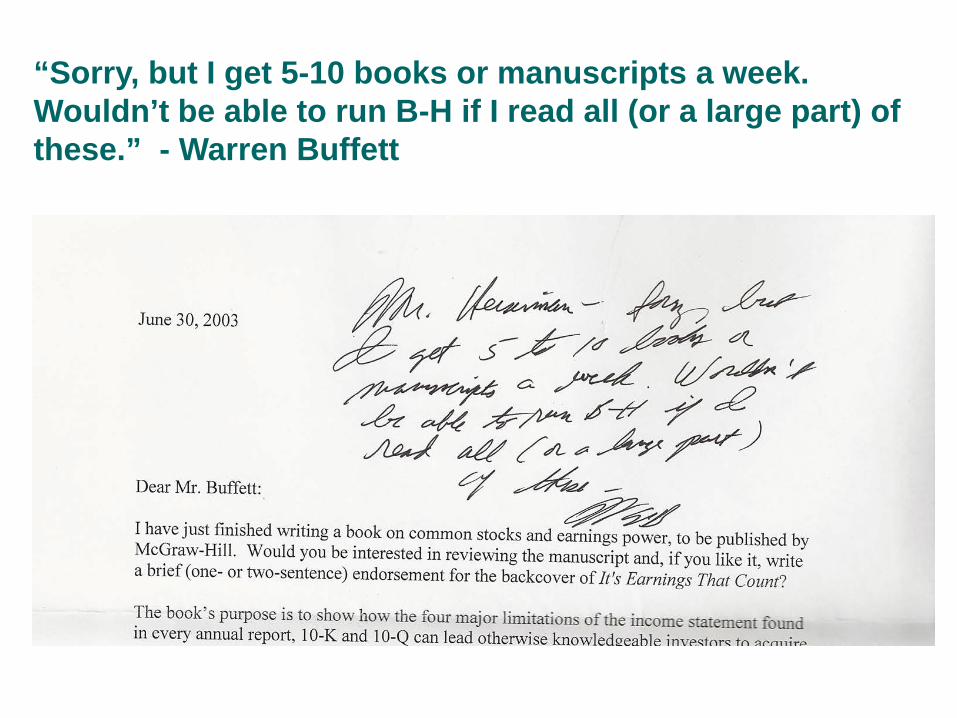
“Sorry, but I get 5-10 books or manuscripts a week. Wouldn’t be able to run B-H if I read all (or a large part) of these.” - Warren Buffett

37 37
Book #2 - Checklist Investing

38 38
Active investing: It’s Hard!
Russell 3000 up 900% during 1983-2007 8,000 companies 64% underperformed 39% lost money 19% lost at least 75% of their value 25% accounted for 100% of the gains Source: Longboard Asset Management, “The
Capitalism Distribution”
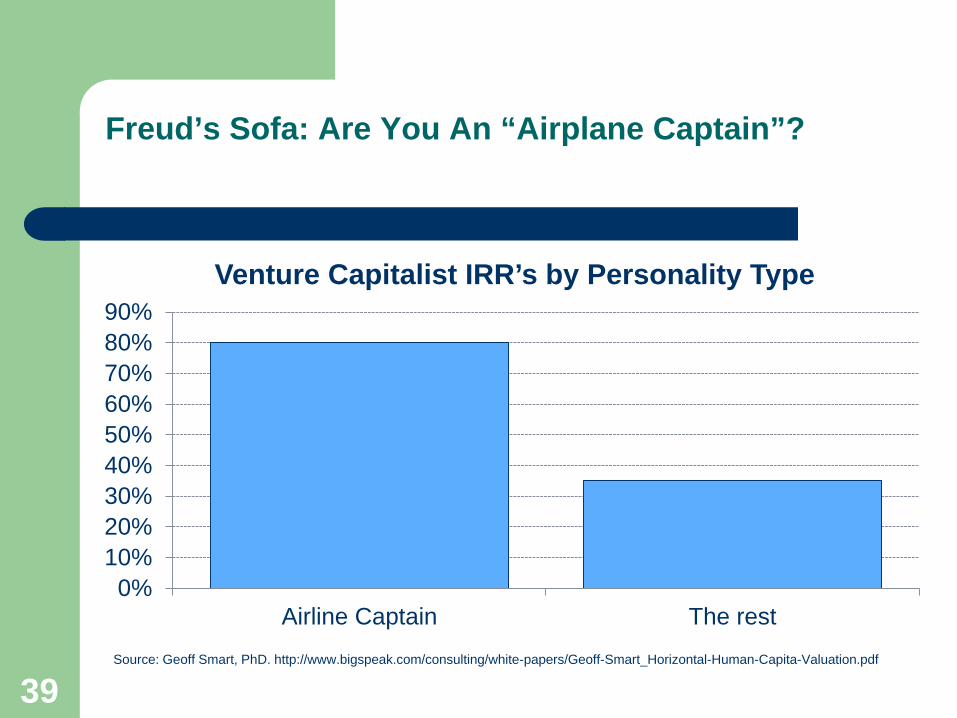
Freud’s Sofa: Are You An “Airplane Captain”?
0%10%20%30%40%50%60%70%80%90%
Airline Captain The rest
Venture Capitalist IRR’s by Personality Type
39 Source: Geoff Smart, PhD. http://www.bigspeak.com/consulting/white-papers/Geoff-Smart_Horizontal-Human-Capita-Valuation.pdf

40 40
Tonight’s Homework Assignment
The Art and science of Human Capital Valuation (Geoff Smart, PhD.
http://www.bigspeak.com/consulting/white-papers/Geoff-Smart_Horizontal-Human-Capita-Valuation.pdf
Read pages 10-12 (best practices, worst practices) “There was a very clear link between an investor’s approach to
human capital valuation and the overall deal success.” “There is plenty of room for private equity investors to gain
competitive advantage and earn higher IRRs through using more effective human capital valuation practices.”

41 41
Ownership (Equity and debt)
Type: Questions/Comments:
1. Control Trustworthy? Competent?
2. Incentives
Does everyone share same vision? Or are opposing forces ? (e.g., Founding family multi-generational outlook vs. impatient activist, or debtholders vs. stockholders)
3. Stability Low turnover ownership helps management think long-term, high turnover encourages short-termism
4. Outlook If ownership composition changes, why? Is outlook or reward-risk improving? Worsening?
5. Notable absence Who doesn’t own that should?

42 42
Eight (8) Owner Types:
Type: Comments:
1. Founder (inc. founder-owner-operator)
Teledyne’s Henry Singleton, Wal-Mart’s Sam Walton, Apple’s Steve Jobs
2. Descendants & in-laws
Public, family-run co’s had better financial performance during 1997-2009 than nonfamily businesses (Kachaner, Stalk, Bloch, HBR, Nov. 2012)
3. C-officers, directors & employees (non-founder)
If CEO owns more than 5% of co., the stock outperforms the market by 4.7% a year. If CEO owns more than 10%, then 8.8% average annual advantage (Lilienfeld-Toal and Reunzi). Also, CEO ownership of best co’s of the 2000’s was 20%; for co’s that went bankrupt , 5%. (Source: ?)
4. Endowments & foundations:
Hershey Trust, Hormel Foundation, Carlsberg Foundation
5. Asset manager Index, closet index, algo-quant, intrinsic value, activist, smart money (billionaire).
6. Corporate Yahoo (YHOO) owned 22.4% of Alibaba (BABA) at latter’s 2014 IPO
7. State-owned enterprise Gazprom, Petrobas, General Motors. Risk: Kleptocracy
8. Other (self-directed): Do-it-your-selfers

43 43
#1 of 2: Founder-Owner-Operator: Henry Singleton
At U.S. Naval Academy ranked 1/820 in math Co-founded Teledyne, Inc. in 1960; for many years the conglomerate
earned 50% on assets (definition: inventory plus fixed capital) Brilliant capital allocator. Bought 128 co’s with high P/E-multiple stock.
But after P/E fell, Singleton dismissed his acquisition team and never issued another share of stock. Between 1972-1984, in 8 separate tender offers, he repo’d 90% of Teledyne
Big influence on Warren Buffett and Prem Watsa (Fairfax Financial) Co-managed President Reagan’s blind trust More, William Thorndike’s The Outsiders. Also, Leon Cooperman here: http://videos.nyssa.org/a-case-study-in-
financial-brilliance-dr-henry-e-singleton-of-teledyne-inc#sthash.jX8tIjxi.dpuf

44 44
Finding Today’s Founder-Owner-Operators
Chris Mayer’s Capital & Crisis and also Mayer’s Special Situations (http://agorafinancial.com/publication/fst/)
Horizon Kinetics ISE Wealth Indexes Virtus Wealth Masters Fund (VWMAX), which buys owner-operators (avg.
20% ownership) and eschews agent-operators (0.10% ownership). Defines agent-operator as an employee in an incentive structure that encourages “meeting shorter term, less fundamentally important financial targets, e.g., quarterly earnings estimates.” These people may view strategy “in the context of career risk as opposed to whether or not such decisions will prove accretive over the long term.”
Morgan Dempsey Small/Micro-Cap Value (MITYX), which seeks “founder-owner-operator” cultures, which include at least 10% equity via after tax/open market purchases—not just options and/or SAR rights

45 45
#2 of 2: Smart Money (Billionaire)
“Large body of academic research that supports [Horizon Kinetics’ ISE] Wealth Index concept.
e.g., Shulman and Noyes (2012) found an index of billionaire‐led companies beat the S&P 500 Index by over 700 basis points annually during the period of study.
More, http://wealthindex.wpengine.com/wp-content/uploads/2014/06/Horizon-Kinetics-Wealth-Indexes-At-A-Glance-20140331_Added-Intl-Global-Asia-FINAL.pdf
46 46
Pershing Square Holdings (PSH:NA)
Smart money (Billionaire) CEO: Bill Ackman IPO: October 1, 2014 – “permanet capital” 2014 performance: 51% gross, 40% net Since 2004, Pershing Square, L.P. has compounded at 21%/year
(despite approx. 1/3 AUM in cash, to meet redemptions). That’s $13.9B of profit last nearly 11 years.
Price: $23.91; NAV: 25.97; P-NAV: 92% (1/6/15) Structure: closed-end fund Taxes: No entity level (Guenrsey) Influence: Typically, 1st or 2nd-largest shareholder, with board seat or
substantial influence , “by virtue of our large stake and active voice.” Age: 48 (12/18/14): “I think I can do this for another thirty or more years
and the good news is I really love what I do.”
47 47
Summary:
Nearly ruined by speculation, Ben Graham devised “margin of safety” strategy of buying co’s selling at two-thirds of net working capital after subtracting all liabilities. Then made 20% a year for two decades.
If your thesis involves growth (secular, cyclical, prospective), use the Earnings Power 1-2-3 process as your margin of safety to help protect against miscalculation or bad luck
Also, use a checklist to improve your problem-solving ability Lagniappe: e-mail me for ‘12 Tips for Impactful Writing”
[email protected] Questions?

Quiz: Height of Fenway’s “Green Monster”
49 49
Bio:
Hewitt Heiserman Jr. conceived the Earnings Power Chart, which is the subject of his book It's Earnings That Count (McGraw-Hill, 2004). Mr. Heiserman is a member of the Boston Security Analyst Society and CFA Institute. He has been quoted in TheStreet.com, The Wall Street Journal, BusinessWeek, CBS MarketWatch, Business 2.0, Better Investing, The Motley Fool, Complete Growth Investor, Barron's, and the Haverford Trust Company Adviser. Mr. Heiserman has spoken to the New York Society of Security Analysis, the Boston Security Analysts Society, Babson Investment Management Association, the American Association of Individual Investors, Fidelity Management & Research, Complete Growth Investor, Bryant College, Franklin-Templeton Group and VALUEx Berkshires on "Ben Graham and the Growth Investor." Mr. Heiserman graduated from Kenyon College with Distinction in History, and received the Faculty Award for Distinguished Achievement. Mr. Heiserman is an Eagle Scout, former vice-president of an open land foundation, and an Ironman Lake Placid finisher. Columbia University Press will publish his second book, The Checklist Investor, in 2016.

50 50
notes:
Free Cash Flow Economic Value Added Bona fides: AAII price-FCF screen 20.4%
annualized return 1999-9/30/14, vs. 10.% for all exchange listed stocks. (Source: AAII)
“Buy equally in today’s Top 25 Fortune 500 companies five years ago, you would have gotten a 23% total cumulative return. Buy Top 25 Most Profitable Growth companies, 174%. S&P 500 returned 10% during same period. (Source: Chris Barth, “The Most Profitable Growth Companies in the U.S., Forbes, Jan. 1, 2011)
http://www.ft.com/cms/s/0/86d97610-00ab-11df-ae8d-00144feabdc0.html#axzz3IgB4neG4