benchmark report ratio of faculty to administrators · benchmark report ratio of faculty to ......
TRANSCRIPT

Benchmark Report
Ratio of Faculty to Administrators
Office of Institutional Research
Ming Zhang
Sharon Schmidtz
January 2013
I. Background
A recent article [1] in the Chronicle of Higher Education regarding an ‘ideal ratio’
of faculty to administrators has been generating a lot of interest in the higher
education community. In order to fully understand the methodology used in that
report, Western’s IR Office communicated with Emeritus Professor Robert E.
Martin, the first author of a working paper [2] on which the Chronicle article is
based, and were able to closely replicate the 2008-09 data and methodologies
employed in their working paper. Please note that the following analysis simply
replicates the methodology used in the study referenced in the Chronicle to
compare Western to the national picture. An endorsement of these methods and
conclusions regarding ‘ideal ratios’ should not be inferred.
As noted in the Chronicle article, the working paper estimated three cost models
with a quadratic cost function using IPEDS panel data for Carnegie I and II
public research universities. The article concluded that the optimal staffing ratio
is approximately three tenured and tenure-track faculty members for every one
full-time administrator. The article further noted that as of 2008-09 the actual
number of full-time administrators is almost double the number of tenured and
tenure-track faculty.
II. Data and Methodology
The author of the working paper used IPEDS (Integrated Postsecondary
Education Data System) as the primary data source. Using a small sample of data
and some instructions received from the author, we retrieved raw IPEDS data,
derived a methodology, and recalculated the metrics used in the article.
Although we have determined the basic intent and methodology used in the
working paper and referenced in the Chronicle article, our replications are very
close, but do not exactly match, the author’s reported metrics. For example, the
author shows metrics for 134 public research universities, while we find 146. We
do not know which 134 institutions the author used. However, even with some
2 WWU IR Z:\Report\Fac_Staff\fac admin ratio\Report - Faculty to Admin Ratio.docx
limitation, we calculate a 2008-09 ratio of faculty-to-administrators for public
research universities of .55 compared to the author’s .56. The metrics presented
in our paper are internally-calculated based on the derived methodology and
IPEDS raw data.
Appendix A shows descriptions of IPEDS occupational categories, and Appendix
B shows a summarized list of WWU job titles and the primary IPEDS categories
that those jobs are assigned to by the WWU Human Resources Department.
Institutions of higher education are required to report headcounts of staff
through the IPEDS system via the annual Human Resources survey. This survey
requires that staff be classified in these general categories:
1. Staff whose primary responsibility is instruction, research, and/or public
service (i.e., faculty).
2. Executive/administrative/managerial.
3. Other professionals (support/service).
4. Non-Professional.
a. Technical and paraprofessionals.
b. Clerical and secretarial.
c. Skilled crafts.
d. Service/Maintenance.
The metric of interest in our paper is the ratio of the number of full-time tenured
and tenure-track faculty (TN/TT) to the number of full-time administrators. The
author of the working paper defines ‘administrator’ as the sum of full-time
‘executive/administrative/ managerial’ and full-time ‘other professional’ staff.
In addition to the metric of interest, other variables used in the models for
explaining cost variations include:
a. FTE students.
b. The number of full-time tenured and tenure-track track faculty per 100
students.
c. The number of FTE faculty per 100 students.
d. The number of FTE executive/managerial employees per 100 students.
e. The number of other FTE professional employees per 100 students.
f. The number of FTE non-professional employees per 100 students.
g. The number of FTE executive and professional employees per 100
students.
We noted that Western’s 2008-09 Human Resources survey was initially
submitted in April of 2009, then corrected in April of 2010. For our report we
used the corrected data. It is also important to note that IPEDS does not collect

3 WWU IR Z:\Report\Fac_Staff\fac admin ratio\Report - Faculty to Admin Ratio.docx
FTE data. The FTE figures found in IPEDS reports, and used here, are calculated
using the reported headcounts of staff. Institutions are asked to provide the
number of full-time and number of part-time staff by primary function and
occupation. IPEDS then calculates an FTE, counting one FTE per full-time staff,
and one-third FTE for each part-time staff. If the average of part-time staff FTE is
actually more than one-third, then the IPEDS-calculated FTE underestimates
actual FTE. If the average of part-time staff FTE is actually less than one-third,
then the IPEDS-calculated FTE overestimates actual FTE. At Western, the part-
time faculty average is about .05 FTE, so the IPEDS method of calculating FTE is
an underestimate of our actual faculty FTE.
III. Preliminary Findings
Most importantly, this analysis compares Western’s faculty to administrator ratio
to the one presented in the Chronicle article. Also, we report other metrics of
interest, including FTE faculty per 100 students and FTE staff per 100 students.
1. Ratio of Faculty to Administrators at WWU and National Benchmarks in 2008-09
Table 1: Ratio of Faculty to Administrators
2008-09
Public Research Universities .55*
Public Master Universities 1.01
BOT Peers 1.03
WWU 1.21
*.56 is referenced in the working paper; our
replication methods calculate .55
In Table 1, faculty is defined as the number of full-time tenured and tenure-track
(TN/TT) faculty, and administrator as the number of full-time executive/
administrator/manager and full-time other professionals including librarians.
The ratio is full-time TN/TT faculty divided by full-time administrators.
As noted in Table 1, the ratio for public research universities is .55. This indicates
that these institutions, on average, have about half as many full-time TN/TT
faculty as full time administrators. The ratio for public masters’ universities and
our BOT peers is about one. This indicates that these institutions, on average,
have about the same number of full-time TN/TT faculty as full-time
4 WWU IR Z:\Report\Fac_Staff\fac admin ratio\Report - Faculty to Admin Ratio.docx
administrators. The ratio for Western is 1.21. This indicates that Western has
about 21% more full-time TN/TT faculty than full-time administrators1.
Comparing Western’s ratio to the national figure referenced in the working
paper (.56), we see Western has more than twice as many faculty per
administrator as the national figure. Even comparing our ratio to the average of
our BOT peers (1.03) and to public master universities (1.01), Western has
significantly more faculty per administrators.
2. Ratio of Faculty to Administrators at Western and BOT Peers in 2008-09
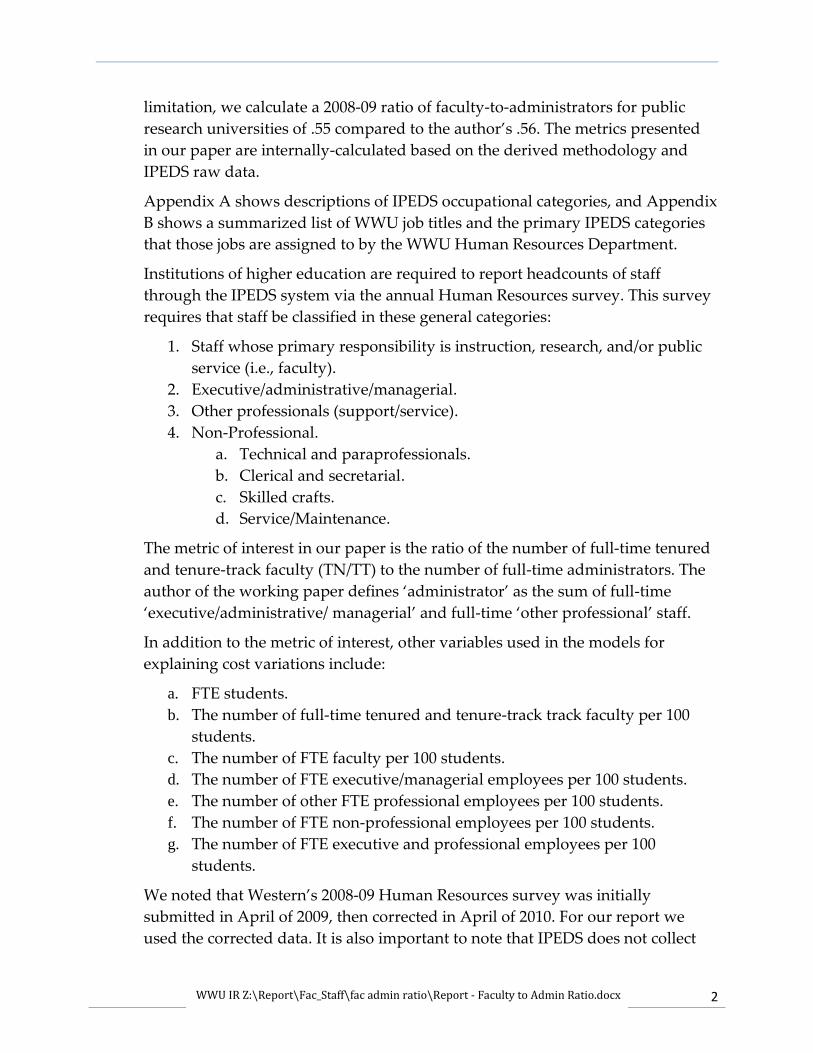
Figure 1: Ratio of Faculty to Administrators 2008-09, Detail
Figure 1 illustrates the ratio of faculty to administrators of our individual BOT
peers in 2008-09, and shows Western’s relative position among those peers. A
reference line indicates the mean and median of the BOT peers2. Bars showing
the average of public master institutions and research institutions are shown for
reference.
1 Table 1 indicates that Western’s ratio of faculty to administrators in AY 2008-09 is 1.21. This is
calculated using 476 full-time tenured and tenure-track faculty and 392 administrators (67 full-time
executive, and 325 full-time other professional staff) reported to IPEDS in the fall 2008 Human Resources
survey (476/392=1.21). 2 The BOT peer mean and median do not include WWU; all institutional data is available upon request.
5 WWU IR Z:\Report\Fac_Staff\fac admin ratio\Report - Faculty to Admin Ratio.docx
In the 2008-09 year, Western ranked 8rd among our 25 BOT peer institutions in
terms of the ratio of faculty to administrators. In other words, we were in the top
one-third of the distribution, a finding that is not surprising given Western’s
focus on hiring tenure-track faculty.
3. Changes since 2008-09: Ratio of Faculty to Administrators at Western and BOT
Peers from 2008-09 to 2011-12
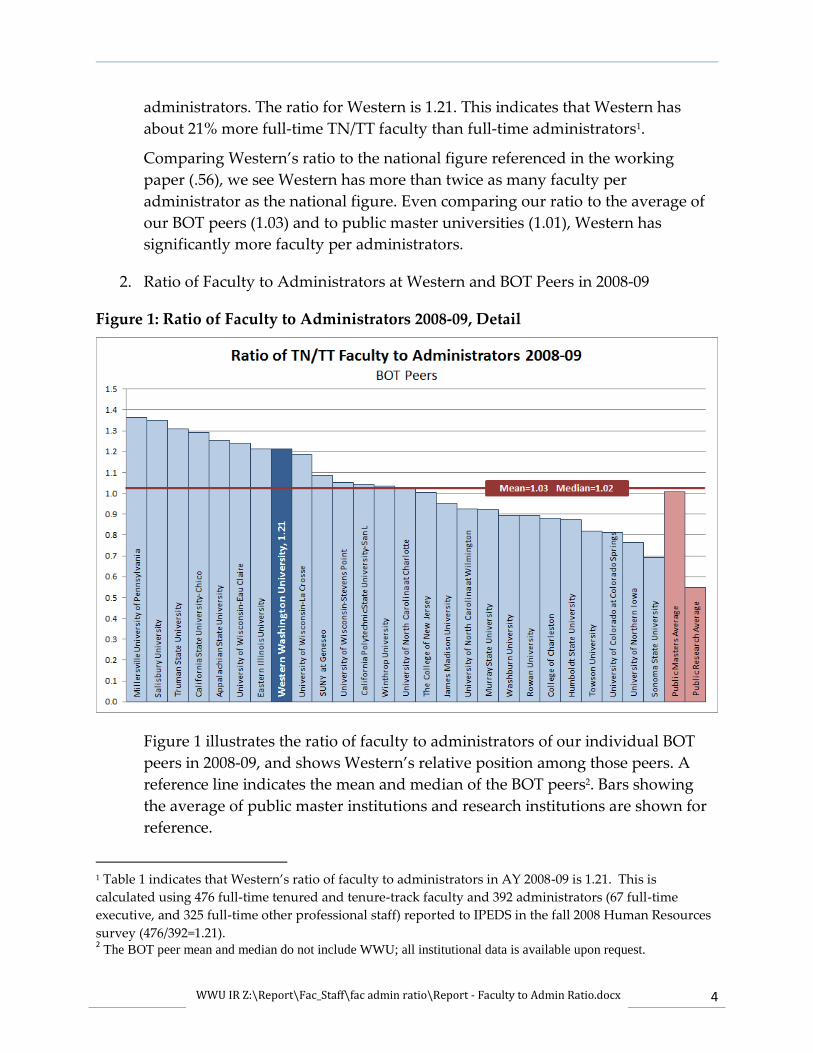
Figure 2: Ratio of Faculty to Administrators 2011-12, Detail
In 2011-12, Western remained ranked 8rd among our BOT peer institutions in
terms of the number of full-time TN/TT faculty to full-time administrators.
Western declined from a ratio of 1.21 to 1.15, or a decline of .07. The average
decline among the peers was .03. Winthrop University had the greatest decline,
going from 1.04 (ranked 13th) to .77 (ranked 24th) on this metric. Two institutions
had very large increases: Rowan University (increased from .89 to 1.25) and
Appalachian State (increased from 1.25 to 1.48).
6 WWU IR Z:\Report\Fac_Staff\fac admin ratio\Report - Faculty to Admin Ratio.docx
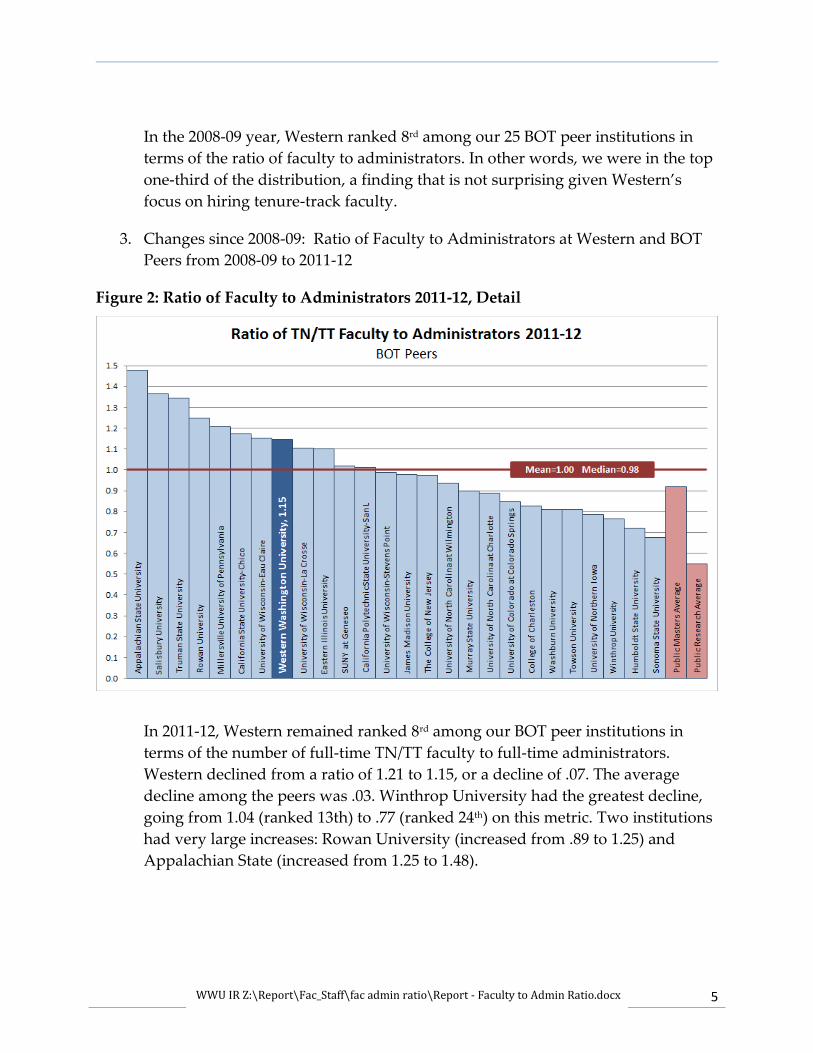
Figure 3: Ratio of Faculty to Administrators, Trend
Figure 3 illustrates that Western’s ratio of faculty to administrators has declined
since 2008-09; the decline in ratio is .07, or a 5.7% decline. The average of
benchmark groups are down as well: the BOT peer group declined by 3.2%, the
Public Master group declined by 4.2%, and the Public Research group declined
by 4.1%.
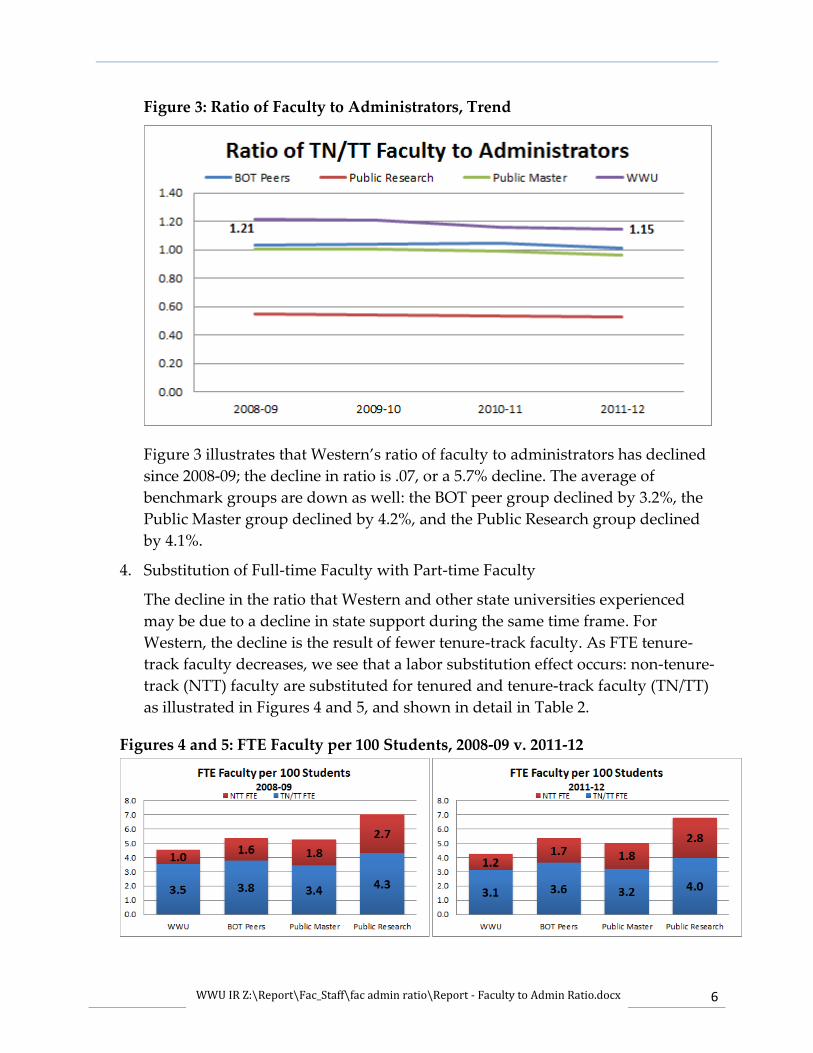
4. Substitution of Full-time Faculty with Part-time Faculty
The decline in the ratio that Western and other state universities experienced
may be due to a decline in state support during the same time frame. For
Western, the decline is the result of fewer tenure-track faculty. As FTE tenure-
track faculty decreases, we see that a labor substitution effect occurs: non-tenure-
track (NTT) faculty are substituted for tenured and tenure-track faculty (TN/TT)
as illustrated in Figures 4 and 5, and shown in detail in Table 2.
Figures 4 and 5: FTE Faculty per 100 Students, 2008-09 v. 2011-12

7 WWU IR Z:\Report\Fac_Staff\fac admin ratio\Report - Faculty to Admin Ratio.docx
Table 2: FTE Faculty per 100 Students
WWU BOT Peers Public Master Public Research
2008-09 3.53 3.80 3.43 4.29
2011-12 3.12 3.64 3.22 3.99
change -0.42 -0.16 -0.21 -0.30
% change -11.9% -4.1% -6.1% -7.0%
2008-09 1.00 1.58 1.81 2.74
2011-12 1.16 1.73 1.83 2.79
change 0.15 0.15 0.01 0.05
% change 15.4% 9.6% 0.7% 1.8%
2008-09 4.54 5.38 5.25 7.03
2011-12 4.27 5.37 5.05 6.78
change -0.27 0.00 -0.20 -0.25
% change -5.9% -0.1% -3.7% -3.6%
Total Faculty
FTE
NTT FTE
TN/TT FTE
At Western, as with all peer groups shown, there was a decline in tenured and
tenure-track (TN/TT) faculty per 100 students between 2008-09 and 2011-12.
Table 2 shows that Western’s decline in this measure was 11.9% (.42 FTE faculty
per 100 students), while the average decline of the BOT peers was 4.1%. Western
shows a greater decline than the average of our peer groups, but taking a closer
look at the BOT peers, we find that four of the 25 institutions had a 10% or more
decline in TN/TT FTE faculty per 100 students during this period.
While the FTE TN/TT faculty decreased, the FTE non-tenure-track (NTT) faculty
increased across all groups. Western shows a 15.4% increase in NTT faculty FTE,
while BOT peers show a 9.6% increase. The other groups show a very small
increase. There is considerable variation in this measure among the individual
BOT peer institutions. While WWU gained .15 NTT faculty per 100 students,
Appalachian State University gained .79, and University of North Carolina at
Wilmington gained .71 NTT FTE faculty per 100 students. Fifteen of the BOT
peer institutions increased in this measure, and 10 institutions declined in NTT
faculty per 100 students.
With the exception of BOT peers, total faculty FTE per 100 students declined for
all groups. Western declined 0.27 FTE faculty per 100 students. While the
average of our BOT peers showed no change, most of the peer institutions (17 of
25) declined in total faculty FTE during this period. Again, there was wide
variation among the peers.
5. Other Key Metrics for Western and Peers
Figure 6 illustrates Western’s FTE staff per 100 students for all IPEDS
occupational categories (Instructional, Executive, Professional, and non-
Professional).

8 WWU IR Z:\Report\Fac_Staff\fac admin ratio\Report - Faculty to Admin Ratio.docx
Figure 6: FTE Staff per 100 Students, Western Washington University
Western’s non-professional staff declined 0.57 FTE staff per 100 students, or an
11.0% decline. The faculty group declined by 5.6%, the professional group
declined by 9.3%, while the very small executive group gained slightly.
Table 3: FTE Staff per 100 Students, Western Washington University
2008-09 2009-10 2010-11 2011-12 Change 2008-09 to
2011-12
%
Change 2008-09 to
2011-12
Faculty 4.54 4.49 4.31 4.27 -0.27 -5.9%
Executive 0.50 0.49 0.51 0.50 0.01 1.2%
Professional 2.49 2.46 2.38 2.26 -0.23 -9.3%
Non-Professional 5.22 5.05 4.77 4.65 -0.57 -11.0%

9 WWU IR Z:\Report\Fac_Staff\fac admin ratio\Report - Faculty to Admin Ratio.docx
Table 3 shows the detail and the percent change from 2008-09 to 2011-12. We see
that the greatest decline is in the non-professional group. As Western has
become leaner in terms of faculty, the decline in non-instructional staff has been
greater. Indeed, Western is doing more with less staff as compared to peer
groups, as shown in Figure 7. In 2011-12, Western had 11.7 total staff per 100 FTE
students compared with 12.6 for public masters’ institutions and 13.9 for the BOT
peer group.
Figure 7 shows a trend of the ratio of total FTE staff per 100 students. We see that
Western has fewer total staff per student than the average of our BOT peers. In
2011-12, Western has 11.7 FTE staff per 100 students, compared with a 13.9 FTE
for the average of our BOT peers and 12.6 FTE for the average of public masters’
institutions. Between the years of 2008-09 and 2011-12, Western lost 1.0 FTE staff
per 100 students. The average loss for our BOT peers was .3 FTE staff per 100
students.
Figure 7: Total FTE Staff per 100 Students (Trend)
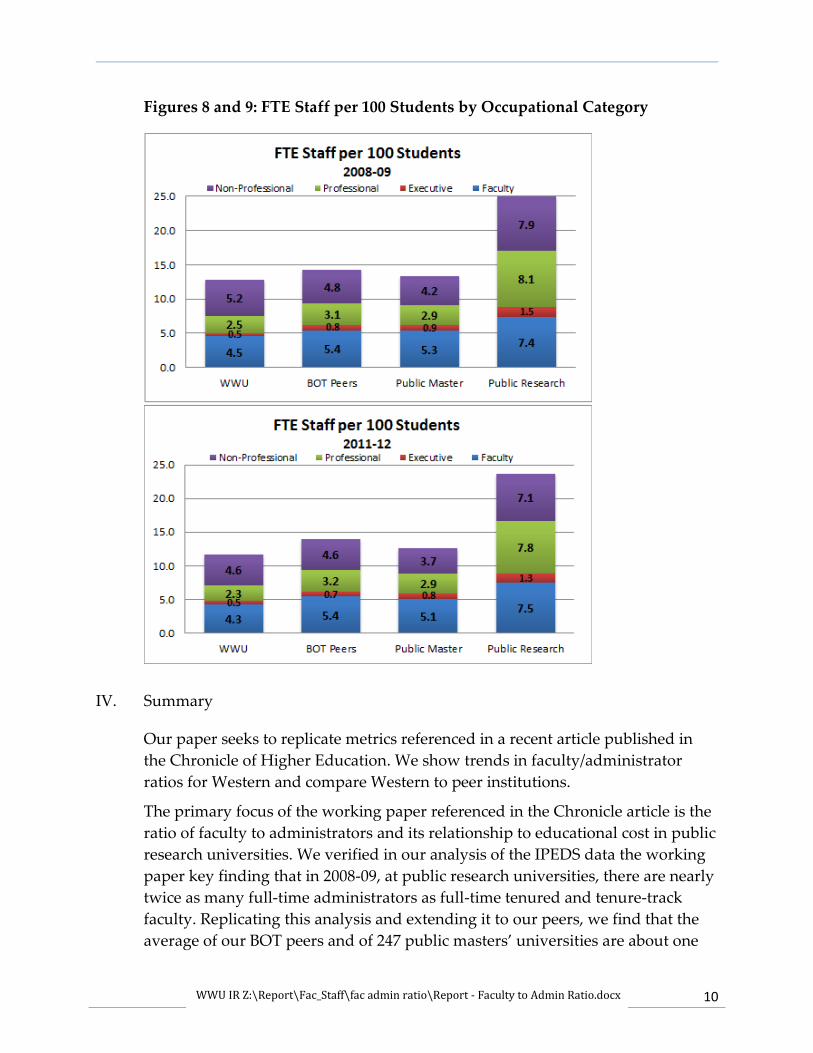
In Figures 8 and 9 (next page), we show the 2008-09 and 2011-12 FTE staff per 100
students for Western and the peer groups, broken out by IPEDS occupational
category. We see that Western is on par with BOT peers in terms of non-
professional staff (4.6 per 100 students), and has fewer staff per 100 students in
other occupational categories.
10 WWU IR Z:\Report\Fac_Staff\fac admin ratio\Report - Faculty to Admin Ratio.docx
Figures 8 and 9: FTE Staff per 100 Students by Occupational Category
IV. Summary
Our paper seeks to replicate metrics referenced in a recent article published in
the Chronicle of Higher Education. We show trends in faculty/administrator
ratios for Western and compare Western to peer institutions.
The primary focus of the working paper referenced in the Chronicle article is the
ratio of faculty to administrators and its relationship to educational cost in public
research universities. We verified in our analysis of the IPEDS data the working
paper key finding that in 2008-09, at public research universities, there are nearly
twice as many full-time administrators as full-time tenured and tenure-track
faculty. Replicating this analysis and extending it to our peers, we find that the
average of our BOT peers and of 247 public masters’ universities are about one

11 WWU IR Z:\Report\Fac_Staff\fac admin ratio\Report - Faculty to Admin Ratio.docx
full-time tenured and tenure-track (TN/TT) faculty for every full-time
administrator. In contrast, the ratio at Western is 1.21, or about 21% more full-
time TN/TT faculty as administrators.
With our ratio of 1.21, Western ranked 8th on this metric among our 25 BOT peer
institutions in 2008-09. Although our ratio fell slightly to 1.15 in 2011-12, as did
the ratio of the majority of our peer institutions, reflecting a loss in full-time
tenured and tenure-track faculty, our ratio continued to rank 8th among our peers
in 2011-12.
As the TN/TT faculty per student has fallen, the non-tenure-track (NTT) faculty
FTE has grown. However, the FTE increase in NTT faculty did not fully replace
the FTE loss in TN/TT faculty. This is true for Western and for all peer groups
except the BOT peer group, whose total FTE faculty remains about flat.
Although IPEDS reports show that we have more non-professional staff than
peers, when normalized by the size of our student population (student FTE), we
find that Western seems to be similar to, or have fewer staff in all occupational
categories than the average of our peer groups. In 2011-12 we are on par with our
BOT peers in terms of non-professional staff per 100 students, and have fewer
staff than our peers in the other occupational categories.
Since we are a stand-alone institution and not part of a university system with
centralized staff functions, all of our staff functions are covered on site. To the
extent that we compare ourselves with institutions that are part of a larger
system, we are more efficient than a direct comparison suggests.
Although Western’s faculty to administrators ratio decreased slightly in the last
three years, with new hiring of tenure-track faculty in fall of 2012, we will see our
ratio of faculty to administrators once again increase.

12 WWU IR Z:\Report\Fac_Staff\fac admin ratio\Report - Faculty to Admin Ratio.docx
References
1. Jenny Rogers (2012) ‘3 to 1: That's the Best Ratio of Tenure-Track Faculty to
Administrators, a Study Concludes’, The Chronicle of Higher Education,
November 12, 2012.
http://chronicle.com.ezproxy.library.wwu.edu/article/Administrative-Bloat-
How-Much/135500/
2. Robert E. Martin and R, Carter Hill (2012), Measuring Baumol and Bowen Effects
in Public Research Universities, a working paper.
http://papers.ssrn.com/sol3/papers.cfm?abstract_id=2153122

13 WWU IR Z:\Report\Fac_Staff\fac admin ratio\Report - Faculty to Admin Ratio.docx
Appendix A: IPEDS Employee by Assigned Position (EAP): Survey Instruction
Below are the IPEDS occupational categories used in the article and as reported to IPEDS. As of fall
2012, new occupational categories are required in order to align with the occupational categories in the
federal 2010 Standard Occupational Classification (SOC) System.
Staff whose primary responsibility is instruction, research, and/or public service.
Executive/administrative/managerial.
Report all persons whose assignments require management of the institution, or a customarily
recognized department or subdivision thereof. Assignments require the performance of work
directly related to management policies or general business operations of the institution,
department or subdivision. Assignments in this category customarily and regularly require the
incumbent to exercise discretion and independent judgment.
Other professionals (support/service).
Report all persons employed for the primary purpose of performing academic support, student
service and institutional support, whose assignments would require either a baccalaureate
degree or higher or experience of such kind and amount as to provide a comparable
background.
Non-Professional: Technical and paraprofessionals.
Report all persons whose assignments require specialized knowledge or skills which may be
acquired through experience, apprenticeship, on-the-job training or academic work in
occupationally specific programs that result in a 2-year degree or other certificate or diploma.
Include persons who perform some of the duties of a professional in a supportive role, which
usually requires less formal training and/or experience than normally required for professional
status.
Non-Professional: Clerical and secretarial.
Report all persons whose assignments typically are associated with clerical activities or are
specifically of a secretarial nature. Include personnel who are responsible for internal and
external communications, recording and retrieval of data (other than computer programmers)
and/or information and other paperwork required in an office.
Non-Professional: Skilled crafts.
Report all persons whose assignments typically require special manual skills and a thorough
and comprehensive knowledge of the processes involved in the work, acquired through on-the-
job-training and experience or through apprenticeship or other formal training programs.
Non-Professional: Service/Maintenance.
Report all persons whose assignments require limited degrees of previously acquired skills and
knowledge and in which workers perform duties that result in or contribute to the comfort,
convenience and hygiene of personnel and the student body or that contribute to the upkeep of
the institutional property.
14 WWU IR Z:\Report\Fac_Staff\fac admin ratio\Report - Faculty to Admin Ratio.docx
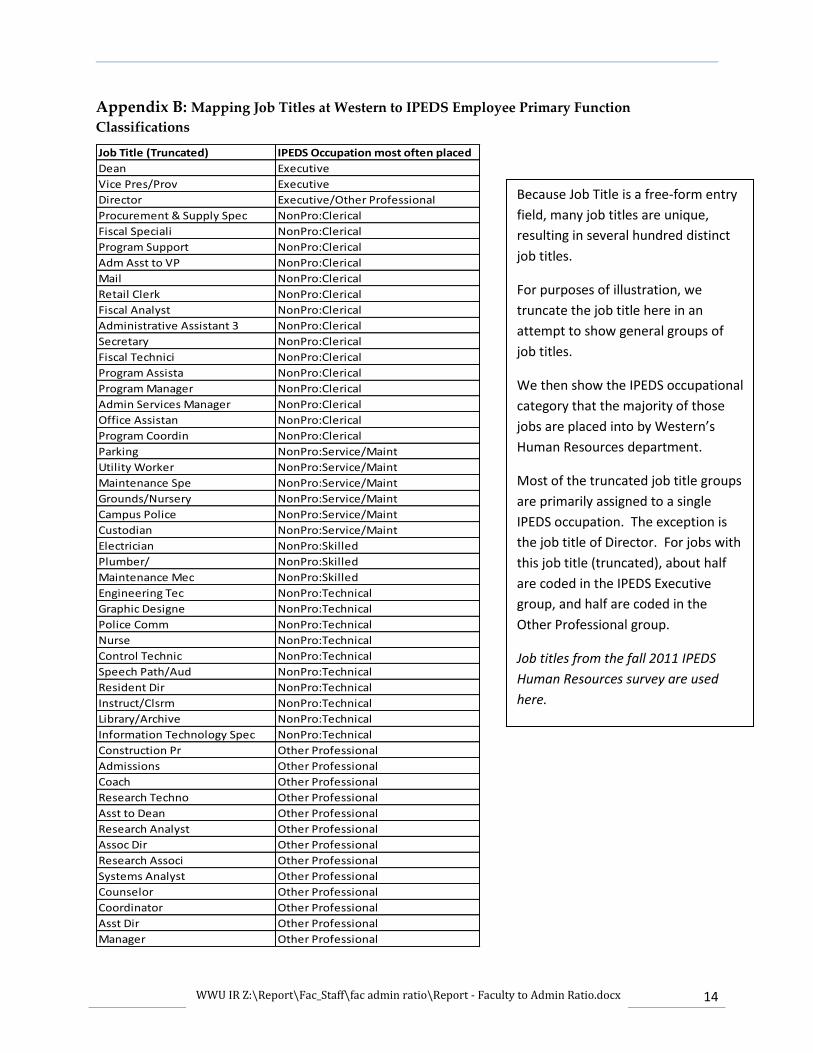
Appendix B: Mapping Job Titles at Western to IPEDS Employee Primary Function
Classifications
Job Title (Truncated) IPEDS Occupation most often placed
Dean Executive
Vice Pres/Prov Executive
Director Executive/Other Professional
Procurement & Supply Spec NonPro:Clerical
Fiscal Speciali NonPro:Clerical
Program Support NonPro:Clerical
Adm Asst to VP NonPro:Clerical
Mail NonPro:Clerical
Retail Clerk NonPro:Clerical
Fiscal Analyst NonPro:Clerical
Administrative Assistant 3 NonPro:Clerical
Secretary NonPro:Clerical
Fiscal Technici NonPro:Clerical
Program Assista NonPro:Clerical
Program Manager NonPro:Clerical
Admin Services Manager NonPro:Clerical
Office Assistan NonPro:Clerical
Program Coordin NonPro:Clerical
Parking NonPro:Service/Maint
Utility Worker NonPro:Service/Maint
Maintenance Spe NonPro:Service/Maint
Grounds/Nursery NonPro:Service/Maint
Campus Police NonPro:Service/Maint
Custodian NonPro:Service/Maint
Electrician NonPro:Skilled
Plumber/ NonPro:Skilled
Maintenance Mec NonPro:Skilled
Engineering Tec NonPro:Technical
Graphic Designe NonPro:Technical
Police Comm NonPro:Technical
Nurse NonPro:Technical
Control Technic NonPro:Technical
Speech Path/Aud NonPro:Technical
Resident Dir NonPro:Technical
Instruct/Clsrm NonPro:Technical
Library/Archive NonPro:Technical
Information Technology Spec NonPro:Technical
Construction Pr Other Professional
Admissions Other Professional
Coach Other Professional
Research Techno Other Professional
Asst to Dean Other Professional
Research Analyst Other Professional
Assoc Dir Other Professional
Research Associ Other Professional
Systems Analyst Other Professional
Counselor Other Professional
Coordinator Other Professional
Asst Dir Other Professional
Manager Other Professional
Because Job Title is a free-form entry
field, many job titles are unique,
resulting in several hundred distinct
job titles.
For purposes of illustration, we
truncate the job title here in an
attempt to show general groups of
job titles.
We then show the IPEDS occupational
category that the majority of those
jobs are placed into by Western’s
Human Resources department.
Most of the truncated job title groups
are primarily assigned to a single
IPEDS occupation. The exception is
the job title of Director. For jobs with
this job title (truncated), about half
are coded in the IPEDS Executive
group, and half are coded in the
Other Professional group.
Job titles from the fall 2011 IPEDS
Human Resources survey are used
here.