benchmarking assessment - stanford university · 2 benchmarking assessment the information...
TRANSCRIPT

Benchmarking Assessment 1
For nearly two decades, the establishment of strategies for assessing collegeoutcomes has concerned educators, policymakers and accrediting agencies alike. Atthe state level this search for appropriate policy and measurement mechanisms hasinvolved leading policymakers and the leaders of public colleges and universities.For about the same time, leaders of regional accreditation associations have alsosought ways to cause colleges and universities to assess the outcomes of college.The extent to which each state and regional accrediting association has succeeded inboth establishing good policies and constructing useful measurement strategies arematters in need of exploration.
This report presents the first results of a multistage research process by theNational Center for Postsecondary Improvement (NCPI) that aims to explore theprogress that has been made by the 50 states and six regional accrediting associa-tions during the past decade toward establishing and implementing higher educationassessment policies. The primary interest of NCPI is in policies and practices thatseek to improve teaching and learning in the nation’s colleges and universities. Whilethis first report focuses upon policies adopted by the 50 states and the six regionalaccrediting associations to assess teaching and learning, it also includes the broaderoutcomes assessment policies of the states anD regional accrediting associations.Examining both the emphases on teaching and learning and other aspects of collegesand universities helps reveal the priorities that state policymakers and regional ac-crediting associations are giving to teaching and learning, compared to other com-ponents of colleges and universities.
This report presents the results of the first of four stages of research to beconducted from 1996 through 2001. This first report investigates how various as-sessment policies and practices relate to teaching and learning. In this first stage,during the first year of NCPI, the researchers reviewed the literature of prior re-search on state assessment and regional accreditation policies, examined policy docu-ments of each of the 50 states, examined the policy and standards documents of theregional accrediting associations, discussed the policies and procedures with statehigher education governance and regional accreditation officers, and requested reac-tions from state higher education and regional accreditation officers to the draftreports prepared by NCPI researchers about their state or accrediting association.
BENCHMARKING ASSESSMENTAssessment of Teaching and Learning for Improvement and Public Accountability:
State Governing, Coordinating Board & Regional Accreditation Association Policies and Practices
The Background
NCPI objectives
This contribution

2 Benchmarking Assessment
The information presented in this report includes a brief history of thestate and regional assessment policy development, a review of the published andunpublished findings of prior research, an analysis of the status of assessmentpolicies and practices across the 50 states and six regional accrediting associa-tions, and a review of the published standards, criteria and guidelines of the re-gional accreditation associations and the policy documents of the state highereducation agencies in each state.
This report contains the following four features:· first, it presents a brief historical overview of the assessment policies and
practices of regional accrediting associations and the states;· second, it presents a review of the past research dealing with state and re-
gional accreditation policies and practices on outcomes assessment in highereducation;
· third, it presents a comparison and contrast of the assessment policies of theregional accreditation associations and the 50 states;
· and fourth, it presents each state policy and each regional accreditation policyrelated to college and university outcomes assessment within a policy ana-lytic framework that describes the policy and presents its major components.
The rationale offered by accreditation associations and the states for adopt-ing assessment practices has varied, but there are some common themes/phrasesthat emerge across the nation, including the following:· increasing public accountability to taxpayers whose taxes provide the largest
single source of funding for colleges and universities;· ensuring quality to citizens by providing concrete evidence about the instruc-
tional performance of the colleges and universities that they are consideringattending or otherwise supporting;
· identifying strengths and limitations of colleges and universities for purposes ofstate planning;
· achieving greater efficiencies in state systems of higher education and withinindividual institutions;
· identifying new criteria to use in funding colleges and universities; and· increasing international, interstate, and intra-state competition for high quality
higher education.
Report contents
A historical overviewReview of researchState comparisons
Policy analyses
Rationale included:accountability
evidence of qualitystrengths/limitationsgreater efficiencies
criteria identificationnew competitiveness
Why assessment?
Report structure

Benchmarking Assessment 3
The state policy and regional accreditation association approaches to in-stituting higher education assessment have covered a broad spectrum from lowexpectations and limited intrusion at one end of the spectrum, to very high expec-tations and external involvement in measuring outcomes at the opposite end. Thepolicies that reflect low expectations and no intrusion typically focus upon per-suading regional accrediting associations to establish new policies or encouragingcolleges and universities to voluntarily plan and conduct assessments with no clearconsequences. More aggressive policies include state laws that require collegesand universities to measure and report their quality and performance, or fundingformulas that provide incentives or rewards to colleges and universities for eithercarrying out assessments or for performance on various types of assessments. Thetechniques for measuring quality and performance have also varied widely fromadministering standardized tests that measure undergraduate student achievementto consumer-oriented surveys of student and alumni satisfaction and self percep-tions of their own achievement and the effectiveness of their alma maters.
Each regional accrediting association and state has a unique and distinc-tive history regarding college and university assessment policies. Much of theirdistinctiveness is an artifact of their unique state customs/traditions and their geo-graphic and cultural heritage. So even when different regional accrediting associa-tions and states appear to use similar language to describe their policies and imple-mentation strategies, they are often dissimilar. Each state agency was foundedunder different circumstances and is possessed of different statutory authority foradopting and carrying out assessment policies. For some, the central focus ofassessment is upon student learning and development and instructional quality,while for others, broader criteria are important and assessment of teaching andlearning plays a relatively minor role in a multidimensional policy that includesaccess, administrative efficiency, research, development, and overall productivity.Each of the six regional accrediting associations has established higher educationassessment standards and criteria during the past 12 years and each one is unique.Only a handful of states has failed to establish higher education assessment poli-cies and even these few have different reasons why they lack policies, and differentestimates about when they will achieve these.
The subsequent three stages of the research will begin after this report iscompleted and will examine state and regional assessment policies more inten-sively. In the second stage, a survey of the 50 states and the six regional accredit-ing associations will reveal greater details about statutory authority of the statesand the opinions of policymakers, higher education and regional accreditationleaders about the effectiveness of their policies and practices. In the third stage,we will visit a selected variety of states and regional accreditation associations
Policy spectrum
The next research
state surveysite documentation
State variations

4 Benchmarking Assessment
with different assessment policies and practices to document how the policies arebeing implemented and their impact on improving teaching and learning on thenation’s campuses.
HISTORICAL OVERVIEW — THE STATES
The impetus for colleges and universities to periodically assess the qual-ity of teaching and learning on campus has been manifold. As of the mid-1980sthe catalysts for the assessment movement in higher education have includedadditions of assessment standards in regional accreditation for colleges and uni-versities, burgeoning state policy initiatives, national reports from a variety ofleading special commissions, and funded institutional projects such as the KelloggFoundation support of University of Tennessee’s performance funding initiatives(Banta & Moffett, 1987). State higher education governance and regional ac-crediting association interest in outcomes assessment are not, however, recentdevelopments.
Since the establishment of land grant colleges and universities in the midand late 19th century, states have been concerned with and involved in the effec-tive workings of their public postsecondary institutions. The historic foundationsfor state involvement in public higher education have rested on long-standingconcerns for whether state commitments to access, economic development withinthe state, and the cultivation of a skilled citizenry are being adequately addressedby their public colleges and universities (Ewell, 1985a, 1985b, 1987; Fisher, 1988).
The post-World War II expansion of student enrollments and federal fund-ing of student aid and institutional research have increased government involve-ment in institutional policies and practices (Bender, 1983; Sabloff, 1997). In 1939-1940 the federal government was the source1 of just over $38 million of therevenue generated by higher education institutions. In 1959-1960 that amountexceeded $1 billion, and by 1979-1980 the amount of federal funding appropria-tions to institutions of higher education had grown to nearly $9 billion.
The growth in state government contributions to higher education insti-tutions2 was even more dramatic over this period of time, increasing from $151million in 1939-1940 to $1.3 billion in 1959-1960, and to over $18 billion in1979-1980 (NCES, 1995, p. 333). This increase in higher education dollars fromfederal and state government has prompted increased concern at all levels about
The next research
1 The source for this information is the U.S. Department of Education, National Center forEducation Statistics. These dollar figures do not reflect federally supported student aid thatis received through students, which is included in another category of information on thetable from which these figures were drawn.
2 Includes federal aid received through state channels and regional compacts, through 1959-1960.
State funding soarsto over $18 billion
by 1979-1980.
Federal funding risesto nearly $9 billion
by 1979-80.
Involvement begins

Benchmarking Assessment 5
the effective and efficient use of valuable and highly competitive resources andaccountability by the colleges and universities that receive the resources (Stevens& Hamlett, 1983).
In spite of the growth in the financial resources and size of colleges anduniversities, the new responsibilities for assessment are a consequence of a shift inthe priorities in public higher education over the past 15 years away from expan-sion in the number and size in favor of greater emphasis upon quality. As early as1979, a distinguished leader of public higher education in Ohio, John Millett, fore-told the changing emphasis in the role and focus of state-level, centralized layboards:
“State boards of higher education are going to hear a great dealabout quality in the next several years. We have talked aboutquality in public higher education in the past, but I believe it isfair to say that at the level of state government our necessarypreoccupation in the 1960s and 1970s was with quantity ratherthan quality. Now state governments will be told that it is time togive renewed attention to the quality of our higher educationendeavors” (Millett, 1979).
Fisher (1988) confirms the accuracy of Millett’s forecast and contendsthat the renewed attention to quality fostered new levels of state legislative in-volvement in the affairs of public higher education institutions. Despite long-standingstate concerns for institutional quality and effectiveness, the 1980s saw some statesmade explicit their expectations for more systematic and coordinated approachesto assessment and the demonstration of specific outcomes. For example, in 1982the Florida state legislature directed the higher education system to develop theCollege-Level Academic Skills Test (CLAST) as a rising junior exam. In 1984 theSouth Dakota Board of Regents adopted Resolution 32-1984 which created atesting program designed to measure students academic performance. In 1985 theNew Jersey Board of Higher Education created the College Outcomes EvaluationProgram (COEP), a comprehensive outcomes assessment program.
Throughout the 1980s, a flurry of national reports hailed the need for sub-stantive educational reform. Included among the organizations and reports thatcritically analyzed the declining quality and lack of accountability of postsecondaryeducation were: the Association of American Colleges’ Integrity in the CollegeCurriculum: A Report to the Academic Community (1985); the National Instituteof Education’s Study Group on the Conditions of Excellence in American HigherEducation, Involvement in Learning (1984) report; and the National Endowmentof the Humanities, in To Reclaim a Legacy: A Report on the Humanities in HigherEducation (1984).
The 1980s weremarked by a shift from quantityto quality concerns
Quality concerns
Some states demanddemonstrationsof specific outcomes.
Critical reports addedto pressures foreducational reform.

6 Benchmarking Assessment
Ewell proposals
Ewell proposes newstate mechanisms to
induce institutionalimprovements.
At about the same time, Peter Ewell (1985a) authored an influential work-ing paper for the Education Commission of States, arguing that state govern-ments should get involved in assessing undergraduate education because of theirsignificant financial investment in their systems of higher education and becausesuccessful higher education systems should, in turn, facilitate the meeting of otherstate policy objectives. According to Ewell, in order for states to have an influ-ence on their institutions, they must develop funding and regulatory policy mecha-nisms that induce institutional-level efforts toward self improvement and monitorthose institutional efforts by regularly collecting and reporting on identified meas-ures of effectiveness (Ewell, 1985a, 1985b).
Recognizing the historical and distinctive character of public colleges anduniversities as self-governing, autonomous cultures, Ewell (1985a) posits thatlasting changes, particularly the now publicly demanded improvements expectedof higher education, need to come from within the educational institutions them-selves. Citing examples of past and ongoing state policy mechanisms as referencepoints, Ewell (1985c) urged state policymakers to follow certain guidelines foraction, including the following six:· recognize and preserve institutional diversity;· create positive incentives for improvement;· distinguish funding incentives for improvement from ongoing institutional funding
mechanisms;· afford institutions discretion in achieving improvement, but hold all account-
able for regularly demonstrating their progress;· stress use of concrete information on, as well as, multiple indicators of institu-
tional performance;· and whenever possible use existing information.
Among the national reports decrying the need for educational reform andseemingly responding to Ewell’s observations of how states could influence in-stitutional assessment, is the National Governors Association (NGA) 1986 re-port, Time for Results: The Governors’ 1991 Report on Education. In the pref-ace of the report, Task Force Chairman John Ashcroft, then Governor of Mis-souri, defended state intervention:
“The public has the right to know what it is getting for itsexpenditure of tax resources; the public has a right to know andunderstand the quality of undergraduate education that youngpeople receive from publicly funded colleges and universities.They have a right to know that their resources are being wiselyinvested and committed.”
The states’ role in the assessment movement was considered paramount by thisrepresentational body. “As the primary source of funds for public higher educa-
Ewell guidelines:recognize diversity
create incentivesdifferentiate funding
allow discretionpick multiple indicators
use existing data
Governors’ stance

Benchmarking Assessment 7
tion, the states have a major stake in the quality of postsecondary education thatgoes beyond the measures of input and processes. State attention must be di-rected to the outcomes of the higher education system – namely measuring howmuch students learn in college” (Roaden, 1987, p. 9).
The National Governors Association formed seven task forces to formu-late policies to improve various aspects of education. Six of the seven task forceswere charged with matters related to elementary and secondary schools; the sev-enth was the Task Force on College Quality. Based upon the testimonies andadvice of higher education officials and professionals from assessment organiza-tions and national education associations, the Task Force on College Qualityrecommended the following five actions regarding college outcome assessment:· State officials should clarify the missions of each public institution and en-
courage the same for independent colleges;· State officials should re-emphasize the fundamental importance of under-
graduate instruction;· Each college and university should implement programs that use multiple
measures to assess undergraduate student learning as a means of evaluatinginstitutional and program quality and share the information with the public;
· State officials should adjust funding formulas to provide incentives for im-proving undergraduate student learning based upon the results of compre-hensive assessment programs and encourage independent colleges to dolikewise;
· State officials should reaffirm their commitment to access to public highereducation for students of all socioeconomic backgrounds (National Gover-nors’ Association Center for Policy Research and Analysis, 1986).
As a link between the suggested mandates of the NGA Report and actualpractices at the state level, the State Higher Education Executive Officers (SHEEO)formed a Task Force on Program and Institutional Assessment to enlarge uponNGA’s recommendations. In recommending 10 approaches to outcomes assess-ment, the SHEEO Task Force emphasized institutional flexibility and autonomyin assessment at the campus level. While wanting to honor institutional independ-ence the Task Force also saw the need to acknowledge “the role of statewideassessment in relation to assessment at each campus as the upper part of a pyra-mid. There are certain common aims of higher education that should be subject tostatewide assessment, but in no way should these exhaust the assessment under-taken at each campus” (Roaden et al., 1987, p. 2). Clearly SHEEO was treadingcarefully amidst a culture now characterized by both the need to honor institu-tional autonomy and the needs of states for detailed information on how theirpublic institutions are faring on a variety of measures of quality and effectiveness.
Quality task force
Five recommendations:clarify missions;emphasize undergrads;use multiple measures;provide incentives;recommit to access.
Autonomy stressed
SHEEO Task forcecompromises between independence ofinstitutions andstate needs foroutcomes measures.

8 Benchmarking Assessment
12 have statutes;21 have policies;8 combined both
— see Appendix A.
SHEEO’s policy statement on program and institutional assessment rec-ommended that states develop uniform definitions of graduation and retentionfor institutional comparison. SHEEO urged financial incentives for higher qual-ity instructional programs, and the inclusion in institutional budgets of fundingfor assessment programs. Public colleges and universities were called on by thestates to assess entering students for purposes of placement and remediation,and to determine the achievement of general education objectives, the perform-ance of students on licensure and certification examinations, the successful place-ment of students from occupational programs into matching jobs, the successfultransfer of community college students to four-year institutions, and the satisfac-tion of alumni (Roaden et al., 1987).
Leading up to or either immediately following the NGA 1986 report andSHEEO’s policy statement, the state legislatures and governors in Florida andColorado passed statutes and the states of California, Florida, Georgia, SouthDakota, Tennessee and Utah established policies. Today 12 states have statutes,21 have policies, and eight have a combination of statute and policy that requirecolleges and universities to assess student outcomes.
Like accreditation standards, state statutes and policies have varying goalsand objectives as well as methods they use to assess progress toward achievingtheir goals. Some state initiatives are aimed toward determining student eligibil-ity to progress to the higher levels in the curriculum or to qualify for a degree;some are aimed toward helping policymakers allocate resources; still others areaimed at curriculum and program evaluation; and others have the singular goalof public accountability. This research project is particularly interested in under-standing whether states have policies and practices in place to examine the na-ture and outcomes of teaching and student learning. A description of each state’scurrent statutes and policies and their evolution is presented in Appendix A.
HISTORICAL OVERVIEW — ACCREDITATION ASSOCIATIONS
Accreditation is a uniquely-American construction, characterized as avoluntary, self-regulating, evaluative process that combines outside peer reviewand consultation of institutions with internal evaluation and planning. The ac-creditation process emerged as a national concern and practice at the 1906 meet-ing of the National Association of State Universities (NASU), where a corps ofhigher education leaders including representatives from the four existing regionalassociations recommended the development of common institutional definitions
States take action
Objectives varied
1906 first mention

Benchmarking Assessment 9
3 The Western Association of Schools and Colleges was founded much more recently, in 1962.The remaining five regional accrediting associations were founded in the indicated years:New England Association of Schools and Colleges, 1885; Middle States Association ofColleges and Schools, 1887; North Central Association of Colleges and Schools, 1895;Southern Association of Colleges and Schools, 1895; and the Northwest Association ofSchools and Colleges, 1917 (Bemis, 1983).
and standards of college admissions (Young, 1983). Since their founding at theturn of the twentieth century3 , the historic role of the six regional accreditingassociations in the United States has expanded and is now manifold. Originally theassociations assisted in defining criteria for the transition from high school to col-lege and establishing institutional requirements for membership in their organiza-tion (Young, 1983). Practices and priorities in accreditation have experienced con-siderable change over the years: from working to fit all institutions into a commonmold to recognizing and encouraging institutional uniqueness and diversity; andfrom judging institutional adherence to criteria to facilitating institutional improve-ment (Young, 1983).
Even though the chief administrative and academic leaders of colleges anduniversities constitute the governing bodies of these accrediting associations, theyhave maintained the public image of being impartial judges of the quality of theircolleges and universities. They establish the policies by which accrediting associa-tions operate, set the standards by which institutions are judged, and ultimatelyapprove whether member institutions that seek to be accredited (every five to 10years) meet accreditation standards.
A stamp of approval by any of the six regional accrediting associations formany years has been tantamount to approval for funding both by the federal gov-ernment and by state governments. Since the 1952 Veterans Re-adjustment Act,the federal government has relied upon regional accrediting associations to deter-mine which colleges and universities were of sufficient quality to receive federalfunding (Section 253 of Pub. L. 82-550; 66 STAT.675). All federal statutes since1952, wherein funds are appropriated to higher education institutions, contain astatement by Congress requiring the U.S. Commissioner of Education, now theU.S. Secretary of Education, to publish a list of nationally recognized accreditingassociations that are reliable authorities on the quality of training or educationoffered by postsecondary institutions (Finkin, 1973; Kaplin, 1975). In additionevery state has a “Postsecondary Education Authorization Act” requiring highereducation institutions to be approved by a designated state agency (generally thecentralized governing/coordinating board) or be accredited by an accrediting as-sociation in order to be licensed to operate in the state.
Colleges and universities also rely upon accrediting associations to decidewhether to accept course credits from students transferring from other academic
Impartial image
Linked to funding
Federal statutesthat provide fundsrequire list ofaccrediting bodies

10 Benchmarking Assessment
institutions; and graduate and professional schools rely upon them when admit-ting students by taking into account the quality of their undergraduate institu-tions.
Despite the long tradition and widespread public dependence upon re-gional accrediting associations, two decades ago William Troutt (1978) pointedout the growing number of criticisms by state policy makers, government leadersand campus officials that accrediting associations lacked standards to providequality in teaching and learning. Troutt (1978) observed,
“regional accreditation standards primarily serve purposesother than quality assurance. Most standards relate to institu-tional self-improvement. The perfection of institutional “ma-chinery” far outweighs concerns about institutional quality interms of student achievement” (p. 49).
Critics have charged that the standards used by regional accrediting associationsplace heavy emphasis upon inputs such as admissions scores of entering students,the number of books in the library, the size of the endowment and the physicalplant, and the credentials of the faculty, without being concerned about outcomesand results (Troutt, 1978).
In 1980, Young and Chambers (1980) offered commentary on the con-tinuing evolution of the accreditation process, and noted, in particular, the emergingfocus on clearly defining and measuring expected educational outcomes duringthe institutional self-evaluation process. In 1983 Stark and Austin observed that“considerable criticism has recently been aimed at accreditors because of theirfailure to take an explicit interest in student needs and development” (p. 214) andthey predicted that the ways in which the measurement of educational qualitycaptured and informed students’ educational experiences would be of tremen-dous relevance to the higher education community, its critics and its benefactors.
While state involvement in assessment was the target of considerable scru-tiny and discussion as of the mid-1980s so, too, were the regional accreditingassociations. As Albrecht (1989) observed, regional accrediting associations wereat a crossroads, pondering whether they would continue to be effective instru-ments for ensuring quality or become obsolete.
The NGA Governors’ 1986 Action Agenda chided the regionals to bemore explicit about the accreditation process. The NGA report emphasized theimportance of accrediting associations collecting and utilizing information aboutundergraduate student outcomes. According to the NGA (1986), demonstratedlevels of student learning and performance should be a consideration in grantinginstitutional accreditation (NGA, 1986). And the SHEEO Task Force on Pro-
States take action
Outcomes needed
Changes endorsedurgedsuggestedGovernors urge
regionals towardgreater emphasison undergraduatelearning outcomes

Benchmarking Assessment 11
New processes
Table 1Regional Accreditation Association, Year of Outcomes Assessment Policyand Name of Policy, Standard, or Statement
Southern Association of Colleges and Schools 1984 Section III of Criteria:Institutional Effectiveness
Middle States Association of Schools and Colleges 1985 Standard for Outcomes Assessment1996 Policy Statement on Assessment
Western Association of Schools and Colleges 1988 Standard 2: Institutional EffectivenessStandard 4: Undergraduate ProgramsStandard 7: Student Services and theCo-curricular Learning Environment
North Central Association of Colleges and Schools 1989 Statement on the Assessment of StudentAcademic Achievement
New England Association of Schools and Colleges 1992 Policy Statement on InstitutionalEffectiveness
Northwest Association of Schools and Colleges 1994 Policy 25: Educational AssessmentStandard Five: Educational Programand Its Effectiveness
gram and Institutional Assessment recommended that accreditation agencies usethe results of institutional assessment, including assessment of student outcomesin the accreditation process (Roaden et al., 1987).
In 1986 the North Central Association of College and Schools (NCACS)held a Wingspread Conference on Rethinking Accreditation. In one of the papers,NCACS Commissioner Frederick Crosson wrote about the need for institutionalimprovement to play a greater role in the institutional review and accreditationprocess. Impetus for change in accreditation practices was coming from both in-ternal and external pressures and in recent years the associations’ role and focushas shifted toward providing quality assurance for higher education institutionsand serving as a catalyst for enhancing institutional quality and effectiveness(NEASC, 1996; Thrash, 1989). Through the continuation of institutional self-study and periodic peer review processes, accreditation has gauged institutionalquality by evidence of inputs, resources, and processes and more recently out-comes that reveal the extent of institutional quality (Young and Chambers, 1980).
As of the mid-1980s and early 1990s, outcomes assessment and, in par-ticular, the assessment of student learning and instructional processes began toemerge as means by which accrediting associations could continue to secure theirrole in ensuring the quality and effectiveness of higher education institutions. Ta-ble 1 illustrates that between 1984 and 1992 the six regional accrediting associa-tions revised and/or adopted accreditation standards and criteria, and in somecases developed new policies, separate from accreditation criteria or standards,explicitly aimed at assessing educational outcomes.

12 Benchmarking Assessment
The Southern Association of Colleges and Schools (SACS) led the re-gional associations in its early (1984) adoption of assessment as a means of meas-uring institutional effectiveness. Section III: Institutional Effectiveness, of its sixCriteria for Accreditation, addresses how institutions should approach the use ofinstitutional assessment for examining instructional practices and learning proc-esses and gauging overall institutional effectiveness. In order to plan and evalu-ate the primary educational activities of teaching, research, and public service, aninstitution must: “establish clearly defined purposes appropriate to collegiate edu-cation, formulate educational goals consistent with the institution’s purpose; de-velop and implement procedures to evaluate the extent to which these educa-tional goals are being achieved and use the results of these evaluations to im-prove educational programs, services, and operations” (Criteria for Accredita-tion, 1996, p.20). One of SACS’ current imperatives is that institutional successbe measured in terms of student achievement (Criteria for Accreditation, 1996).
Middle States Association of Schools and Colleges has 16 characteristicsof excellence which are used as accreditation standards. In 1985 the associationadopted a standard for outcomes assessment, which in the 1994 edition of theAssociation’s Characteristics of Excellence in Higher Education states that aninstitution’s accreditation is determined by the presence of “policies and proce-dures, qualitative and quantitative, as appropriate, which lead to the effectiveassessment of institutional, program, and student learning outcomes.” In the 1990edition of Framework for Outcomes Assessment, Middle States explicitly linkedinstitutional excellence and educational quality with the extent and quality ofstudent learning. According to Middle States an institution is effective when it isasking itself what should students be learning; how well are they learning it; howdo we know this; and what do we plan on doing with the answers. According tothe most recent edition of Framework, the “ultimate purpose of assessment is toimprove teaching and learning” (1996, p. 14).
In 1995 the association sought to determine its progress in outcomesassessment by surveying member institutions. One key recommendation result-ing from the responses urged greater associational guidance for how to go aboutassessing outcomes. In the fall of 1996, Middle States responded by institutingtraining symposia designed to provide information on effective outcomes assess-ment approaches and programs.
More than ten years after the initial adoption of assessment as an accredi-tation standard Middle States drafted a Policy Statement on Assessment (1996)reaffirming its expectation that institutions will attend to the assessment of stu-dent learning outcomes as their primary means of improving institutional quality.
Southern group
Middle States
Assessment firstseen as means of
measuringinstitutional
effectiveness
Association lists16 characteristicsof excellence for
accreditation
Training sessionsfollowed upon
member survey

Benchmarking Assessment 13
In 1988 the Western Association of Schools and Colleges (WASC) adoptedrevised accreditation standards with one of the new major emphases being theincorporation of assessment for assuring institutional and program quality andeffectiveness. The issue of assessment is found embedded in four sections of theassociation’s standards: institutional effectiveness (Standard 2.C), evaluation ofgeneral education (Standard 4.B), program review (Standard 4.F.5), and co-cur-ricular educational growth (Standard 7.A). The intent of this initiative has been tocreate a “culture of evidence within institutions such that the asking of questionsrelated to effectiveness of educational programs and support services is ongoingand appropriate data are collected to respond” (WASC Resource Manual, 1992,p.2). In 1995 the association created a Task Force on the Role of Accreditation inthe Assessment of Student Learning and Teaching Effectiveness. Their final re-port identified minimal institutional requirements for the assessment of learningand teaching and more importantly argued for the educational experience of stu-dents to become a central focus of the accrediting process. In July 1996 RalphWolff, Executive Director of WASC, stated that his goal was “to move the ac-creditation process to a much more learner- and learner-centered process” (Wolff,1996, p.1). To achieve this end, WASC is as of the spring of 1997 embarking on aseries of experimental self studies and visits which are putting assessment andlearning at the center of the accreditation process.
North Central Association of Colleges and Schools (NCACS) published aStatement on the Assessment of Student Academic Achievement in October, 1989.Comparable to Middle States, NCACS took and has held the position in twosubsequent revisions of the Statement, that the assessment of student learning isan essential component of measuring overall institutional effectiveness. And theultimate goal of assessment is the improvement of student learning. Two ofNCACS’s five criteria for accreditation emphasize the use of assessment in evalu-ating and improving teaching and learning at member institutions. Criteria Threeasks for evidence that “the institution is accomplishing its educational and otherpurposes.” Criteria Four looks for evidence that the “institution can continue toaccomplish its purposes and strengthen its educational effectiveness.” Of all thepossible outcomes NCACS member institutions might study as a means of docu-menting institutional effectiveness, none are required except for outcomes docu-menting student academic achievement.
As of June 1995 all member institutions were required to submit an insti-tutional plan demonstrating to NCACS how they intended to assess student aca-demic achievement on their campus. Those plans were reviewed and a report,Opportunities for Improvement: Advice from Consultant-Evaluators on Programsto Assess Student Learning, describing broad, emerging institutional developmentsand directions was published in March 1996 (Lopez, 1996).
Western group
North Central
1988 standardsemphasised useof assessment forinstitutional andprogram quality
Recent intentionsfocus on puttinglearner at centreof the process
Statements seeassessment ofstudent learningas essentialcomponent
14 Benchmarking Assessment
While the New England Association of Schools and Colleges (NEAS&C)has 11Standards for Accreditation, assessment was originally and is most directlyaddressed in its 1992 Policy Statement on Institutional Effectiveness. This policyemphasizes that, “an institution’s efforts and ability to assess its effectiveness anduse the obtained information for its improvement are important indicators of in-stitutional quality. The teaching and learning process is a primary focus of theassessment process.” Accreditation and assessment share the same end – ena-bling institutions to reach their full academic potential. The association Evalua-tion Manual states that “one institutional goal of NEAS&C’s effectiveness crite-ria is to cultivate within an institution a habit of inquisitiveness about its effective-ness with a corollary commitment to making meaningful use of the results of thatcuriosity.” According to the Background Paper used in training evaluation teammembers on issues of assessment, “the assessment of an institution’s effective-ness carefully differentiates between what graduates know and what the institu-tion has done to enable them to learn.”
As of April 1997, NEAS&C initiated the Student Outcomes AssessmentProject, an effort to assist its member institutions’ efforts to use student out-comes assessment for improvement of institutional effectiveness. The first stageof the project is a survey of institutional assessment efforts which will be subse-quently shared in aggregate form with member institutions. From the survey re-sults annual forums and publications will be designed and distributed as a form ofinstitutional support.
The Northwest Association of Schools and Colleges Accreditation Hand-book (1994) includes Policy 25: Educational Assessment. This states that educa-tional effectiveness is defined in terms of the change it brings about in students.Outcomes assessment is viewed as an essential component of the self-study proc-ess. Of the association’s 12 Standards for Self Study, Standard Five: EducationalProgram and Its Effectiveness is most explicitly related to assessment. Thesubcategories of this standard establish that educational program planning bebased on regular and continuous assessment. Assessment is to be well-integratedinto institutional planning. As well, institutions must be prepared to demonstratehow the evidence gathered via their assessment efforts is used to improve learn-ing and teaching.
The new accreditation standards seem to reflect a new era for regionalaccreditation in which every college and university seeking approval must en-gage in assessing the quality of their teaching and learning processes. Given therecent changes, the next phase of this research will seek to discover from theregional accreditors, the extent to which colleges and universities seeking re-approval are focusing upon the student learning and instructional improvement
New England group
Northwest group
Start of new era?
Criteria aim tostimulate colleges
to inquire abouttheir effectiveness
Policy defineseffectiveness in
terms of change iteffects in students

Benchmarking Assessment 15
aspects of the criteria. The variation in standards among the six regions coupledwith the lack of prescription as far as requiring specific instruments or methodsand procedures may explain why many state policymakers feel the need to de-velop statutes and policies around quality assurance. The complete standards onoutcome assessment for all six accrediting areas are presented in Appendix B.
REVIEW OF PAST RESEARCH
The climate of heightened expectations and burgeoning guidelines for stategovernment and regional accreditation association involvement in institutional as-sessment begs the question of the actual nature of state and accrediting associa-tion commitment to outcomes assessment. What state and regional accreditationassessment policies and practices exist? What has been their evolution over theperiod of time from the 1980s to present? Since 1987 four surveys regarding stateand regional accreditation association assessment policies and practices have beenconducted. This section describes these prior surveys and presents the importantand relevant findings.
As 1985-86 Chairman of the Education Commission of States (ECS), NewJersey Governor Thomas Kean initiated a three-year project called, Effective StateAction to Improve Undergraduate Education. As a means of informing this agenda,ECS, along with SHEEO and the American Association of Higher Education(AAHE) cosponsored a survey of the assessment and outcomes measurementpolicies and practices of the 50 states (Boyer, Ewell, Finney & Mingle, 1987a). InDecember of 1986 a structured survey was mailed to both the academic and ex-ecutive officers of the SHEEO network. Responses from all 50 states were ob-tained either in writing or over the phone. Profiles for each state were written “tocapture the flavor of each state’s response to the survey and to present a faithfulpresentation of that response, including what was not said, within appropriatestate context” (Boyer, Ewell, Finney & Mingle, 1987b, p. 7). Key findings fromthis survey included the following:
· As of 1987 two-thirds of states had formal assessment policies.· A trend toward institutional autonomy in design and implementation of assess-
ment approach was noted.· State boards were found to be playing an important role – two-thirds of states
had explicit statewide assessment program planned or in place. Most of thosestates without statewide efforts reported campus assessment activity.
· Assessment was broadly defined among the states and resulting assessment pro-grams that included everything from sophomore to senior testing programs,institutional and program reviews, using outcomes measures, to alumni sur-veys.
1987 joint survey
Findings included:formal policiestrend to autonomy;state boards active;activities inclusive;state role varied

16 Benchmarking Assessment
· The nature of state role in assessment varied, particularly in terms of the extentto which assessment and outcomes measurement were considered or had be-come a distinct policy or whether they were incorporated into already existingpolicy processes such as strategic planning or program review.
· The degree of state involvement varied. Approximately one-third of the statesplayed a minimal role, coordinating, monitoring, and reporting what individualinstitutions and/or systems were doing. In over one-half of the states, the board’srole was to “actively” encourage, promote or facilitate; “serve as a catalyst,”“provide incentives,” and “develop guidelines.” About 10 states were activelydesigning and implementing assessment programs, primarily in the form oftesting programs of some kind. “Most state boards recognize that assessmentis ultimately a campus responsibility” (Boyer, Ewell, Finney & Mingle, 1987b,p. 10).
The respondents commented on positive outcomes of state level involve-ment with assessment. With increased accountability came increased state finan-cial support for such programs as “centers of excellence” and other quality-fo-cused improvements. Institutional leaders found that state involvement facilitatedthe development of other internal reforms such as improved data gathering andcampus level program reviews. On the negative side, there had been an underes-timation of the extent of the costs for assessment programs. And assessmentitself was found to be not necessarily followed by improvement. A connectionbetween the two must continually be forged, one to the other.
From the perspective of those state policymakers filling out the 1987survey, the future of assessment was likely to be characterized by increased stateinterest and involvement in the next one to two years. A third of respondentsbelieved further development of tests and instruments measuring basic skills, gen-eral education outcomes, critical thinking and other higher order skills were inline. One fourth of the respondents anticipated assessment of entering studentskills, abilities, and attitudes along with alumni surveys. A majority expressedopinions that responsibility for designing and implementing assessment should bethat of individual institutions. If the institutions performed their jobs adequately,they would be left alone. Only a minority predicted the likelihood of further leg-islative action, but they acknowledged that the legislature was hard to predict.Perhaps the most powerful observation resulting from the 1987 ECS survey wasthat “governors and legislators have placed the quality of undergraduate educa-tion and student learning on the state agenda. The state boards aim to keep itthere” (Boyer, Ewell, Finney & Mingle, 1987b. p. 9).
Outcomes varied
State role certain

Benchmarking Assessment 17
In the fall of 1989 ECS, SHEEO, and AAHE cosponsored a second sur-vey on state initiatives in assessment and outcome measurement which was mailedto SHEEO academic officers (Paulson, 1990). From the returned surveys and insome unidentified cases, from relevant reports and policies which were returnedwith the questionnaires, a common format describing statewide or systemwideapproaches to assessment and outcomes measurement was developed for eachstate. For each of the 50 states the following information was included, if avail-able: origins of the initiative, description of initiative, primary purpose of assess-ment, collection (or lack thereof) of common data or test results, reporting re-quirements for institutions, whether state approval was required for institutionalinitiatives, funding, and anticipated future evolution or development of assess-ment initiatives. Ewell, Finney and Lenth (1990) describe the emerging pattern ofstate-based assessment, particularly as it compares to the findings of the 1987survey. The following developments were noted:· States could more fully document their assessment efforts. They had gone from
discussion and planning to implementation.· “A sharper image of assessment had emerged among state leaders” (Ewell, Finney
and Lenth, 1990, p. 3). There was now recognition that assessment of collegeoutcomes was different from assessment of basic skills upon entry.
· Most states saw the primary focus of assessment to be student learning. Whilestudent persistence and satisfaction studies were still prevalent, they were notviewed as assessment in and of themselves.
· Assessment had evolved into an identifiably distinctive policy arena at the statelevel.
· Distinct variations among states’ policies were found to persist.· While an assessment of student learning was required by all states, the approaches
varied.· All institutions required reporting of some kind, but content and format varied.· Some policies and programs were funded by new state dollars; many more were
financed using state appropriations from base budgets.· Only 8 of 48 reporting states (ND, DE, NB, OK, PA, MI, VT, and WY) indi-
cated they had no assessment practices or policies in place or planned.· Just over half (27) of the states reported having in place “an identifiable assess-
ment initiative.”
Four emerging themes were observed by Ewell, Finney and Lenth (1990).First, assessment had made considerable advancement from the experimental tothe mainstream of state policy. Second, institutional flexibility, and to a great de-gree autonomy persisted. Despite institutional-based fear that assessment instru-ments would be mandated by the state, this practice remained a relative rarity.
1990 joint survey
Findings included:more documentationmore sophisticationfocus on learningdistinct policy areadiffering policiesvaried approachesvaried reportingsome new fundingno plans in 8 states27 states operational
4 themes emerge
assessment routineautonomy persistsinstitutions payimprovement focus

18 Benchmarking Assessment
Commonality in cognitive outcomes testing was in place in four states (FL,GA,NJ, TN). Four states reported common basic skills testing (TX, NJ, AK, VT).Four states reported periodic use of common alumni and student surveys and 12states reported the development of statewide comparative student retention data.The third emerging pattern was the strong trend toward institutional responsibil-ity for financing assessment. Assessment should have been interpreted not as anadd-on commanded by the state, but as something institutions should naturally beengaged in. The fourth and final trend noted by this survey was that improvementcontinued to be a stronger theme than accountability within the state initiative.Thirty-one of the states viewed assessment’s primary purpose as institutionalimprovement or curricular revitalization, while three states thought the primarypurpose of assessment was the development of more uniform academic stand-ards. Six of the respondents believed the primary purpose was demonstrating theeffectiveness of higher education to the legislature and the public.
As of 1990 an emergent policy consensus was evident. “State leaders arebeginning to agree that when handled properly, assessment can be a powerful‘lever for change’” (Ewell, Finney & Lenth, 1990, p. 5).
4 themes emergeIn February of 1995 American College Testing mailed a postsecondary
assessment needs survey to each state commission, the six regional accreditingassociations for higher education, 223 four-year regional state colleges and uni-versities, 177 two-year public colleges and 33 national higher education associa-tions and agencies. The goal was to capture a snapshot of current assessmentpractices and concerns, as well as future anticipated directions for assessment(Steele and Lutz, 1995). Responses were received from 33 states, 4 regionalaccrediting associations, one-third of institutions, and only 3 of the national asso-ciations/agencies. A Focus Group was referred to, but neither a description of theapproach or the participants, nor questions asked were included in the final re-port.
The resulting report identified broad contextual elements which accord-ing to the respondents were currently shaping and which were expected to affectthe future of the assessment movement. These involved external pressures fromstate and federal agencies, which were a major force in shaping the movementtowards outcomes assessment. Accrediting agencies were now asking institu-tions to document institutional effectiveness via the measurement of studentachievement and learning.
Future factors that would keep accountability issues at the forefront ofconsiderations included, “workforce development issues; training coupled withwelfare reform; and changes in instruction brought about by the growth of dis-tance learning” (Steele and Lutz, 1995, p. 2).
1995 ACT survey
Report identifiedfactors shaping
assessment as:governmental forces
workforce issueswelfare reform
distance learning

Benchmarking Assessment 19
Survey findings
State board aims
Key Findings from the survey:· States saw assessment of higher education as an important concern.· Twenty of 33 responding state boards expressed an interest in or need for the
development of common measures.· Areas where outcomes assessment were seen as most important included gen-
eral education and foundation skills.· Half of the colleges that responded identified concerns with the ability to define
and assess general education, and the absence of faculty involvement in theassessment process (It is not clear who filled out institutional surveys, whichmight clarify the positions of those concerned about this lack of faculty involve-ment).
Key findings from Focus Groups:· The desire for more funding on the part of institutions was now paired with their
burgeoning recognition that funding would be or already was directly linkedwith assessment activities.
· State and federal pressures were resulting in more of a compliance mode thanefforts aimed at improving quality on the part of institutions.
· Legislature and public were calling for greater accountability, not necessarilyimprovement.
· Institutional climate was one of anxiety rooted in comparison and evaluationuses of assessment data and processes.
State Boards identified specific concerns/questions they wanted answered.They included:· The desire to understand how institutions measure accurately what students
gain from their enrollment in the institution versus what skills and knowledgethey already possess upon enrolling (issue of value-added, capabilities of pre-and post-testing students).
· Are students developing an adequate level of general education skills?· How are institutions using outcomes information for improvement in multiple
areas, including the curriculum?· What indicators exist to demonstrate status of students and institutions (i.e.
graduation rates)?· How can the state determine if the measures institutions are using are valid and
reliable?
Steele and Lutz (1995) note from the results of the survey that “stateboards express much more concern than colleges about the meaningful use ofassessment data to improve effectiveness and efficiency in teaching/learning.
Focus group data

20 Benchmarking Assessment
However, they do not indicate much greater awareness of the difficulties in intro-ducing substantive change or the need for a variety of support structures andincentives to support change efforts” (p. 6).
In December of 1995 the National Center for Education Statistics (NCES)held the third workshop in a series examining the assessment of learning at thecollege level with representatives responsible for postsecondary assessment ac-tivities in the 50 states and selected territories, plus assessment experts and NCESstaff. Participants were asked to complete a pre-workshop inventory characteriz-ing the origins and development of their assessment approach, kinds of assess-ment instruments used, obstacles to assessment initiatives, and methodologicalproblems encountered. NCES wanted to examine the extent and characteristicsof state-level postsecondary assessment activities.
“Because it was expected that states would differ in both ca-pacity and approach, the posed question was not whether rawstate results could be summarized into a single indicator.Rather it was the degree to which these many state effortsmight help to paint a broader collective picture of collegiateattainment in relation to broadly-identified workplace andsocietal skills” (NCHEMS, 1996, p. 3).
The purpose of capturing and characterizing what the 50 states were do-ing was the intention to “determine the degree to which the results of such activi-ties are sufficiently consistent with one another and the domains addressed byGoal 6.5 [of the National Education Goals] to provide an initial basis for con-structing a national indicator of collegiate achievement. In this respect the infor-mation provided by the state background papers indicated that current state pro-grams could not provide such a basis” (NCHEMS, 1996, p. 5-6). Gathering stateinformation was a means to an end — not the single focus of this design.
sKey findings included the following:· Little substantive change noted since 1989/90 study.· More states were explicitly involved in assessment initiatives.· Most still used “institution-centered” approach that encouraged development
of local plans, use of results, and did not require common measures.· Focus shifted from improvement to accountability. Wider political context re-
vealed growing emphasis on governance and fiscal matters were predominat-ing over issues of educational improvement. Concerns about quality were be-ing replaced by concerns about productivity.
· Institution-specific outcome measures did not translate well to such externalaudiences as state officials, parents, and students. Therefore more considera-tion was being given to development and reporting of common measures.
· Move from formative toward summative approaches.
1995 NCES survey
NCES findings
One questionwas whetherassessment
could providea single indicator
of collegiate attainment
Findings included:more states activeinstitutional focus
accountability aimmeasures unclear
more summative

Benchmarking Assessment 21
· Overall, about half the states had institution-centered policy approaches in whichinstitutions devised their own assessment methods according to general stateguidelines. About two-thirds of the institution-centered approaches were theresult of board mandates versus explicit legislation.
· While assessment policy patterns remained consistent, this report noted thatstates had de-emphasized actively enforcing assessment policies with institu-tions, because other policy concerns had taken precedence.
· Political instability of assessment agencies (e.g., abolition of NJ assessment pro-gram) and ongoing fiscal concerns required that assessment not just providedata, but be embedded in broader set of restructuring initiatives.
· Some states saw regional accrediting bodies as taking dominant role in requiringand enforcing institution-centered assessment activities.
· The de-emphasis on assessment enforcement was due to state dissatisfactionwith the ability of institution-centered approaches to address increasing pres-sure for public accountability.
· Approximately one-third of “institution-centered” states expected common per-formance indicators (mostly non-outcomes based) to be part of institutionalreporting requirements.
· Few (15%) states used or were developing a common outcome measure. Sev-eral “institution-centered” states were considering using common testing. Stateswere very interested in using common measures (17 collect/report measures ofinstitutional performance; 35 report graduation/completion rates) for studentassessment, but are constrained by “lack of appropriate instruments” and “costsof implementation and development” (not by any ideological problems with useof common testing).
· Compared to mid-1980s, assessment policies were now more likely to be linkedwith other policy initiatives, or systems of regulation and incentive. Assessmentdata were included in accountability report cards that contained information onfaculty work load, student completion rates, instructional costs. Assessmentpolicies were more frequently linked to funding.
· Assessment activities were being built into the basic operations of institutions insome states (e.g., use of performance-based or competency-based approachesto admission testing versus college entrance exams, or use of authentic assess-ment for credentialing in “virtual university”).
· Overall, quality of postsecondary education seemed to be losing importance as apublic policy issue (to prisons, health care, and tax reform); higher education isbeing viewed as primarily benefiting individuals and therefore less deserving ofpublic funds.
· Most important obstacles to assessment identified were: high costs of develop-ing assessment instruments; lack of appropriate instruments, lack of agreementon domains to be assessed; institutional resistance (faculty/research universi-ties).
· Most important needs identified: additional funding; training and staff develop-ment (for state agency staff, faculty, and information sharing among states);clear policy leadership from federal government.
Other survey viewson assessment:institution-drivenenforcement laxsome instabilityroles changingsome rethinkingcommonality lackingsome policy linksbasic routineloss of statusdevelopment costsfunding needs

22 Benchmarking Assessment
· In terms of actions to further assessment at the state-level, the report citedthe need to embed student assessment measures into existing statewide aca-demic program review processes, and work more closely with regional ac-creditation bodies to develop common performance standards.
It appears as though what states needed — uniform accountability infor-mation that is easily communicable to external audiences — was not what institu-tions needed — information that links changes in student outcomes to specificinstitutional experiences like curriculum and teaching methods. Lenth (1996) re-ferred to this as a “dynamic tension within assessment between the internal andexternal, between improvement and accountability, between formative andsummative uses, and between those doing it and those who need to know” (p.157).
Since the mid-1980s several studies describing the variety of state andregional accrediting associations’ assessment policies and practices have beenconducted. This research extends those efforts in several substantive ways. First,the ACT study (1995) was the only national study of assessment policies andpractices to include the six regional accrediting associations. While the ACT sur-vey was sent to the six associations, only four responded (Steele and Lutz, 1995).It is not clear which four. Moreover, the report does not include informationabout what the association assessment policies were and how they evolved overtime. Using a single conceptual template for analyzing original documents fromeach of the six accrediting associations, this report describes the associations’commitments to assessment for improvement of learning and teaching, includingexpectations and requirements for the kinds of outcomes measures to be consid-ered, and processes used in the institutional approaches to assessment (AppendixB).
This research extends what is currently known about state assessmentpolicies by constructing a policy framework for analyzing original policy docu-ments for each of the 50 states. Use of this conceptual framework makes it pos-sible to compare state policies from a common perspective. The studies citedearlier have relied upon survey responses from the states and have taken the formof descriptions of state policies from each state perspective without a commonframework. The lack of framework has impeded cross-state comparison. Priorresearch reports have “the flavor of each state’s response” (Boyer, et al., 1987),emerging patterns (Ewell et al., 1990), and a broader collective picture of colle-giate attainment (NCHEMS, 1996), but have not afforded a consistent state-by-state analysis. By focusing upon the policy context, policy type, policy stage, andoutcomes as a research framework this research provides a model for the system-atic collection, analysis, and dissemination of state policy information, and facili-tates cross-state comparisons.
Research critique
Framework needed

Benchmarking Assessment 23
Finally this policy analytic approach to the research makes it possible toanalyze whether and how regional accreditation and state policies and practicesconverge in the states, and show the interrelationships of policies established bythe state and by the accreditation associations.
FINDINGS — STATES & ACCREDITATION ASSOCIATIONSThis phase of the research gathered, analyzed and is now reporting infor-
mation that considers the variety of state and regional accreditation assessmentpolicies and practices and shows how they affect the improvement of institutionalclimate, student learning, and performance. The present status of assessment poli-cies and practices in each of the fifty states and the six regional accreditationassociations is reported in this section. Detailed analyses of the policies of the 50states and six regional accreditation agencies are presented in Appendix A and B.These analyses have been shared with state and accreditation agency administra-tors to verify the accuracy of interpretation. Feedback from these sources, withfew exceptions, supported the accuracy of analysis and in some cases clarified andaugmented the interpretation.
STATE ASSESSMENT POLICIES AND PRACTICES
In order to make a comprehensive report on the present status of stateassessment policies and practices, documents describing the assessment practicesand policies of each of the 50 states were requested, gathered, analyzed, and or-ganized. Appendix A presents an analysis of each of the states.
A review of the substantial amount of information received from the statesregarding their various assessment policies and practices led to the developmentof the conceptual framework to facilitate an analysis for each state. This frame-work also permits a comparative analysis of policies across states so commonalties,differences, trends, and patterns could be discerned. This section offers an expla-nation of how and why this framework was devised.
According to Palumbo (1988), “policy is the output of the policy-makingsystem. It is the cumulative effect of all of the actions, decisions, and behaviors ofthe millions of people who make and implement public policy” (p. 17). This re-search conceptualizes public policy as government activity that takes place overtime rather than as a single event, decision, or outcome (Palumbo, 1988; Heclo,1973).
The focus of this study is assessment policy in public postsecondary edu-cation. Assessment has clearly become a state government activity since it hastaken the form of legislation and guidelines issued by state-level executive agen-cies (e.g., State Education Department or Higher Education Coordinating Board).For the purposes of this analysis, any assessment activity initiated by a state legis-lature, state (higher) education executive agency, or state college/university sys-tem governing or coordinating board is considered public policy. In a handful of
Policy analysis

24 Benchmarking Assessment
states, there is no assessment activity at any of these levels. No policy is, how-ever, in fact, a policy. It is a policy decision on the part of these states, not to act.
The framework’s broadest function is to provide a picture of the inputs,processes, outcomes, and impacts (Worthen and Sanders, 1987) of each state orsystem’s assessment policy. Within these overarching categories, however, theframework needs to answer several specific questions. The first specific questionis: What is the policy context? For the purposes of our framework, the policycontext consists of three elements: historical inputs, political inputs, and policydescription.
Historical inputs. Historical inputs address the perceived need(s) for as-sessment, if any, in a state, and prior policies, if any, which address that need.
Political inputs. Political inputs include a description of the original legis-lation, as well as any current legislation.
Policy description. According to Dubnick and Bardes (1983), there aresix ways to describe a policy: (1) intentional – what is intended by the policy? (2)functional – what actually happened with this policy? (3) population-focused –who is affected by the policy? (4) developmental – how does the policy fit withwhat has come before? (5) programmatic – what programs will be created tocarry out the policy? and (6) comparative – how does the policy compare withother policies? The policy description, adapted slightly from this one, attempts tocapture the first four dimensions in the Policy Context section, the programmaticdimension in the Programs/Positions section, and the comparative dimension inthe narrative that features the overall findings of our research.
The second question to answer is: What is the policy type? The mostprevalent policy typology was established by Theodore Lowi (1972), who con-cluded that there are three basic types of policy: distributive, redistributive, andregulatory. Almond and Powell’s (1966) typology categorizes policies as allocative,extractive, control, or symbolic. Richard Rose (1976) classified policies as static,cyclical, linear, or discontinuous. Each of these typologies informed the creationof our own policy typology, which was designed to accommodate the variety ofstate-level assessment policies as described in the state documents.1. Regulatory – the policy is designed to encourage/ensure compliance with regu-
lations; resources may be distributed, in part, based on successful compliance.This differs somewhat from Lowi’s definition of a regulatory policy, whichcalls for a choice between “who will be indulged and who [will be] deprived.”(Lowi, 1964)
2. Reforming – the policy is designed to encourage/ensure reform of some type.3. Quality assurance – the policy is designed to assure quality.4. Accountability – the policy is designed to make institutions accountable to
some higher authority, typically the governor and state legislature.
The policy context
Historical inputsPolitical inputs
Policy description
regulatoryreforming
quality assuranceaccountability
The policy type

Benchmarking Assessment 25
The third question we address is: What is the policy stage? Palumbo de-scribes five stages in his policy cycle: “first, an issue gets placed onto the policy-making agenda, which means it becomes a problem that is dealt with by a govern-mental agency, such as a legislature, court, or administrative agency; second, theissue is discussed, defined, and a decision is made whether to take action withregard to that issue – this is the policy formation stage; third, the action or deci-sion is given to an administrative agency to be implemented; fourth, the actionstaken by the administrative agencies are evaluated to determine what impact theyhave on the intended audiences and clientele; and fifth, policies may be terminatedif they lose political support, are found not to be achieving their goals, are toocostly, or for some other reasons. In addition, there are sub-loops running fromimplementation and evaluation to formulation because policies often are adjustedbased on knowledge about their actual impact and shortcomings” (Palumbo, 1988,p. 7).
Another system of stages was developed by Steele and Lutz (1995), whichwas in turn, derived from McClain, Krueger, and Kongas (1989). Steele and Lutzrates policy on a scale from 0 to 4. A score of 0 meant the state had “no clearcommitment or mandate to initiate an assessment program”; 1 meant the state wasin the planning/startup stage; 2 indicated the state was implementing an assess-ment program; 3 meant the state had reached the stage of utilization/acceptanceof assessment and its results; and 4 meant the state was committed to assessment,“reflecting integration of assessment into decision making and changes processes.”Anderson and his colleagues (1984) established stages similar to Palumbo’s. Forthe purposes of our framework, we used the following six stages established byAnderson et al. (1984).
1. Problem formation – relief is sought from a situation that produces a humanneed, deprivation, or dissatisfaction.
2. Policy agenda – problems, among many, that receive the government’s seriousattention.
3. Policy formulation – development of pertinent and acceptable proposed coursesof action for dealing with public problems.
4. Policy adoption – development of support for a specific proposal such that thepolicy is legitimized or authorized.
5. Policy implementation – application of the policy by the government’s bureau-cratic machinery to the problem.
6. Policy evaluation – attempt by the government to determine whether or not thepolicy has been effective.
The policy stage
Stages used here
problem formationpolicy agendapolicy formulationpolicy adoptionpolicy implementationpolicy evaluation

26 Benchmarking Assessment
Our analyses also includes the following important policy relevant infor-mation for each state:· recommended or mandated guidelines for campuses;· programs and/or staff positions created at state and/or institutional level to
work with assessment;· list of indicators/outcomes measured;· names of assessment instruments mandated or recommended;· specific language pertaining to teaching and learning elements within the poli-
cies and procedures;· requirements for public reporting;· state and institutional budgets for assessment;· regional accreditation association affiliation;· relationship between state and regional accreditation association;· relationship with disciplinary accreditation associations;· presence, or lack, of statewide database4 ; and· focus on technology.
FINDINGS FROM STATES
A complete detailed analysis for each of the 50 states is found in Appen-dix A. Each state’s original assessment initiative is listed in Table 2 along with theyear it was enacted. New Jersey and Tennessee led the way with their initiativesin the late 1970s, but it took another 10 years for a majority of states to imple-ment a policy. Nearly a fifth of the states did not implement a policy until the1990s. Four states (Delaware, Michigan, Pennsylvania, and Vermont) have noassessment initiatives at the state or system level.
Policy-related data
4 This information was provided by Russell (1995) Advances in Statewide Higher EducationData Systems.
Table 2Name of Original State Assessment Policy and Year InitiatedState Original Initiative Year of Original InitiativeAlabama Statewide Policy on Institutional Effectiveness 1988
and Assessment of Student Learning OutcomesAlaska Educational Effectiveness Policy 1996Arizona Regents’ Annual Report 1987Arkansas Act 98 1989California Higher Education Assessment Act 1990Colorado Higher Education Accountability Program Act 1985Connecticut Strategic Plan 1988Delaware none noneFlorida College-level Academic Skills Test (CLAST) 1982

Benchmarking Assessment 27
Georgia Planning Policy 1989Hawaii Executive E5.210 1989Idaho Governing Policies and Procedures on 1988
Outcomes AssessmentIllinois Recommendations of the Committee on the 1986
Study of Undergraduate EducationIndiana State-level performance objectives 1984Iowa Regents Policy on Student Outcomes Assessment 1991Kansas Assessment Policy 1988Kentucky Accountability Enhancement Program 1992Louisiana Act 237 1993Maine Planning Goals 1986Maryland Reorganization of Maryland Higher Education Act 1988Massachusetts Performance Measurement System 1997Michigan none noneMinnesota Postsecondary Quality Assessment 1987Mississippi Trustees’ Policies and Bylaws n/aMissouri Value-Added Assessment Program (NE MO St. U.) early 1980sMontana Proficiency Admission Requirements and n/a
Developmental EducationNebraska Program Review 1994Nevada Regents’ Assessment Policy 1989New Hampshire none noneNew Jersey Basic Skills Assessment Program (BASP) 1977New Mexico Strategic Plan and Report Card 1990New York Commissioner’s Regulations n/aNorth Carolina Assessment Reports 1989North Dakota Strategic Plan 1996Ohio State Bill 140 1989Oklahoma Regents Policy 1991Oregon Oregon Assessment Model 1993Pennsylvania none noneRhode Island Board of Governors’ Policy on Quality in 1986
Higher Education, Program, andInstitutional Review Processes
South Carolina Act 629 1988South Dakota Assessment Policy 1984Tennessee Performance Funding 1979Texas Texas Academic Skills Program (TASP) 1987Utah HB 37 Assessment Policy 1992Vermont none noneVirginia Assessment Program 1986Washington Assessment Policy 1989West Virginia Assessment Policy 1987Wisconsin Accountability Policy 1993Wyoming n/a n/a
n/a indicates information currently unavailable

28 Benchmarking Assessment
The policy context section of each state’s analysis includes a descriptionof the original, as well as any updating legislation (see Appendix A). In somecases the focus and nature of a state’s assessment policies and practices haveevolved since their initiation. The current policy type and stage for each state ispresented in Table 3. Approximately half of the states have policies designed toboth ensure quality and make institutions accountable to a higher authority, be itgovernor, state legislature, or the coordinating or governing board. Nine stateshave policies which focus exclusively on quality assurance; five emphasize ac-countability. We categorized one state each as a combination of accountability/reforming (Indiana), quality assurance/regulatory (New Mexico), and quality as-surance/distributive (North Carolina).
The states are in different stages with regard to their assessment initia-tives as Table 3 illustrates. Nearly half are in the process of implementing theirpolicy; one-fifth are evaluating and reformulating their course of action. Colo-rado is formulating a new course of action having instituted a new statute in1995. Tennessee is in a constant cycle of ongoing implementation and evaluation.Ohio is implementing its policy at the two-year level, while formulating its courseof action for the four-year institutions.
Table 3Current State Assessment Policy Type and Stage
Policy type/stage
State Current Policy Type Current Policy StageAlabama accountability; quality assurance implementation (of Act 96-577)Alaska quality assurance implementationArizona accountability; regulatory implementationArkansas n/a n/aCalifornia accountability; quality assurance implementationColorado accountability; regulatory; formulation (of performance funding policy)
quality assuranceConnecticut quality assurance implementationDelaware none noneFlorida accountability; regulatory; evaluation and reformulation
quality assuranceGeorgia quality assurance implementationHawaii accountability; quality assurance implementationIdaho quality assurance evaluation and reformulationIllinois quality assurance evaluation and reformulationIndiana accountability; reforming evaluation and reformulationIowa quality assurance implementationKansas accountability; quality assurance evaluationKentucky accountability; regulatory; implementation
quality assuranceLouisiana accountability; quality assurance implementationMaine none none

Benchmarking Assessment 29
Maryland accountability; quality assurance implementationMassachusetts accountability; quality assurance implementationMichigan none noneMinnesota accountability; regulatory adoptionMississippi accountability implementationMissouri accountability; regulatory; evaluation and reformulation
quality assuranceMontana accountability; quality assurance implementationNebraska accountability; quality assurance evaluation and reformulationNevada quality assurance evaluation and reformulationNew Hampshire none noneNew Jersey accountability implementationNew Mexico quality assurance implementationNew York quality assurance implementationNorth Carolina quality assurance evaluation and reformulationNorth Dakota accountability implementationOhio accountability; regulatory; implementation; formulation (of performance
quality assurance indicators for four-year institutions)Oklahoma accountability; quality assurance evaluation and reformulationOregon accountability; quality assurance implementationPennsylvania none noneRhode Island accountability; quality assurance implementationSouth Carolina accountability; regulatory; implementation; adoption (of 100%
quality assurance performance funding policy)South Dakota accountability; quality assurance implementationTennessee accountability; regulatory; ongoing implementation and evaluation
quality assuranceTexas accountability; quality assurance implementationUtah accountability; quality assurance evaluation and reformulationVermont none noneVirginia accountability; quality assurance evaluation and reformulationWashington accountability; quality assurance evaluation and reformulationWest Virginia quality assurance implementationWisconsin accountability; quality assurance implementationWyoming n/a n/a
n/a indicates information currently unavailable
Measurement useWhether states mandate common instruments for assessment and mandate
common indicators and/or outcomes across their institutions is captured in Table4. Currently, eight states (Florida, Georgia, Kentucky, Missouri, North Carolina,South Carolina, Tennessee, Texas) indicate their use of common instruments tomeasure outcomes and Colorado is currently considering use of common instru-ments. Kentucky and Missouri use common instruments (NTE and Praxis II) toassess the preparedness of their K-12 teacher candidates. Florida, Georgia, Northand South Carolina and Texas have constructed their own instruments, while Ten-nessee uses a commercially-developed product.
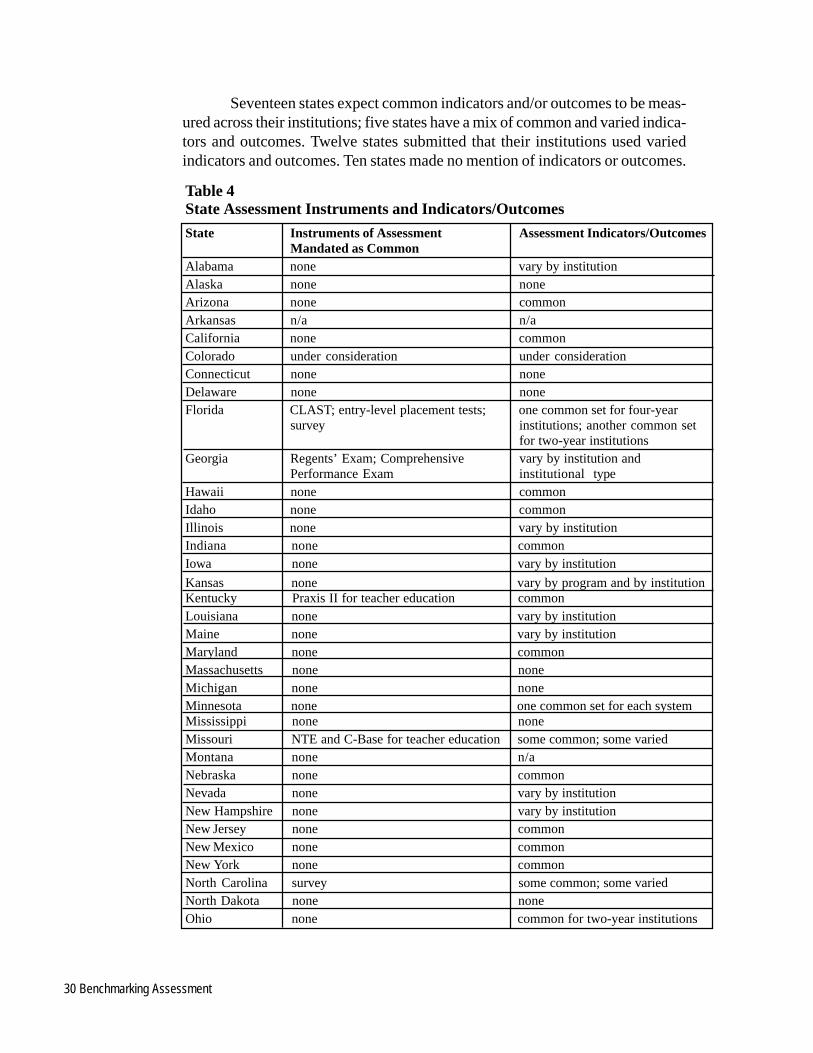
30 Benchmarking Assessment
Seventeen states expect common indicators and/or outcomes to be meas-ured across their institutions; five states have a mix of common and varied indica-tors and outcomes. Twelve states submitted that their institutions used variedindicators and outcomes. Ten states made no mention of indicators or outcomes.
Table 4State Assessment Instruments and Indicators/Outcomes
State Instruments of Assessment Assessment Indicators/OutcomesMandated as Common
Alabama none vary by institutionAlaska none noneArizona none commonArkansas n/a n/aCalifornia none commonColorado under consideration under considerationConnecticut none noneDelaware none noneFlorida CLAST; entry-level placement tests; one common set for four-year
survey institutions; another common setfor two-year institutions
Georgia Regents’ Exam; Comprehensive vary by institution andPerformance Exam institutional type
Hawaii none commonIdaho none commonIllinois none vary by institutionIndiana none commonIowa none vary by institution
Kansas none vary by program and by institutionKentucky Praxis II for teacher education commonLouisiana none vary by institutionMaine none vary by institutionMaryland none commonMassachusetts none noneMichigan none noneMinnesota none one common set for each systemMississippi none noneMissouri NTE and C-Base for teacher education some common; some variedMontana none n/aNebraska none commonNevada none vary by institutionNew Hampshire none vary by institutionNew Jersey none commonNew Mexico none commonNew York none commonNorth Carolina survey some common; some variedNorth Dakota none noneOhio none common for two-year institutions

Benchmarking Assessment 31
Oklahoma none some common; some variedOregon none commonPennsylvania none noneRhode Island none commonSouth Carolina survey commonSouth Dakota none vary by institutionTennessee ACT-COMP or C-BASE commonTexas TASP n/aUtah none some common; some variedVermont none noneVirginia none vary by program and by institutionWashington none vary by institutionWest Virginia none vary by institutionWisconsin none some common; some variedWyoming n/a n/a
n/a indicates information currently unavailable
Authority/agencyWhether the state’s assessment initiatives were guided by legislative or
other means and the type of state higher education agency is illustrated in Table 5.Twelve of the states have statutes, meaning that their assessment initiative is forthe most part guided by legislative means, usually a bill is passed by the statelegislature that directs an executive board or agency to establish a policy. Twenty-one states have policies, indicating that assessment is for the most part guided bynon-legislative means, usually an executive policy promulgated by a state highereducation governing board or agency. Eight states had both statutes and policiesshaping their assessment initiatives. Five states have no state-level assessmentactivity.
State structure type or authority of the governance structure (McGuinness,Epper, & Arredondo, 1994) illustrated in Table 5 demonstrates that 21 states aregoverned by coordinating/regulatory boards, 21 by consolidated governing boards,six by planning agencies, and four by coordinating advisory boards.
Table 5 Assessment Activity Type and Authority of State Agency
State Policy, Statute or Combination Authority of State Agency
Alabama policy coordinating/regulatory
Alaska policy consolidated governing
Arizona combination consolidated governingArkansas n/a coordinating/regulatoryCalifornia statute coordinating/advisoryColorado statute coordinating/regulatoryConnecticut statute coordinating/regulatoryDelaware none planning
Florida statute consolidated governing

32 Benchmarking Assessment
Georgia policy consolidated governingHawaii policy consolidated governingIdaho policy consolidated governingIllinois policy coordinating/regulatoryIndiana statute coordinating/regulatoryIowa policy consolidated governingKansas policy consolidated governingKentucky statute coordinating/regulatoryLouisiana statute coordinating/regulatoryMaine policy consolidated governingMaryland statute coordinating/regulatoryMassachusetts combination coordinating/regulatoryMichigan none planningMinnesota statute coordinating/advisoryMississippi policy consolidated governingMissouri combination coordinating/regulatoryMontana policy consolidated governingNebraska statute coordinating/regulatoryNevada policy consolidated governingNew Hampshire none planningNew Jersey combination coordinating/regulatoryNew Mexico combination coordinating/advisoryNew York policy coordinating/regulatoryNorth Carolina statute consolidated governingNorth Dakota policy consolidated governingOhio combination coordinating/regulatoryOklahoma policy coordinating/regulatoryOregon policy planningPennsylvania none coordinating/advisoryRhode Island policy consolidated governingSouth Carolina statute coordinating/regulatorySouth Dakota policy consolidated governingTennessee statute coordinating/regulatoryTexas combination coordinating/regulatoryUtah statute consolidated governingVermont none planningVirginia combination coordinating/regulatoryWashington policy coordinating/regulatoryWest Virginia combination consolidated governingWisconsin policy consolidated governingWyoming n/a consolidated governing
n/a indicates information currently unavailable

Benchmarking Assessment 33
Each state’s pattern of sharing information with its public and its ability togather, organize, and analyze information from each of its institutions via a state-computerized database is portrayed by the information contained in Table 6. Twenty-three of the states require annual, five biennial, and one triennial reporting of as-sessment findings. In three states public reporting is voluntary (Connecticut, Min-nesota, and Rhode Island); in two it is cyclical. California indicates it uses sys-temic reporting.
State-level governing and coordinating boards have been collecting highereducation data since their inception. The development of institutional and statewidecomputerized data systems has facilitated the sharing and comparing of data frommultiple institutions. Table 6 contains data gathered by Russell (1995) which char-acterizes the higher education data systems in each state. As indicated, more thanhalf of the states have comprehensive statewide databases containing student recordsfrom four-year and two-year public institutions. Only five states indicate they haveno multi-institutional database.
Table 6 Frequency of Public Reporting and Availability of Database Within State
State Public Reporting State DatabaseAlabama voluntary 1Alaska annual 1Arizona annual 4Arkansas annual 1California systemic 1Colorado annual 1Connecticut voluntary 1Delaware none 5Florida annual 3Georgia annual 1Hawaii annual 1Idaho annual 1Illinois voluntary 1Indiana biennial 1Iowa annual 5Kansas none 5Kentucky annual 1Louisiana annual 1Maine periodic 1Maryland annual 1Massachusetts annual n/aMichigan none 5Minnesota voluntary 1Mississippi none 2Missouri annual 1
Reporting systems

34 Benchmarking Assessment
Montana none 5Nebraska annual 5Nevada none 1New Hampshire none 1New Jersey annual 1New Mexico annual 1New York cyclical 3North Carolina cyclical 1North Dakota cyclical 1Ohio annual 1Oklahoma annual 1Oregon annual 2Pennsylvania none 4Rhode Island voluntary 5South Carolina annual 1South Dakota annual 2Tennessee annual 1Texas annual 1Utah biennial 1Vermont none 2Virginia biennial 1Washington annual 2West Virginia periodic 1Wisconsin triennial 1Wyoming n/a n/a
1= comprehensive statewide database at the SHEEO level2= non-comprehensive statewide database at the SHEEO level3= multi-institutional database, not at SHEEO level4= limited multi-institutional database5= no multi-institutional database (Russell, 1995)n/a indicates information currently unavailable
Funding for assessment activities appears to remain the primary responsi-bility of the individual institutions. A majority of the policy documents give noindication of the availability of state funding support or use of funding as anincentive for institutional assessment activities. (See Table 7). Noteworthy ex-ceptions include Missouri, where the 1997 Funding For Results Program ear-marked as incentive funding $2 million for two-year and $10.6 million for four-year institutions. In Tennessee $25-30 million is awarded each year through thePerformance Funding Policy. Ohio recently allocated $1.5 million to two-yearinstitutions as part of its performance funding policy.
Funding incentives

Benchmarking Assessment 35
Table 7State Financial Incentives and Consequences Tied to Assessment
State Financial Incentives and ConsequencesAlabama Institutions pay for assessment activities through regular appropriationsAlaska Funding for assessment is included in 1996 budget requestArizona n/aArkansas n/aCalifornia State constitution requires the state to reimburse local agencies and school
districts for costs incurred by state-mandated activities (e.g., assessment)Colorado The state is currently determining what percentage of appropriations will be
linked to performance indicatorsConnecticut n/aDelaware n/aFlorida n/aGeorgia Regents’ policy says that each institution shall link its major budget alloca
tions and other major academic and administrative decisions to its planningand assessment process
Hawaii n/a
Idaho first-year assessment planning costs were borne by institutions
Illinois Total reinvestment of funds under Priorities, Quality, and Productivity (PQP)initiative was $153.6 million; $27.5 million of this was designated forimprovement of undergraduate education
Indiana n/aIowa n/aKansas n/a
Kentucky n/a
Louisiana n/a
Maine some funds were appropriated by the Vice Chancellor for Academic Affairsin 1988, 1989, and 1990
Maryland n/a
Massachusetts n/a
Michigan n/a
Minnesota The legislature placed $5,000,000 in the performance incentive accounts forboth systems, for a total of $10,000,000
Mississippi n/a
Missouri For 1997 Funding for Results (FFR), $2 million went to two-year institutions and $10.6 million went to four-year institutions
Montana n/a
Nebraska n/a
Nevada n/a
New Hampshire n/a
New Jersey n/a
New Mexico n/a
New York n/a
North Carolina n/a
North Dakota n/a
Ohio In 1996, the Regents allocated $1.5 million to two-year institutions as partof its performance funding policy

36 Benchmarking Assessment
Oklahoma Each institution is permitted to charge a fee for the purpose of conducting institutional and programmatic assessment. This fee can be nomore than one dollar per credit hour
Oregon State has used “small amounts of incentive funds ($200,000/biennium)to urge campuses to participate in collaborative assessment projects.”
Pennsylvania n/aPuerto Rico n/aRhode Island n/aSouth Carolina Not clear what percentage of appropriations formula is determined by
performance indicators for 1997 and 1998, but the formula will be100% indicator-driven by 1999
Tennessee $25 to $30 million is awarded each year through the PerformanceFunding Policy
Texas n/aUtah n/aVermont n/aVirginia An average of $12 per student was appropriated to institutions for
assessmentWashington State funding for assessment has been available since the 1989-91
biennium when $400,000 was given for assessment activities at each ofthe six four-year institutions and to the State Board of CommunityColleges. In 1990 supplemental funds of $60,000 per institution wasgiven to the 27 community colleges. Total funding levels for publicfour-year institutions, community colleges and technical institutionshave remained relatively constant for each successive biennium budget.The Community Colleges and Technical System Governing Board hasfunding to coordinate assessment activities, while the Higher EducationCoordinating Board does not.
West Virginia “West Virginia governing boards have allocated approximately $15,000annually for state-wide assessment programs and materials. However,the primary responsibility for funding assessment has been borne by thecampuses.”
Wisconsin n/aWyoming n/a
n/a=information currently not applicable
DISCUSSION OF STATE FINDINGS
This section will discuss three themes emanating from the patterns andtrends captured in our data:· the extent and implications of state use of common assessment practices;· the relationships between state assessment policies and governance structures;· the use of incentives and consequences in assessment policies.
Three themes
implicationsrelationships
use of incentives

Benchmarking Assessment 37
The extent to which states have been moving toward the use of commonindicators and common instruments has been examined previously (ACT, 1995;NCHEMS, 1996). Our analysis of the state documents for the most part confirmswhat these previous studies found: that 17 states currently have common indica-tors and that eight states use common instruments. Whether this constitutes agenuine trend toward commonality, either in terms of indictors or instruments, is ajudgment call. Indeed, making a statement about trends in state assessment poli-cies is difficult because it has only been during the last decade that assessment hasbecome an issue at the state level, and spotting a trend over such a relatively shortperiod of time is a challenge.
But if there is a trend toward common indicators and instruments, whatdoes it mean? Perhaps for some state legislatures, commonality in expectationsand measurements is one way to facilitate comparisons across institutions. In NewMexico, for example, the state legislature passed a law requiring the State Com-mission on Higher Education to compile an “annual report card,” consisting of avariety of measures taken from all public institutions. The purpose of this “reportcard” was explicitly comparative: “The indicators [of performance] are to be pub-lished annually in order to draw comparisons among school districts and amonginstitutions of higher learning.” (Annual Report Card Act of 1990).
Institutions, however, have been quick to resist intra-state comparison. InNew Mexico, the report card requirement was dropped because of criticism frominstitutions, which stated that the “diversity of New Mexico’s institutions, mis-sions, and students” make such comparative tools “unreliable” or “only minimallyindicative of institutional performance.” Institutions and boards in other states,perhaps sensing the comparative potential of common indicators and instruments,have asserted their own uniqueness and offered similar arguments against the va-lidity of such comparisons.
In California the state Postsecondary Education Commission acknowl-edged in its 1996 report that the “breadth and complexity of California publichigher education make the development of measures of performance that are com-parable across systems very challenging.” In Georgia the assessment policy allowsfor the fact that assessment procedures may differ from institution to institution.Idaho’s Board of Education makes it very clear that assessment “should not beused to compare institutions.” In Illinois, the state Board of Higher Education hasbeen reluctant to make assessment practices uniform. Instead, the state’s approachto assessment of students “is to call upon institutions to develop appropriate as-sessment programs rather than develop some sort of statewide assessment test orcommon set of indicators.” Iowa, Nevada, and Oklahoma are also among thestates that recognize diversity of institutions, missions, and students. If, indeed,some states are looking at common indicators and instruments as a good way todraw comparisons between institutions, there is certainly no shortage of institu-tions and boards that have resisted (and, in the case of New Mexico, repealed) theuse of such tools for comparative purposes.
SoSome commonality
Trend may assistlegislatures tocompare acrossinstitutions.
Institutions resistapplication ofcomparativeinstruments.

38 Benchmarking Assessment
While this study and others (NCHEMS, 1996) have examined the extentto which states have begun using common instruments, this study has also lookedbeyond the commonality of instruments to the more fundamental question ofwhat these common instruments actually measure. In some cases, instruments(particularly standardized tests) are used at or near the time of a student’s entry tocollege as opposed to a student’s exit. For example, Florida’s CLAST was imple-mented, in part, “to ensure that college students…entering the upper division at astate university possess basic or essential skills deemed necessary for success.”Florida also administers a common entry-level placement exam to incoming fresh-men at two- and four-year institutions. In Texas, the TASP (Texas AcademicSkills Program) exam is adminstered to entering college freshmen to determine ifstudents can read, write, and compute “at levels needed to perform effectively inhigher education.” Some states also refer to the use of the SAT or ACT as meansof assessing students at entry.
There are a handful of states that use standardized tests as common in-struments to measure students’ performance upon exit from college. Tennessee,for example, uses the ACT-COMP and/or C-BASE as means of evaluating astudent’s general education program. South Dakota also uses the ACT-COMP toassess the achievement of students in the general education component of thebaccalaureate curriculum. There also seems to be growing interest in use of com-mon standardized instruments in teacher education programs. In Missouri, a state-wide administrative rule mandates the use of C-BASE and NTE for admission toand exit from teacher education programs. Kentucky uses the scores of teachereducation program graduates on the multiple-choice component of all Praxis IIsubject area exams and compares their scores to the national averages, as meansof measuring the preparation of K-12 teachers.
More broadly speaking, many states use students’ scores on professionallicensure and certification exams in a variety of areas as instruments of assess-ment, though these are not often mandated as common. More often, states turnto surveys measuring the satisfaction — both of students and their employers —for assessment purposes. If states are moving toward common instruments, thenit will be interesting to observe whether they choose to measure their students atentry, exit, or both. The measurements at entry (like CLAST and TASP) arelargely a reflection on the quality of elementary and secondary school systems,while measurements at exit (Like ACT-COMP and C-BASE) are more of a re-flection of the quality of the postsecondary institutions.
Perhaps colleges and universities will resist attempts to impose commoninstruments to measure exit performance of their students for the same reasonsthey resist drawing comparisons across institutions: institutions have differentmissions and different students. For some institutions, common, standardizedmeasurements of exit-performance might be invaluable or worse, misleading. Fur-ther it is easier, at least intuitively, to assess entry rather than exit because stu-dents come to college with what is, for the most part, a similar educational back-
SoWhat is measured?
students at entrystudents at exit
licensing scoresstudent satisfaction
employer satisfaction
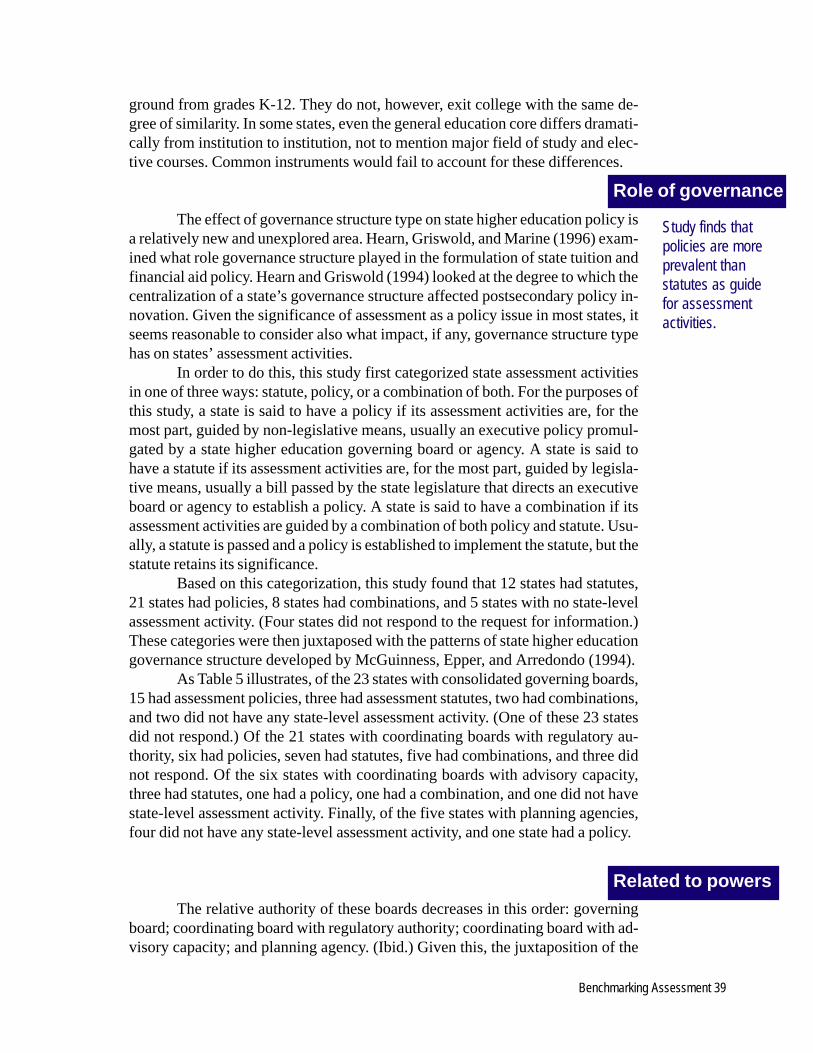
Benchmarking Assessment 39
ground from grades K-12. They do not, however, exit college with the same de-gree of similarity. In some states, even the general education core differs dramati-cally from institution to institution, not to mention major field of study and elec-tive courses. Common instruments would fail to account for these differences.
The effect of governance structure type on state higher education policy isa relatively new and unexplored area. Hearn, Griswold, and Marine (1996) exam-ined what role governance structure played in the formulation of state tuition andfinancial aid policy. Hearn and Griswold (1994) looked at the degree to which thecentralization of a state’s governance structure affected postsecondary policy in-novation. Given the significance of assessment as a policy issue in most states, itseems reasonable to consider also what impact, if any, governance structure typehas on states’ assessment activities.
In order to do this, this study first categorized state assessment activitiesin one of three ways: statute, policy, or a combination of both. For the purposes ofthis study, a state is said to have a policy if its assessment activities are, for themost part, guided by non-legislative means, usually an executive policy promul-gated by a state higher education governing board or agency. A state is said tohave a statute if its assessment activities are, for the most part, guided by legisla-tive means, usually a bill passed by the state legislature that directs an executiveboard or agency to establish a policy. A state is said to have a combination if itsassessment activities are guided by a combination of both policy and statute. Usu-ally, a statute is passed and a policy is established to implement the statute, but thestatute retains its significance.
Based on this categorization, this study found that 12 states had statutes,21 states had policies, 8 states had combinations, and 5 states with no state-levelassessment activity. (Four states did not respond to the request for information.)These categories were then juxtaposed with the patterns of state higher educationgovernance structure developed by McGuinness, Epper, and Arredondo (1994).
As Table 5 illustrates, of the 23 states with consolidated governing boards,15 had assessment policies, three had assessment statutes, two had combinations,and two did not have any state-level assessment activity. (One of these 23 statesdid not respond.) Of the 21 states with coordinating boards with regulatory au-thority, six had policies, seven had statutes, five had combinations, and three didnot respond. Of the six states with coordinating boards with advisory capacity,three had statutes, one had a policy, one had a combination, and one did not havestate-level assessment activity. Finally, of the five states with planning agencies,four did not have any state-level assessment activity, and one state had a policy.
The relative authority of these boards decreases in this order: governingboard; coordinating board with regulatory authority; coordinating board with ad-visory capacity; and planning agency. (Ibid.) Given this, the juxtaposition of the
Role of governance
Study finds thatpolicies are moreprevalent thanstatutes as guidefor assessmentactivities.
Related to powers

40 Benchmarking Assessment
type of governance structure with the type of assessment activity reveals someinteresting relationships, which may or may not be cause-and-effect. For exam-ple, of the 23 states with consolidated governing boards, 15, or 66%, had poli-cies. At the other end of the authority spectrum, of five states with planningagencies, four, or 80%, had no state-level assessment activity. Intuitively, a plan-ning agency has the least authority of the four structures proposed by McGuinnesset al., and thus is the least likely to be engaged in assessment activity. One futuredirection of our research will be to examine these relationships.
One of the most compelling aspects of state-level assessment has been theuse of financial incentives and consequences as a means of assessment or a meansof encouraging assessment activity. A 1996 report prepared by the South Caro-lina Commission on Higher Education as part of that state’s performance fundingmovement offered an overview of performance funding by state. As of July, 1996,five states – Arkansas, Florida, Missouri, Ohio, and Tennessee – had implementedperformance funding, and three states – Colorado, Kentucky, and South Carolina– were moving quickly in that direction (SCCHE, 1996). In addition to thesestates, our study found that Arizona has a performance funding system as a resultof the Budget Reform Act passed by that state’s legislature in 1993. This lawrequires performance funding for all state programs, including higher education.Minnesota also has two sets of five performance measures, one for the Universityof Minnesota and another for the Minnesota State College and University Sys-tem. For each performance measure an institution fulfills, it will receive $1 mil-lion, for a maximum possible total of $5 million. At the time of this report, how-ever, funds have not been released pending the performance reports from thesystems.
Beyond the use of performance funding, four states – Oregon, Virginia,Washington, and West Virginia – have separate budget lines for assessment ac-tivities. Oregon provides $200,000 for institutions engaged in “collaborative as-sessment.” Virginia gives institutions an average of $12 per student for assess-ment purposes, while Washington and West Virginia appropriate a certain amountof funds annually.
Two states – Oklahoma and South Dakota – permit their institutions tocharge students a fee for assessment activities. In Oklahoma, institutions cancharge no more than $1 per credit hour; in South Dakota, the fee can be no higherthan $0.25 per credit hour. One state – California – is constitutionally required toreimburse institutions for costs incurred while carrying out state-mandated activ-ity, of which assessment is an example.
Based on these findings, it seems there are at least four types of approachesto using financial incentives and consequences across states: (1) states with per-formance funding; (2) states with budget lines for assessment activities; (3) statesthat allow institutions to charge fees to students for assessment purposes; and (4)
Use of incentives
Four approaches
Five states useincentives forperformance
while three movein that direction

Benchmarking Assessment 41
states that reimburse institutions for assessment activities. One of our future re-search agendas will be to ascertain why states choose the policy approaches thatthey are currently implementing.
To this end, another interesting observation we made based on state docu-ments is the intersection between the second and third themes of this discussion:the relationship between governance structure type and the use of performancefunding. For example, of the 10 states that either currently have performancefunding measures or are considering adopting such measures, only two – Arizonaand Florida – have governing boards.
Interestingly, the remaining eight states all have regulatory coordinatingboards. Do governing boards resist the use of performance funding because theysee it as an infringement on their authority? Is performance funding, especiallywhen mandated by a state legislature, really an infringement on board authority?What is it about coordinating boards with regulatory authority that is conduciveto performance funding? Do other factors, such as the political climate and thepublic demand for greater accountability, affect the likelihood of a state to useperformance funding? All of these questions will inform our construction of thesurvey we will distribute to SHEEOs and other state-level higher educationpolicymakers.
Perhaps the most important observation to make regarding assessment isthat states define assessment differently based on their own individual assessmentneeds and goals, and these differences in definition result in a variety of policiesand practices. Given this variety, the overall purpose of this state analysis has beenthree-fold: (1) to introduce and explicate a new policy analysis framework thatmay facilitate a comparative discussion of state-level assessment policies and prac-tices; (2) to provide, in the form of six tables, a concise visual summary of theinformation gathered and discussed in greater detail in the individual state tem-plates; and (3) to elucidate three very broad, comparative themes this study hasdiscovered in its review of state assessment policies and practices.
The value of this study is its approach. This study “worked backwards”and developed the analytical framework and template based on what we wereseeing in the state documents. This is in contrast to administering an instrumentdesigned to capture specific, pre-determined dimensions of assessment. Our initialrequest for documents relating to assessment policies and practices was open-ended and somewhat ambiguous by design, so that states would be inclined tosend “too much” information rather than “too little.” Once we had this informa-tion, however, we could categorize and quantify it as we wanted; we were not tiedto the pre-existing limits and boundaries of a survey instrument. In the end, webelieve this approach, while it may have been “messier” and perhaps requiredmore work, has enabled us to offer a genuinely comparative summary and analysis
Some questions
Value of findings
Need to explorerelationshipbetween type ofgovernance andincentive use.

42 Benchmarking Assessment
of assessment activities at the state level to an audience with diverse interests andperspectives on assessment issues.
Of course, this report is only the beginning. Based on our findings, andthe comments and suggestions of those who read this report, Year Two of ourresearch will involve a more focused approach to the analysis of state-level as-sessment activities. This approach will consist of a survey informed by the dataalready collected and the conclusions already drawn. Ultimately, this researchwill be of use to the various participants in the state policy-making process asthey continue to work toward a fair, efficient, and valid system of assessment.
ACCREDITATION ASSOCIATION POLICIES & PRACTICES
Documents describing the assessment practices and policies of the sixregional accreditation associations were gathered, analyzed, and organized intoindividual analytic frameworks which can be found in Appendix B. Because theprimary purpose of this data collection was to discover what policies exist andthe emphases these policies give to improving student learning and achievement,the frameworks provide an overview of the associations’ focus on assessment forlearning and teaching improvement and highlight the following specific informa-tion:· specific policies and practices emphasizing students, student learning and teach-
ing;· kinds of outcomes measured and processes used;· emphasis on institutional accountability, as well as autonomy.
These policies and practices paint only part of the picture of accreditingassociations’ efforts to facilitate institutional effectiveness. In order to garner asbroad an understanding as possible of how the accrediting associations have en-gaged in improving faculty teaching and student learning, the following informa-tion was also included in the framework:
· relationship of association to state higher education department, council orcoordinating boards;
· association’s efforts to evaluate its assessment program;· materials the association provides to guide its member institutions and associa-
tion efforts to train accrediting teams;· identification of who is involved in assessment at the institution;· and, emphases on issues of technology use and development and diversity.
Assessment of student learning and teaching emerged as a focus of theaccreditation associations between the mid 1980s and early 1990s. The logicalnext question is what form has outcomes assessment taken? According to theaccreditation associations, how should institutions approach assessing student
Analysis approach
Assessment forms

Benchmarking Assessment 43
learning and teaching effectiveness? What evidence should be gathered; what meansare to be used?
Without exception what the associations mandate is documentation ofinstitutionally identified outcomes and analysis of those outcomes, as well as dem-onstration of action following from the analysis. But as Table 8 illustrates, specificprocesses are not required, nor is an identified single or set of outcomes. Rathersome domains and processes are “highlighted.”
Table 8 Regional Association “Highlighted” Outcome Measures and Assessment Processes
Regional Association Measures Processes
Middle States Association multiple: cognitive abilities, varied - qualitative andinformation literacy, integration quantitativeand application
New England Association multiple: cognitive, behavioral, varied - qualitative andand affective learning quantitative
North Central Association multiple: cognitive, behavioral, varied - direct andand affective indirect - qualitative and
quantitative
Northwest Association multiple: problem solving, analysis, variedsynthesis, making judgment,reasoning, communicating
Southern Association multiple: major field and general varied - qualitative andeducation achievement, affective quantitativedevelopment
Western Association multiple: effective communication, varied - qualitative andquantitative reasoning, critical quantitativethinking
According to North Central Association’s recently revised Criteria Threeand Four an appropriate assessment program is one that “will document (its em-phasis) proficiency in skills and competencies essential for all college-educatedadults; completion of an identifiable and coherent undergraduate level generaleducation component; and mastery of the level of knowledge appropriate to thedegree attained.” It remains up to the institution to define those skills and compe-tencies. NCA provides some greater direction in the 1996 report, Opportunitiesfor Improvement, where the association recommends that institutions determinethe extent to which they contribute to student learning within three domains: cog-nitive, behavioral, and affective.
WASC cites effective communication, quantitative reasoning, critical think-ing and other competencies judged essential by the institutions as possible out-comes to be considered. Middle States lists as measures of student achievementcognitive abilities, content literacy, competence in information management skillsand value awareness. Clearly some of the associations guide their member institu-tions in their contemplation of desired learning outcomes, but none has estab-lished a mandated list.
Neither processesnor a single set ofoutcomes aremandated by anyof the regionalassociations

44 Benchmarking Assessment
In terms of process or approach to assessment, the associations’ expecta-tions are similarly broad. Assessment is to be ongoing and incremental and longi-tudinal multi-measure studies are thought to produce more meaningful results.Use of both qualitative and quantitative approaches is considered important. Mostassociations provide a broad list of possible approaches (e.g. alumni and em-ployer surveys, course and professor evaluations, student satisfaction invento-ries, course completion rates) from which institutions can choose.
Guidance for the assessment of instructional processes is equally as broad,and at best, indirectly addressed. For Middle States teaching is clearly a part ofthe teaching-learning improvement loop used to illustrate the inter-linking of as-sessment and institutional improvement, and yet only minimal mention is made ofhow instruction is assessed. Faculty peer evaluation is the only approach listedamong possible methods of determining instructional program quality.
SACS (1996) states that “methods of instruction must be appropriate forthe goals of each course and the capabilities of the students…and methods ofevaluating teaching effectiveness must be varied and may include use of stand-ardized tests and comprehensive examinations, assessment of the performance ofgraduate in advanced programs or employment” (Criteria for Accreditation. p.30-31).
WASC’s Task Force on the Role of Accreditation in the Assessment ofStudent Learning and Teaching Effectiveness (1995) captures what may charac-terize the approach of most of the associations to assessing teaching effective-ness. They state the clear need to more meaningfully explore and connect therelationship between teaching effectiveness and student learning, while simulta-neously acknowledging that this has been an area that has been overlooked andunderstudied. The dearth of attention to assessment of teaching found in theassociation materials may be thus explained.
As Table 9 illustrates, those responsible for the campus assessment ef-forts vary by association, but typically faculty are listed. Support and involve-ment of other campus constituencies in the assessment effort are left to the dis-cretion of each institution.
Table 9Association Expectation for Who Will Conduct Campus Assessment
Regional Association Responsibility for Campus Assessment Effort
Middle States Association faculty, administrators, students
New England Association individuals and groups responsible for achieving institutionalpurposes
North Central Association faculty with institutional support from governing board,president and senior executive officers
Northwest Association faculty
Southern Association president and appropriate constituent groups
Western Association faculty
Formats optional

Benchmarking Assessment 45
Elliott (1983) posits that institutions have the right to expect four con-stants in their relationship with their accreditation associations: clear standards,guidance for improvement, protection from fraudulent and improper practices,and preservation of institutional autonomy. All six regional associations eitherimplicitly or explicitly acknowledge that the distinct and diverse purposes andgoals of their member institutions demand equally diverse assessment approachesand processes. For instance, according to WASC, “member institutions are in thebest position to define their standards for student learning, teaching effective-ness.” Middle States holds that “it is an institution’s prerogative to determine howbest to implement assessment.” This commitment to preservation of institutionaldistinctiveness and autonomy provides perhaps the best explanation for why theoutcomes measured and processes used by the six regional associations are sobroadly defined.
Stevens and Hamlett (1983) and Bender (1983) have noted that the statesabrogated their responsibility for gauging institutional effectiveness by either ig-noring the issue or passing it to the accrediting associations, raising among otherquestions, what has been the convergence of state and accreditation associationpolicies and the resulting influences on assessment practices. In the second half ofthe twentieth century as the states began to take greater interest in and responsi-bility for institutional regulation and oversight, an accommodating and often co-operative relationship between state agencies and the accrediting associationsemerged (Bender, 1983).
An analysis of the accreditation (See Table 10) and state (see Table 11)policy documents indicates that over one-third of the states mention a relationshipwith either their regional accrediting and/or disciplinary/professional accreditingassociations, while four of the regional accrediting associations (MSACS, NCACS,NEAS&C, SACS) explicitly mention a relationship with the state higher educa-tion agencies in their regions. The relationships range from formal policies direct-ing communication between the accrediting association and state coordinatingand governing boards to more informal communication links between state andaccrediting agency.
Table 10 Relationship with State Agencies as Reported by Regional Accreditation Associations
Regional Association Relationship with State AgencyMiddle States Association informalNew England Association formalNorth Central Association informalNorthwest Association none apparentSouthern Association formalWestern Association none evident
Autonomy stressed
Links to the states

46 Benchmarking Assessment
Table 11 Relationship with Regional Accreditation Association as Reported by States
State Agency Relationship with Accreditation AgencyAlabama SACS not evidentAlaska NWACS Recent NWASC assessment requirement for self-study is
cited as an influence on Educational Effectiveness Policy.Arizona NCACS not evidentArkansas NCACS not evidentCalifornia NWACS not evidentColorado NCACS not evidentConnecticut NEACS not evidentDelaware MSACS not evidentD.C. n/a not evidentFlorida SACS not evidentGeorgia SACS not evidentHawaii WACS not evidentIdaho NWACS not evidentIllinois NCACS State Board of Higher Education noted NCACS’ 1989
request that institutions develop student assessment plan.The types of outcomes evidence suggested by NCACSclosely parallel the BOE’s assessment components.
Indiana NCACS not evidentIowa NCACS not evidentKansas NCACS In its most recent NCACS report, the University of Kansas
system of assessment was described as “extremelysophisticated” and “not inexpensive.”
Kentucky SACS Assessment activities are complementary to bothinstitutional and programmatic accreditations.
Louisiana SACS not evidentMaine NEACS not evidentMaryland MSACS not evidentMichigan NCACS not evidentMinnesota NCACS not evidentMississippi SACS The Trustees’ policy links assessment with the accreditation
requirements of the SACS.Montana NWACS not evidentNebraska NCACS The state sees the assessment requirements of NCACS as
complementary to its own goals of consistency with the stateComprehensive Strategic Plan.
Nevada NWACS The Regents recognize that the “NWACS is now placing agreater emphasis on assessment. The [state] Commission onColleges expects each institution and program to adopt anassessment scheme responsive to its mission and needs, andthe campuses are responding.”
New Hampshire NEACS not evidentNew Jersey MSACS not evidentNew Mexico NCACS Current unwritten policy is to encourage progress at the
institutional level in assessment of student learning andinstitutional performance, supporting NCACS’ accreditationrequirements.
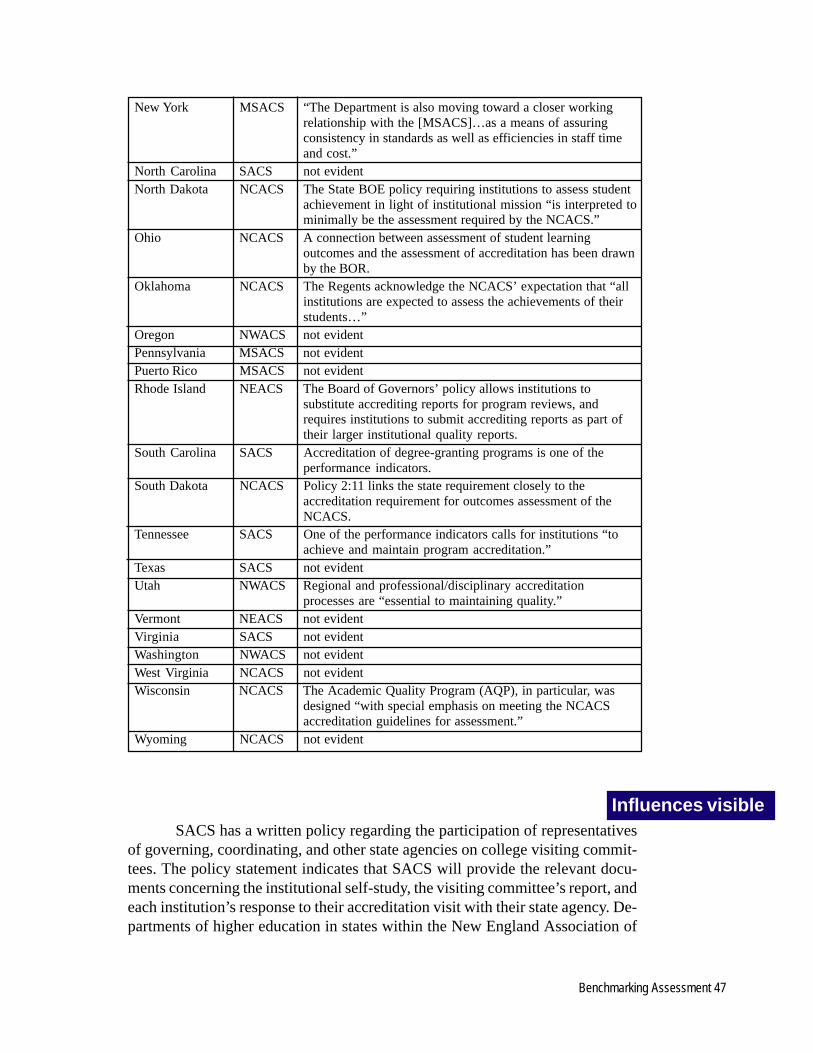
Benchmarking Assessment 47
New York MSACS “The Department is also moving toward a closer workingrelationship with the [MSACS]…as a means of assuringconsistency in standards as well as efficiencies in staff timeand cost.”
North Carolina SACS not evidentNorth Dakota NCACS The State BOE policy requiring institutions to assess student
achievement in light of institutional mission “is interpreted tominimally be the assessment required by the NCACS.”
Ohio NCACS A connection between assessment of student learningoutcomes and the assessment of accreditation has been drawnby the BOR.
Oklahoma NCACS The Regents acknowledge the NCACS’ expectation that “allinstitutions are expected to assess the achievements of theirstudents…”
Oregon NWACS not evidentPennsylvania MSACS not evidentPuerto Rico MSACS not evidentRhode Island NEACS The Board of Governors’ policy allows institutions to
substitute accrediting reports for program reviews, andrequires institutions to submit accrediting reports as part oftheir larger institutional quality reports.
South Carolina SACS Accreditation of degree-granting programs is one of theperformance indicators.
South Dakota NCACS Policy 2:11 links the state requirement closely to theaccreditation requirement for outcomes assessment of theNCACS.
Tennessee SACS One of the performance indicators calls for institutions “toachieve and maintain program accreditation.”
Texas SACS not evidentUtah NWACS Regional and professional/disciplinary accreditation
processes are “essential to maintaining quality.”Vermont NEACS not evidentVirginia SACS not evidentWashington NWACS not evidentWest Virginia NCACS not evidentWisconsin NCACS The Academic Quality Program (AQP), in particular, was
designed “with special emphasis on meeting the NCACSaccreditation guidelines for assessment.”
Wyoming NCACS not evident
SACS has a written policy regarding the participation of representativesof governing, coordinating, and other state agencies on college visiting commit-tees. The policy statement indicates that SACS will provide the relevant docu-ments concerning the institutional self-study, the visiting committee’s report, andeach institution’s response to their accreditation visit with their state agency. De-partments of higher education in states within the New England Association of
Influences visible

48 Benchmarking Assessment
Schools and Colleges region are notified annually of institutions being evaluatedby the commission and often a staff member of the department accompanies theaccreditation team as an observer.
MSACS has participated in informal discussions with the PennsylvaniaState System of Higher Education and with New Jersey’s Excellence and Ac-countability Committee. NCACS maintains regular communications and discus-sions with officers of state governing and coordinating boards in its region. Inter-estingly, of the six regional associations NCACS has gone to the greatest lengthsto understand the potential, and pursue opportunities for connections with statepolicymakers. In 1990 and 1996 NCACS surveyed the state higher educationagencies of the 19 states in its region, asking states about their expectations forassessment and how much the states knew of NCACS’s initiative to assess stu-dent academic achievement. The 1996 report, State Agency Expectations forAssessment in the North Central Region: A Follow-up on the 1990 Survey, madethe following observations:· North Central’s assessment initiative has had significant impact in terms of
informing and accelerating a number of state assessment efforts;· States would like to see greater communication and collaboration between
themselves and North Central to enhance institutional assessment efforts viainformation sharing and training opportunities;
· And, a joint cataloging of NCACS and state assessment expectations would behelpful to the association, state agencies, and institutions.
The Oklahoma and Ohio Boards of Regents acknowledge that North Cen-tral’s expectations for assessment have influenced their state policies. Illinois’and South Dakota’s assessment policy components closely parallel those of NorthCentral. In Wisconsin the AQP was designed as a means of meeting the associa-tion’s guidelines for assessment.
The patterns found in the North Central region can be found elsewhere.Mississippi, which is a SACS constituency, explicitly states that its trustees clearlylinked their assessment policies and practices with the SACS requirements. Thedevelopment of Alaska’s Educational Effectiveness Policy and Nevada’s assess-ment practices are partially attributed to Northwest Association of Schools andColleges’ self-study assessment requirements.
A pattern of interdependence and mutual influence between some stateand regional accreditation associations is evident. The actual strength and natureof the influence are difficult to fully discern at this stage of the research, but theconnections suggest future direction for the next stages of this project. The statesneed to be explicitly asked how and in what specific ways the regional accredita-tion association assessment policies have influenced state policies and institu-tional practices.

Benchmarking Assessment 49
Over the past 12 years the regional accrediting associations have adoptedas a central measure of institutional effectiveness the assessment of student learn-ing. Institutional adoption and use of outcomes assessment is best characterizedas still being in the early phases of development. As Table 12 illustrates, the asso-ciations have only recently engaged in systematically guiding and training theirinstitutional membership in assessment practices and processes.
Table 12Association Assessment-Focused Resource Materials and Institutional Train-ing Programs
Concomitantly several of the associations have recently engaged in effortsto determine the status of their assessment efforts (see Table 13). In 1995 MiddleStates conducted a survey of their member institutions to determine what progresstheir members had made in assessment. The association found that over half of theresponding institutions had no institutional assessment plan and just over one-third had a plan that was no more than three years old. Institutions requestedassistance in developing their plans and Middle States has responded by designingworkshops for their member institutions. In the fall of 1996 and continuing into1997 the training seminars Middle States has been conducting have been well-attended, indicating the present need and desire for associational assistance.
Table 13Association Evaluation of Assessment Efforts
Regional Association Evaluation Project Name and Year
Middle States Association Outcomes Assessment Survey/1995
New England Association Student Outcomes Assessment Project/1997
North Central Association Opportunities for Improvement/1996
Northwest Association none apparent
Southern Association none apparent
Western Association none apparent
Training role new
Regional Association Resource Materials Institutional Training
Middle States Association Framework (1990, 1996 editions) Training Symposia (1996-1997)
New England Association Background Paper/Planning and Initiated in 1997, Student OutcomesEvaluation Session and Student Assessment Project’s aim is toOutcomes Assessment Project inform development of training
North Central Association Characteristics of an Assessment 1991 regional workshops introducingProgram and Worksheet to Judge commitment to assessmentInclusion of Assessment Data
Northwest Association Policy 25 none apparent
Southern Association Resource Manual on Institutional none apparent Effectiveness
Western Association Resource Manual: Achieving assessment included in allInstitutional Effectiveness institutional self-study workshopsThrough Assessment

50 Benchmarking Assessment
The New England Association of Schools and Colleges is currently fol-lowing directly in Middle States footsteps with the initiation of the Student Out-comes Assessment Project. The major goal of this initiative is to assist institu-tions in designing systematic approaches and specific processes for assessing in-stitutional effectiveness and designing means for quality improvement. Memberinstitutions were to be surveyed in the spring of 1997 to determine how the asso-ciation should proceed, what the institutions need assistance with, and what kindof initiative the association should design. Institutions are being asked to indicatehow they understand and approach student outcomes assessment in undergradu-ate academic programs and how assessment results are used to inform institu-tional decision making and planning processes. From these responses materialsand training sessions will be designed to facilitate institutional progress with re-gard to outcomes assessment.
North Central, as of June 1995, required all of its member institutions tosubmit an explicit plan for how they have been or will be approaching the assess-ment of student academic achievement. By March of 1996 most of the plans hadbeen received and reviewed and a report describing the scope and direction ofassessment in the region was written. Review of the plans culminated in oneoverarching recommendation that institutions determine more explicitly how theywere contributing to student cognitive, behavioral, and/or affective development.
These three regional accreditation associations are working to determinewhere their member institutions are and how they can facilitate further progressin assessing outcomes through training workshops and materials, as well asdefinitional fine-tuning.
Of the regional accrediting associations the Western Association ofSchools and Colleges is taking some of the greatest strides forward. Specifically,it is trying to reframe the goal of accreditation around building institutional ca-pacity to improve teaching and learning, versus merely meeting standards. In aseries of experimental self-studies being conducted in the spring of 1997, WASCis attempting to reconsider what the role of accreditation might be – a role thatengages the critical issues in higher education. WASC seeks to involve and sup-port institutions in building “cultures of evidence” which consciously considerwhat information is needed to understand what and how students are learning;how instructional practices affect that process and what can be done with theinformation once gathered.
WASC’s work suggests that accreditation is at yet another crossroads, asthe association strives to move the assessment of outcomes to a level of greaterclarity and maturity in practice. At the same time, leaders in the other regionalaccrediting associations are pursuing critical queries and providing insightful an-swers as to how learning and teaching can be enhanced in our nation’s collegesand universities.
Benchmarking Assessment 51
This report has provided a brief history of state and regional accreditationassociation assessment policy development, a review of prior research findings,and an analysis of the status of assessment policies and practices in each of thefifty states and six regional accrediting associations. This work lays the foundationfor Year 2 of research which will focus on gaining an even more detailed under-standing of the intent and role of the states and accreditation associations in shap-ing assessment policies and practices. Of equal importance will be the solicitationof the opinions of policymakers and higher education and regional accreditationleaders about the effectiveness of the current policies and practices.
The following questions and observations which emerged from this firstyear of policy analysis will guide the next year of inquiry:
· In what ways does the political context ( e.g., governance structure, relationshipof state council and board executives with political leaders) of each state influ-ence the nature and content of state assessment policies and practices?
· In what ways are states influencing each other’s assessment policies and prac-tices?
· What is the degree and nature of influence between the states and regional ac-crediting associations with regard to their assessment policies and practices.Who is influencing whom, and how?
· What is the intent of those states using common assessment practices and instru-ments?
· Four approaches to using financial incentives and consequences to leverage as-sessment activities have been identified. What explains why states chose thepolicy approaches that they are currently implementing? Is there evidence ofdiffering outcomes based on approach?
Future directions
Some guidelines:context influencesinter-state exchangesother relationshipsstates’ intentionsincentive choices

52 Benchmarking Assessment

Benchmarking Assessment 53

54 Benchmarking Assessment

Benchmarking Assessment 55

56 Benchmarking Assessment

Benchmarking Assessment 57

58 Benchmarking Assessment

Benchmarking Assessment 59

60 Benchmarking Assessment

Benchmarking Assessment 61

62 Benchmarking Assessment

Benchmarking Assessment 63

64 Benchmarking Assessment

Benchmarking Assessment 65

66 Benchmarking Assessment