benchmarking countries in the knowledge...
TRANSCRIPT
BBEENNCCHHMMAARRKKIINNGG CCOOUUNNTTRRIIEESS IINN TTHHEE KKNNOOWWLLEEDDGGEE EECCOONNOOMMYY:: PPRREESSEENNTTAATTIIOONN OOFF TTHHEE KKNNOOWWLLEEDDGGEE AASSSSEESSSSMMEENNTT MMEETTHHOODDOOLLOOGGYY ((KKAAMM))
KKNNOOWWLLEEDDGGEE FFOORR DDEEVVEELLOOPPMMEENNTT PPRROOGGRRAAMM WWOORRLLDD BBAANNKK IINNSSTTIITTUUTTEE
November 9, 2004
BENCHMARKING COUNTRIES IN THE KNOWLEDGE ECONOMY:
PRESENTATION OF THE KNOWLEDGE ASSESSMENT METHODOLOGY (KAM)
KNOWLEDGE FOR DEVELOPMENT PROGRAM, WORLD BANK INSTITUTE
TABLE OF CONTENTS
Page 1. Overview
1.1 Purpose of the Presentation 1 1.2 Motivation for Developing the Knowledge Assessment Methodology 1 1.3 KAM Applications 2 1.4 Description of the 2004 Interactive KAM 3 1.5 Plans of Enhancing further the Methodology 4
2. Major Facts and Figures : Demonstration of KAM
2.1 World Knowledge Economy (KE) Map 5 2.2 Knowledge Economy Index (KEI) and Growth 6 2.3 Knowledge Economy Index : Global View 7 2.4 Knowledge Economy : Regional Performance 8 2.5 Knowledge Economy : Not just any kind of Growth 9 2.6 Size matters – Innovation 10 2.7 Normalization Options : Regional Approach 11 2.8 Normalization Options : Income Approach 12 2.9 Pillar Representation – Innovation 13 2.10 Aggregate Performance Snapshot in the four Pillars of KE 14 2.11 Two Country Comparison 15
3. Additional Information
3.1 Knowledge Assessment Methodology 17 3.2 Basic Scorecard 17 3.3 Knowledge Economy Index (KEI) and Knowledge Index (KI) 19 3.4 Normalization Procedure for the KAM 19
4. Annexes
Annex 1. Countries Included in the KAM 20 Annex 2. List of Clusters and Variables Available in the KAM Clusters 21 Annex 3. Normalization Procedure Used for the KAM 25
1
BENCHMARKING COUNTRIES IN THE KNOWLEDGE ECONOMY:
PRESENTATION OF THE KNOWLEDGE ASSESSMENT METHODOLOGY (KAM) 1. OVERVIEW 1.1 Purpose of the Presentation WBI’s Knowledge for Development (K4D) group has developed a Knowledge Assessment Methodology (KAM). The KAM (www.worldbank.org/kam) benchmarks the performance of an economy or region relative to its neighbors, competitors, or countries it wishes to emulate on important aspects related to the knowledge economy. This tool helps to highlight that countries need to develop explicit strategies to harness knowledge to improve growth, welfare and increase competitiveness. The KAM is in high demand by clients, particularly those in Middle Income Countries and it significantly enhances the content and relevance of WBI’s country-related work, as well as facilitates the development of linkages and co-operation between WBI and the Bank’s operational and thematic groups. This briefing to the Board, follows from a presentation to Mr. Wolfensohn and his suggestion to pursue a Bank-wide information campaign about this product starting from senior management. The objective of this briefing is to demonstrate to Board members and their staff, the use and functionalities of an interactive web-based knowledge economy benchmarking tool developed by WBI. 1.2 Motivation for Developing the Knowledge Assessment Methodology (KAM) The KAM was developed in order to serve as a benchmarking and guiding tool to help the Bank’s clients increase their growth and welfare in the current competitive and dynamic global environment: We are in the midst of what could be called a “knowledge revolution” because of the speed-up in the creation and dissemination of knowledge expressed by rapid scientific and technological progress and significantly increased importance of innovations, education and updated skills for sustainable economic performance and improvement in human development. This imposes the need for constant restructuring and upgrading in an increasingly competitive knowledge-based international environment. While this opens up opportunities for leapfrogging, it also raises the risks for developing countries to fall behind because of an increasing knowledge divide. The term Knowledge Economy (KE) has been coined to reflect this increased importance of knowledge as a critical factor for economic performance. A knowledge-based economy is one where organizations and people efficiently acquire, create, disseminate and use knowledge for greater economic and social development. The K4D program has developed the following framework consisting of four pillars to help countries articulate strategies for their transition to a knowledge economy :
2
• An economic and institutional regime that provides incentives for the efficient creation, dissemination, and use of existing knowledge.
• An educated and skilled population that can create and use knowledge. • An effective innovation system consisting of research centers, universities, think
tanks, and other organizations that can, not only tap into the growing stock of global knowledge, assimilate and adapt it to local needs, but also create knowledge.
• A dynamic information infrastructure that can facilitate the effective dissemination and processing of information.
Underpinning the above is the need to coordinate actions across these four pillars, because there are strong inter-dependencies among them. The KAM highlights the need to develop linkages and coordination across the aforementioned key pillars, as well as among government, the private sector and civil society. The methodology allows for a cross-sectoral diagnostic analysis, a preliminary knowledge economy assessment, of an economy and helps policy makers, staff and researchers in identifying the challenges and opportunities that a country or region faces, and where it may need to focus policy attention or future investments. 1.3 KAM Applications Interest and demand for the KAM’s applications, by both internal and external audiences, has been increasing dramatically since its inception in 1999, while the KAM has become an integral part of the K4D program’s core products, services and country related work. The KAM is used as the basic first diagnostic tool for designing the program’s country policy services – knowledge economy assessment reports. The KAM supports the group’s country knowledge economy assessment work which, depending on the depth of the analysis, vary from desk benchmarking assessments (recent examples: Slovakia, Brazil) and enhanced / sector assessments (recent examples: India, Turkey, Morocco), to comprehensive knowledge economy assessments (published reports on Chile, Korea and China, under review Mexico, and ongoing KE work for Life Long Learning (LLL) for China). Overall, the KAM has been successfully applied in economic and sector work and in policy discussions with major Bank clients and partners in all income classes:
Low income : Ghana, India, Mauritania, Tanzania, Uganda, Vietnam
Lower middle income : Armenia, Brazil, China, El Salvador, Russian Federation, South Africa, Tunisia, Turkey
Upper middle income : Argentina, Chile, Lithuania, Latvia, Mexico, Poland, Slovak Republic
High income countries : Korea KAM has also been used extensively to support the content of presentations and stimulate discussions during the numerous learning events - policy forums in which K4D has
3
participated and/or organized individually or jointly with other stakeholders. Most recent and large-scale examples include : the World Knowledge Forum in Seoul, the Knowledge Economy Conference for ECA Accession countries in Paris, the Knowledge for Development Forum I & II for MNA countries in Marseille and the Conference on the Role of Knowledge and Innovation in Competitiveness in El Salvador. Furthermore KAM, using also GDLN technologies and facilities, has been instrumental in the quality enhancement of the training sessions K4D has been providing for Bank staff and external audiences throughout the years (AFR, ECA, MNA, EAP). The methodology’s flexibility, quick result production and easy use, has significantly raised awareness of the importance of KE work within the Bank and outside. A significant outcome of this has been the mainstreaming of KE work in the ECA region (creation of ECA KE Unit) and building capacity in the region to undertake country-specific KE work (Lithuania, Latvia, Poland, Turkey) and organize large-scale international KE events (i.e. Helsinki, Budapest). 1.4 Description of the 2004 interactive KAM The newly upgraded 2004 Knowledge Assessment Methodology (KAM) (www.worldbank.org/kam) is designed for direct use by the Bank’s clients, as well as, by Bank staff engaged in undertaking knowledge readiness assessments. It provides a composite index – the Knowledge Economy Index (KEI) - which is a measurement of knowledge preparedness and allows for benchmarking and comparison of regions and/or countries based on their aggregate performance in the four KE pillars. It can facilitate comparison of any particular country or region with other regions and/or any countries of the total 121 countries and 9 country groupings currently covered in the database. Furthermore, the methodology allows for comparison of countries within the same Region; with countries within a particular range of the Human Development Index (HDI) ; or within a particular Income level. This range of choices allows users to select the comparisons that best suit their own needs. In addition, the 2004 KAM includes other features: • Expanded coverage to use any combination of structural and qualitative variables (76
in total) grouped in seven functional clusters for 121 countries, including most of the developed OECD economies and about 90 developing countries (Annex 2)
• Time comparison for two points in time: 1995 and most recent available year for a subset of 14 variables (Section 3.2.)
• Enhanced number of modes: Basic Scorecard, Create your own scorecard!, Cross-country comparison, Global knowledge economy comparisons over time and World Map.
• Variety of presentational tools: KE scorecards, diamonds, bar charts and tables. • Technical notes on variables chosen and the methodology.
4
1.5 Plans for enhancing further the methodology The K4D program is constantly revising the KAM aiming for accurate, high quality and up-to-date results. Some of the immediate plans for enhancing the methodology include :
• Introduction of micro- private sector – investment climate indicators • Expansion of the country coverage • Enhancement of the technical capacity of the methodology allowing for larger data
series comparison and multiple comparison criteria • Rigorous statistical work exploring correlation of the knowledge economy defining
variables with economic growth • Collaboration with DEC and PREM and Development Gateway
All these plans would require an investment in data collection and analysis, some of which will come out of the ongoing client work. The use of the tool and the evolution of its demand will be the drivers of the speed at which these enhancements can be completed. An upfront investment in new features is a strategic decision which has been proven, as the biggest users of the data and analysis at present are the developed and advanced middle income countries. Work to customize the tool for PRSP countries, and to build the in-country capabilities to use the tool will be of primary importance going forward.
5
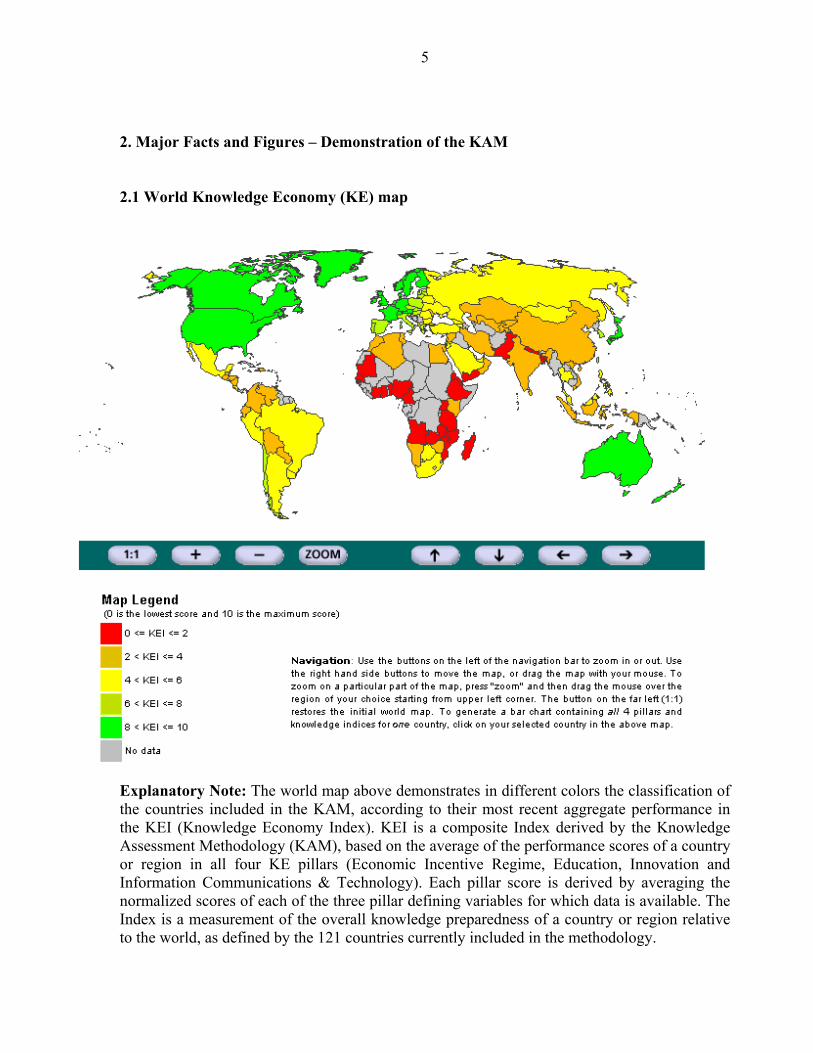
2. Major Facts and Figures – Demonstration of the KAM
2.1 World Knowledge Economy (KE) map
Explanatory Note: The world map above demonstrates in different colors the classification of the countries included in the KAM, according to their most recent aggregate performance in the KEI (Knowledge Economy Index). KEI is a composite Index derived by the Knowledge Assessment Methodology (KAM), based on the average of the performance scores of a country or region in all four KE pillars (Economic Incentive Regime, Education, Innovation and Information Communications & Technology). Each pillar score is derived by averaging the normalized scores of each of the three pillar defining variables for which data is available. The Index is a measurement of the overall knowledge preparedness of a country or region relative to the world, as defined by the 121 countries currently included in the methodology.
6
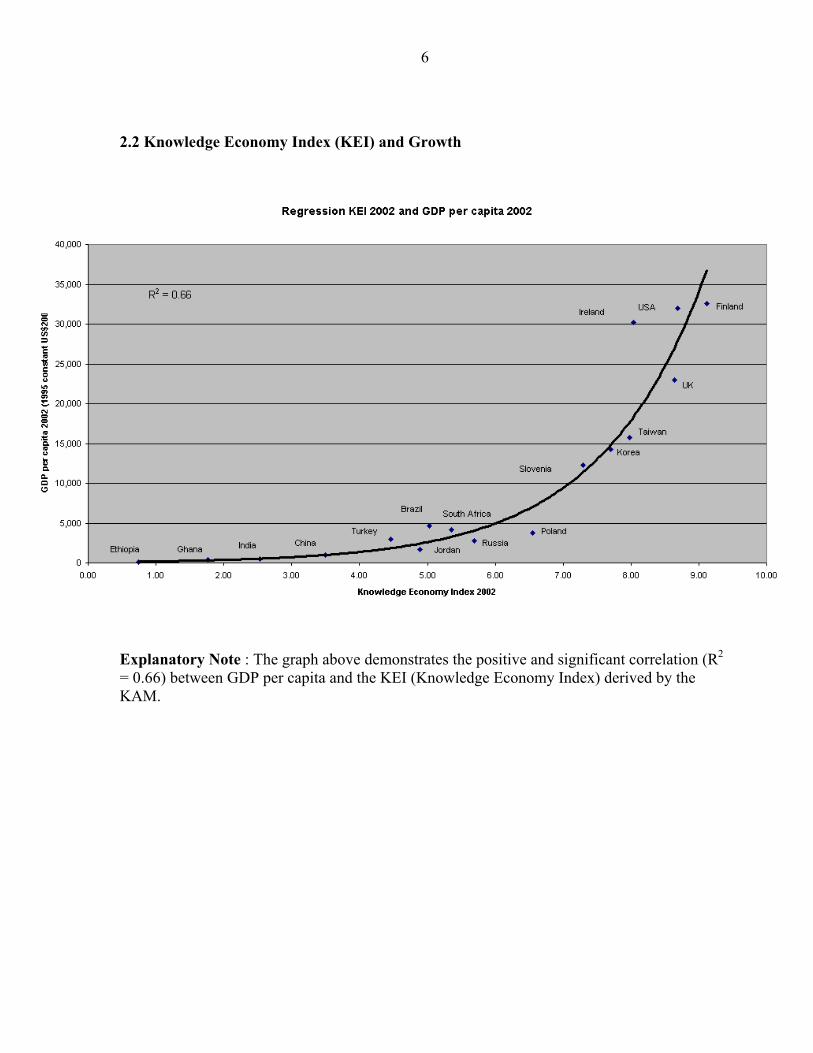
2.2 Knowledge Economy Index (KEI) and Growth
Explanatory Note : The graph above demonstrates the positive and significant correlation (R2 = 0.66) between GDP per capita and the KEI (Knowledge Economy Index) derived by the KAM.
7
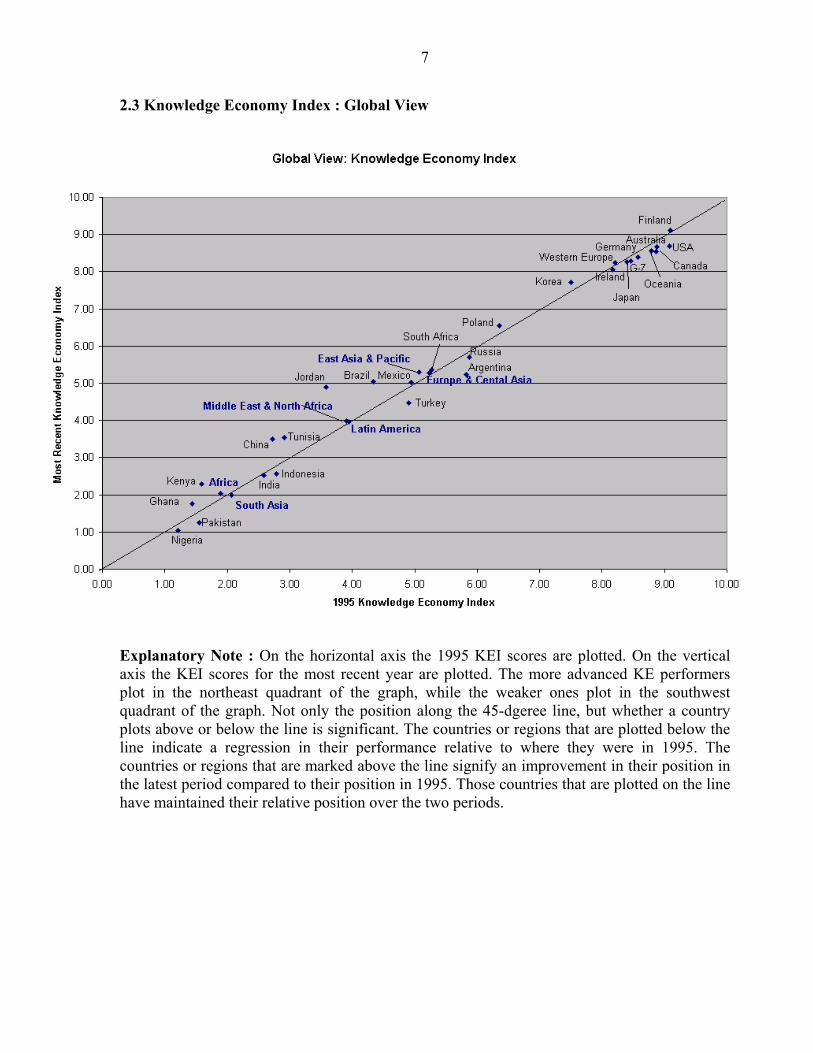
2.3 Knowledge Economy Index : Global View Explanatory Note : On the horizontal axis the 1995 KEI scores are plotted. On the vertical axis the KEI scores for the most recent year are plotted. The more advanced KE performers plot in the northeast quadrant of the graph, while the weaker ones plot in the southwest quadrant of the graph. Not only the position along the 45-dgeree line, but whether a country plots above or below the line is significant. The countries or regions that are plotted below the line indicate a regression in their performance relative to where they were in 1995. The countries or regions that are marked above the line signify an improvement in their position in the latest period compared to their position in 1995. Those countries that are plotted on the line have maintained their relative position over the two periods.
8
2.4 Knowledge Economy : Regional Performance
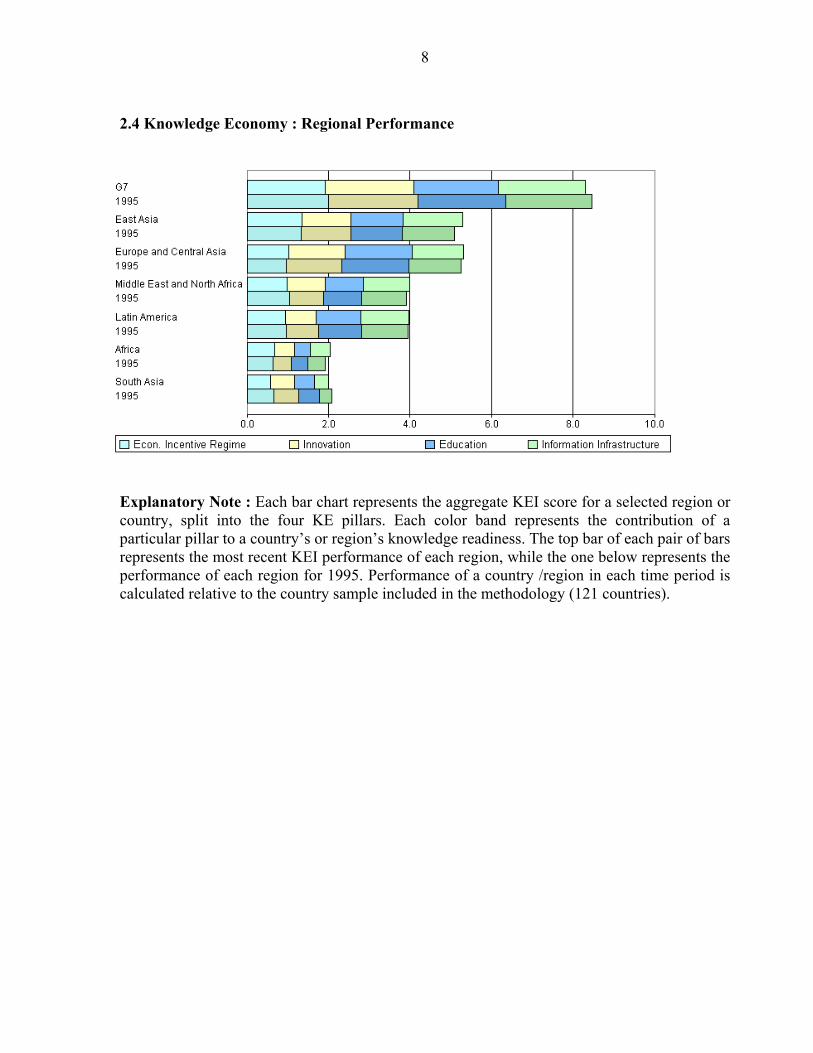
Explanatory Note : Each bar chart represents the aggregate KEI score for a selected region or country, split into the four KE pillars. Each color band represents the contribution of a particular pillar to a country’s or region’s knowledge readiness. The top bar of each pair of bars represents the most recent KEI performance of each region, while the one below represents the performance of each region for 1995. Performance of a country /region in each time period is calculated relative to the country sample included in the methodology (121 countries).
9
2.5 Knowledge Economy : Not just any kind of growth
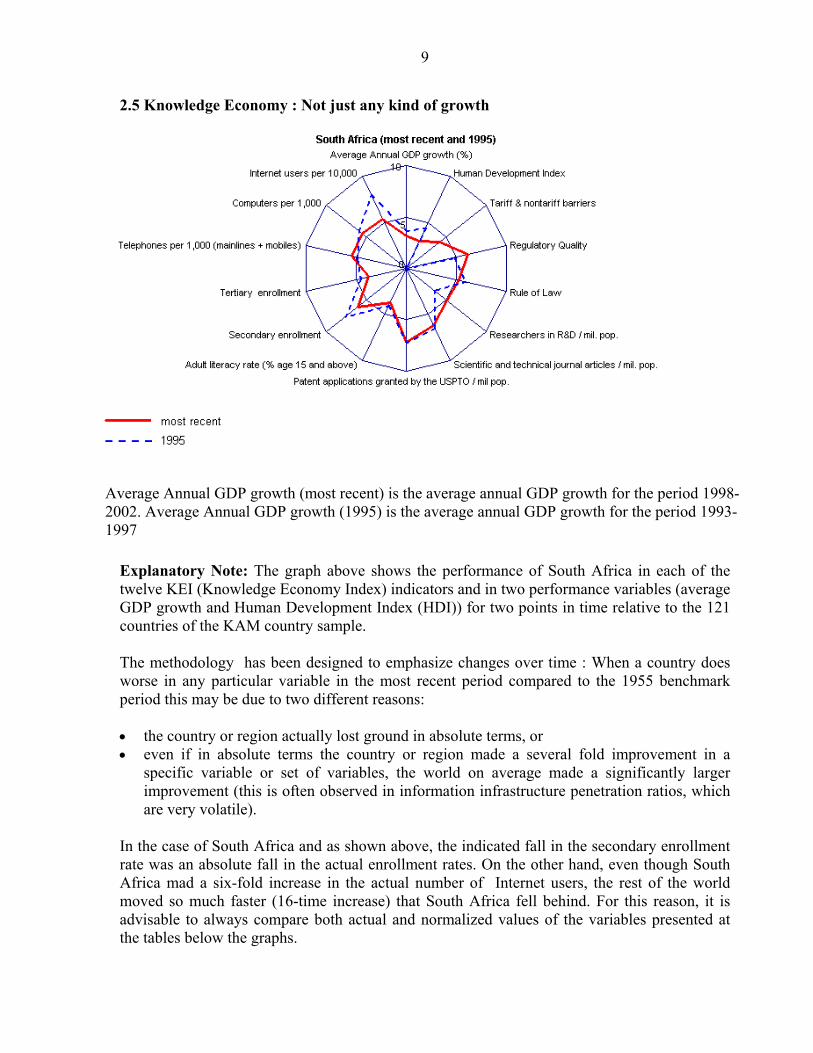
Average Annual GDP growth (most recent) is the average annual GDP growth for the period 1998-2002. Average Annual GDP growth (1995) is the average annual GDP growth for the period 1993-1997
Explanatory Note: The graph above shows the performance of South Africa in each of the twelve KEI (Knowledge Economy Index) indicators and in two performance variables (average GDP growth and Human Development Index (HDI)) for two points in time relative to the 121 countries of the KAM country sample. The methodology has been designed to emphasize changes over time : When a country does worse in any particular variable in the most recent period compared to the 1955 benchmark period this may be due to two different reasons: • the country or region actually lost ground in absolute terms, or • even if in absolute terms the country or region made a several fold improvement in a
specific variable or set of variables, the world on average made a significantly larger improvement (this is often observed in information infrastructure penetration ratios, which are very volatile).
In the case of South Africa and as shown above, the indicated fall in the secondary enrollment rate was an absolute fall in the actual enrollment rates. On the other hand, even though South Africa mad a six-fold increase in the actual number of Internet users, the rest of the world moved so much faster (16-time increase) that South Africa fell behind. For this reason, it is advisable to always compare both actual and normalized values of the variables presented at the tables below the graphs.
10
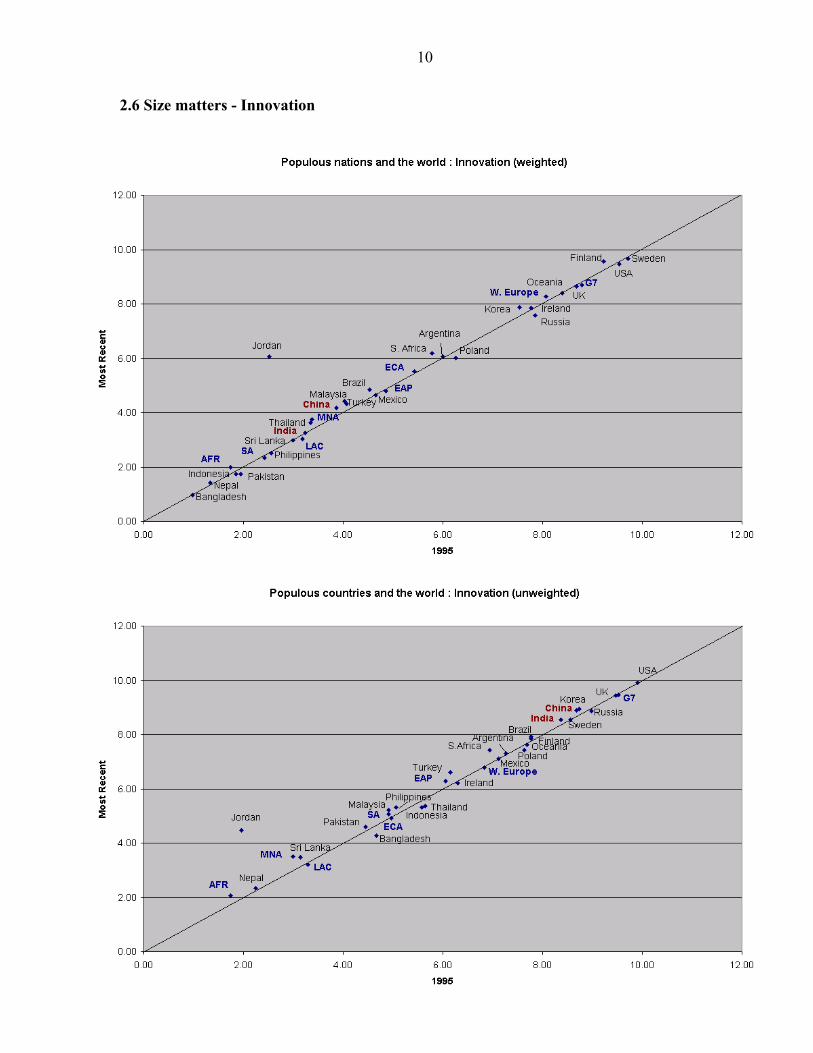
2.6 Size matters - Innovation Note: Countries and / or regions above the 45-degree line demonstrate improvement through time, while countries and/or regions below the 45-degree signal actual regression or improvement below the sample average.
11
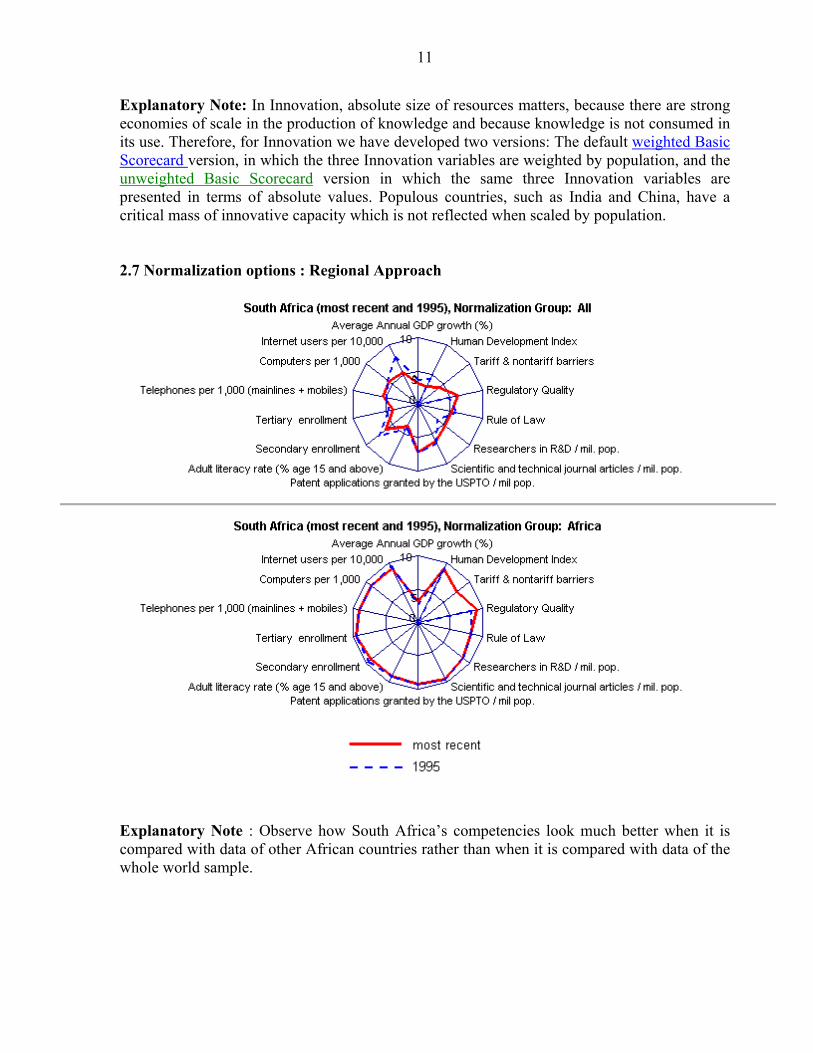
Explanatory Note: In Innovation, absolute size of resources matters, because there are strong economies of scale in the production of knowledge and because knowledge is not consumed in its use. Therefore, for Innovation we have developed two versions: The default weighted Basic Scorecard version, in which the three Innovation variables are weighted by population, and the unweighted Basic Scorecard version in which the same three Innovation variables are presented in terms of absolute values. Populous countries, such as India and China, have a critical mass of innovative capacity which is not reflected when scaled by population. 2.7 Normalization options : Regional Approach
Explanatory Note : Observe how South Africa’s competencies look much better when it is compared with data of other African countries rather than when it is compared with data of the whole world sample.
12
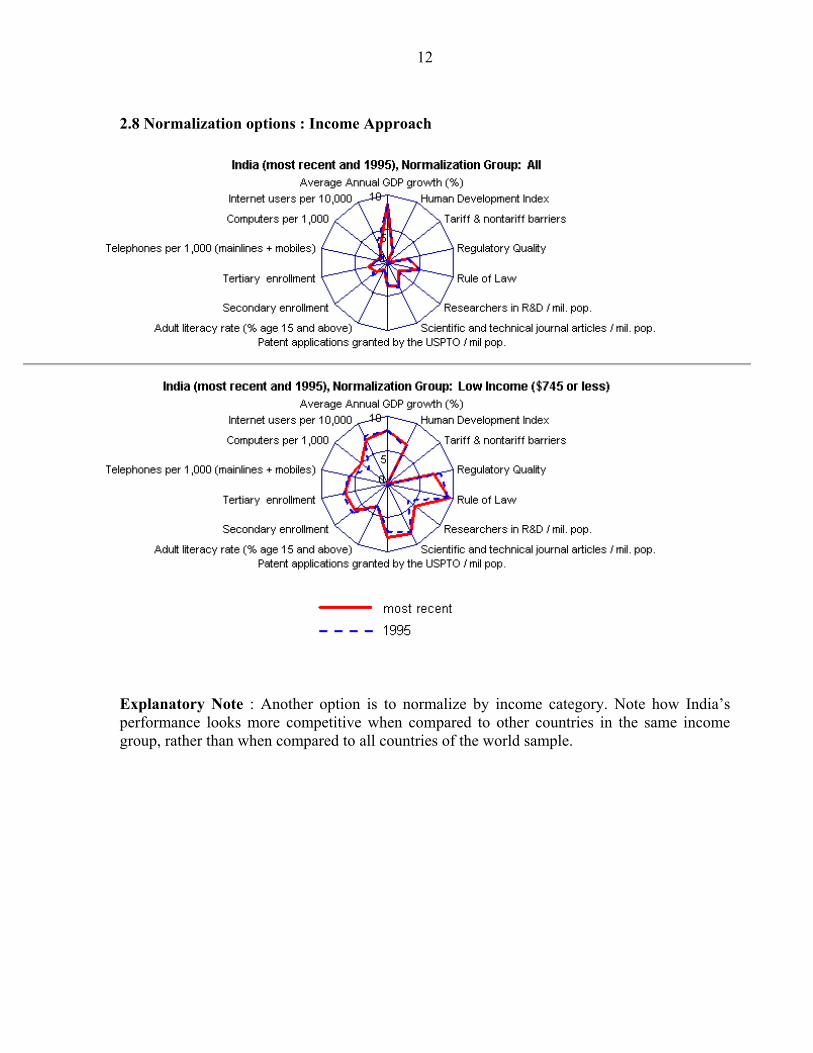
2.8 Normalization options : Income Approach
Explanatory Note : Another option is to normalize by income category. Note how India’s performance looks more competitive when compared to other countries in the same income group, rather than when compared to all countries of the world sample.
13
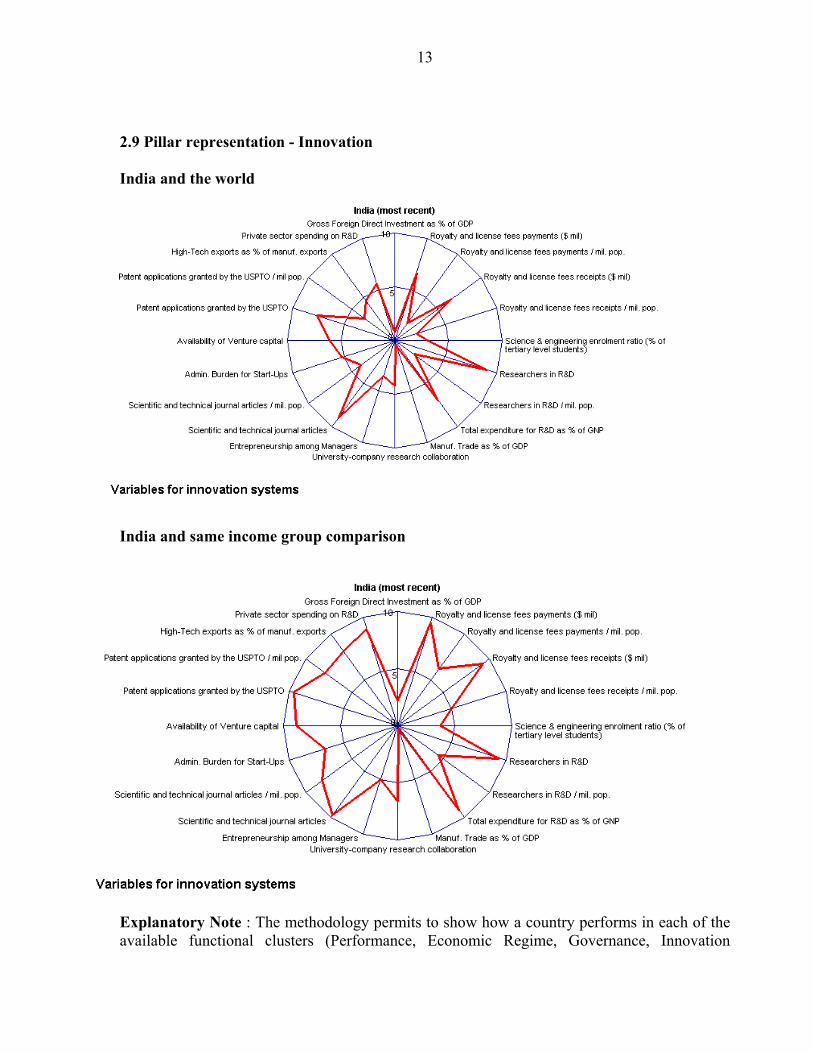
2.9 Pillar representation - Innovation India and the world
India and same income group comparison
Explanatory Note : The methodology permits to show how a country performs in each of the available functional clusters (Performance, Economic Regime, Governance, Innovation
14
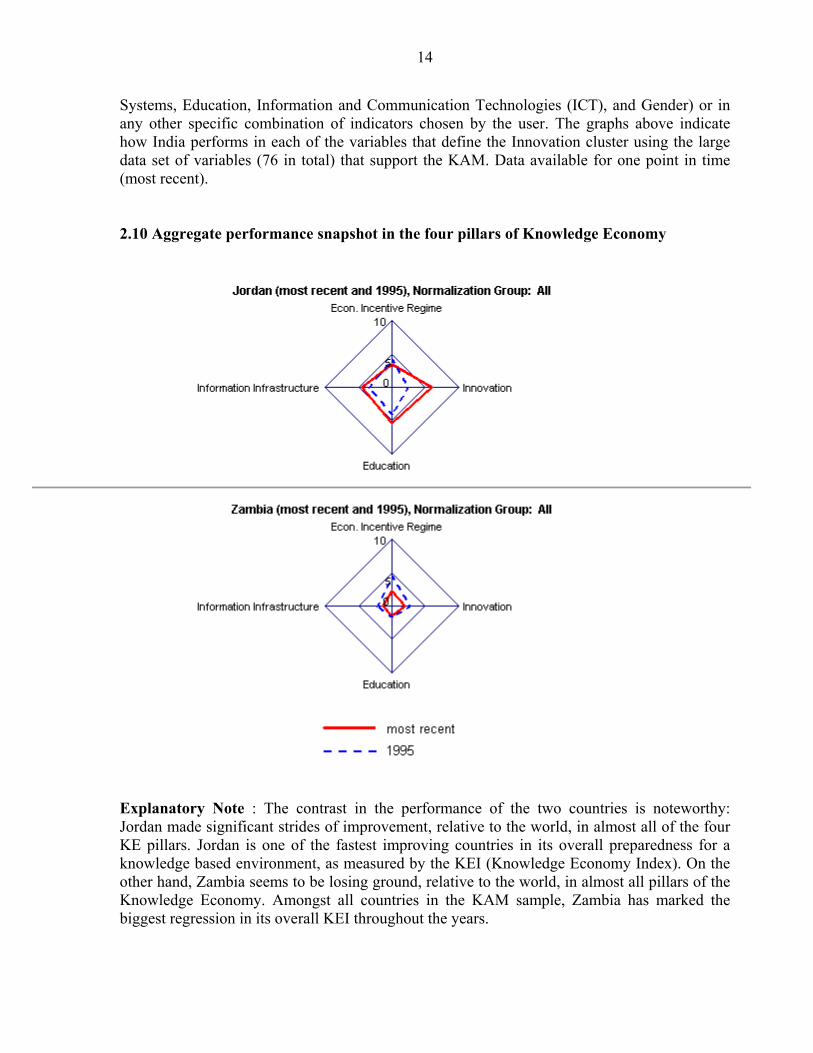
Systems, Education, Information and Communication Technologies (ICT), and Gender) or in any other specific combination of indicators chosen by the user. The graphs above indicate how India performs in each of the variables that define the Innovation cluster using the large data set of variables (76 in total) that support the KAM. Data available for one point in time (most recent). 2.10 Aggregate performance snapshot in the four pillars of Knowledge Economy
Explanatory Note : The contrast in the performance of the two countries is noteworthy: Jordan made significant strides of improvement, relative to the world, in almost all of the four KE pillars. Jordan is one of the fastest improving countries in its overall preparedness for a knowledge based environment, as measured by the KEI (Knowledge Economy Index). On the other hand, Zambia seems to be losing ground, relative to the world, in almost all pillars of the Knowledge Economy. Amongst all countries in the KAM sample, Zambia has marked the biggest regression in its overall KEI throughout the years.
15
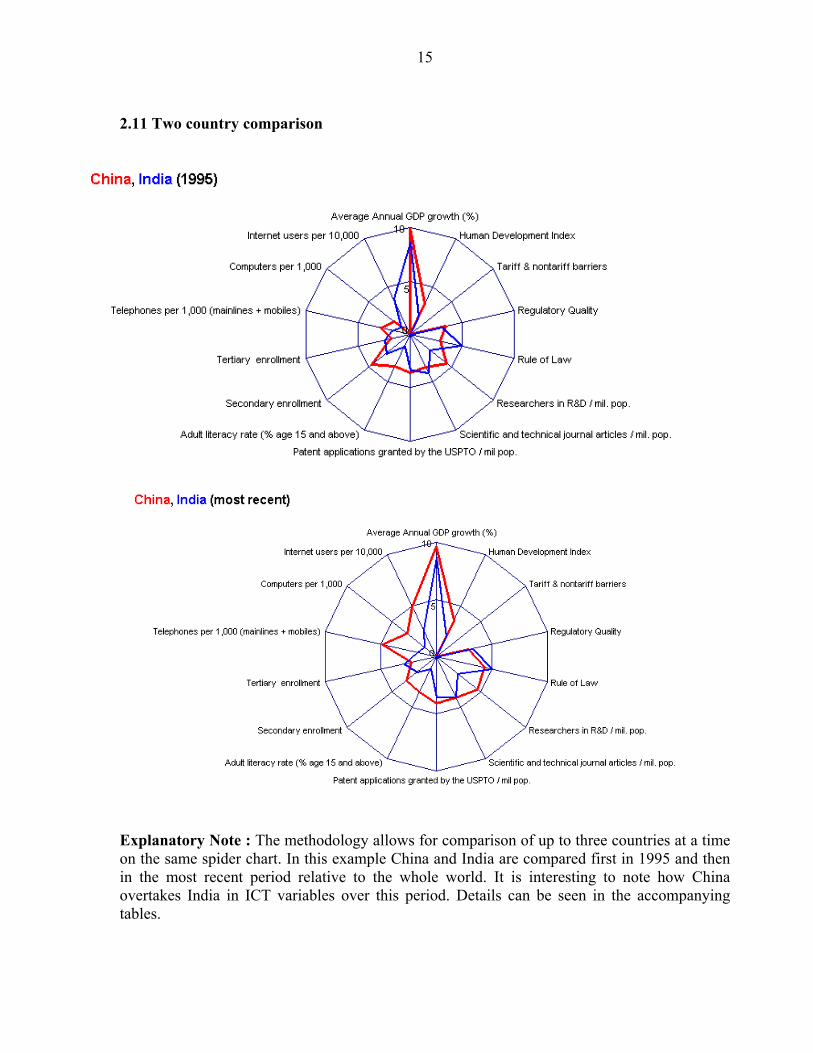
2.11 Two country comparison
Explanatory Note : The methodology allows for comparison of up to three countries at a time on the same spider chart. In this example China and India are compared first in 1995 and then in the most recent period relative to the whole world. It is interesting to note how China overtakes India in ICT variables over this period. Details can be seen in the accompanying tables.
16
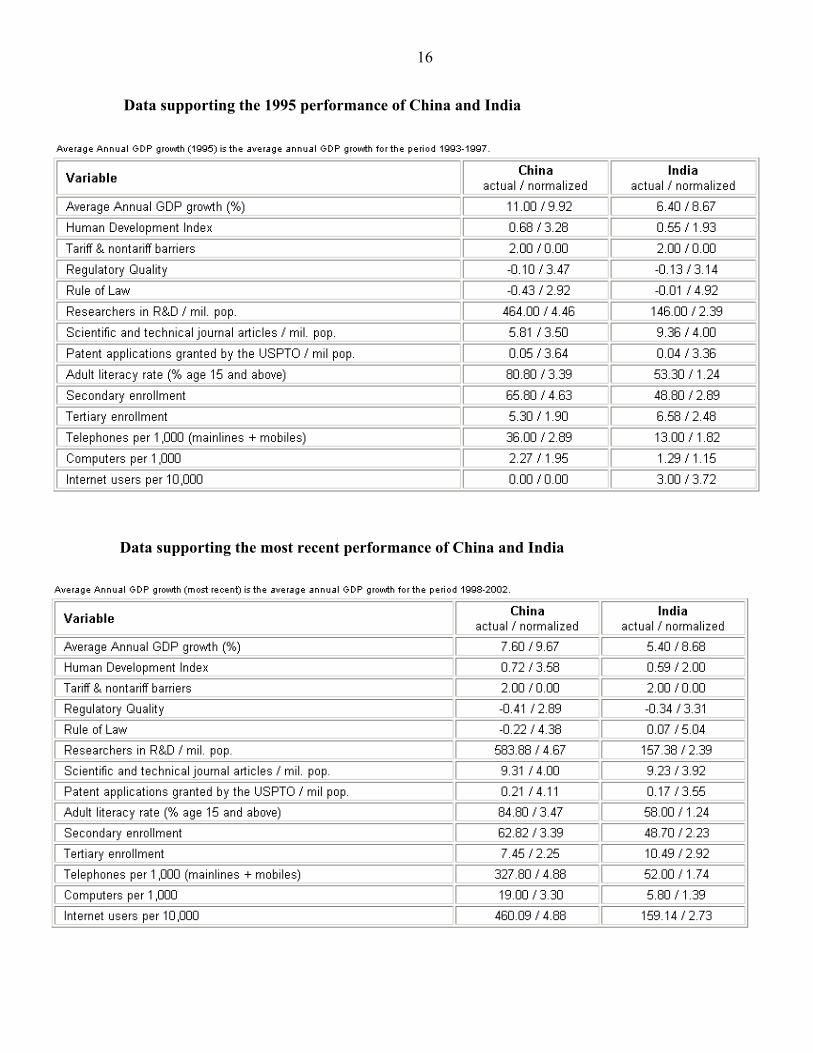
Data supporting the 1995 performance of China and India
Data supporting the most recent performance of China and India
17
3. Additional Information 3.1. Knowledge Assessment Methodology WBI's program on Knowledge for Development (K4D) uses an interactive web-based tool-the Knowledge Assessment Methodology (KAM) which consists of a set of 76 structural and qualitative variables that benchmark how an economy compares with its neighbors, competitors, or countries it wishes to emulate. This simple benchmarking tool is a first step in helping to identify the problems and opportunities that a particular country faces in the four pillars of the knowledge economy (see below), and where it may need to focus policy attention or future investments. The comparison for the 76 variables is undertaken for a group of 121 countries which includes almost all of the OECD economies (except Luxembourg) and about 90 developing countries. A list of countries is presented in Annex 1. The set of 76 variables serve as proxies for the following four pillars that are critical to the development of a knowledge economy (KE): · An economic and institutional regime that provides incentives for the efficient use of existing and new knowledge and the flourishing of entrepreneurship. · An educated and skilled population that can create, share, and use knowledge well. · A dynamic information infrastructure that can facilitate the effective communication, dissemination, and processing of information. · An efficient innovation system of firms, research centers, universities, consultants and other organizations that can tap into the growing stock of global knowledge, assimilate and adapt it to local needs, and create new technology. Included in the KAM are also several variables that track the overall performance of the economy. These variables help to illustrate how well an economy is actually using knowledge for its overall economic and social development. 3.2. Basic Scorecard As working with a large set of 76 variables can be unwieldy, a simplified "basic scorecard" consisting of 12 variables that are based on the four pillars of the knowledge economy, plus two relating to performance, has been developed. In essence, this scorecard attempts to capture a country's preparedness for the knowledge-based economy. This scorecard can be captured for 2 points in time: for 1995 (or closest available) and for the most recent available year. The indicators used in the basic scorecard are as follows: i. Performance Indicators Two variables are used to illustrate the overall performance of a country: annual GDP growth and the human development index. Annual GDP growth is a good indicator of a country's overall economic development. The human development index (HDI) is a composite measure of three components: longevity (measured by life expectancy); knowledge (adult literacy rate
18
and mean years of schooling); and standard of living (real GDP per capita in purchasing power parity). The HDI provides information on the human development aspect of economic growth. ii. Economic Incentive and Institutional Regime Three variables are used as proxies for this pillar. The first, tariff and non-tariff barriers from the Heritage Foundation provides a measure of the degree of competition, and is a composite of the rating on the average tariff rate, non-tariff barriers, and corruption in the customs service. The other two variables have been chosen from WBI's Governance dataset. Regulatory quality measures the incidence of market-unfriendly policies such as price controls or inadequate bank supervision, as well as perceptions of the burdens imposed by excessive regulation in areas such as foreign trade and business development. Rule of law measures the extent to which agents have confidence in and abide by the rules of society. These include perceptions of the incidence of both violent and non-violent crime, the effectiveness and predictability of the judiciary, and the enforceability of contracts. iii. Education and Human Resources Three variables are used for this pillar: the adult literacy rate (percentage of population aged 15 and above) gives a very broad stock measure of educated population, while secondary and tertiary enrolment rates provide a flow rate. Adult literacy rate refers to the percentage of people aged 15 and above who can, with understanding, read and write a short, simple statement on their everyday life. Gross enrollment ratio is the ratio of total enrollment, regardless of age, to the population of the age group that officially corresponds to the level of education indicated. Secondary education completes the provision of basic education that began at the primary level, and aims at laying the foundations for lifelong learning and human development, by offering more subject- or skill-oriented instruction using more specialized teachers. Tertiary education, whether or not to an advanced research qualification, normally requires, as a minimum condition of admission, the successful completion of education at the secondary level. iv. Innovation system Three variables have been chosen to represent this pillar. As an input into the innovation system, we use researchers in R&D per million population. For output, we have patent applications granted by the US Patent and Trademark Office (USPTO) per million population, and scientific and technical journal articles per million population. Patents granted by the USPTO includes utility patents and other types of U.S. documents, such as design patents, plant patents, reissues, defensive publications, and statutory inventions and registrations. The origin of the patent is determined by the residence of the first-named inventor. Scientific and technical journal articles refer to the number of scientific and engineering articles published in the following fields: physics, biology, chemistry, mathematics, clinical medicine, biomedical research, engineering and technology, and earth and space sciences. v. Information Infrastructure Three variables are used for this plank of the knowledge-based economy. Telephones per 1,000 population is the sum of telephone mainlines and mobile phones and provides a better indicator of connectivity than either in isolation. Computers per 1,000 population refers to the number of
19
self-contained computers designed to be used by a single individual and is an indicator of personal computer penetration and use of relatively new technology for information processing. Internet users per 10,000 population refers to the number of computers with active Internet Protocol (IP) addresses connected to the Internet and is used as an indication of how well a population has advanced to the level of adapting and using advanced communication channels (Internet) to serve its priorities. 3.3. Knowledge Economy Index (KEI) and Knowledge Index (KI) The basic scorecard is used to derive the Knowledge Economy Index (KEI) as well as the Knowledge Index (KI). The KEI is calculated based on the average of the performance scores of a country or region in all four pillars related to the knowledge economy (economic incentive regime, education, innovation and information and communications technology). The KI is the simple average of the performance of a country or region in three KE pillars (education, innovation and information and communications technology). The aggregate score for each pillar is derived based on the calculation of the average normalized scores of the three variables that describe a pillar. For both the KEI and the KI, the data is shown for two points in time: 1995 and most recent. 3.4. Normalization Procedure for the KAM Each of the variables used in the KAM is normalized on a scale from zero to 10. It merits attention that an economy should not necessarily aim for a perfect score of 10 on all variables and be on the outer edges of the scorecard. Some variables reflect performance; others reflect trade-offs which characterize different development strategies; still others reflect the particular structural characteristics of an economy. The normalization procedure used for the KAM is presented in Annex 3.
20
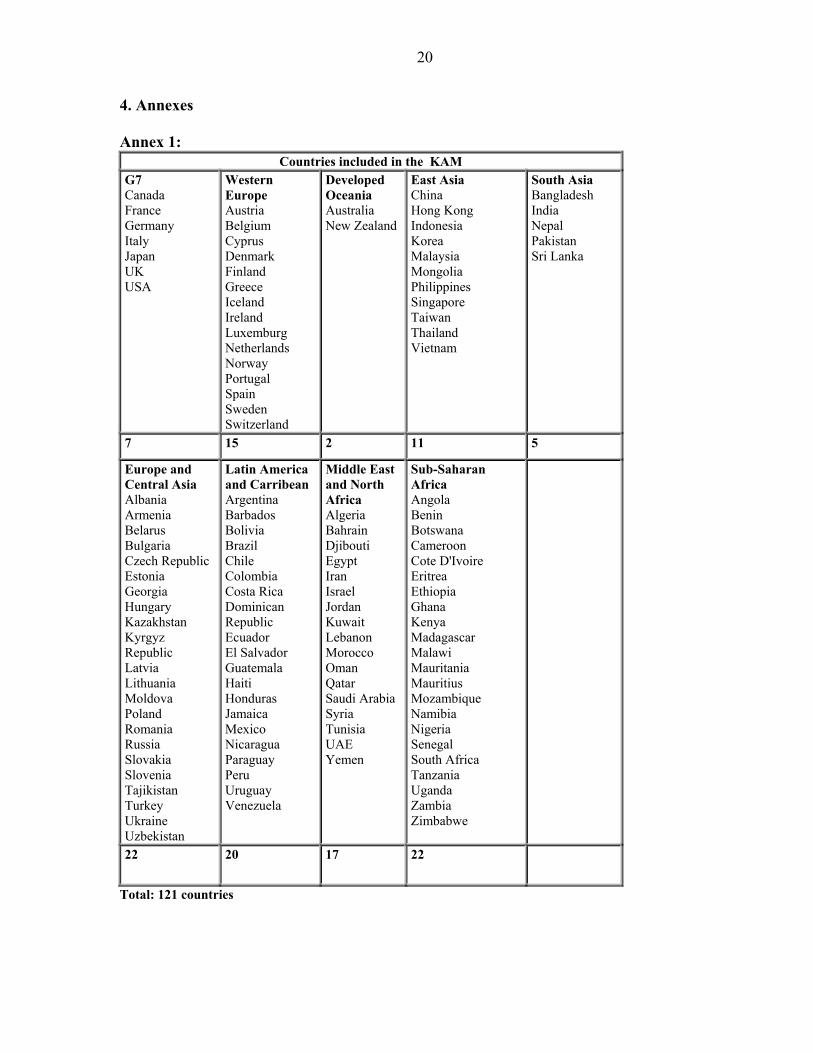
4. Annexes Annex 1:
Countries included in the KAM G7 Canada France Germany Italy Japan UK USA
Western Europe Austria Belgium Cyprus Denmark Finland Greece Iceland Ireland Luxemburg Netherlands Norway Portugal Spain Sweden Switzerland
Developed Oceania Australia New Zealand
East Asia China Hong Kong Indonesia Korea Malaysia Mongolia Philippines Singapore Taiwan Thailand Vietnam
South Asia Bangladesh India Nepal Pakistan Sri Lanka
7 15 2 11 5
Europe and Central Asia Albania Armenia Belarus Bulgaria Czech Republic Estonia Georgia Hungary Kazakhstan Kyrgyz Republic Latvia Lithuania Moldova Poland Romania Russia Slovakia Slovenia Tajikistan Turkey Ukraine Uzbekistan
Latin America and Carribean Argentina Barbados Bolivia Brazil Chile Colombia Costa Rica Dominican Republic Ecuador El Salvador Guatemala Haiti Honduras Jamaica Mexico Nicaragua Paraguay Peru Uruguay Venezuela
Middle East and North Africa Algeria Bahrain Djibouti Egypt Iran Israel Jordan Kuwait Lebanon Morocco Oman Qatar Saudi ArabiaSyria Tunisia UAE Yemen
Sub-Saharan Africa Angola Benin Botswana Cameroon Cote D'Ivoire Eritrea Ethiopia Ghana Kenya Madagascar Malawi Mauritania Mauritius Mozambique Namibia Nigeria Senegal South Africa Tanzania Uganda Zambia Zimbabwe
22 20 17 22
Total: 121 countries
21
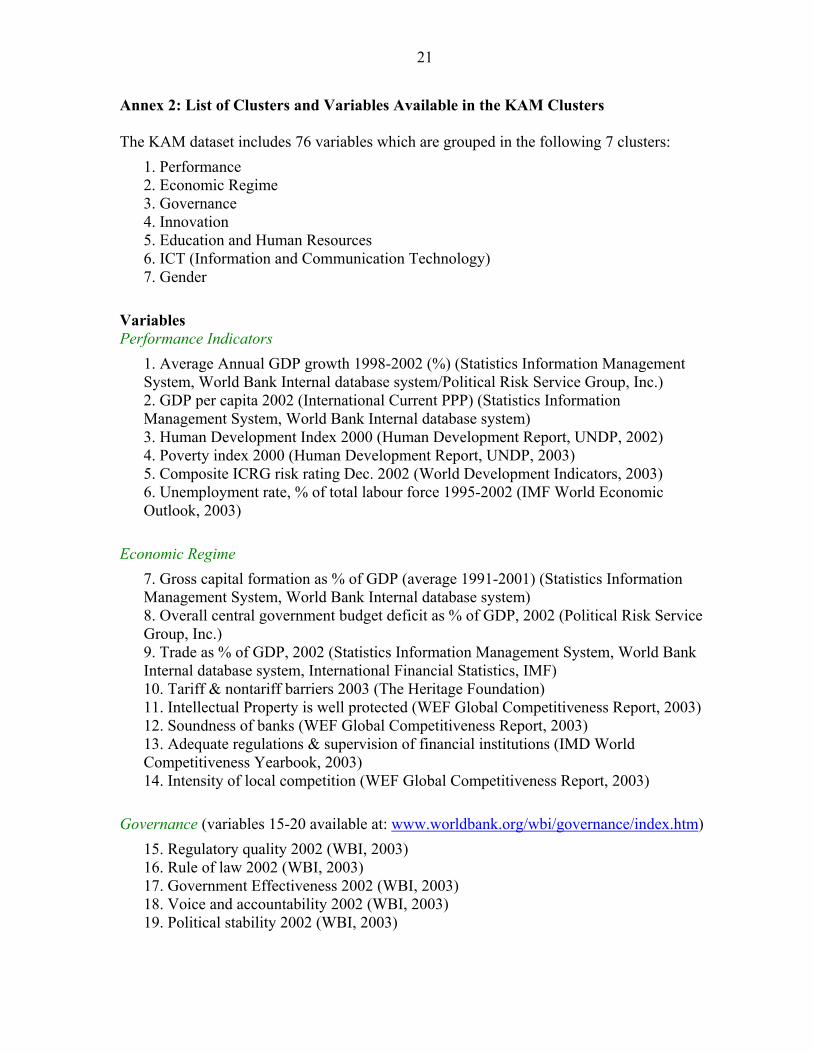
Annex 2: List of Clusters and Variables Available in the KAM Clusters The KAM dataset includes 76 variables which are grouped in the following 7 clusters:
1. Performance 2. Economic Regime 3. Governance 4. Innovation 5. Education and Human Resources 6. ICT (Information and Communication Technology) 7. Gender
Variables Performance Indicators
1. Average Annual GDP growth 1998-2002 (%) (Statistics Information Management System, World Bank Internal database system/Political Risk Service Group, Inc.) 2. GDP per capita 2002 (International Current PPP) (Statistics Information Management System, World Bank Internal database system) 3. Human Development Index 2000 (Human Development Report, UNDP, 2002) 4. Poverty index 2000 (Human Development Report, UNDP, 2003) 5. Composite ICRG risk rating Dec. 2002 (World Development Indicators, 2003) 6. Unemployment rate, % of total labour force 1995-2002 (IMF World Economic Outlook, 2003)
Economic Regime
7. Gross capital formation as % of GDP (average 1991-2001) (Statistics Information Management System, World Bank Internal database system) 8. Overall central government budget deficit as % of GDP, 2002 (Political Risk Service Group, Inc.) 9. Trade as % of GDP, 2002 (Statistics Information Management System, World Bank Internal database system, International Financial Statistics, IMF) 10. Tariff & nontariff barriers 2003 (The Heritage Foundation) 11. Intellectual Property is well protected (WEF Global Competitiveness Report, 2003) 12. Soundness of banks (WEF Global Competitiveness Report, 2003) 13. Adequate regulations & supervision of financial institutions (IMD World Competitiveness Yearbook, 2003) 14. Intensity of local competition (WEF Global Competitiveness Report, 2003)
Governance (variables 15-20 available at: www.worldbank.org/wbi/governance/index.htm)
15. Regulatory quality 2002 (WBI, 2003) 16. Rule of law 2002 (WBI, 2003) 17. Government Effectiveness 2002 (WBI, 2003) 18. Voice and accountability 2002 (WBI, 2003) 19. Political stability 2002 (WBI, 2003)
22
20. Control of corruption 2002 (WBI, 2003) 21. Press freedom 2003 (Freedom House, 2003)
Education and Human Resources
22. Adult literacy rate (% age 15 and above) 2001 (ILO, 2002) 23. Average years of schooling 2000 (Edstats / World Development Indicators, 2002) 24. Secondary enrolment 2000 (Statistics Information Management System, World Bank Internal database system) 25. Tertiary enrolment 2000 (Statistics Information Management System, World Bank Internal database system) 26. Primary Pupil-teacher ratio, pupils per teacher, 2000 (Statistics Information Management System, World Bank Internal database system) 27. Life expectancy at birth, years, 2002 (Statistics Information Management System, World Bank Internal database system) 28. Flexibility of people to adapt to new challenges (IMD World Competitiveness Yearbook, 2003) 29. Public spending on education as % of GDP 2000 (World Development Indicators, 2003) 30. Professional and technical workers as % of the labour force 2001 (ILO, 2002) 31. 8th grade achievement in mathematics (TIMMS 1999) 32. 8th grade achievement in science (TIMMS 1999) 33. National culture is open to foreign influence (IMD World Competitiveness Yearbook, 2003) 34. Extent of staff training (WEF Global Competitiveness Report, 2002/03) 35. Management education is locally available in first class business schools (WEF Global Competitiveness Report, 2002/03) 36. Well educated people do not emigrate abroad (IMD World Competitiveness Yearbook, 2003) 37. University education meets the needs of a competitive economy (IMD World Competitiveness Yearbook, 2003)
Innovation System
38. FDI as percentage of GDP 1990-00 (Statistics Information Management System, World Bank Internal database system) 39. Royalty and license fees payments $ millions 2002 (Statistics Information Management System, World Bank Internal database system) 40. Royalty and license fees payments in US$ millions / million population (Statistics Information Management System, World Bank Internal database system) 41. Royalty and license fees receipts in US$ millions 2002(Statistics Information Management System, World Bank Internal database system) 42. Royalty and license fees receipts in US$ millions / million population 2002 (Statistics Information Management System, World Bank Internal database system) 43. Science & engineering enrolment ratio 1987-1997 (% of tertiary level students) (World Development Indicators 2002) 44. Researchers in R&D (UNESCO 2002)
23
45. Researchers in R&D / million (UNESCO 2002 / SIMA) 46. Total expenditure for R&D as percentage of GNP, 2000 (UNESCO 2002) 47. Manufacturing. Trade as % of GDP 2001 (Statistics Information Management System, World Bank Internal database system) 48. Research collaboration between companies and universities (WEF Global Competitiveness Report, 2002/03) 49. Entrepreneurship among managers (IMD World Competitiveness Yearbook, 2003) 50. Scientific and technical journal articles 1999 (Statistics Information Management System, World Bank Internal database system) 51. Scientific and technical journal articles per million people 1999 (Statistics Information Management System, World Bank Internal database system) 52. Administrative burden for start-ups (WEF Global Competitiveness Report, 2002/03) 53. Availability of venture capital (WEF Global Competitiveness Report, 2002/03) 54. Patent Applications granted by the USPTO 2001 (USPTO, 2001) 55. Patent Applications granted by the USPTO (per million pop.) 2001 (USPTO, 2001) 56. High-technology experts as percentage of manufactured exports 2001 (World Development Indicators, 2003) 57. Private sector spending on R&D (WEF Global Competitiveness Report, 2002/03)
Information Infrastructure
58. Telephones per 1,000 people, 2002 (telephone mainlines + mobile phones) International Telecommunication Union, 2002) 59. Main Telephone lines per 1,000 people, 2002 (International Telecommunication Union, 2002) 60. Mobile phones per 1,000 people, 2002 (International Telecommunication Union, 2002) 61. Computers per 1,000 persons 2002 (International Telecommunication Union, 2002) 62. TV Sets per 1,000 people, 2001 (World Development Indicators, 2003) 63. Radios per 1,000 people, 2001 (World Development Indicators, 2003) 64. Daily newspapers per 1,000 people, 2000 (World Development Indicators, 2003) 65. Investment in telecom as % of GDP 2000 (IMD World Competitiveness Yearbook, 2003) 66. Internet hosts per 10,000 people 2002 (International Telecommunication Union, 2002) 67. Internet users per 10,000 people 2002 (International Telecommunication Union, 2002) 68. International telecommunications: cost of call to US in $ per 3 minutes, 2001 (World Development Indicators, 2003) 69. E-government (WEF Global Competitiveness Report, 2002/03) 70. ICT Expenditures as a % of GDP 2001 (Statistics Information Management System, World Bank Internal database system)
Gender Equality 71. Gender development Index 2002 (Human Development Report, UNDP, 2003) 72. Females in labour force 2001 (% of total labour force) (Statistics Information
24
Management System, World Bank Internal database system) 73. Seats in Parliament held by women (as % of total) (Human Development Report, UNDP 2003) 74. Females Literacy Rate (% of females ages 15 and above) 2001 (ILO, 2002) 75. School enrolment, secondary, female (% gross) 2000 (Statistics Information Management System, World Bank Internal database system) 76. School enrolment, tertiary, female (% gross) 2000 (Statistics Information Management System, World Bank Internal database system)
25
Annex 3: Normalization Procedure Used for the KAM
1. The raw data (u) is collected from World Bank datasets and international literature
for 76 variables and 121 countries.
2. Ranks are allocated to countries according based on the absolute values (raw data) that describe each and every one of the 76 variables (rank u). Countries with the same performance are allocated the same rank. Therefore, the rank equals 1 for a country that performs the best among the 121 countries in our sample on a particular variable (that is, it has the highest score), the rank equals to 2 for a country that performs second best, and so on.
3. The number of countries with worse rank (Nw) is calculated for each country.
4. The following formula is used in order to normalize the scores for every country on every variable according to their ranking and in relation to the total number of countries in the sample (Nc) with available data : Normalized (u) = 10*(Nw/Nc)
5. The above formula allocates a normalized score from 0-10 for each of the 121 countries with available data on the 76 variables. 10 is the top score for the top performers and 0 the worst for the laggards. The top 10% of performers gets a normalized score between 9 and 10, the second best 10% gets allocated normalized scores between 8 and 9 and so on. As mentioned, more than one country may be allocated either the top or worst of normalized scores. The 0-10 scale describes the performance of each country on each variable, relatively to the performance of the rest of the country sample.