benchmarking for improving water supply delivery · benchmarking for improving water supply...
TRANSCRIPT

June 2009
Report
The Water and Sanitation Programis an international partnership forimproving water and sanitation sectorpolicies, practices, and capacities toserve poor people
Benchmarking forImproving WaterSupply Delivery
Bangladesh Water UtilitiesData Book, 2006–07
A partnership between the Local Government Division, Ministry of Local Government,Rural Development and Cooperatives, and Water and Sanitation Program–South Asia

ACKNOWLEDGMENTS:
The Local Government Division (LGD) of the Ministry of Local Government, Rural Development and Cooperatives, as well as theWater and Sanitation Program–South Asia, wish to thank the following water utilities for their cooperation in providing the informationthat made the publication of this Data Book possible.
DISCLAIMER:
Water and Sanitation Program (WSP) reports are published to communicate the results of WSP’s work to the development community.Some sources cited may be informal documents that are not readily available.
The findings, interpretations, and conclusions expressed herein are entirely those of the author and should not be attributed to theWorld Bank or its affiliated organizations, or to members of the Board of Executive Directors of the World Bank or the governments theyrepresent. The World Bank does not guarantee the accuracy of the data included in this work. The boundaries, colors, denominations,and other information shown on any map in this work do not imply any judgment on the part of the World Bank Group concerning thelegal status of any territory or the endorsement or acceptance of such boundaries.
The material in this publication is copyrighted. Requests for permission to reproduce portions of it should be sent [email protected]. WSP encourages the dissemination of its work and will normally grant permission promptly.
City/Town UtilityDhaka Dhaka Water Supply and Sewerage Authority
Chittagong Chittagong Water Supply and Sewerage Authority
Rajshahi Rajshahi City Corporation
Bagerhat Bagerhat Pourashava
Chandpur Chandpur Pourashava
Chapai Nawabganj Chapai Nawabganj Pourashava
Chuadanga Chuadanga Pourashava
Gazipur Gazipur Pourashava
Jessore Jessore Pourashava
Manikganj Manikganj Pourashava
Narsingdi Narsingdi Pourashava
Funding for the project and for the preparation of the Data Book was provided by the Water and Sanitation Program–South Asia(WSP–SA). However, the views and analyses expressed here do not necessarily reflect those of the Local Government Division of theMinistry of Local Government, Rural Development and Cooperatives, the Department of Public Health Engineering, and WSP–SA.The Bangladesh Water Utilities Data Book was prepared by the WSP–SA Benchmarking Project Team in Bangladesh headed byAbdul Motaleb (Senior Water and Sanitation Specialist), and supported by Zakir Hossain (Local Consultant) and Cesar E. Yñiguez(Benchmarking Adviser).
Suggestions and comments made by peer reviewers have been incorporated in the Data Book. It is expected that the Data Book willbe updated every year, with special documentation in the third year.

A partnership between the Local Government Division,Ministry of Local Government, Rural Development and Cooperatives,
and Water and Sanitation Program–South Asia
Benchmarking forImproving WaterSupply Delivery
Bangladesh Water UtilitiesData Book, 2006–07

Acronyms and Abbreviations 4
Foreword 5
Introduction: Benchmarking Urban Water Services 7
Key Indicators, Definitions, and Methodology 8
PART ISummary of Findings 11
Summary of Results for 11 Water Utilities 12
Utility-wise Analyses and Comments 13
Comments and Analyses Based on Indicators 17
Overall Performance of Water Utilities 20
Conclusions 23
PART IIUtilities’ Comparisons 25(Figures and Tables)
Institutions
Names and Locations of Utilities 26
Size of Utilities 27
Types of Water Utilities 28
Production and Consumption
Production Volume 28
Water Use 29
Per Capita Consumption 29
Monthly Consumption per Connection 30
Unaccounted-for Water 30
Nonrevenue Water 31
Consumer Metering 31
Customer ServiceWater Coverage 32
Water Availability 32
Monthly Bill per Connection 33
Water Quality Sampling 33
Complaints Received 34
Pipe Breaks Repaired 34
Management
Operating Ratio 35
Accounts Receivable 35
Revenue Collection Efficiency 36
Staff per 1,000 Connections 36
Tariffs and Costs
Average Tariff 37
Unit Production Cost 37
Connection Fee for Residential Connection 38
Annual Operation and Maintenance Costs 38
Operation and Maintenance Cost Components 39
PART IIIWater Utility and Area Profiles 41
Dhaka Water Supply and Sewerage Authority 42
Chittagong Water Supply and Sewerage Authority 44
Rajshahi City Corporation 46
Bagerhat Pourashava 48
Chandpur Pourashava 50
Chapai Nawabganj Pourashava 52
Chuadanga Pourashava 54
Gazipur Pourashava 56
Jessore Pourashava 58
Manikganj Pourashava 60
Narsingdi Pourashava 62
Contents

Bangladesh Water UtilitiesData Book, 2006–07:Benchmarking for ImprovingWater Supply Delivery
Tables1 Summary of Results for 11 Water Utilities 12
2 Comparison of Overall Performance 20
3 Names and Locations of Utilities 26
4 Size of Utilities 27
Figures1 Types of Water Utilities 28
2 Production Volume 28
3 Water Use 29
4 Per Capita Consumption 29
5 Monthly Consumption per Connection 30
6 Unaccounted-for Water 30
7 Nonrevenue Water 31
8 Consumer Metering 31
9 Water Coverage 32
10 Water Availability 32
11 Monthly Bill per Connection 33
12 Water Quality Sampling 33
13 Complaints Received 34
14 Pipe Breaks Repaired 34
15 Operating Ratio 35
16 Accounts Receivable 35
17 Revenue Collection Efficiency 36
18 Staff per 1,000 Connections 36
19 Average Tariff 37
20 Unit Production Cost 37
21 Connection Fee for Residential Connection 38
22 Annual Operation and Maintenance Costs 38
23 Operation and Maintenance Cost Components 39

BM&PIP Benchmarking and Performance Improvement Programming
BMDF Bangladesh Municipal Development Fund
CWASA Chittagong Water Supply and Sewerage Authority
DPHE Department of Public Health Engineering
DWASA Dhaka Water Supply and Sewerage Authority
IB-Net International Benchmarking Network
LGD Local Government Division
LGI Local Government Institution
MoLGRD&C Ministry of Local Government, Rural Development and Cooperatives
NRW Nonrevenue Water
O&M Operation and Maintenance
Pourashava Translates as ‘municipality’
PWP Public Water Point
RCC Rajshahi City Corporation
Tk. Bangladeshi Taka1
UFW Unaccounted-for Water
WASA Water Supply and Sewerage Authority
WSP-SA Water and Sanitation Program–South Asia
Measurement Units and Symbols
km kilometer
km2 square kilometer
lpcd or l/c/d liter per capita per day
m meter
m3 cubic meter
m3/d cubic meter per day
m3/d/c cubic meter per day per capita
4
1 Tk. is Bangladeshi Taka. US$1 = BDT 68.83 (as of May 28, 2009). Conversion rates are from http://coinmill.com; all conversions in the text are approximations.
Acronyms and Abbreviations

Bangladesh Water UtilitiesData Book, 2006–07:Benchmarking for ImprovingWater Supply Delivery
Bangladesh’s urban water utilities are facing a massive challenge in providing safe water supply and sanitation services to thesharply increasing population in the towns. To meet future demand for water supply and sanitation services with reliable and safewater supply system, the management capacity of the urban utilities should continue to improve.
One of the effective and recognized tools for performance monitoring and formulating performance improvement programs isbenchmarking. The Local Government Division, Ministry of Local Government, Rural Development and Cooperatives, took theinitiative of introducing Benchmarking and Performance Improvement Programming (BM&PIP) in 11 urban utilities in 2005-06,with support from Water and Sanitation Program, and International Benchmarking Network (IB-Net).
This Water Utilities Data Book is the first published compilation of the service delivery status for 2006-07 in the 11 participatingutilities. It describes performance levels against key indicators of service delivery, and the comparative positions and profiles ofeach utility based on analysis using the IB-Net tool. The utilities are now in a position to measure their own performancelevel, compare this with their peers and against an international standard, identify the gaps, and plan to improve theirperformance accordingly.
The benchmarking initiative demonstrates the commitment of the Government of Bangladesh to measure quality of service forensuring safe water provision to the consumer in the towns, in addition to monitoring the physical and financial progress of theutilities under different projects. This is also an important tool for local governments to support urban utilities to assess andenhance their service delivery and overall performance.
We trust that this initiative will continue to expand to other urban water utilities in Bangladesh in the near future. We look forwardto the ongoing commitment of the local government institutions (city corporations, pourashavas) and the Water and SanitationProgram to assist the government in institutionalizing the benchmarking initiative.
Md. Shahjahan Ali MollahJoint Secretary (Water Supply), Local Government Division,
Ministry of Local Government, Rural Development and Cooperatives, andManaging Director, Dhaka Water Supply and Sewerage Authority
Foreword
5


Bangladesh Water UtilitiesData Book, 2006–07:Benchmarking for ImprovingWater Supply Delivery
Context
With over 146 million people in an areaof 147,570 km2, Bangladesh is one ofthe most densely populated countriesin the world. The overall populationgrowth rate is about 1.5 percent.However, the influx of population inurban areas has taken the growth rateover 3.5 percent, on average, whereasthe growth rate of urban migration inmetropolitan cities is about 5 percent.Dhaka is the capital and the largestmetropolitan city of the country, withmore than 12 million people. The nextlargest city is the port city of Chittagong,with more than 3.5 million people.
Urban areas in Bangladesh can bedivided into three tiers: Dhaka andChittagong city that have populations ofmany millions; four city corporationswith populations of between 0.3 to 1.5million; and 309 urban municipalitieswith populations of 0.05 to 0.3 million.The total urban population, estimatedto be about 25 million, is expected tobe 50 million by the end of 2015.
Local government institutions (LGIs),that is, the city corporations andpourashavas, are legally responsible forwater supply and sanitation to thepeople, including poor people, withinthe municipality area except Dhaka,Chittagong, and Khulna cities.The Water Supply and SewerageAuthority (WASA) has been set up inthese city corporations.
While Dhaka Water Supply andSewerage Authority (DWASA) covers83 percent of the population,Chittagong Water Supply and
Sewerage Authority (CWASA) covers34 percent, and Rajshahi CityCorporation covers 84 percent. Only102 pourashavas have intermittentpiped water supply that serves verylimited households. The averagecoverage by piped water supply in thepourashavas is only 39 percent; theremaining 32 percent is served byhand tubewells. At present, urbanpopulations, especially poor people,are the most vulnerable if watersupply and sanitation services areinadequate. Large numbers of futureurban populations will thus requirea reliable and safe piped watersupply system.
The lack of effective managementcapacity has been identified by theGovernment of Bangladesh and otherstakeholders as a major reason whyurban utilities are not performing well.Benchmarking is recognized as aneffective tool to monitor performanceand formulate performanceimprovement programs.
The Water and Sanitation Program–South Asia (WSP–SA) has launched abenchmarking and performanceimprovement initiative in Bangladesh,India, and Pakistan for institutionalizingthe performance improvement of urbanwater supplies with limited resources.Selected urban water utilities inBangladesh were introduced to thebenchmarking and performanceimprovement program in 2005–06,under the ‘Bangladesh Benchmarkingand Performance Improvement forUrban Water Utilities’ project, facilitatedby WSP–SA. Multiyear benchmarkingdata may be used for getting the
performance of water utilities inperspective, as well as depict trends,slippages, and progress. InternationalBenchmarking Network (IB-Net) toolshighlight the relevance of benchmarkingto sound governance and performanceimprovement planning.
The Government of Bangladesh hasundertaken the initiative of introducingBenchmarking and PerformanceImprovement Programming (BM&PIP)tools, along with sector stakeholders.These include the Department of PublicHealth Engineering, DWASA, CWASA,selected city corporations andpourashavas, Bangladesh MunicipalDevelopment Fund, and the LocalGovernment Division (LGD) of theMinistry of Local Government, RuralDevelopment and Cooperatives. TheBangladesh Water Utilities Data Bookpresents the result of an update of thebenchmarking database, a compilationof information related to theperformance of 11 water utilities2 for2006–07. It builds on the experience ofparticipating utilities and the projectteam under the benchmarkingprogram. The data presented in theData Book were used in the NationalDissemination Workshop (held in Dhakaon May 21–22, 2008) to present thefindings and analyses of theperformance of the participating utilities.
Aim of the Data Book
The same set of data was used by theutilities in preparing the performance
Introduction: BenchmarkingUrban Water Services
7
2 The 11 water utilities are Bagerhat, Chandpur, ChapaiNawabganj, Chittagong, Chuadanga, Dhaka, Gazipur, Jessore,Manikganj, Narsingdi, and Rajshahi.

improvement plans that they presentedat the workshop. The Data Bookpresents information in a user-friendlymanner. Part I presents the summary offindings with comments and analysis byindicators and by water utility. Theperformances of Bangladesh’s utilitiesare compared with utilities’performance in India, the Philippines,and South-East Asia. The analyses ofthe utilities’ performance by indicatorsare based on the comparison tablesand charts in Part II. The analyses ofperformance by utility are based on theinformation provided in the utility andarea profiles for each city ormunicipality covered by the utilitythat are presented in Part III of theData Book.
Providing, as far as possible, accurateinformation on the performance ofwater utilities is just the first step inimproving such performance. Thisinformation helps in defining theproblems and challenges confrontingeach utility, which could be unique,based on its operating environment.We hope that this Data Book willcontribute in understanding thechallenges better, and in helpingstakeholders define the best ways ofmeeting them. This Data Book mayalso be used by all other water utilitiesin Bangladesh for addressingsimilar challenges and improvingrespective performances.
Key Indicators, Definitions,and Methodology
The Bangladesh Water Utilities DataBook presents the performance
indicators and analysis of theperformance of water utilities in 11cities and municipalities in Bangladesh.The information contained in this bookis based on the collection of 2006–07data from each participating waterutility. Data were collected using thequestionnaire developed by the IB-Netfor the World Bank. However, this is thefirst time that the IB-Net tools havebeen introduced in Bangladesh.
The water utilities that provided datainclude two WASAs, one citycorporation, and eight pourashavas.For the purpose of presentation anddiscussion, the name of the city ormunicipality served by the utility is usedinstead of the utility name: for example,Dhaka instead of Dhaka Water Supplyand Sewerage Authority; Gazipurinstead of Gazipur Pourashava;and Rajshahi instead of RajshahiCity Corporation. Performanceindicators were derived using basicdata provided by the water utilities andfollowing various computations usingthe formulas given below. Almost all thedata used in comparing the indicatorsin the tables, graphs, charts, andfigures are found in each utility and areaprofile. Exact values can, hence,be extracted.
Clarifications were sought on the dataprovided especially for consistencybetween the data and indicators sothat the data finally presented are thebest that could be obtained under thecircumstances. These clarificationswere done during the visit to each ofthe utilities by members of the project
team. Hence, LGD and WSP–SA areconscious that not all data are 100percent reliable. In some instances,estimates were given in the absence ofavailable measures, such as in caseswhere no total metering of productionand consumption is available. Thismakes unaccounted-for water or dailyper capita consumption data estimatesat best. If there are doubts on thereliability of some data presented, thereader is advised to verify theinformation from the water utility whosecontact details are provided in itsutility profile.
The information presented in this bookwas either taken from the water utilityquestionnaire or was based oncomputations using data from thequestionnaire. The definitions in termsof formulas used for the computationsare shown below.
! Water supply coverage (%) =[population served with watersupply] x 100 / [total population inthe area of responsibility]
! Per capita consumption (lpcd) =[total annual volume of water sold(m3) x 1,000/365] / [number ofpeople served]
! Production/population (m3/day/c) =[annual production volume (m3) /365] / [number of people served]
! Unaccounted-for water (%) = [totalannual production (m3) - total annualconsumption (m3)] x 100 / [totalannual production (m3)]
! Nonrevenue water (%) = [totalannual production (m3) - total billed
8
Bangladesh Water UtilitiesData Book, 2006–07:Benchmarking for ImprovingWater Supply Delivery
consumption (m3)] x 100 / [total
annual production (m3)]
! Average tariff (Tk./m3) = [total annual
billing (Tk.)] / [total annual
consumption (m3)]
! Unit production cost (Tk./m3) =
[annual O&M cost (Tk.)] / [total
annual production (m3)]
! Operating ratio = [annual O&M cost(Tk.)] / [annual revenue (Tk.)]
! Accounts receivable equivalent(months) = [accounts receivable(Tk.) at end of the fiscal year] / [totalannual billings (Tk.)/12]
! Revenue collection efficiency (%) =[total annual revenue (Tk.)] / [totalannual billings (Tk.)] x 100
! Staff/1,000 water connections ratio= [number of utility staff] / [numberof utility connections/1,000]
! Ratio of industrial to residential tariff= [total billing of commercial andindustrial users (Tk.) / total volumesold to commercial and industrialusers (m3)] / [total billing ofresidential users (Tk.) / total volumesold to residential users (m3)]
! Residential fixed component of tariff
= [fixed residential charge/month
(Tk.)*12*number of utility
connections] / [total annual
revenue (Tk.)]
Some utilities may have collectionefficiency higher than 100 percent,which may indicate that the total
collections for the one-year periodincluded payment of bills for theprevious period. Most of the utilitieshave no meter for measuring annualproduction at source and annualconsumption or billing at thedistribution ends. However, as a
9
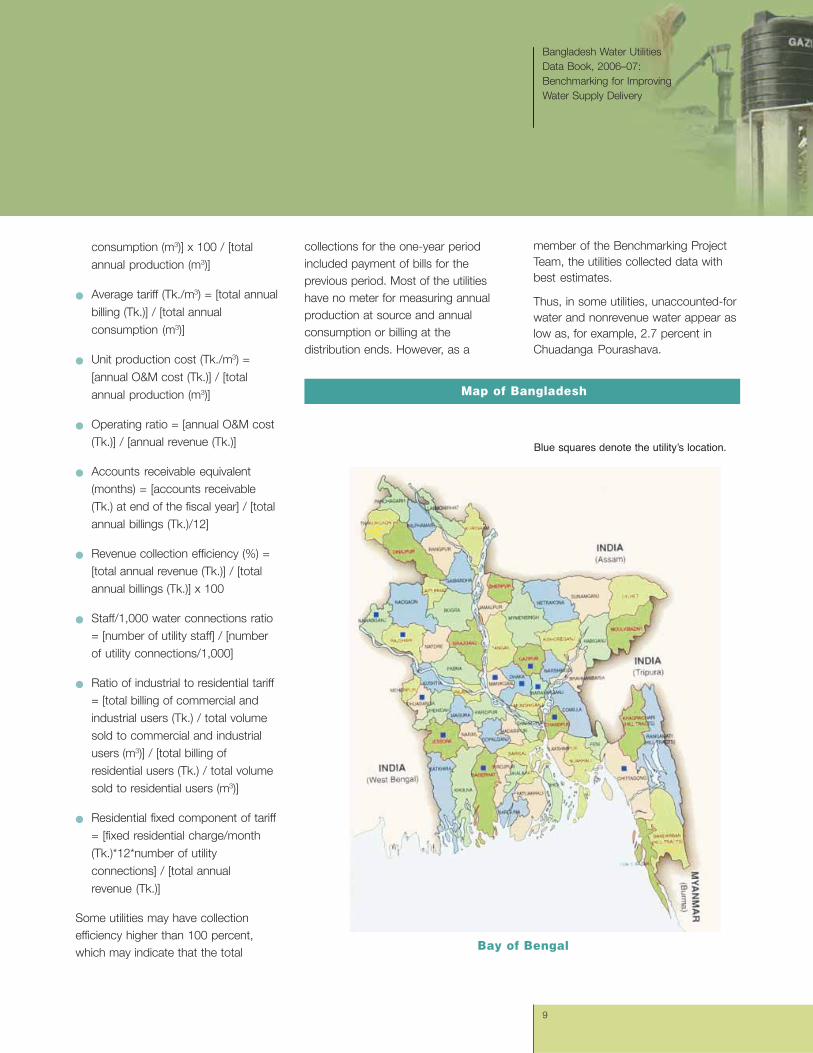
Map of Bangladesh
Bay of Bengal
Blue squares denote the utility’s location.
member of the Benchmarking ProjectTeam, the utilities collected data withbest estimates.
Thus, in some utilities, unaccounted-forwater and nonrevenue water appear aslow as, for example, 2.7 percent inChuadanga Pourashava.

PART 1
Summaryof Findings

Dhaka Chittagong Rajshahi Bagerhat Chandpur Chapai Chuadanga Gazipur Jessore Manikganj Narsingdi Average (11)Nawabganj
Water 83.3 34.2 84.5 42.2 72.0 36.1 68.3 14.8 68.0 36.2 70.3 55.4coverage(%)
Water availability 23 8 12 2 20 11 7 10 9 20 7 11.7(hours)
Consumption/ 90.4 69.7 88.2 61.5 55.3 33.5 86.7 33.9 72.3 263.5 113.2 88.0capita/day (lpcd)
Production/capita/ 0.159 0.130 0.132 0.084 0.067 0.054 0.093 0.075 0.107 0.326 0.168 0.127day (m3/day/c)
Unaccounted-for 37.2 33.3 25.5 3.3 16.3 15.9 2.7 52.0 28.2 7.2 25.4 22.5water (%)
NRW (%) 48.6 33.3 25.5 3.3 18.2 21.6 3.4 53 30.5 7.2 28.3 24.8
Connections 70 86 0 0 0 0 0 0 0 38 0 18metered (%)
Unit production 4.05 4.41 1.12 4.01 5.33 0.99 2.4 1.5 3.59 2.43 3.83 3.06cost (Tk./m3)
Operating ratio 0.78 0.96 0.71 0.85 1.53 0.42 0.53 0.63 1.00 0.94 1.43 0.89
Accounts receivable 13.1 12.5 6.9 4.0 15.8 2.8 3.1 11.9 8.6 8.4 55.6 13.0(months)
Revenue collection 108 108 60 85 100 100 75 99 100 59 190 98efficiency (%)
Average tariff 6.43 6.89 2.11 4.89 4.17 2.76 4.62 4.91 5.00 2.80 3.59 4.38(Tk./m3)
New connection 2,118 5,350 2,000 1,205 2,500 515 800 1,000 500 300 500 1,526fee (Tk.)
Staff/1,000 11.9 14.8 8.7 10.4 10.2 8.0 7.0 5.3 8.2 9.7 8.4 9.3connections (ratio)
Table 1: Summary of Results for 11 Water Utilities
12

Bangladesh Water UtilitiesData Book, 2006–07:Benchmarking for ImprovingWater Supply Delivery
Dhaka Water Supply andSewerage Authority (DWASA)
DWASA provides water at 90 lpcd toits consumers for an average of 22.5hours per day, to 83.3 percent of thepopulation in its service area.Sewerage service is available to only25 percent of the population.Unaccounted-for water (UFW) of 37.2percent is the second highest. Only70.4 percent of consumption ismetered, leaving the UFW valuedoubtful. Operating ratio is good at0.78 but accounts receivableequivalent of 13.1 months is the thirdhighest. Average tariff of Tk. 6.43/m3 isthe second highest and coversoperating expenses well. The staff per1,000 connections ratio, at 11.9, is thesecond highest. Customer service isgood but can still be improved byproviding more water to currentcustomers and extending service tothe unserved 16 percent of thepopulation. Water losses need tobe reduced. Bill collection needsto be improved and staffproductivity enhanced.
Chittagong Water Supply andSewerage Authority (CWASA)
CWASA provides water at 70 lpcd toits consumers for an average of eighthours per day, to only 34.2 percent ofthe population in its service area—thesecond lowest. UFW of 33.3 percent isthe third highest and needs to bereduced. It has the highestconsumption by metering at 86.1percent but not enough to give anaccurate determination of its waterlosses. Operating ratio is 0.96 butaccounts receivable equivalent of 12.5
months is too much. Average tariff ofTk. 6.89/m3 is the highest yet it is barelyenough to cover operating expensesdue to high water losses and lowcoverage. The staff per 1,000connections ratio at 14.8 is the highest,pointing to underutilization in the use ofhuman resources. CWASA rates low incustomer satisfaction, management ofwater and human resources, and inbilling and collection efficiency.
Rajshahi City Corporation
Rajshahi City Corporation provideswater at 88 lpcd to its consumers foran average of 12 hours per day, to 84.5percent of the population in its servicearea. UFW of 25.5 percent is higherthan average. None of its connectionsare metered, making the UFW anestimate at best. Production is probablyalso not metered. Operating ratio is0.71 and accounts receivableequivalent is 6.9 months, which is still along period to collect bill payments.Average tariff of Tk. 2.11/m3 is thelowest yet its operating ratio shows thatthis is enough to cover operatingexpenses well. The operating costsonly show labor or personnel cost andelectric expenses. It is possible thatother expenses are being covered bycity government subsidy. The staff per1,000 connections ratio at 8.7 is just alittle lower than the average. Overallperformance is just about averagebut improved bill collection and areview of its financial performancemay be needed.
Bagerhat Pourashava
Bagerhat Pourashava has to improvedelivery of services to its consumers. It
has the lowest water availability of onlytwo hours per day among the surveyedutilities. It provides water to only 42.2percent of the total population in itsservice area with 62 lpcd. Its UFW of3.3 percent is the second lowest butthis value may be doubtful consideringthe lack of metering of productionsources and service connections.Financial management looks good withoperating ratio of 0.85 and accountsreceivable equivalent of 4.0 months, thethird lowest. Average tariff of Tk. 4.89/m3 is a little higher than the average forthe utilities and it is adequate to raiserevenues to cover operating expenses.The staff per 1,000 connections ratio at10.4 is the third highest. With a lowUFW, the utility may be facing waterresource constraints to be able toimprove on coverage, water availability,and supply. Staff productivity is anotherarea for improvement. Water qualitymonitoring is sorely lacking as well.
Chandpur Pourashava
Chandpur Pourashava is doingreasonably well in water supplycoverage but is the third lowest for percapita consumption at 55 lpcd. Wateravailability is the second highest at 20hours per day, while coverage of 72percent is the third highest among theutilities surveyed. Water loss of 16.3percent is not high compared to thecommon benchmark of 20 percentbeing used as reasonable value.However, this value should be usedwith caution as production andconnections are not metered. Financialperformance is not good, withoperating ratio of 1.53 being thehighest and accounts receivable of15.8 months, second to the longest.
Utility-Wise Analysesand Comments
13

Average tariff of Tk. 4.17/m3 is justbelow average but is insufficient tocover operating expenses. The staffper 1,000 connections ratio at 10.2 isthe fourth highest. The utility will haveto focus on addressing low watersupply to consumers, improvingfinances by collecting bills on time andreducing expenses, and raisingrevenues. Staff productivity is anotherarea for improvement.
Chapai Nawabganj Pourashava
Chapai Nawabganj Pourashava hasonly 36 percent water supply coveragewith per capita consumption of 34lpcd, the lowest among the utilities.Water is available to consumers for only
11 hours per day and coverage is only
36.1 percent of the total population, the
third lowest among the utilities. Water
losses with UFW of 15.9 percent are
reasonable but the figure isquestionable in the absence ofmetering at both the production endand at service connections. The utilityhas the best financial performance withthe lowest operating ratio of 0.42 andaccounts receivable equivalent of 2.8months. It is also able to collect all itsbills with a revenue collection efficiencyof 100 percent. Average tariff ofTk. 2.76/m3 is the second lowest but itis enough to cover operating expensescomfortably. The staff per 1,000connections ratio at 8.0 is the thirdlowest and is reasonable. Thepourashava will need to focus onaddressing low coverage, lowconsumption, and water availability. It isdoing very well in financialmanagement, and fairly well in UFWand human resources management.
Chuadanga Pourashava
Chuadanga Pourashava provides waterat 87 lpcd to its consumers for anaverage of only seven hours per day, to68.3 percent of the population in itsservice area. It has the lowest UFW at2.7 percent, although this figure isbased on estimates of production andtotal consumption in the absence ofany metering. Financial management isgood with an operating ratio of 0.53,the second lowest, and accountsreceivable equivalent of 3.1 months,also the second lowest. However,reported revenue collection efficiency isonly 75 percent despite the goodfinancial performance. Average tariff ofTk. 4.62/m3 is just above averageamong the utilities but it coversoperating costs well. The staff per1,000 connections ratio at 7.0 comes
14
Bangladesh Water UtilitiesData Book, 2006–07:Benchmarking for ImprovingWater Supply Delivery
in second. Except for customersatisfaction, the utility is doing very well,particularly in managing its water lossesand finances. However, more accuratemeasurements of production andconsumption need to be done.
Gazipur Pourashava
Gazipur Pourashava provides water at34 lpcd to its consumers for anaverage of 10 hours per day, to only14.8 percent of the population in itsservice area. It has the highest UFW of52 percent among the utilitiessurveyed, although the absence ofmeters to measure production andconsumption casts doubt on thereliability of this value. However, thevery low coverage, which is also thelowest among the utilities, suggestswater supply problems made worse bylosses of more than half of production.Financial management is mixed withgood operating ratio of 0.63 but with anaccounts receivable equivalent of 11.9months. Average tariff is Tk. 4.91/m3,the fourth highest, which is enough forrevenues to cover operating expenses.The utility has the lowest staff per 1,000connections ratio of 5.3, suggestinggood utilization of human resources.Overall, the utility is not doing well andneeds to improve its performancestarting with reducing water losses andexpanding to unserved areas.Customers deserve more water andlonger distribution hours. While tariffsseem sufficient, bills have to becollected in a timely manner.
Jessore Pourashava
Jessore Pourashava provides water at72 lpcd to its consumers for anaverage of nine hours per day, to 68
percent of the population in its servicearea. UFW of 28.2 percent is higherthan the average for Bangladeshutilities. However, none of its serviceconnections and production sourcesare metered, making the UFW anestimate at best. Operating ratio is 1.0and accounts receivable equivalent is8.6 months. Average tariff of Tk. 5.00/m3 is the third highest.
Revenues are just enough to coveroperating expenses but collectionperiod should be reduced. The staff per1,000 connections ratio at 8.2 is thefifth lowest, lower than average amongthe utilities. Customer satisfactionneeds improvement by increasingwater availability, per capitaconsumption, and coverage. Tariffincrease should bring revenues to alevel to cover operation andmaintenance (O&M) expenses and fundexpansion and service improvements.
Manikganj Pourashava
Manikganj Pourashava provides waterat 264 lpcd to its consumers for anaverage of 20 hours per day, to only36.2 percent of the population in itsservice area. UFW is the third lowest at7.2 percent but this estimate is doubtfulsince only 37.5 percent of theconnections are metered andproduction sources are not fullymetered or not at all. Operating ratio is0.94 and accounts receivableequivalent is 8.4 months, which is toolong to collect bill payments. Averagetariff of Tk. 2.80/m3 is the third lowestand is hardly enough to cover operatingexpenses. The staff per 1,000connections ratio at 9.7 is higher thanaverage. Customer satisfaction is
satisfactory; customer-client relationsare facilitated through different meansof communication and lodgingcomplaints, and responses from theutility in time. Water losses are low inthe absence of metering of bothproduction and consumption but thisneeds further investigation. The highconsumption is due to the fact that alager portion of treated water is beingused for back washing for arsenic/ironremoval plant.
Narsingdi Pourashava
Narsingdi Pourashava provides water at113 lpcd to its consumers for anaverage of only seven hours per day, to70.3 percent of the population in itsservice area. UFW of 25.4 percent isjust above average. None of theconnections are metered and there areno bulk meters at the source to readthe volume of production, makingthe water loss value unreliableand doubtful.
Financial management is poor withoperating ratio at 1.43 being thesecond highest and accountsreceivable equivalent of 55.6 months,the highest among the utilities. Averagetariff of Tk. 3.59/m3 is the fourth lowest,even lower than the unit productioncost, hence the high operating ratiowith revenues insufficient to coveroperating expenses. The staff per1,000 connections ratio at 8.4 is lowerthan the average. While the utilityprovides sufficient water to itsconsumers, operating hours shouldbe increased. Steps must betaken to improve collection andincrease revenues.
15


Bangladesh Water UtilitiesData Book, 2006–07:Benchmarking for ImprovingWater Supply Delivery
Water supply coverage(Average: 55.4 percent)
None of the 11 utilities have 100percent coverage. Four have more than70 percent: Rajshahi (84.5 percent),Dhaka (83.3 percent), Chandpur (72percent), and Narsingdi (70.3 percent).About half of the utilities are serving lessthan 50 percent of the population intheir respective areas of responsibility.The lowest coverage is in Gazipur (14.8percent), followed by Chittagong (34.2percent), Chapai Nawabganj (36.1percent), Manikganj (36.2 percent), andBagerhat (42.2 percent). BesidesDhaka and Chittagong, nine towns alsoreceive water supply through tubewells,which has not been taken intoIB-Net data.
Water availability(Average: 11.7 hours a day)
No water utility has 24-hour watersupply. The highest supply duration is inDhaka (23 hours), followed byChandpur (20 hours), Manikganj (20hours), and Rajshahi (12 hours). Therest of the utilities have less than 12hours supply per day. Supply durationof less than 24 hours poses a risk tohealth and also affects ability to reduceUFW levels. The shortest supplyduration is in Bagerhat (two hours),followed by Narsingdi (seven hours),Chuadanga (seven hours), Chittagong(eight hours), and Jessore (nine hours).
Consumption (Average: 88.0 lpcd)
The cities or municipalities with highconsumption rates are Manikganj (264lpcd), Narsingdi (113 lpcd), Dhaka (90lpcd), Rajshahi (88 lpcd), and
Chuadanga (87 lpcd). Consumption of100–120 lpcd is reasonable as it is highenough to provide for health andhygiene requirements and low enoughto help conserve water resources.Consumption in Manikganj is excessivebut it can be lowered by conservationawareness, raising its low tariff, andrecalculating the amount for backwashtreatment plant. The low-consumptionareas are Chapai Nawabganj (34 lpcd),Gazipur (34 lpcd), Chandpur (55 lpcd),and Bagerhat (62 lpcd). All theseutilities have resource constraints, whileGazipur additionally also has thehighest UFW.
Production/person(Average: 0.127 m3/d/person)
This indicator measures overallefficiency of water resource use. Thelow figures of Chapai Nawabganj(0.054 m3/d/c), Chandpur (0.067m3/d/c), Gazipur (0.075 m3/d/c),Bagerhat (0.084 m3/d/c), andChuadanga (0.093 m3/d/c) reflectshortages of water resources. Thosewith high production are Manikganj(0.326 m3/d/c), Narsingdi (0.168 m3/d/c), Dhaka (0.159 m3/d/c), Rajshahi(0.132 m3/d/c), and Chittagong (0.130m3/d/c). High production for Manikganj,Narsingdi, and Rajshahi are needed tofulfill high demand encouraged by lowtariffs. Dhaka and Chittagong requirehigh production to compensate for highlevels of UFW.
Unaccounted-for water(Average: 22.5 percent)
The best performing utilities with lowUFW are Chuadanga (2.7 percent),Bagerhat (3.3 percent), Manikganj(7.2 percent), Chapai Nawabganj
(15.9 percent), and Chandpur (16.3percent)—all with lower than 20percent UFW. The worst performerswith high UFW are Gazipur (52percent), Dhaka (37.2 percent),Chittagong (33.3 percent), and Jessore(28.2 percent). Metering is a criticalcomponent for determining UFW. Noneof the utilities are fully metered. OnlyDhaka, Chittagong, and Manikganjhave some metering of serviceconnections. Most, if not all, do nothave metering of production as well.Hence, UFW figures should beinterpreted with caution without fullmetering. Given low coverage and lowwater availability in some utilities, moremust be done to reduce UFW levels.This includes 100 percent metering,repair of visible leaks, elimination ofillegal connections, and location andrepair of invisible leaks.
Connections metered(Average: 17.6 percent)
Metering is important to fully accountfor water production and consumptionin reducing UFW. Consumptionmetering is particularly important forconsumers to pay for what they areusing, which can help in promotingprudent use of water. The only utilitieswith some metering of serviceconnections are Chittagong (86.1percent), Dhaka (70.4 percent), andManikganj (37.5 percent). Rajshahi andthe remaining seven pourashavas haveno metering at all. Consumptionmetering must be complemented withfull production metering if losses are tobe accurately determined to initiate anywater loss reduction programs.
Comments and AnalysesBased on Indicators
17

Rajshahi (0.71). The worst performersare Chandpur (1.53), Narsingdi (1.43),and Jessore (1.00). Five utilities haveoperating ratios between 0.75 and1.00. Most of the utilities operate aswater departments of pourashavasand have some subsidy from the localgovernments. Some operating costshave missing components other thanpersonnel or labor costs and electricalpower costs. The missing costcomponents are usually funded fromoperating budgets of the pourashavas.
Accounts receivable(Average: 13.0 months)
This indicator is a good measure of theeffectiveness of a utility in collecting itsreceivables or bills. In this case, thereceivables are expressed as anequivalent of the utility’s averagemonthly billing. This indicator is alsoequated to the collection period. Forsmall utilities, accounts receivablerepresenting less than two months ofits average billing is manageable; forlarger utilities, this could be threemonths. But if it has risen to sixmonths or more, it has gone out ofhand. Only three utilities have accountsreceivable equivalent of less than sixmonths. These are the best performersfor this performance indicator:Chapai Nawabganj (2.8 months),Chuadanga (3.1 months), andBagerhat (4.0 months).
There are four utilities which haveoutstanding bills for more than a year,starting with Narsingdi (55.6 months),Chandpur (15.8 months), Dhaka (13.1months), and Chittagong (12.5months) for some of their clients.
18
Operating ratio (Average: 0.89)
A low operating ratio means revenuesfrom tariffs cover the O&M costscomfortably. If we include debt serviceand depreciation, it will show whetherthe utility also has the capacity to
expand coverage through tariffs withoutthe grants given by local government. Aratio above 1.0 means that the utilitiesdo not cover these costs. Four utilitieshave operating ratios less than 0.75,that is, Chapai Nawabganj (0.42),Chuadanga (0.53), Gazipur (0.63), and

Bangladesh Water UtilitiesData Book, 2006–07:Benchmarking for ImprovingWater Supply Delivery
Revenue collection efficiency(Average: 98.5 percent)
This indicator, average tariff, operatingratio, and accounts receivable haveimpacts on the financial health of autility. Half of the utilities have collectionefficiencies of at least 100 percent. Theworst performers are Manikganj (59percent), Rajshahi (60 percent),Chuadanga (75 percent), and Bagerhat(85 percent). These utilities shouldimprove their collection efforts andencourage consumers to pay their billson time. Three utilities have collectionefficiencies of more than 100 percent,thus suggesting past years’ arrears arealso being collected. These includeNarsingdi (190 percent), Chittagong(108 percent), and Dhaka (108percent); they also take the longesttime to collect bill payments. Those thatare 100 percent efficient in collecting
their bills are Chandpur, ChapaiNawabganj, and Jessore.
Average tariff (Average: Tk. 4.38/m3)
The average tariff is a good measure ofthe financial discipline of a utility and itsability to cover operational costs withrevenues from tariffs. The water utilitieswith high average tariffs are Chittagong(Tk. 6.89/m3), Dhaka (Tk. 6.43/m3),Jessore (Tk. 5.00/m3), Gazipur (Tk.4.91/m3), and Bagerhat (Tk. 4.89/m3).Those who charge the lowest tariffs areRajshahi (Tk. 2.11/m3), ChapaiNawabganj (Tk. 2.76/m3), Manikganj (Tk.2.80/m3), and Narsingdi (Tk. 3.59/m3).
Residential connection fee(Average: Tk. 1,526)
Apart from reasonable connection fee,allowing payments by installment can
assist lower-income households to gainaccess to direct connections for theirhomes with significant benefits to theirwelfare. None of the utilities surveyedallow payment of residential connectionfees by installment. It may be notedthat in some cases connection fees isseveral times more than the averagemonthly bill per connection. Fourutilities charged connection fees ofTk. 2,000 or more, those of Chittagong(Tk. 5,350), Chandpur (Tk. 2,500),Dhaka (Tk. 2,118), and Rajshahi(Tk. 2,000). The lowest connection feeis charged by Manikganj (Tk. 300)followed by Narsingdi (Tk. 500),Jessore (Tk. 500), Chapai Nawabganj(Tk. 515), and Chuadanga (Tk. 800).
Staff per 1,000 connections ratio(Average: 9.3)
This indicator is generally used tomeasure the efficient use of humanresources in a utility as manifested bylow staff per 1,000 connection ratio.Those with high staff per 1,000connections ratio are Chittagong (14.8),Dhaka (11.9), Bagerhat (10.4), andChandpur (10.2). The utilities with thelowest ratio and which are performingwell are Gazipur (5.3), Chuadanga (7.0),Chapai Nawabganj (8.0), andJessore (8.2).
Other than downsizing, improvementsin this indicator can be made bytraining staff in different aspects ofoperations, such as pumping,treatment plant operations, billing andcollection, leak control andmanagement, and so on. Investmentsin capacity building are important ifefficient and sustainable operationsare to be attained.
19

Table 2: Comparison of Overall Performance
Indicators Bangladesh (11) India (20) The Philippines (45) Southeast Asia (40)
Water coverage (%) 55.4 81.2 64.7 74.9
Water availability (hours) 11.7 4.3 21.0 22.9
Consumption/capita (lpcd) 88 123 119 107
Unaccounted-for water (%) 22.5 31.8 29.6 27.8
Connections metered (%) 17.6 24.5 95.7 99.4
Operating ratio 0.89 1.63 1.10 0.84
Accounts receivable (months) 13.0 4.9 1.8 0.9
Staff/1,000 connections (ratio) 9.3 7.4 7.1 7.2
The overall performance of a water utilitycan be rated in four areas ofmanagement: customer satisfaction;water resources; financial; and humanresources management. Table 2 showsthe comparative performance in termsof indicator averages of 11 water utilitiesfrom Bangladesh with those from India(20 utilities), the Philippines (45 utilities),and Southeast Asia (40 utilities). Data forthe Philippines’ utilities were for 2004,the Southeast Asian utilities for 2006–07, and the India utilities for 2006–07.
Customer satisfaction
Customer satisfaction can be measuredin terms of coverage, water availability,and average daily consumption. Efficientutilities strive for 100 percent coverage,24-hour availability, and dailyconsumption of about 100–120 lpcd.Bangladeshi utilities need some
Overall Performanceof Water Utilities
20
catching up with their neighboringcountries in Asia, especially in terms ofdaily consumption (88 lpcd) which isoutside the ideal range attained by theirSoutheast Asian (107 lpcd) and Filipino(119 lpcd) counterparts. Its immediateneighbor, India, provides a little bit morewith 123 lpcd. Water availability (11.7hours) is about half of its counterpartsin Southeast Asia (22.9 hours) and thePhilippines (21 hours) but much higherthan in India (4.3 hours). The WASAsand pourashavas will have to increasecoverage (55.4 percent) to catch upwith its neighbors, particularly India(81.2 percent) and Southeast Asia(74.9 percent).
Water resources management
The single most important parameter toindicate performance regarding waterresources management is UFW.
However, it is equally important thatUFW is obtained through the accuratemeasurement of production andconsumption with no less than 100percent metering of all sources ofproduction and all service connections.
While Bangladesh utilities appear betterat managing their losses with thelowest UFW (22.5 percent) comparedto its Southeast Asian (27.8 percent),Filipino (29.6 percent), and Indian (31.8percent) counterparts, it has the lowestrate of metering (17.6 percent), castingsome doubts on actual performance asfar as UFW is concerned. None of theaverages show 100 percentconsumption metering but there isgreater need to increase metering ofboth production and serviceconnections among Bangladeshiwater utilities.

Bangladesh Water UtilitiesData Book, 2006–07:Benchmarking for ImprovingWater Supply Delivery
21
Financial management
The most important measures of
financial management are operating
ratio and accounts receivable.
Bangladeshi utilities compare very well
on operating ratio (0.89) but fare badly
on accounts receivable (13.0 months).
Their average for operating ratio is
better than India (1.63) and the
Philippines (1.10) and is comparable to
their Southeast Asian counterparts
(0.84) who are a little bit better.
However, some of the reporting for
operating expenses by the
pourashavas shows some missing
components that could be covered
under local government subsidy.
Collections of bill payments are much
faster in Southeast Asia (0.9 months),
the Philippines (1.8 months), and India
(4.9 months).
Human resources management
The most common measure for humanresources management is staff per1,000 connections. Management andstaff are the most important resourcesof a water utility. Bangladesh utilitieshave more staff per 1,000 connections(9.3) compared to the Philippines (7.1),Southeast Asia (7.2), and India (7.4).Most water departments running theutilities in Bangladesh are part of thelocal governments or pourashavas.Most urban utilities in the Philippinesand Southeast Asia have higher levelsof autonomy, allowing them to resistpolitical intervention in recruiting andhiring staff. India’s water and sewerageutilities are part of urban local bodies.


Bangladesh Water UtilitiesData Book, 2006–07:Benchmarking for ImprovingWater Supply Delivery
The data presented in this bookattempt to provide a picture of theperformance of 11 water utilities inBangladesh. The performanceindicators were derived frominformation provided by theparticipating water utilities. It should benoted that the reliability of a number ofimportant indicators for some utilities—such as per capita consumption, UFW,and financial indicators related toconsumption and billing—remains aconcern in the absence of full meteringand should be used with caution. Anyperformance improvement programwill have to improve measurement andrecording of operational information asa first step in getting a completeassessment of any water utility’soverall performance.
Overall, Bangladesh’s water utilities willhave to increase water availability to 24hours, increase coverage and thesupply of water to their consumers.Realistic assessments of UFW shouldbe determined starting with fullmetering of production andconsumption. Financial managementwill have to be improved, particularlythe collection of bill payments in atimely manner, to no more than two orthree months. Ring-fencing of financesamong the water departments in thepourashavas should allow the utilitiesto determine how well their revenuescover their operating expenses.Efficiencies in the different areas ofoperations can be gained with skilledand qualified staff. The WASAs andpourashavas would do well in investingin training and building the capabilitiesof their staff and managers.
Given the above assessment, sectorstakeholders in Bangladesh need tofocus on:
! Advocacy for more investment in thesector and greater coverage.
! Ensuring 24-hour supply toall consumers.
! Ensuring 100 percent metering ofboth production and consumption.
! Managing water losses by keepingUFW in check, appropriate pricing,and public awareness.
! Phasing out public taps and othersources of free water.
! Applying appropriate tariffs to coverO&M costs and costs of expansionand replacements.
! Investing in capacity-building for staffand management.
! Monitoring performance regularlythrough appropriate managementinformation systems.
! Providing support to urban poor peoplethrough lifeline rates and payment ofconnection fees in installments.
Staff of the 11 participating utilities inthe benchmarking and performanceimprovement project have beenintroduced to analysis of performanceindicators and have gone through theexercise of developing performanceimprovement plans. It is up to theseutilities to implement the plans andinclude them in their annualbusiness plans.
Performance improvement for eachutility will have to be based on theindicators and their operatingenvironment as described in the utilityand area profiles in this Data Book.Utilities are encouraged to learn fromthose who are performing well, byidentifying them and communicatingwith them using the contact details inthis book. There are similar data booksin Southeast Asia and South Asia aswell as water utility networks in theseand other regions—globally these canbe sources of information of utilityperformance which can be usedas well.
Conclusions
23

PART 2

Bangladesh Water UtilitiesData Book, 2006–07:Benchmarking for ImprovingWater Supply Delivery
Utilities’ Comparisons

Table 3: Names and Locations of Utilities
Name of utility Town/city Region
Dhaka Water Supply and Dhaka and DhakaSewerage Authority (DWASA) Narayanganj
Chittagong Water Supply Chittagong Chittagongand Sewerage Authority (CWASA)
Rajshahi City Corporation Rajshahi Rajshahi
Bagerhat Pourashava Bagerhat Khulna
Chandpur Pourashava Chandpur Chittagong
Chapai Nawabganj Pourashava Chapai Nawabganj Rajshahi
Chuadanga Pourashava Chuadanga Khulna
Gazipur Pourashava Gazipur Dhaka
Jessore Pourashava Jessore Jessore
Manikganj Pourashava Manikganj Dhaka
Narsingdi Pourashava Narsingdi Dhaka
26

Bangladesh Water UtilitiesData Book, 2006–07:Benchmarking for ImprovingWater Supply Delivery
Utility Population People % of population Production Number Numberserved served (cu. m./day) of connections of staff
Dhaka 12,000,000 10,000,000 83.3 1,585,014 243,000 2,888
Chittagong 3,600,000 1,230,000 34.2 159,507 43,810 650
Rajshahi 773,430 653,630 84.5 86,082 22,650 196
Bagerhat 116,000 49,000 42.2 4,110 4,500 47
Chandpur 150,000 108,000 72.0 7,233 4,620 47
Chapai 249,000 90,000 36.1 4,822 3,750 30
Nawabganj
Chuadanga 63,000 43,000 68.3 4,000 4,010 28
Gazipur 502,000 74,270 14.8 5,534 2,060 31
Jessore 147,000 100,000 68.0 10,685 8,950 73
Manikganj 58,060 21,000 36.2 6,849 3,200 31
Narsingdi 32,060 22,500 70.3 3,781 2,250 19
Table 4: Size of Utilities
27
Data year: 2006–07.

28
Figure 1: Types of Water Utilities
Figure 2: Production Volume

Bangladesh Water UtilitiesData Book, 2006–07:Benchmarking for ImprovingWater Supply Delivery
29
Figure 3: Water Use
Figure 4: Per Capita Consumption

30
Figure 5: Monthly Consumption per Connection
Figure 6: Unaccounted-for Water

Bangladesh Water UtilitiesData Book, 2006–07:Benchmarking for ImprovingWater Supply Delivery
31
Figure 7: Nonrevenue Water
Figure 8: Consumer Metering

32
Figure 9: Water Coverage
Figure 10: Water Availability

Bangladesh Water UtilitiesData Book, 2006–07:Benchmarking for ImprovingWater Supply Delivery
33
Figure 12: Water Quality Sampling
Figure 11: Monthly Bill per Connection
* No sampling reported; Chapai Nawabganj and Manikganj with only one and two samples each.

34
Figure 13: Complaints Received
Figure 14: Pipe Breaks Repaired

Bangladesh Water UtilitiesData Book, 2006–07:Benchmarking for ImprovingWater Supply Delivery
35
Figure 16: Accounts Receivable
Figure 15: Operating Ratio

0 3 6 9 12 15
Staff per 1,000 connections
0 20 40 60 80 100 120
190
Percentage collection over billings
36
Figure 17: Revenue Collection Efficiency
Figure 18: Staff per 1,000 Connections

Bangladesh Water UtilitiesData Book, 2006–07:Benchmarking for ImprovingWater Supply Delivery
37
Figure 19: Average Tariff
Figure 20: Unit Production Cost

38
Figure 21: Connection Fee for Residential Connection
Figure 22: Annual Operation and Maintenance Costs

Bangladesh Water UtilitiesData Book, 2006–07:Benchmarking for ImprovingWater Supply Delivery
39
Figure 23: Operation and Maintenance Cost Components

PART 3

Bangladesh Water UtilitiesData Book, 2006–07:Benchmarking for ImprovingWater Supply Delivery
Water Utilityand Area Profiles
33

Water UtilityDHAKA WATER SUPPLY AND SEWERAGE AUTHORITYWASA Bhaban, 98 Kazi Nazrul Islam Avenue, Kawranbazar, Dhaka 1207, BangladeshTelephone: 02-8116792, 01714-166155, Fax: 02-8112109, E-mail: [email protected], Contact: Md Raihanul Abedin, Managing DirectorDhaka Water Supply and Sewerage Authority (DWASA) is a government-owned water authority operating under commercial law. It is responsible forproviding water supply and sewerage services to the city of Dhaka and nearby Narayanganj which has a combined population of 12,000,000 people inan urban service area. The city government provides oversight on the utility’s service provision and tariff setting. It depends on grants and governmenttransfer as well as borrowings from international financing agencies for funds for capital development. Planning is done on a year-to-year basis togetherwith budget setting.General Data about Water UtilityWater connections: 243,000Staff: 2,888Annual O&M costs: Tk. 2,345,773,000Annual billings: Tk. 3,017,005,554Annual collections: Tk. 3,253,986,554Debt service for 2006–07: Tk. 53,032,152,000Gross fixed asset value: Tk. 47,788,126,000Source of investment funds: Grants or government transfer; borrowings from international financing agenciesManagement and GovernanceThe private sector is involved in some of the utility’s operations through multiple service contracts. It has skills and training strategy, annual appraisaland target setting for staff and managers, but no staff reward and recognition program. DWASA also has the power to recruit and dismissstaff on its own.Tariff and FinanceFixed charge/month for residential customers: No dataRatio of industrial to residential tariff: 3.39Residential fixed component of tariff: No dataCost of new residential connection: Tk. 2,118Notes:1. Approval of tariff is under the city government in its oversight capacity.2. New connection fee is paid prior to connection.Consumer ServiceAverage monthly water consumption is about 124.5 m3 per connection. The water bill averages Tk. 800.37 per month per connection. Water is available22.5 hours a day to most users. None of the population served has intermittent water supply. Only 26 percent of 1,272 water samples taken passed theresidual chlorine test. There were about 15,000 consumer complaints recorded while 3,024 pipe breaks were repaired in 2006–07. Consumers cancomplain in person at the utility office or by letter, telephone and e-mail. The utility gets the views of customers when attending to complaints broughtout through these means, by surveys, and by the print and electronic media. The utility does not have any provision to allow payment of connectioncharges over a period of several months.Performance HighlightsDWASA provides water at 90 lpcd to its consumers for an average of 22.5 hours per day to 83.3 percent of the population in its service area. Sewerageservice is available to only 25 percent of the population. UFW of 37.2 percent is the second highest. Only 70.4 percent of consumption is metered,leaving the UFW value doubtful. Operating ratio is good at 0.78 but accounts receivable equivalent of 13.1 months is the third highest. Average tariff ofTk. 6.43/m3 is the second highest and covers operating expenses well. Staff per 1,000 connections ratio at 11.9 is the second highest. Customer serviceis good but can still be improved by providing more water to present customers and extending service to the unserved 16 percent of the population.Water losses need to be reduced. Bill collection needs to be improved and staff productivity enhanced.Performance Gaps to be AddressedFinancial management needs improvement starting with taking steps to collect arrears and having customers pay on time. Collection efficiency of108 percent means that collection of arrears has started in 2006–07. UFW needs to be reduced to allow for expansion to the unserved areas as well asincrease the amount made available to consumers. Reducing water losses will require full metering of all production sources and all connectionsincluding public water points to determine the real extent of losses. Staff per 1,000 water connections is high when compared to both the other utilities inBangladesh and in similar utilities in Asia. Water quality should be a concern considering that only 26 percent out of 1,272 water samples passed theresidual chlorine test. Measures must be taken not only to monitor water quality but also to see that the required water quality parameters are met.
DHAKA Utility Profile
42

Bangladesh Water UtilitiesData Book, 2006–07:Benchmarking for ImprovingWater Supply Delivery
Notes:1 The population is for the total area of responsibility.2 Only 26 percent of 1,272 water samples taken passed the residual chlorine test.3 None of the population served were reported to have intermittent supply.4 This is for residential consumption from direct supply, shared taps, and public water taps.5 DWASA is the only utility that reported providing sewerage services.6 About 70 percent of the total connections are metered. Water losses are based on estimated values.7 There were no public water points billing given.8 Operating ratio is for total O&M costs and total revenues for water supply and sewerage.9 Staff per 1,000 connections ratio is for water supply connections and staff.10 Billings are for water supply only.11 Others includes labor and other costs.Data as of 2006-07.
DHAKA WATER SUPPLY
Population: 12,000,0001
Production/Distribution
Average daily production 1,585,014 m3/dDistribution pipes 2,534.0 kmAnnual consumption Residential—direct 264,000,000 m3
Residential—PWP 66,000,000 m3
Commercial/industrial 24,000,000 m3
Institutional 9,000,000 m3
Bulk supply 80,000 m3
Water Service
Population served Direct/shared taps 8,000,000 Public water points 2,000,000Total 10,000,000
Pipe breaks 3,204Complaints 15,000
Service Indicators
Water coverage2 83%Water availability3 23 hours/dayPer capita consumption4 90 l/c/dAverage tariff 6.43 Tk./m3
Sewerage coverage5 25%
Efficiency Indicators
Unaccounted-for water6 37.2%Nonrevenue water7 48.6%Unit production cost 4.05 Tk./m3
Operating ratio8 0.78Accounts receivable 13.1 monthsStaff/1,000 connections9 11.9
Area Profile DHAKA
43
out
Annual Water Use578,530,000 m3
Annual Water Billings10
Tk. 2,333,868,098
Annual O&M Costs11
Tk. 2,345,773,000

Water UtilityCHITTAGONG WATER SUPPLY AND SEWERAGE AUTHORITYWASA Bhaban, Dampara, Chittagong, BangladeshTelephone: 031-2851698, Fax: 031-2610465, E-mail: [email protected], Contact: Md Shafiqul Islam, Chief EngineerChittagong Water Supply and Sewerage Authority (CWASA) is a water authority with the Chittagong local government that is responsible forproviding water supply services to the city of Chittagong with a total population of 3,600,000 people in an urban service area. The citygovernment provides oversight on the utility’s service provision and tariff setting. It depends on grants and government transfer as wellas borrowings from international financing agencies for funds for capital development. Planning is done on a year-to-year basis together withbudget setting.General Data about Water UtilityWater connections: 43,810Staff: 650Annual O&M costs: Tk. 256,865,657Annual billings: Tk. 267,436,981Annual collections: Tk. 289,537,319Debt service for 2006–07: Tk. 944,817,860Gross fixed asset value: Tk. 1,942,760,677Source of investment funds: Grants or government transfer; borrowings from international financing agenciesManagement and GovernanceThe private sector is not involved in any of the utility’s operations. It has no skills and training strategy, annual appraisal and target setting for staff andmanagers, and staff reward and recognition program. CWASA has no power to recruit and dismiss staff on its own.Tariff and FinanceFixed charge/month for residential customers: Tk. 130.00Ratio of industrial to residential tariff: 2.76Residential fixed component of tariff: 23.6 percentCost of new residential connection: Tk. 5,350Notes:1. Approval of tariff is under the city government in its oversight capacity.2. New connection fee is paid prior to connection.Consumer ServiceAverage monthly water consumption is about 73.9 m3 per connection. The water bill averages Tk. 508.71 per month per connection. Water is availableeight hours a day to most users. All of the population served has intermittent water supply. All 7,280 water samples taken passed the residual chlorinetest. There were 4,247 consumer complaints recorded while 2,096 pipe breaks were repaired in 2006–07. Consumers can complain in person at theutility office or by letter or telephone. The utility gets the views of customers when attending to complaints brought out through these means. The utilitydoes not have any provision to allow payment of connection charges over a period of several months.Performance HighlightsCWASA provides water at 70 lpcd to its consumers for an average of eight hours per day to only 34.2 percent of the population in its service area, thesecond lowest. UFW of 33.3 percent is the third highest and needs to be reduced. It has the highest consumption metering at 86.1 percent but notenough to give an accurate determination of its water losses. Operating ratio is 0.96 but accounts receivable equivalent of 12.5 months is too much.Average tariff of Tk. 6.89/m3 is the highest yet it is barely enough to cover operating expenses due to high water losses. Staff per 1,000 connectionsratio at 14.8 is the highest, pointing to inefficiencies in the use of human resources. CWASA rates low in customer satisfaction, management of waterand human resources, and in billing and collection.Performance Gaps to be AddressedReducing water losses can help in partly addressing the problems of low water availability, coverage, and the amount being provided to CWASAconsumers. While it has the highest metering rate, determination of actual losses will require full metering of both production and consumption. Theutility will have to invest in developing additional water sources to fully address the above problems and satisfy its customers. The high average tariffrate is almost not enough to cover operating expenses as part of operating expenses goes to production that is lost either through leaks or illegalconnections. Tariff will still increase with additional investments for capital development although there is still much room for increasing the revenuebase with the unserved two-thirds of the population. Instead of reducing its staff, CWASA can train its excess personnel in other areas of operations,especially where expansion of both production and distribution are contemplated.
CHITTAGONG Utility Profile
44

Bangladesh Water UtilitiesData Book, 2006–07:Benchmarking for ImprovingWater Supply Delivery
Notes:1 The population is for the total area of responsibility.2 All 7,280 samples taken passed the residual chlorine test.3 All the population served has intermittent supply.4 This is for residential consumption from direct supply, shared taps, and public water taps.5 No sewerage data were given. Only water supply services were reported as being provided.6 About 86 percent of the total connections are metered. Water losses are based on estimated values.7 There were no public water points consumption given but 112,000 people draw water from such water points.Data as of 2006-07.
Production/Distribution
Average daily production 159,507 m3/dDistribution pipes 610.7 kmAnnual consumption Residential—direct 31,310,000 m3
Residential—PWP Nil Commercial/industrial 6,920,000 m3
Institutional 610,000 m3
Bulk supply Nil
Water Service
Population served Direct/shared taps 1,118,000 Public water points 112,000Total 1,230,000
Pipe breaks 2,096Complaints 4,247
Service Indicators
Water coverage2 34%Water availability3` 8 hours/dayPer capita consumption4 70 l/c/dAverage tariff 6.89 Tk./m3
Sewerage coverage5 Nil
Efficiency Indicators
Unaccounted-for water6 33.3%Nonrevenue water7 33.3%Unit production cost 4.41 Tk./m3
Operating ratio 0.96Accounts receivable 12.5 monthsStaff/1,000 connections 14.8
CHITTAGONG WATER SUPPLY
Population: 3,600,0001
Area Profile CHITTAGONG
Annual Water Use58,220,000 m3
Annual Water BillingsTk. 267,436,981
Annual O&M CostsTk. 256,865,657
45

Water UtilityRAJSHAHI CITY CORPORATIONNagar Bhaban, Rajshahi City, Rajshahi, BangladeshTelephone: 0721-775435, 01711-587834, Fax: 0721-772669, E-mail: [email protected], Contact: Datta Gupta Sarit, Chief EngineerRajshahi City Corporation (RCC) is a statutory body with a water department that is responsible for providing water supply services to the cityof Rajshahi with a total population of 773,430 people in an urban service area. The city government provides oversight on the utility’s serviceprovision and tariff setting. The utility depends on grants and government transfer for funds for capital development. Planning is done on a multiyearbasis, identifying targets and resources to effect change and improvements.General Data about Water UtilityWater connections: 22,650Staff: 196Annual O&M costs: Tk. 35,315,000Annual billings: Tk. 49,392,916Annual collections: Tk. 29,467,814Debt service for 2006–07: NilGross fixed asset value: Tk. 651,531,000Source of investment funds: Grants or government transferManagement and GovernanceThe private sector is involved in some of the utility’s operations through multiple service contracts. The utility has skills and training strategy, annualappraisal and target setting for both staff and managers, and staff reward and recognition program under human resources development. It also hasthe ability to recruit and dismiss staff within an agreed plan.Tariff and FinanceFixed charge/month for residential customers: Tk. 60.00Ratio of industrial to residential tariff: 6.65Residential fixed component of tariff: 33.0 percentCost of new residential connection: Tk. 2,000Notes:1. Approval of tariff is under the city government in its oversight capacity.2. New connection fee is paid prior to connection.Consumer ServiceAverage monthly water consumption is about 86.1 m3 per connection. The water bill averages Tk. 181.73 per month per connection. Water isavailable 12 hours a day to most users. All of the population served has intermittent water supply. About 73 percent of 6,850 water samples takenpassed the residual chlorine test. There were 2,785 consumer complaints recorded while 1,436 pipe breaks were repaired in 2006–07. Consumerscan complain in person at the utility office or by letter or telephone. The utility gets the views of customers when attending to complaints brought outthrough these means. The utility does not have any provision to allow payment of connection charges over a period of several months.Performance HighlightsRajshahi City Corporation provides water at 88 lpcd to its consumers for an average of 12 hours per day to 84.5 percent of the population in itsservice area. UFW of 25.5 percent is higher than average. None of its connections are metered, making the UFW an estimate at best. Production isprobably also not metered. Operating ratio is 0.71 and accounts receivable equivalent is 6.9 months, which is still a long period to collect billpayments. Average tariff of Tk. 2.11/m3 is the lowest yet its operating ratio shows that this is enough to cover operating expenses well. The operatingcosts only show labor or personnel cost and electric expenses. It is possible that other expenses are being covered by city government subsidy.Staff per 1,000 connections ratio at 8.7 is just a little lower than the average. Overall performance is just about average but improved bill collectionand a review of its financial performance may be needed.Performance Gaps to be AddressedImproving customer satisfaction will require increasing the amount of water available to at least 100 lpcd and availability to 24 hours per day as allof its customers suffer from intermittent supply and get water for only 12 hours a day. Metering of all production sources and service connections isa given requirement to reduce water losses by determining the real extent of leaks and illegal connections. Increasing production may be requiredto achieve longer availability and increasing the per capita consumption. The UFW is not that high to allow getting all the additional waterrequirements from reduction of losses alone. There is room for increasing tariffs when the average tariff for all the utilities is more than twice thepresent tariff and the highest is about thrice that of RCC. A review of the current tariff rates may be needed in view of the anomaly of having verylow average tariff and low operating ratio. Collection period for bill payments needs to be reduced.
RAJSHAHI Utility Profile
46

Bangladesh Water UtilitiesData Book, 2006–07:Benchmarking for ImprovingWater Supply Delivery
Notes:1 The population is for the total area of responsibility.2 About 73 percent of 6,850 samples taken passed the residual chlorine test.3 All the population served has intermittent supply.4 This is for residential consumption from direct supply, shared taps, and public water taps.5 None of the connections are metered. This is based on estimated values.6 There were no public water points consumption given but 133,230 people draw water from such water points.7 These were the only cost components given for the total O&M cost.Data as of 2006-07.
Production/Distribution
Average daily production 86,082 m3/dDistribution pipes 430.0 kmAnnual consumption Residential—direct 21,050,000 m3
Residential—PWP Nil Commercial/industrial 1,340,000 m3
Institutional 1,020,000 m3
Bulk supply Nil m3
Water Service
Population served Direct/shared taps 520,400 Public water points 133,230Total 653,630
Pipe breaks 1,436Complaints 2,785
Service Indicators
Water coverage2 85%Water availability3 12 hours/dayPer capita consumption4 88 l/c/dAverage tariff 2.11 Tk./m3
Sewerage coverage Nil
Efficiency Indicators
Unaccounted-for water5 25.5%Nonrevenue water6 25.5%Unit production cost7 1.12 Tk./m3
Operating ratio 0.71Accounts receivable 6.9 monthsStaff/1,000 connections 8.7
Area Profile RAJSHAHIRAJSHAHI WATER SUPPLY
Population: 773,4301
47
Annual Water Use31,420,000 m3
Annual Water BillingsTk. 49,392,916
Annual O&M Costs7
Tk. 35,315,000

Water UtilityBAGERHAT POURASHAVABagerhat, Khulna, BangladeshTelephone: 0468-63108, 0468-62710, Fax: none, E-mail: none, Contact: Khan Habibur Rahman, ChairmanBagerhat Pourashava has a water department that is responsible for providing water supply services to the municipality of Bagerhat with a totalpopulation of 116,000 people in a predominantly urban service area. The utility is part of the local government which provides oversight on theutility’s service provision and tariff setting. It depends on grants and government transfer for funds for capital development. Planning is done on amultiyear basis, identifying targets and resources for change and improvement.General Data about Water UtilityWater connections: 4,500Staff: 47Annual O&M costs: Tk. 6,015,275Annual billings: Tk. 7,091,760Annual collections: Tk. 6,015,231Debt service for 2006–07: NilGross fixed asset value: Tk. 6,485,650Source of investment funds: Grants or government transferManagement and GovernanceThere is no reported private sector involvement in any of its operations, although the utility indicated contracted out costs in its operating expenses.No skills and training strategy, annual staff appraisal and target setting, nor staff reward and recognition program are available. Being a departmentof the local government, the utility does not have the ability to recruit and dismiss staff on its own.Tariff and FinanceFixed charge/month for residential customers: Tk. 110.00Ratio of industrial to residential tariff: 0.33Residential fixed component of tariff: 83.8 percentCost of new residential connection: Tk. 1,205Notes:1. Approval of tariff is under local government control.2. New connection fee is paid prior to connection.Consumer ServiceAverage monthly water consumption is about 26.9 m3 per connection. The water bill averages Tk. 131.33 per month per connection. Water isavailable two hours a day to most users. About 86 percent of the population served has intermittent water supply. Water quality may not beadequate as no residual chlorine test was reported for the year. There were 115 consumer complaints on water service recorded while about 20pipe breaks were repaired in 2006–07. Consumers can complain in person at the utility office or by letter or telephone. The utility does not have anyprovision to allow payment of connection charges over a period of several months.Performance HighlightsBagerhat Pourashava has to improve delivery of services to its consumers. It has the lowest water availability of only two hours per day among thesurveyed utilities. It is providing water to only 42.2 percent of the total population in its service area with 62 lpcd. Its UFW of 3.3 percent is thesecond lowest but this value may be doubtful considering the lack of metering of production sources and service connections. Financialmanagement looks good with operating ratio of 0.85 and accounts receivable equivalent of 4.0 months is the third lowest. Average tariff ofTk. 4.89/m3 is a little higher than the average for the utilities and it is adequate to raise revenues to cover operating expenses. Staff per 1,000connections ratio at 10.4 is the third highest. With a low UFW, the utility may be facing water resource constraints to be able to improve oncoverage, water availability, and supply. Staff productivity is another area for improvement. Water quality monitoring is sorely lacking as well.Performance Gaps to be AddressedThe very scant two hours per day water availability is the major issue that needs to be addressed. It could very well be that water sources are veryinsufficient, preventing the utility to expand services to unserved areas over 24 hours per day and to at least bring the level of water supply percapita to about 100 lpcd. It is surprising that while the pourashava is doing reasonably well in managing its finances, the same could not be saidwith delivering water supply services. While the collection period is already low, this can still be improved to two months or less. An operating ratioof 0.75 is a comfortable level that allows recovery of operating expenses but also the cost of capital development for expansion and new sources.Expenses for new construction for additional sources and distribution network expansion will require tariff adjustment as well. Training and capacitybuilding will be required and better management and utilization of human resources are better alternatives to addressing staff productivity issuesthan laying off excess staff.
BAGERHAT Utility Profile
48

Bangladesh Water UtilitiesData Book, 2006–07:Benchmarking for ImprovingWater Supply Delivery
Notes:1 The population is for the total area of responsibility.2 No data on residual chlorine test was given.3 About 86 percent of the population served has intermittent supply.4 This is for residential consumption from direct supply, shared taps, and public water taps.5 None of the connections are metered. This is based on estimated values.6 Free water from public water taps may not have been recorded.7 Unit production cost is based on O&M cost without depreciation.8 Other costs include repair and maintenance cost for treatment plant.Data as of 2006-07.
Production/Distribution
Average daily production 4,110 m3/dDistribution pipes 65.1 kmAnnual consumption Residential—direct 1,100,000 m3
Residential—PWP Nil Commercial/industrial 150,000 m3
Institutional 200,000 m3
Bulk supply Nil
Water Service
Population served Direct/shared taps 45,000 Public water points 4,000Total 49,000
Pipe breaks 20Complaints 115
Service Indicators
Water coverage2 42%Water availability3 2 hours/dayPer capita consumption4 62 l/c/dAverage tariff 4.89 Tk./m3
Sewerage coverage Nil
Efficiency Indicators
Unaccounted-for water5 3.3%Nonrevenue water6 3.3%Unit production cost7 4.01 Tk./m3
Operating ratio 0.85Accounts receivable 4.0 monthsStaff/1,000 connections 10.4
Area Profile BAGERHATBAGERHAT WATER SUPPLY
Population: 116,0001
49
Annual Water Use1,500,000 m3
Annual Water BillingsTk. 7,091,760
Annual O&M Costs8
Tk. 6,015,275

Water UtilityCHANDPUR POURASHAVAChandpur, Chittagong, BangladeshTelephone: 0841-63404, 01711-669309, Fax: none, E-mail: none, Contact: Md Nasir Uddin, ChairmanChandpur Pourashava has a water department that is responsible for providing water supply services to the municipality of Chandpur with a totalpopulation of 150,000 people in a predominantly urban service area. The utility is part of the local government which provides oversight on theutility’s service provision and tariff setting. While it is part of the local government, the utility’s finances are ring-fenced. It depends on grants andgovernment transfer for funds for capital development. Planning is done on a year-to-year basis together with budget setting.General Data about Water UtilityWater connections: 4,620Staff: 47Annual O&M costs: Tk. 14,077,765Annual billings: Tk. 9,210,100Annual collections: Tk. 9,210,000Debt service: NilGross fixed asset value: Tk. 152,500,000Source of investment funds: Grants or government transferManagement and GovernanceThere is no reported private sector involvement in any of the utility’s operations. No skills and training strategy or staff reward and recognitionprogram are available. However, the water department has an annual appraisal and target setting system for staff in place. It also has the ability torecruit and dismiss staff within an agreed plan.Tariff and FinanceFixed charge/month for residential customers: Tk. 150.00Ratio of industrial to residential tariff: No dataResidential fixed component of tariff: 90.4 percentCost of new residential connection: Tk. 2,500Notes:1. Approval of tariff is under local government control under its oversight function.2. New connection fee is paid prior to connection.Consumer ServiceAverage monthly water consumption is about 39.9 m3 per connection. The water bill averages Tk. 166.13 per month per connection. Water isavailable 20 hours a day to most users. All of the population served have intermittent water supply. Water quality is being monitored with all 35 watersamples taken passing the residual chlorine test. There were 275 consumer complaints on water service recorded while about 450 pipe breakswere repaired in 2006–07. Consumers can complain in person at the utility office or by letter or telephone, which are also used to get the views ofcustomers. The utility does not have any provision to allow payment of connection charges over a period of several months.Performance HighlightsChandpur Pourashava is doing reasonably well in customer satisfaction except for per capita consumption which is the third lowest at 55 lpcd.Water availability is the second highest at 20 hours per day while coverage of 72 percent is the third highest among the utilities surveyed. Waterloss of 16.3 percent is not high compared to the common benchmark of 20 percent being used as reasonable value. However, this value should beused with caution as production and connections are not metered. Financial performance is not good with operating ratio of 1.53 being the highestand accounts receivable of 15.8 months, second to the longest. Average tariff of Tk. 4.17/m3 is just below average but is very insufficient to coveroperating expenses. Staff per 1,000 connections ratio at 10.2 is the fourth highest. The utility will have to focus on addressing low water supply toconsumers, improving finances by collecting bills on time and reducing expenses and raising revenues. Staff productivity is another areafor improvement.Performance Gaps to be AddressedMajor performance gaps to be addressed are in financial management and supply to consumers. With current tariff levels, operating revenues willnot be enough to cover expenses. Operating ratio should be reduced to about 0.75 or better by either reducing expenses or increasing revenues orboth. Additional water supply will have to come from development of new sources of water considering that UFW is not high if per capitaconsumption has to be raised to at least 100 lpcd. This will require new investments in capital development which will further strain the utility’sfinancial capability. Improving collection of bill payments to get users to pay within two months from the time they get their bills will be necessary.Excess staff can be dealt with through staff reduction or increasing staff productivity. Training and capacity building are better alternatives.
CHANDPUR Utility Profile
50

Bangladesh Water UtilitiesData Book, 2006–07:Benchmarking for ImprovingWater Supply Delivery
Notes:1 The population is for the total area of responsibility.2 All 35 samples taken passed the residual chlorine test.3 All of the population served has intermittent supply.4 This is for residential consumption from direct supply, shared taps, and public water taps.5 None of the connections are metered. This is based on estimated values.6 There were no water billings for public water points and institutional consumption.7 No breakdown was given except for electrical costs.Data as of 2006-07.
Production/Distribution
Average daily production 7,233m3/dDistribution pipes 64.0 kmAnnual consumption Residential—direct 2,160,000 m3
Residential—PWP 20,000 m3
Commercial/industrial Nil Institutional 30,000 m3
Bulk supply Nil
Water Service
Population served Direct/shared taps 88,000 Public water points 20,000Total 108,000
Pipe breaks 450Complaints 275
Service Indicators
Water coverage2 72%Water availability3 20 hours/dayPer capita consumption4 55 l/c/dAverage tariff 4.17 Tk./m3
Sewerage coverage Nil
Efficiency Indicators
Unaccounted-for water5 16.3%Nonrevenue water6 18.2%Unit production cost 5.33 Tk./m3
Operating ratio 1.53Accounts receivable 15.8 monthsStaff/1,000 connections 10.2
Area Profile CHANDPURCHANDPUR WATER SUPPLY
Population: 150,0001
51
Annual Water Use2,640,000 m3
Annual Water BillingsTk. 9,210,100
Annual O&M Costs7
Tk. 14,077,765

Water UtilityCHAPAI NAWABGANJ POURASHAVAChapai Nawabganj, Rajshahi, BangladeshTelephone: 0781-55226, 01552-359302, Fax: 0781-55227, E-mail: none, Contact: Professor Ataur Rahman, ChairmanChapai Nawabganj Pourashava has a water department that is responsible for providing water supply services to the municipality of ChapaiNawabganj with a total population of 249,000 people in a predominantly urban service area. An independent board of stakeholders providesoversight on the utility’s service provision and tariff setting. While it is part of the local government, the utility’s finances are ring-fenced. It dependson grants and government transfer for funds for capital development. Planning is done on a multiyear basis, identifying targets and resources forchange and improvement.General Data about Water UtilityWater connections: 3,750Staff: 30Annual O&M costs: Tk. 1,734,636Annual billings: Tk. 4,086,240Annual collections: Tk. 4,086,240Debt service: NilGross fixed asset value: Tk. 109,610,540Source of investment funds: Grants or government transferManagement and GovernanceThere is no reported private sector involvement in any of the utility’s operations, although it indicated contracted out costs in its operating expenses.It has skills and training strategy, annual staff appraisal and target setting, and staff reward and recognition program under its human resourcesdevelopment program. It also has the ability to recruit and dismiss staff within an agreed plan.Tariff and FinanceFixed charge/month for residential customers: Tk. 80.00Ratio of industrial to residential tariff: 0.64Residential fixed component of tariff: 88.1 percentCost of new residential connection: Tk. 515Notes:1. Approval of tariff is under an independent board of stakeholders.2. New connection fee is paid prior to connection.Consumer ServiceAverage monthly water consumption is about 32.9 m3 per connection. The water bill averages Tk. 90.81 per month per connection. Water isavailable 11 hours a day to most users. All of the population served have intermittent water supply. Water quality is hardly being monitored with onlyone water sample tested for residual chlorine during the year. There were 1,235 consumer complaints on water service recorded while only fivepipe breaks were repaired in 2006–07. Consumers can complain in person at the utility office or by letter or telephone, which are also used to getthe views of customers. The utility does not have any provision to allow payment of connection charges over a period of several months.Performance HighlightsChapai Nawabganj Pourashava is not doing well in customer satisfaction with low per capita consumption of 34 lpcd, the lowest among the utilities.Water is available to consumers for only 11 hours per day and coverage is only 36.1 percent of the total population, the third lowest among theutilities. Water losses, with UFW of 15.9 percent, are reasonable but the figure is questionable in the absence of metering at both the productionend and at service connections. The utility has the best financial performance with the lowest operating ratio of 0.42 and accounts receivableequivalent of 2.8 months. It is also able to collect all its bills with a revenue collection efficiency of 100 percent. Average tariff of Tk. 2.76/m3 is thesecond lowest but it is enough to cover operating expenses comfortably. Staff per 1,000 connections ratio at 8.0 is the third lowest and isreasonable. The pourashava will need to focus on addressing low coverage, low consumption, and water availability. It is doing very well in financialmanagement and fairly well in UFW and human resources management.Performance Gaps to be AddressedThe utility may have to improve on its low coverage, water availability, and supply with investments in new sources and distribution systems tounserved areas. Water losses are already low so that new supplies will come from additional water sources. It has to increase water supply toconsumers to at least 100 lpcd, water availability to 24 hours a day, and expand services to about two-thirds of the total population in its area ofresponsibility. With the utility’s good financial management, additional costs may be absorbed with increase in tariffs, which is the second-lowest.Despite the reasonable level of its water losses, the utility will also have to invest in metering of production and all service connections to furtherimprove on water resources management. It has to improve its water quality monitoring, which is currently inadequate.
CHAPAI NAWABGANJ Utility Profile
52

Bangladesh Water UtilitiesData Book, 2006–07:Benchmarking for ImprovingWater Supply Delivery
Notes:1 The population is for the total area of responsibility.2 The only sample taken passed the residual chlorine test.3 All the population served has intermittent supply.4 This is for residential consumption from direct supply, shared taps, and public water taps.5 None of the connections are metered. This is based on estimated values.6 There were no billings for public water points consumption.Data as of 2006-07.
Production/Distribution
Average daily production 4,822 m3/dDistribution pipes 64.7 kmAnnual consumption Residential—direct 1,000,000 m3
Residential—PWP 100,000 m3
Commercial/industrial 280,000 m3
Institutional 100,000 m3
Bulk supply Nil
Water Service
Population served Direct/shared taps 75,000 Public water points 15,000Total 90,000
Pipe breaks 5Complaints 1,235
Service Indicators
Water coverage2 36%Water availability3 11 hours/dayPer capita consumption4 34 l/c/dAverage tariff 2.76 Tk./m3
Sewerage coverage Nil
Efficiency Indicators
Unaccounted-for water5 15.9%Nonrevenue water6 21.6%Unit production cost 0.99 Tk./m3
Operating ratio 0.42Accounts receivable 2.8 monthsStaff/1,000 connections 8.0
CHAPAI NAWABGANJ WATER SUPPLY
Population: 249,0001
53
Area Profile CHAPAI NAWABGANJ
Annual Water Use1,760,000 m3
Annual Water BillingsTk. 4,086,240
Annual O&M CostsTk. 1,734,636

Water UtilityCHUADANGA POURASHAVAChuadanga, Khulna, BangladeshTelephone: 0761-62281, 01711-965800, Fax: 0761-62281, E-mail: none, Contact: Md Ashraf Ali, ChairmanChuadanga Pourashava has a water department that is responsible for providing water supply services to the municipality of Chuadanga with atotal population of 63,000 people in a predominantly urban service area. The utility is part of the local government which provides oversight on theutility’s service provision and tariff setting. It depends on grants and government transfer for funds for capital development. Planning is done on ayear-to-year basis together with budget setting.General Data about Water UtilityWater connections: 4,010Staff: 28Annual O&M costs: Tk. 3,498,050Annual billings: Tk. 6,566,791Annual collections: Tk. 4,917,213Debt service: NilGross fixed asset value: Tk. 340,000,000Source of investment funds: Grants or government transferManagement and GovernanceThere is no reported private sector involvement in any of the utility’s operations. No skills and training strategy, annual staff appraisal and targetsetting, and staff reward and recognition program are available. However, the utility has the ability to recruit and dismiss staff within an agreed plan.Tariff and FinanceFixed charge/month for residential customers: Tk. 68.00Ratio of industrial to residential tariff: 3.86Residential fixed component of tariff: 49.7 percentCost of new residential connection: Tk. 800Notes:1. Approval of tariff is under local government control under its oversight function.2. New connection fee is paid prior to connection.Consumer ServiceAverage monthly water consumption is about 29.5 m3 per connection. The water bill averages Tk. 136.47 per month per connection. Water isavailable seven hours a day to most users. All of the population served have intermittent water supply. Water quality monitoring is inadequate withno residual chlorine test conducted during the year. There were 280 consumer complaints on water service recorded while 42 pipe breaks wererepaired in 2006–07. Consumers can complain in person at the utility office or by telephone, which are also used to get the views of customers. Theutility does not have any provision to allow payment of connection charges over a period of several months.Performance HighlightsChuadanga Pourashava provides water at 87 lpcd to its consumers for an average of only seven hours per day to 68.3 percent of the population inits service area. It has the lowest UFW at 2.7 percent, although this figure is based on estimates of production and total consumption in theabsence of any metering. Financial management is good with an operating ratio of 0.53, the second lowest, and accounts receivable equivalent of3.1 months, also the second lowest. However, reported revenue collection efficiency is only 75 percent despite the good financial performance.Average tariff of Tk. 4.62/m3 is just above average among the utilities but it covers operating costs well. Staff per 1,000 connections ratio at 7.0 isthe second. Except for customer satisfaction, the utility is doing very well, particularly in managing its water losses and its finances. However, moreaccurate measures of production and consumption need to be done.Performance Gaps to be AddressedMajor performance gaps for this utility are in consumer satisfaction, particularly in the number of hours water is made available to its consumersand low coverage. Continuous supply is necessary for health and water quality considerations, hence the need for 24-hour supply. Water deliveredto consumers should be increased to about 100 lpcd while services should be expanded to the 32 percent of the population still not served by thepourashava. While UFW is very low, there is a need for a better measure of production and consumption. Full metering is needed not just formeasuring UFW accurately but also for proper billing based on actual consumption. Revenue collection efficiency needs to be increased to100 percent from its current 75 percent. With the low UFW, improvements in coverage, availability, and per capita consumption will have to comefrom capital development. The utility’s operating ratio suggests that additional costs can still be absorbed by the current tariff, although there is apossibility that tariffs would increase with additional investments to finance expansion and development of additional sources.
CHUADANGA Utility Profile
54

Bangladesh Water UtilitiesData Book, 2006–07:Benchmarking for ImprovingWater Supply Delivery
Notes:1 The population is for the total area of responsibility.2 No data on residual chlorine test was given.3 All the population served has intermittent supply.4 This is for residential consumption from direct supply, shared taps, and public water taps.5 None of the connections are metered. This is based on estimated values.6 There were no billings for institutional consumption.Data as of 2006-07.
Production/Distribution
Average daily production 4,000 m3/dDistribution pipes 50.8 kmAnnual consumption Residential—direct 1,360,000 m3
Residential—PWP Nil Commercial/industrial 50,000 m3
Institutional 10,000 m3
Bulk supply Nil
Water Service
Population served Direct/shared taps 42,000 Public water points 1,000Total 43,000
Pipe breaks 42Complaints 280
Service Indicators
Water coverage2 68%Water availability3 7 hours/dayPer capita consumption4 87 l/c/dAverage tariff 4.62 Tk./m3
Sewerage coverage Nil
Efficiency Indicators
Unaccounted-for water5 2.7%Nonrevenue water6 3.4%Unit production cost 2.40 Tk./m3
Operating ratio 0.53Accounts receivable 3.1 monthsStaff/1,000 connections 7.0
Area Profile CHUADANGACHUADANGA WATER SUPPLY
Population: 63,0001
55
Annual Water Use1,460,000 m3
Annual Water BillingsTk. 6,566,791
Annual O&M CostsTk. 3,498,050

Water UtilityGAZIPUR POURASHAVAGazipur, Dhaka, BangladeshTelephone: 9252386, 01711-680815, Fax: 9256633, E-mail: [email protected], Contact: A. K. M. Mozammel Haque, ChairmanGazipur Pourashava has a water department that is responsible for providing water supply services to the municipality of Gazipur with a totalpopulation of 502,000 people in a predominantly urban service area. The utility is part of the local government which provides oversight on theutility’s service provision and tariff setting. It depends on grants and government transfer for funds for capital development. Planning is done on ayear-to-year basis together with budget setting.General Data about Water UtilityWater connections: 2,060Staff: 11Annual O&M costs: Tk. 3,023,584Annual billings: Tk. 4,767,028Annual collections: Tk. 4,729,845Debt service for 2006–07: Tk. 126,991Gross fixed asset value: Tk. 33,566,145Source of investment funds: Grants or government transferManagement and GovernanceThere is no reported private sector involvement in any of the utility’s operations. No skills and training strategy, annual staff appraisal and targetsetting, and staff reward and recognition program are available. However, the utility has the ability to recruit and dismiss staff within an agreed plan.Tariff and FinanceFixed charge/month for residential customers: Tk. 120.00Ratio of industrial to residential tariff: 3.93Residential fixed component of tariff: 62.2 percentCost of new residential connection: Tk. 1,000Notes:1. Approval of tariff is under local government control under its oversight function.2. New connection fee is paid prior to connection.Consumer ServiceAverage monthly water consumption is about 39.2 m3 per connection. The water bill averages Tk. 192.84 per month per connection. Water is available10 hours a day to most users. About 47 percent of the population served has intermittent water supply. Water quality monitoring is inadequate as noresidual chlorine test was conducted during the year. There were 170 consumer complaints on water service recorded while 95 pipe breaks wererepaired in 2006–07. Consumers can complain in person at the utility office or by telephone. The utility gets the views of customers when attending tocomplaints. The utility does not have any provision to allow payment of connection charges over a period of several months.Performance HighlightsGazipur Pourashava provides water at 34 lpcd to its consumers for an average of 10 hours per day to only 14.8 percent of the population in itsservice area. It has the highest UFW of 52 percent among the surveyed utilities, although the absence of meters to measure production andconsumption casts doubt on the reliability of this value. However, the very low coverage, which is also the lowest among the utilities, suggests watersupply problems made worse by losses of more than half of production. Financial management is mixed with good operating ratio of 0.63 but with anaccounts receivable equivalent of 11.9 months. Average tariff is Tk. 4.91/m3, the fourth highest, which is enough for revenues to cover operatingexpenses. The utility has the lowest staff per 1,000 connections ratio of 5.3, suggesting good utilization of human resources. Overall, the utility is notdoing well and needs to improve its performance starting with reducing water losses and expanding to unserved areas. Customers deserve morewater and longer distribution hours. While tariffs seem sufficient, bills have to be collected in a timely manner.Performance Gaps to be AddressedThe largest gaps in performance are in the very low coverage and per capita consumption largely brought about by high water losses. ReducingUFW to less than 20 percent of production alone can help increase supply to about 100 lpcd, extend distribution hours to 24 hours, and expandservices to the unserved areas covering about 85 percent of the total population. However, it will still require additional investments in capitaldevelopment to reach this level of performance. Reduction of UFW should start with better measures of production and consumption requiring fullmetering of these parameters. Despite the good operating ratio, the utility has to collect bill payments within two months, which is reasonablefor small utilities. Water quality is an area for improvement as monitoring of water quality indicators, such as residual chlorine in the system,is inadequate.
GAZIPUR Utility Profile
56

Bangladesh Water UtilitiesData Book, 2006–07:Benchmarking for ImprovingWater Supply Delivery
Notes:1 The population is for the total area of responsibility.2 No data on residual chlorine test was given.3 About 47 percent of the population served has intermittent supply.4 This is for residential consumption from direct supply, shared taps, and public water taps.5 None of the connections are metered. This is based on estimated values.6 There were no billings for public water points consumption.Data as of 2006-07.
Production/Distribution
Average daily production 5,534 m3/dDistribution pipes 22.0 kmAnnual consumption Residential—direct 900,000 m3
Residential—PWP 20,000 m3
Commercial/industrial 30,000 m3
Institutional 20,000 m3
Bulk supply Nil
Water Service
Population served Direct/shared taps 71,080 Public water points 3,190Total 74,270
Pipe breaks 95Complaints 170
Service Indicators
Water coverage2 15%Water availability3 10 hours/dayPer capita consumption4 34 l/c/dAverage tariff 4.91 Tk./m3
Sewerage coverage Nil
Efficiency Indicators
Unaccounted-for water5 52.0%Nonrevenue water6 53.0%Unit production cost 1.50 Tk./m3
Operating ratio 0.63Accounts receivable 11.9 monthsStaff/1,000 connections 5.3
Area Profile GAZIPURGAZIPUR WATER SUPPLY
Population: 502,0001
57
Annual Water Use2,020,000 m3
Annual Water BillingsTk. 4,767,028
Annual O&M CostsTk. 3,023,584
Water UtilityJESSORE POURASHAVAJessore Municipality, Jessore, BangladeshTelephone: 0421-68681/63469, 01715-144757, Fax: 0421-63899, E-mail: [email protected], Contact: Md Kamruzzaman Chunnu, ChairmanJessore Pourashava has a water department that is responsible for providing water supply services to the municipality of Jessore with a totalpopulation of 147,000 people in a predominantly urban service area. The utility is part of the local government which provides oversight on theutility’s service provision and tariff setting. While it is part of the local government, the utility’s finances are ring-fenced. It depends on grants andgovernment transfer for funds as well as borrowings from international financing agencies for capital development. However, no debt service wasreported for 2006–07. Planning is done on a year-to-year basis together with budget setting.General Data about Water UtilityWater connections: 8,950Staff: 73Annual O&M costs: Tk. 14,017,820Annual billings: Tk. 14,011,667Annual collections: Tk. 14,011,667Debt service for 2006–07: NilGross fixed asset value: Tk. 400,000,000Source of investment funds: Grants or government transfer; and borrowings from international financing agenciesManagement and GovernanceThere is no reported private sector involvement in any of the utility’s operations. No skills and training strategy, annual staff appraisal and targetsetting, and staff reward and recognition program are available. However, the utility has the ability to recruit and dismiss staff within an agreed plan.Tariff and FinanceFixed charge/month for residential customers: Tk. 120.00Ratio of industrial to residential tariff: 0.49Residential fixed component of tariff: 92.0 percentCost of new residential connection: Tk. 500Notes:1. Approval of tariff is under local government control under its oversight function.2. New connection fee is paid prior to connection.Consumer ServiceAverage monthly water consumption is about 26.1 m3 per connection. The water bill averages Tk. 130.46 per month per connection. Water isavailable nine hours a day to most users. No data on population served having intermittent water supply were given. Water quality monitoring isinadequate as no residual chlorine test was conducted during the year. There were 1,215 consumer complaints on water service recorded while1,150 pipe breaks were repaired in 2006–07. Consumers can complain in person at the utility office or by telephone. The utility gets the views ofcustomers by letter, telephone, and when attending to complaints. The utility does not have any provision to allow payment of connection chargesover a period of several months.Performance HighlightsJessore Pourashava provides water at 72 lpcd to its consumers for an average of nine hours per day to 68.0 percent of the population in its servicearea. UFW of 28.2 percent is higher than the average for Bangladesh utilities. However, none of its service connections and production sources aremetered, making the UFW an estimate at best. Operating ratio is 1.0 and accounts receivable equivalent is 8.6 months. Average tariff of Tk. 5.00/m3
is the third highest. Revenues are just enough to cover operating expenses but collection period should be reduced. Staff per 1,000 connectionsratio at 8.2 is the fifth lowest, lower than average among the utilities. Customer satisfaction needs improvement by increasing water availability,per capita consumption, and coverage. Tariffs increase should bring revenues to a level to cover O&M expenses and fund expansion andservice improvements.Performance Gaps to be AddressedPerformance gaps are in customer satisfaction and financial management. The amount of water supplied to consumers should be increased toabout 100 lpcd unless there are other sources of water for domestic use such as wells with handpumps. It is almost sure that none of theconsumers have continuous supply so that availability needs to be increased up to 24 hours. Services should be expanded to one-third of thepopulation currently not served. Efficient utilities should cover operating and expansion costs with appropriate tariffs. Operating ratio should bebrought to about 0.75 or lower by raising tariffs or reducing costs. More than half of O&M costs go to staff salaries and remuneration. Whilereduction of staff is an option, it may be better to develop human resources through skills training and proper redeployment to increase productivity.
JESSORE Utility Profile
58

Bangladesh Water UtilitiesData Book, 2006–07:Benchmarking for ImprovingWater Supply Delivery
Notes:1 The population is for the total area of responsibility.2 No data on residual chlorine test was given.3 No data on population with intermittent supply was given.4 This is for residential consumption from direct supply, shared taps, and public water taps.5 None of the connections are metered. This is based on estimated values.6 There were no billings for public water points consumption.Data as of 2006-07.
Production/Distribution
Average daily production 10,685 m3/dDistribution pipes 122.0 kmAnnual consumption Residential—direct 2,550,000 m3
Residential—PWP 90,000 m3
Commercial/industrial 130,000 m3
Institutional 30,000 m3
Bulk supply Nil
Water Service
Population served Direct/shared taps 78,000 Public water points 22,000Total 100,000
Pipe breaks 1,150Complaints 1,215
Service Indicators
Water coverage2 68%Water availability3 9 hours/dayPer capita consumption4 72 l/c/dAverage tariff 5.00 Tk./m3
Sewerage coverage Nil
Efficiency Indicators
Unaccounted-for water5 28.2%Nonrevenue water6 30.5%Unit production cost 3.59 Tk./m3
Operating ratio 1.00Accounts receivable 8.6 monthsStaff/1,000 connections 8.2
Area Profile JESSOREJESSORE WATER SUPPLY
Population: 147,0001
Annual Water Use3,900,000 m3
Annual Water BillingsTk. 14,011,667
Annual O&M CostsTk. 14,017,820
59

MANIKGANJ Utility ProfileWater UtilityMANIKGANJ POURASHAVAManikganj Municipality, Dhaka, BangladeshTelephone: 0651-61403, Fax: none, E-mail: none, Contact: Mr. Sudeb Saha, ChairmanManikganj Pourashava has a water department that is responsible for providing water supply services to the municipality of Manikganj with a totalpopulation of 58,060 people in a predominantly urban service area. The utility is part of the local government which provides oversight on the utility’sservice provision and tariff setting. While it is part of the local government, the utility’s finances are ring-fenced. It depends on grants and governmenttransfer for funds for capital development. Planning is done on a year-to-year basis together with budget setting.General Data about Water UtilityWater connections: 3,200Staff: 31Annual O&M costs: Tk. 6,080,896Annual billings: Tk. 6,485,791Annual collections: Tk. 3,810,402Debt service for 2006–07: NilGross fixed asset value: Tk. 3,000,000Source of investment funds: Grants or government transferManagement and GovernanceThere is no reported private sector involvement in any of the utility’s operations. No skills and training strategy, annual staff appraisal and targetsetting, and staff reward and recognition program are available. However, the utility has the ability to recruit and dismiss staff within an agreed plan.Tariff and FinanceFixed charge/month for residential customers: Tk. 110.00Ratio of industrial to residential tariff: 1.95Residential fixed component of tariff: 65.1 percentCost of new residential connection: Tk. 300Notes:1. Approval of tariff is under local government control under its oversight function.2. New connection fee is paid prior to connection.Consumer ServiceAverage monthly water consumption is about 60.4 m3 per connection. The water bill averages Tk. 168.90 per month per connection. Water isavailable 20 hours a day to most users. All of the population served have intermittent water supply. Water quality monitoring is inadequate with onlytwo residual chlorine tests conducted during the year. Both samples failed the test. There were 700 consumer complaints on water service recordedwhile 300 pipe breaks were repaired in 2006–07. Consumers can complain in person at the utility office or by letter or telephone. The utility gets theviews of customers when attending to complaints. The utility does not have any provision to allow payment of connection charges over a period ofseveral months.Performance HighlightsManikganj Pourashava provides water at 264 lpcd to its consumers for an average of 20 hours per day to only 36.2 percent of the population in itsservice area. UFW is the third lowest at 7.2 percent but this estimate is doubtful since only 37.5 percent of the connections are metered andproduction sources are not fully metered or not at all. Operating ratio is 0.94 and accounts receivable equivalent is 8.4 months which is too long tocollect bill payments. Average tariff of Tk. 2.80/m3 is the third lowest and it is hardly enough to cover operating expenses. Staff per 1,000 connectionsratio at 9.7 is higher than average and high compared to better performing utilities in Asia. Customer satisfaction is satisfactory except for the lowcoverage. Water losses are low but need further investigation in the absence of metering of both production and consumption. However, consumptionis way too high and could be wasteful. Billing and collection needs improvement.Performance Gaps to be AddressedReducing per capita consumption among present customers could be one way of providing water to the remaining 64 percent of the population thatis not currently served by the utility. This can be done through water conservation campaigns and also by increasing tariffs to manage demand. Thelow tariff is one reason for the high consumption. Increasing tariff can also improve the utility’s operating ratio with additional revenues to coveroperating costs comfortably. The collection period can be reduced by improving billing and collection through the use of known best practices forgetting consumers to pay their bills on time. Efficient utilities should not take more than two or three months to collect bill payments. While wateravailability is the second highest, the utility should strive to increase this further to 24 hours. Staff productivity should be improved through trainingand capacity building, which is currently absent. Water quality should be monitored on a regular basis and as frequently as the law requires.
60

Bangladesh Water UtilitiesData Book, 2006–07:Benchmarking for ImprovingWater Supply Delivery
Notes:1 The population is for the total area of responsibility.2 The two samples taken for residual chlorine were reported to have failed the test.3 All the population served has intermittent supply.4 This is for residential consumption from direct supply, shared taps, and public water taps.5 None of the connections are metered. This is based on estimated values.6 Free water from public water taps may not have been recorded.Data as of 2006-07.
Production/Distribution
Average daily production 6,849 m3/dDistribution pipes 72.0 kmAnnual consumption Residential—direct 2,020,000 m3
Residential—PWP Nil Commercial/industrial 200,000 m3
Institutional 100,000 m3
Bulk supply Nil
Water Service
Population served Direct/shared taps 19,500 Public water points 1,500Total 21,000
Pipe breaks 300Complaints 700
Service Indicators
Water coverage2 36%Water availability3 20 hours/dayPer capita consumption4 264 l/c/dAverage tariff 2.80 Tk./m3
Sewerage coverage Nil
Efficiency Indicators
Unaccounted-for water5 7.2%Nonrevenue water6 7.2%Unit production cost 2.43 Tk./m3
Operating ratio 0.94Accounts receivable 8.4 monthsStaff/1,000 connections 9.7
Area Profile MANIKGANJMANIKGANJ WATER SUPPLY
Population: 58,0601
Annual Water Use2,500,000 m3
Annual Water BillingsTk. 6,485,791
Annual O&M CostsTk. 6,080,896
61

NARSINGDI Utility ProfileWater UtilityNARSINGDI POURASHAVANarsingdi Municipality, Dhaka, BangladeshTelephone: 0628-63154, 01713-514328, Fax: none, E-mail: none, Contact: Mohammed Lokman Hossain, ChairmanNarsingdi Pourashava has a water department that is responsible for providing water supply services to the municipality of Narsingdi with a totalpopulation of 32,060 people in a predominantly urban service area. An independent service and price regulator provides oversight on the utility’sservice provision and tariff setting. While it is part of the local government, the utility’s finances are ring-fenced. It depends on grants and governmenttransfer for funds for capital development. Planning is done on a year-to-year basis together with budget setting.General Data about Water UtilityWater connections: 2,250Staff: 19Annual O&M costs: Tk. 5,278,951Annual billings: Tk. 3,695,460Annual collections: Tk. 7,019,526Debt service for 2006–07: NilGross fixed asset value: Tk. 169,000,000Source of investment funds: Grants or government transferManagement and GovernanceThere is no reported private sector involvement in any of the utility’s operations. No skills and training strategy, annual staff appraisal and targetsetting, and staff reward and recognition program are available. The utility does not have the ability to recruit and dismiss staff.Tariff and FinanceFixed charge/month for residential customers: Tk. 120.00Ratio of industrial to residential tariff: 0.71Residential fixed component of tariff: 87.7 percentCost of new residential connection: Tk. 500Notes:1. Approval of tariff is under an independent service and price regulator.2. New connection fee is paid prior to connection.Consumer ServiceAverage monthly water consumption is about 38.1 m3 per connection. The water bill averages Tk. 136.87 per month per connection. Water is availableseven hours a day to most users. All of the population served has intermittent water supply. Water quality monitoring is inadequate with no residualchlorine test conducted during the year. There were 450 consumer complaints on water service recorded while only 13 pipe breaks were repaired in2006–07. Consumers can complain in person at the utility office or by letter or telephone. The utility gets the views of customers when attending tocomplaints brought out through these means. The utility does not have any provision to allow payment of connection charges over a period ofseveral months.Performance HighlightsNarsingdi Pourashava provides water at 113 lpcd to its consumers for an average of only seven hours per day to 70.3 percent of the population in itsservice area. UFW of 25.4 percent is just above average. None of the connections and production sources are metered, making the water loss valueunreliable and doubtful. Financial management is poor with operating ratio at 1.43 being the second highest and accounts receivable equivalent of55.6 months, the highest among the utilities. Average tariff of Tk. 3.59/m3 is the fourth lowest and even lower than the unit production cost, hence thehigh operating ratio with revenues insufficient to cover operating expenses. Staff per 1,000 connections ratio at 8.4 is lower than the average.While the utility provides sufficient water to its consumers, operating hours should be increased. Efforts must be taken to improve collection andincrease revenues.Performance Gaps to be AddressedPriority should be given to collecting the large arrears. Revenue collection efficiency of 190 percent shows that revenue collection last year includespart of the arrears accumulated over the years. Tariffs are too low to cover operating cost. Furthermore, the operating ratio could be higher than 1.43since the reported O&M costs only includes staff salaries and electrical power costs. Shortfall in revenues, most probably, is covered from the localgovernment budget. There is clearly a need to review the current tariff rates for possible increase to appropriate levels sufficient to cover operatingexpenses and expand service to the unserved 30 percent of the population. Water availability should be increased to 24 hours not just to satisfy theutility’s customers but also to protect them from water contamination. Water quality monitoring should also be improved in the absence of anyresidual chlorine test conducted in 2006–07. Full metering of production sources and all connections is necessary in reducing UFW further.
62

Bangladesh Water UtilitiesData Book, 2006–07:Benchmarking for ImprovingWater Supply Delivery
Notes:1 The population is for the total area of responsibility.2 No data on residual chlorine test was given.3 All the population served has intermittent supply.4 This is for residential consumption from direct supply, shared taps, and public water taps.5 None of the connections are metered. This is based on estimated values.6 There were no billings for public water points consumption.7 These were the only cost components given for the total O&M cost.Data as of 2006-07.
Production/Distribution
Average daily production 3,781 m3/dDistribution pipes 52.7 kmAnnual consumption Residential—direct 890,000 m3
Residential—PWP 40,000 m3
Commercial/industrial 100,000 m3
Institutional Nil Bulk supply Nil
Water Service
Population served Direct/shared taps 22,100 Public water points 400Total 22,500
Pipe breaks 13Complaints 450
Service Indicators
Water coverage2 70%Water availability3 7 hours/dayPer capita consumption4 113 l/c/dAverage tariff 3.59 Tk./m3
Sewerage coverage Nil
Efficiency Indicators
Unaccounted-for water5 25.4%Nonrevenue water6 28.3%Unit production cost7 3.83 Tk./m3
Operating ratio 1.43Accounts receivable 55.6 monthsStaff/1,000 connections 8.4
Area Profile NARSINGDINARSINGDI WATER SUPPLY
Population: 32,0001
Annual Water Use1,380,000 m3
Annual Water BillingsTk. 3,695,460
Annual O&M Costs7
Tk. 5,278,951
63


Water and Sanitation Program–South AsiaE 32 Agargaon, Sher-e-Bangla NagarDhaka 1207, BangladeshPhone: (880-2) 8159001-14Fax: (880-2) 8159029-30
June 2009
WSP MISSION:To help the poor gain sustained accessto water and sanitation services.
WSP FUNDING PARTNERS:The Governments of Australia, Austria,Belgium, Canada, Denmark, France,Ireland, Luxembourg, the Netherlands,Norway, Sweden, Switzerland, the UnitedKingdom, the United States of America; theUnited Nations Development Programme,The World Bank, and the Bill andMelinda Gates Foundation.
AusAID provides WSP-SAprogrammatic support.
Editor: Anjali Sen GuptaCreated by: Write Media
TASK MANAGER:Md. Akhtaruzzaman, Senior Water and Sanitation Specialist, WSP–South Asia
EDITORS:Zakir Hossain, Consultant, WSP–South Asia; Cesar E. Yñiguez, BenchmarkingAdviser; and Md. Akhtaruzzaman and Abdul Motaleb, Senior Water andSanitation Specialists, WSP–South Asia
PEER REVIEWED BY:Alexander V. Danilenko, Senior Water and Sanitation Specialist, WSP, IB–Net;Dennis D. Mwanza, Senior Water and Sanitation Specialist, WSP–Africa; andLeila H. Elvas, Consultant, WSP–East Asia and the Pacific
CONTRIBUTIONS BY:Mark Ellery, Senior Water and Sanitation Specialist, WSP–South Asia;Masroor Ahmed, Senior Water and Sanitation Specialist, WSP–South Asia;Vandana Bhatnagar, Financial Specialist, WSP–South Asia; Vandana Mehra,Regional Communication Specialist, WSP–South Asia; and Chris Heymans,Regional Team Leader, WSP–South Asia