benchmarking fundraising performance - gary hubbell...
TRANSCRIPT

WVDO ADVANCED SKILLS WORKSHOP
Benchmarking Fundraising Performance
Why, How & What Impact it Can Have on Your Bottom Line
Gary J. Hubbell
June 12, 2008 Portland, Oregon
G A R Y H U B B E L L C O N S U L T I N G L L C
© Gary Hubbell Consulting, LLC
This is copyrighted material. All rights are reserved.
It is against the law to make copies of this material without getting specific written permission in advance from Gary Hubbell Consulting, LLC. No part of this publication may be reproduced, stored in a retrieval system, or transmitted in any form or by any means, electronic, mechanical, photocopying, recording, or
otherwise without prior written permission of the publisher.
Printed in the United States of America
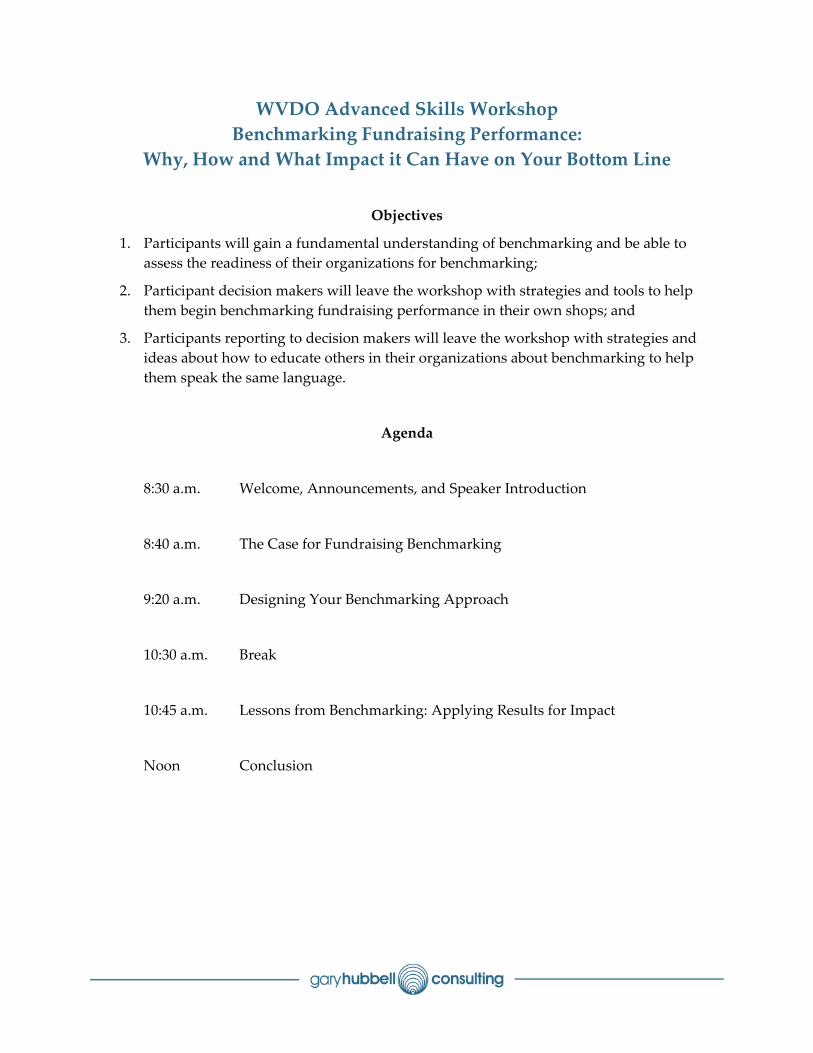
WVDO Advanced Skills Workshop Benchmarking Fundraising Performance:
Why, How and What Impact it Can Have on Your Bottom Line
Objectives
1. Participants will gain a fundamental understanding of benchmarking and be able to assess the readiness of their organizations for benchmarking;
2. Participant decision makers will leave the workshop with strategies and tools to help them begin benchmarking fundraising performance in their own shops; and
3. Participants reporting to decision makers will leave the workshop with strategies and ideas about how to educate others in their organizations about benchmarking to help them speak the same language.
Agenda
8:30 a.m. Welcome, Announcements, and Speaker Introduction
8:40 a.m. The Case for Fundraising Benchmarking
9:20 a.m. Designing Your Benchmarking Approach
10:30 a.m. Break
10:45 a.m. Lessons from Benchmarking: Applying Results for Impact
Noon Conclusion
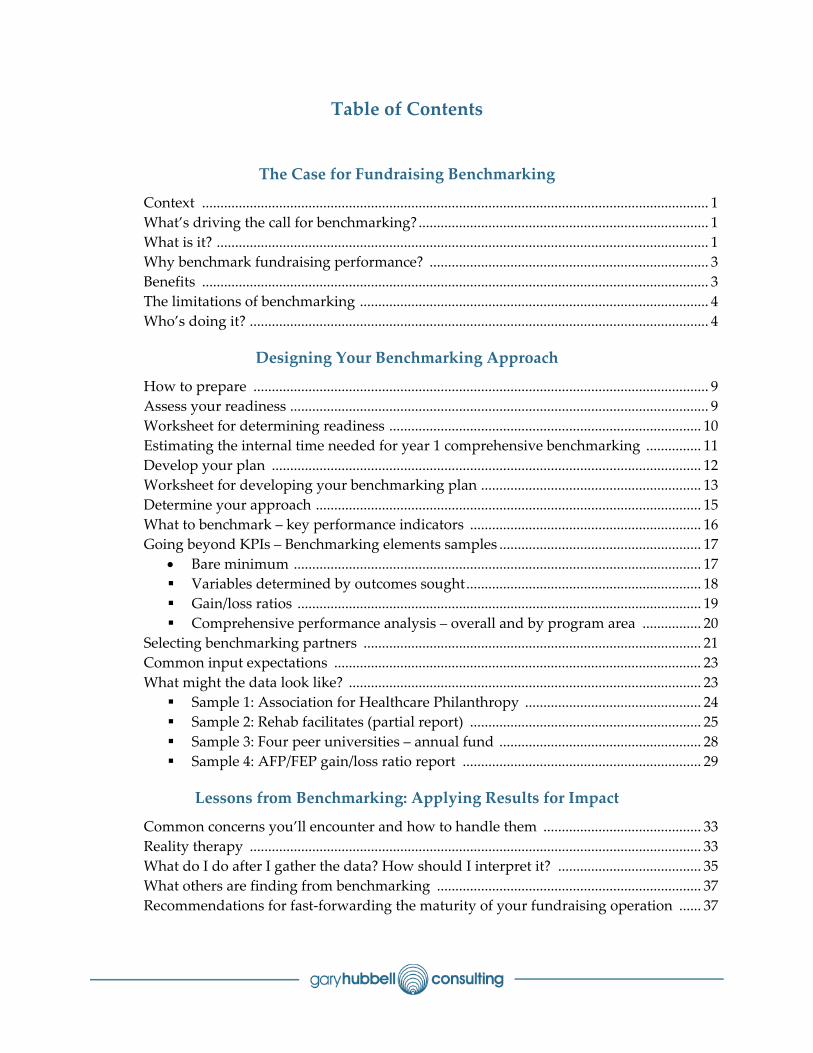
Table of Contents
The Case for Fundraising Benchmarking
Context .......................................................................................................................................... 1 What’s driving the call for benchmarking? ............................................................................... 1 What is it? ...................................................................................................................................... 1 Why benchmark fundraising performance? ............................................................................ 3 Benefits .......................................................................................................................................... 3 The limitations of benchmarking ............................................................................................... 4 Who’s doing it? ............................................................................................................................. 4
Designing Your Benchmarking Approach
How to prepare ............................................................................................................................ 9 Assess your readiness .................................................................................................................. 9 Worksheet for determining readiness ..................................................................................... 10 Estimating the internal time needed for year 1 comprehensive benchmarking ............... 11 Develop your plan ..................................................................................................................... 12 Worksheet for developing your benchmarking plan ............................................................ 13 Determine your approach ......................................................................................................... 15 What to benchmark – key performance indicators ............................................................... 16 Going beyond KPIs – Benchmarking elements samples ....................................................... 17
• Bare minimum ............................................................................................................... 17 Variables determined by outcomes sought ................................................................ 18 Gain/loss ratios .............................................................................................................. 19 Comprehensive performance analysis – overall and by program area ................ 20
Selecting benchmarking partners ............................................................................................ 21 Common input expectations .................................................................................................... 23 What might the data look like? ................................................................................................ 23
Sample 1: Association for Healthcare Philanthropy ................................................ 24 Sample 2: Rehab facilitates (partial report) ............................................................... 25 Sample 3: Four peer universities – annual fund ....................................................... 28 Sample 4: AFP/FEP gain/loss ratio report ................................................................. 29
Lessons from Benchmarking: Applying Results for Impact
Common concerns you’ll encounter and how to handle them ........................................... 33 Reality therapy ........................................................................................................................... 33 What do I do after I gather the data? How should I interpret it? ....................................... 35 What others are finding from benchmarking ........................................................................ 37 Recommendations for fast‐forwarding the maturity of your fundraising operation ...... 37
WVDO Advanced Skills Workshop – Benchmarking Fundraising Performance
Section One:
The Case for Fundraising Benchmarking

WVDO Advanced Skills Workshop – Benchmarking Fundraising Performance

WVDO Advanced Skills Workshop – Benchmarking Fundraising Performance
Page 1
Context First, the nonprofit sector has no agreed upon metric of success
Second, fundraising has had no industry‐wide metrics of success, but many “rules of thumb”
Benchmarking is an important milestone in the evolution of fundraising from craft to profession
What’s Driving the Call for Benchmarking?
Development professionals have a natural desire to succeed
Demands (expectations) are up for philanthropy as a revenue stream
CEOs/CFOs/boards want to know you’re effective
Most other operating functions are being benchmarked
True understanding of the fundraising process is low
Donors want to know you’re effective and trustworthy
Watchdog groups will tell your story for you What Is It?
General definition:
In fundraising circles:
Performance benchmarking is the pursuit of optimal fundraising program performance by the ongoing measurement of quantitative
and qualitative variables.
“[Benchmarking is] a systematic and continuous measurement process; a process of continually comparing and measuring an organization’s business processes against business leaders anywhere in the world to
gain information which will help the organization take action to improve its performance.”
From Jason Saul, 2004. Benchmarking for Nonprofits. Wilder Publishing,
www.wilderorg/pubs.
WVDO Advanced Skills Workshop – Benchmarking Fundraising Performance
Page 2
- Quantitative
o Volume
o Pace
o Financial measures
- Qualitative
o Measurement of the function, management, and organization of the remaining development components, including marketing communications and constituent relations
Benchmarking is a peer learning process
Approach as a shared learning process vs. a punitive process that engenders fear
Not an exercise, but a management discipline
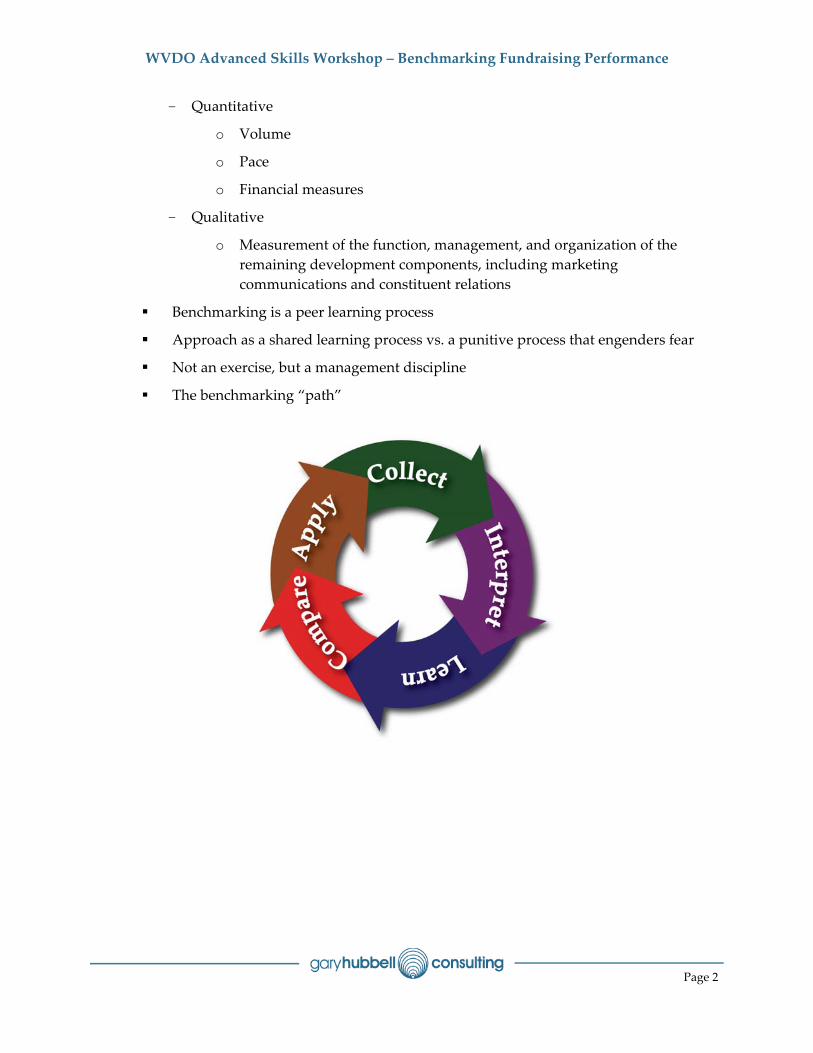
The benchmarking “path”
WVDO Advanced Skills Workshop – Benchmarking Fundraising Performance
Page 3
Why Benchmark Fundraising Performance? To help you identify a best practice
Internal aims to:
1) Set fundraising goals
2) Develop fundraising strategy
3) Inform strategy execution
External aims to:
1) Demonstrate the value of philanthropy
2) Teach the art and science of fundraising
3) Demonstrate resource needs to grow the philanthropy program Benefits
1. Standardizes language, processes, and metrics within the development office and among industry peers
2. Fosters credibility of the CDO among the executive team
3. Aids decision making when (re)deploying current resources
4. Identifies program and process strengths and weaknesses without bias
5. Allows you to look beyond simple cost‐to‐raise‐a‐dollar (CTRD) metrics for a more complete picture
6. Informs decisions to increase the fundraising budget in pursuit of higher returns
7. Helps to quantify goals that could otherwise remain soft and amorphous
8. Improves the tracking and reporting of results (which improves credibility)
9. Fosters development of quality controls, staff training, and management continuity
10. Makes the path clearer to raising more money
WVDO Advanced Skills Workshop – Benchmarking Fundraising Performance
Page 4
The Limitations of Fundraising Benchmarking 1. Fear of transparency keeps some from participating
2. Poor data management practices make benchmarking a challenge
3. Lack of commitment/connectedness among key development professionals limits output
4. Peer comparison groups are still small (but growing)
5. Analysis is still subjective—benchmarking is no substitute for asking “why”
6. Financial inputs and ratios still can’t tell us about the impact we’re having Who’s doing it?
Association for Healthcare Philanthropy (AHP)
Association of Fundraising Professionals (AFP) and the Urban Institute
Council for the Advancement and Support of Education (CASE)
Numerous national consulting and research firms (e.g., The Advisory Board Company; Bentz, Whaley & Flessner; Primary Research Group; Gary Hubbell Consulting and Reinders Research)
WVDO Advanced Skills Workshop – Benchmarking Fundraising Performance
Page 5
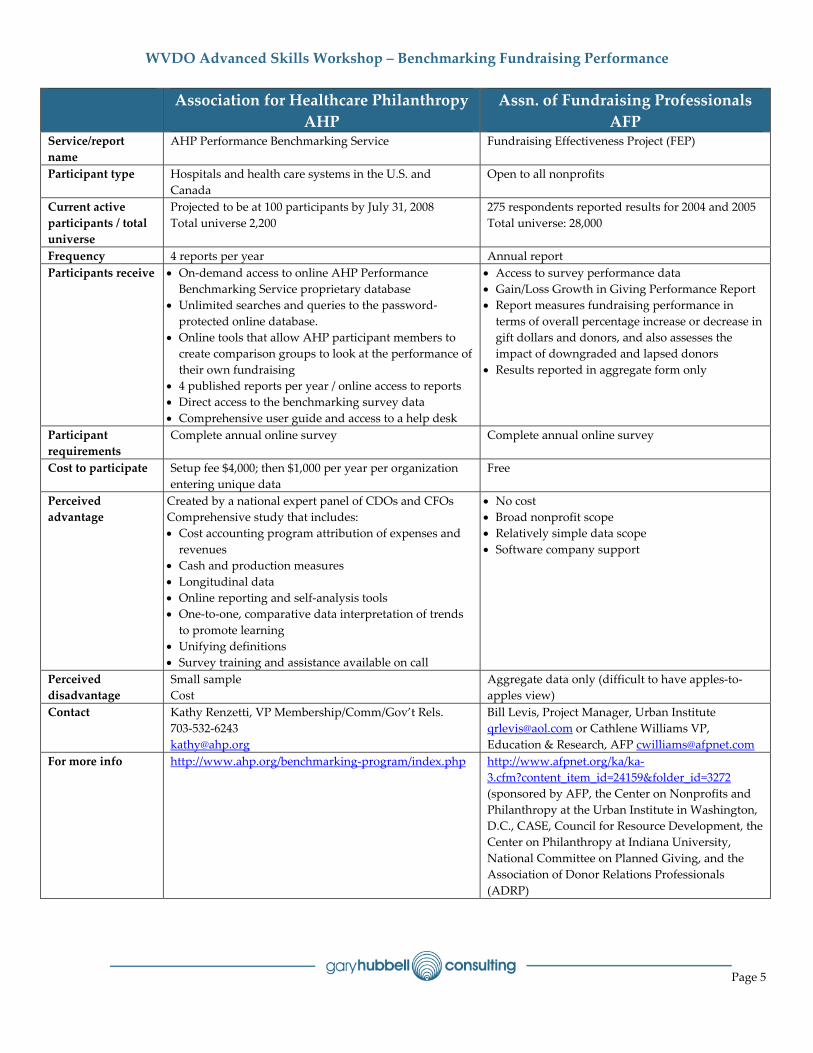
Association for Healthcare PhilanthropyAHP
Assn. of Fundraising ProfessionalsAFP
Service/report name
AHP Performance Benchmarking Service Fundraising Effectiveness Project (FEP)
Participant type Hospitals and health care systems in the U.S. and Canada
Open to all nonprofits
Current active participants / total universe
Projected to be at 100 participants by July 31, 2008 Total universe 2,200
275 respondents reported results for 2004 and 2005 Total universe: 28,000
Frequency 4 reports per year Annual report Participants receive • On‐demand access to online AHP Performance
Benchmarking Service proprietary database • Unlimited searches and queries to the password‐protected online database.
• Online tools that allow AHP participant members to create comparison groups to look at the performance of their own fundraising
• 4 published reports per year / online access to reports • Direct access to the benchmarking survey data • Comprehensive user guide and access to a help desk
• Access to survey performance data • Gain/Loss Growth in Giving Performance Report • Report measures fundraising performance in terms of overall percentage increase or decrease in gift dollars and donors, and also assesses the impact of downgraded and lapsed donors
• Results reported in aggregate form only
Participant requirements
Complete annual online survey Complete annual online survey
Cost to participate Setup fee $4,000; then $1,000 per year per organization entering unique data
Free
Perceived advantage
Created by a national expert panel of CDOs and CFOs Comprehensive study that includes: • Cost accounting program attribution of expenses and revenues
• Cash and production measures • Longitudinal data • Online reporting and self‐analysis tools • One‐to‐one, comparative data interpretation of trends to promote learning
• Unifying definitions • Survey training and assistance available on call
• No cost • Broad nonprofit scope • Relatively simple data scope • Software company support
Perceived disadvantage
Small sample Cost
Aggregate data only (difficult to have apples‐to‐apples view)
Contact Kathy Renzetti, VP Membership/Comm/Gov’t Rels. 703‐532‐6243 [email protected]
Bill Levis, Project Manager, Urban Institute [email protected] or Cathlene Williams VP, Education & Research, AFP [email protected]
For more info http://www.ahp.org/benchmarking‐program/index.php http://www.afpnet.org/ka/ka‐3.cfm?content_item_id=24159&folder_id=3272 (sponsored by AFP, the Center on Nonprofits and Philanthropy at the Urban Institute in Washington, D.C., CASE, Council for Resource Development, the Center on Philanthropy at Indiana University, National Committee on Planned Giving, and the Association of Donor Relations Professionals (ADRP)
WVDO Advanced Skills Workshop – Benchmarking Fundraising Performance
Page 6
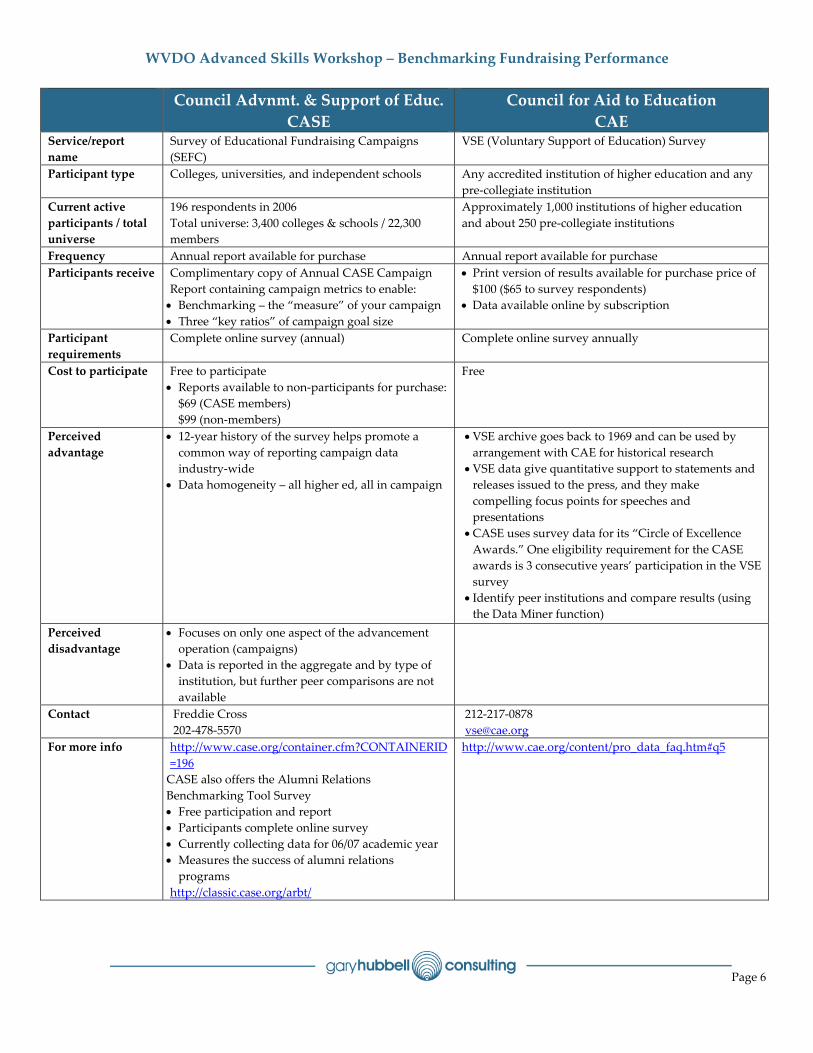
Council Advnmt. & Support of Educ.CASE
Council for Aid to EducationCAE
Service/report name
Survey of Educational Fundraising Campaigns (SEFC)
VSE (Voluntary Support of Education) Survey
Participant type Colleges, universities, and independent schools Any accredited institution of higher education and any pre‐collegiate institution
Current active participants / total universe
196 respondents in 2006 Total universe: 3,400 colleges & schools / 22,300 members
Approximately 1,000 institutions of higher education and about 250 pre‐collegiate institutions
Frequency Annual report available for purchase Annual report available for purchase Participants receive Complimentary copy of Annual CASE Campaign
Report containing campaign metrics to enable: • Benchmarking – the “measure” of your campaign • Three “key ratios” of campaign goal size
• Print version of results available for purchase price of $100 ($65 to survey respondents)
• Data available online by subscription
Participant requirements
Complete online survey (annual)
Complete online survey annually
Cost to participate Free to participate • Reports available to non‐participants for purchase:$69 (CASE members) $99 (non‐members)
Free
Perceived advantage
• 12‐year history of the survey helps promote a common way of reporting campaign data industry‐wide
• Data homogeneity – all higher ed, all in campaign
• VSE archive goes back to 1969 and can be used by arrangement with CAE for historical research
• VSE data give quantitative support to statements and releases issued to the press, and they make compelling focus points for speeches and presentations
• CASE uses survey data for its “Circle of Excellence Awards.” One eligibility requirement for the CASE awards is 3 consecutive years’ participation in the VSE survey
• Identify peer institutions and compare results (using the Data Miner function)
Perceived disadvantage
• Focuses on only one aspect of the advancement operation (campaigns)
• Data is reported in the aggregate and by type of institution, but further peer comparisons are not available
Contact Freddie Cross 202‐478‐5570
212‐217‐0878 [email protected]
For more info http://www.case.org/container.cfm?CONTAINERID=196 CASE also offers the Alumni Relations Benchmarking Tool Survey • Free participation and report • Participants complete online survey • Currently collecting data for 06/07 academic year • Measures the success of alumni relations programs
http://classic.case.org/arbt/
http://www.cae.org/content/pro_data_faq.htm#q5
WVDO Advanced Skills Workshop – Benchmarking Fundraising Performance
Page 7
Section Two:
Designing Your Benchmarking Approach

WVDO Advanced Skills Workshop – Benchmarking Fundraising Performance
Page 8
WVDO Advanced Skills Workshop – Benchmarking Fundraising Performance
Page 9
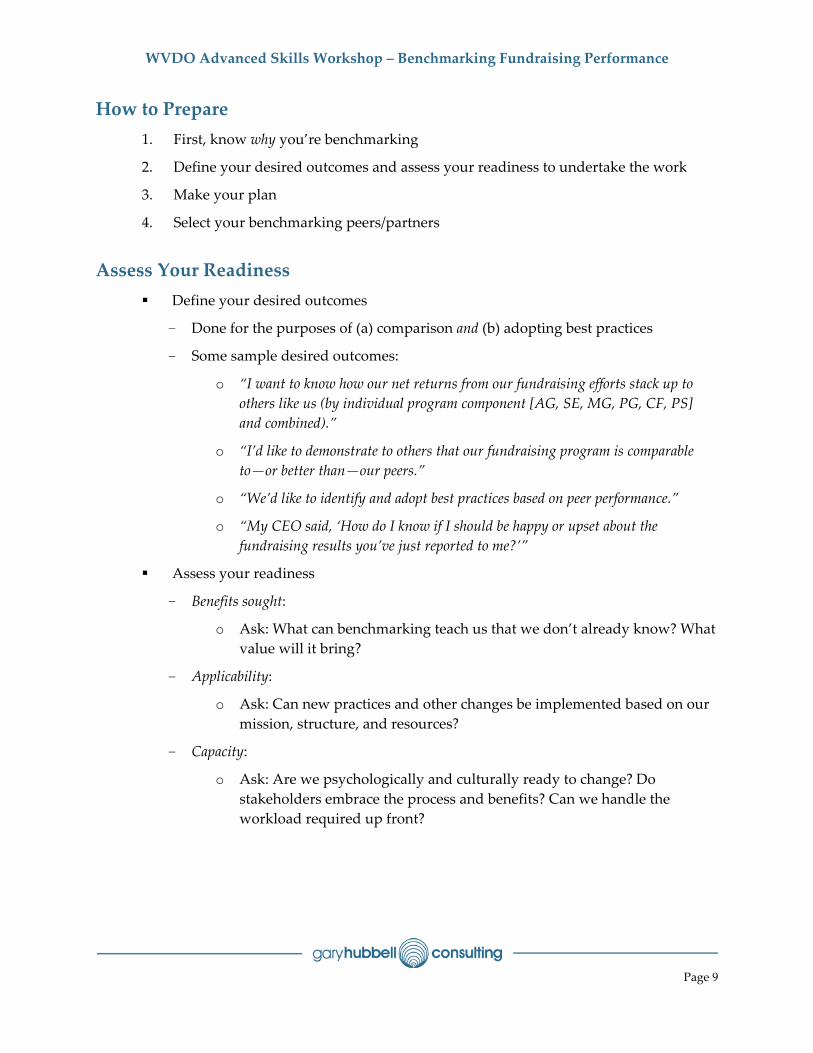
How to Prepare 1. First, know why you’re benchmarking
2. Define your desired outcomes and assess your readiness to undertake the work
3. Make your plan
4. Select your benchmarking peers/partners Assess Your Readiness
Define your desired outcomes
- Done for the purposes of (a) comparison and (b) adopting best practices
- Some sample desired outcomes:
o “I want to know how our net returns from our fundraising efforts stack up to others like us (by individual program component [AG, SE, MG, PG, CF, PS] and combined).”
o “I’d like to demonstrate to others that our fundraising program is comparable to—or better than—our peers.”
o “We’d like to identify and adopt best practices based on peer performance.”
o “My CEO said, ‘How do I know if I should be happy or upset about the fundraising results you’ve just reported to me?’”
Assess your readiness
- Benefits sought:
o Ask: What can benchmarking teach us that we don’t already know? What value will it bring?
- Applicability:
o Ask: Can new practices and other changes be implemented based on our mission, structure, and resources?
- Capacity:
o Ask: Are we psychologically and culturally ready to change? Do stakeholders embrace the process and benefits? Can we handle the workload required up front?
WVDO Advanced Skills Workshop – Benchmarking Fundraising Performance
Page 10
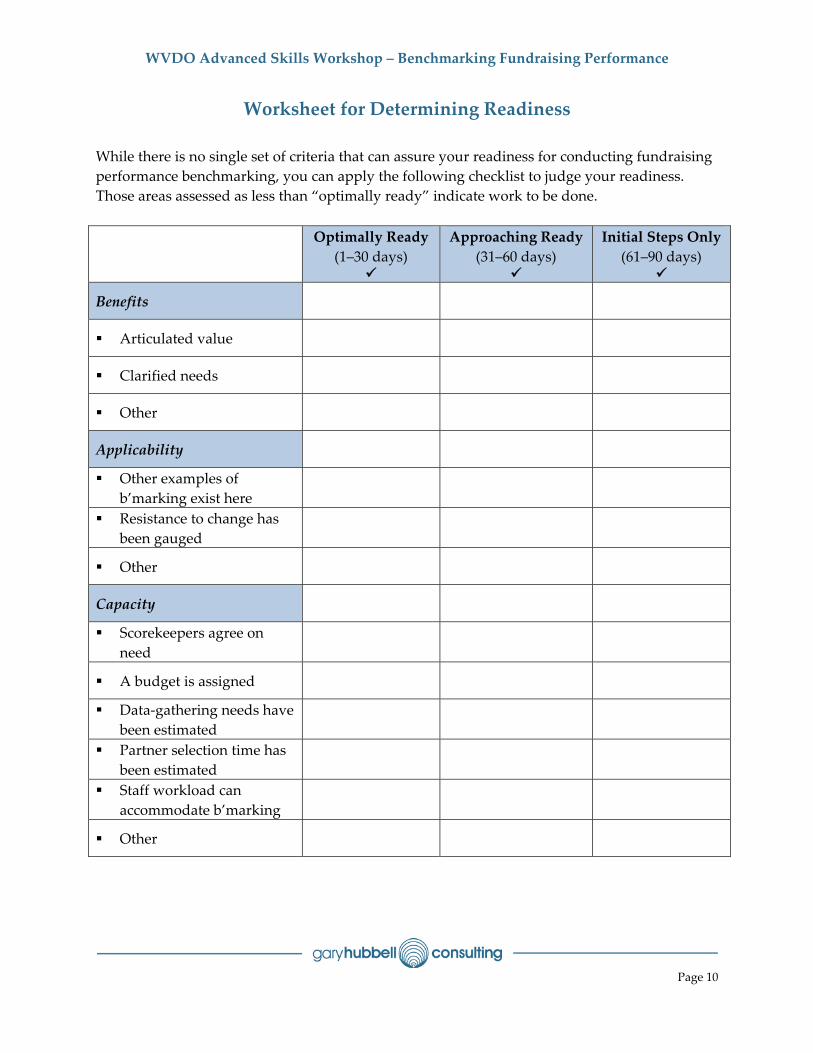
Worksheet for Determining Readiness While there is no single set of criteria that can assure your readiness for conducting fundraising performance benchmarking, you can apply the following checklist to judge your readiness. Those areas assessed as less than “optimally ready” indicate work to be done.
Optimally Ready (1–30 days)
Approaching Ready (31–60 days)
Initial Steps Only(61–90 days)
Benefits
Articulated value
Clarified needs
Other
Applicability
Other examples of b’marking exist here
Resistance to change has been gauged
Other
Capacity
Scorekeepers agree on need
A budget is assigned
Data‐gathering needs have been estimated
Partner selection time has been estimated
Staff workload can accommodate b’marking
Other
WVDO Advanced Skills Workshop – Benchmarking Fundraising Performance
Page 11
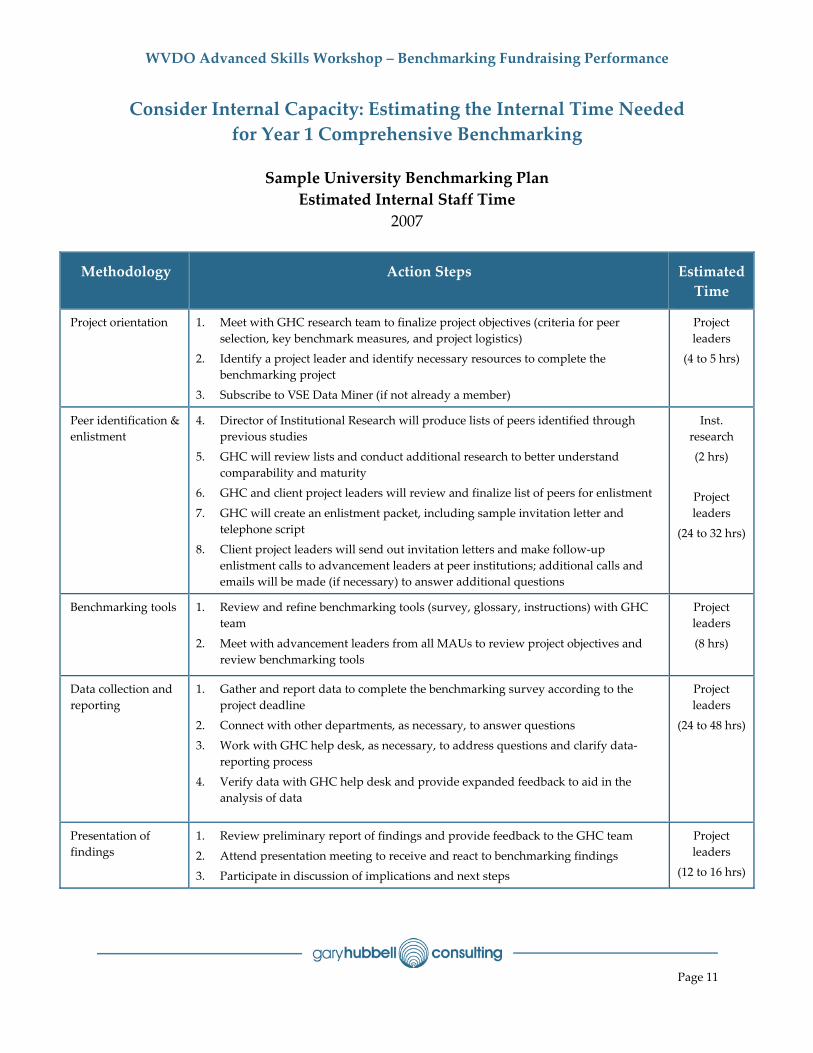
Consider Internal Capacity: Estimating the Internal Time Needed for Year 1 Comprehensive Benchmarking
Sample University Benchmarking Plan
Estimated Internal Staff Time 2007
Methodology Action Steps Estimated Time
Project orientation 1. Meet with GHC research team to finalize project objectives (criteria for peer selection, key benchmark measures, and project logistics)
2. Identify a project leader and identify necessary resources to complete the benchmarking project
3. Subscribe to VSE Data Miner (if not already a member)
Project leaders
(4 to 5 hrs)
Peer identification & enlistment
4. Director of Institutional Research will produce lists of peers identified through previous studies
5. GHC will review lists and conduct additional research to better understand comparability and maturity
6. GHC and client project leaders will review and finalize list of peers for enlistment
7. GHC will create an enlistment packet, including sample invitation letter and telephone script
8. Client project leaders will send out invitation letters and make follow‐up enlistment calls to advancement leaders at peer institutions; additional calls and emails will be made (if necessary) to answer additional questions
Inst. research
(2 hrs)
Project leaders
(24 to 32 hrs)
Benchmarking tools 1. Review and refine benchmarking tools (survey, glossary, instructions) with GHC team
2. Meet with advancement leaders from all MAUs to review project objectives and review benchmarking tools
Project leaders
(8 hrs)
Data collection and reporting
1. Gather and report data to complete the benchmarking survey according to the project deadline
2. Connect with other departments, as necessary, to answer questions
3. Work with GHC help desk, as necessary, to address questions and clarify data‐reporting process
4. Verify data with GHC help desk and provide expanded feedback to aid in the analysis of data
Project leaders
(24 to 48 hrs)
Presentation of findings
1. Review preliminary report of findings and provide feedback to the GHC team
2. Attend presentation meeting to receive and react to benchmarking findings
3. Participate in discussion of implications and next steps
Project leaders
(12 to 16 hrs)

WVDO Advanced Skills Workshop – Benchmarking Fundraising Performance
Page 12
Develop Your Plan All but the simplest data comparisons will require a plan
WVDO Advanced Skills Workshop – Benchmarking Fundraising Performance
Page 13
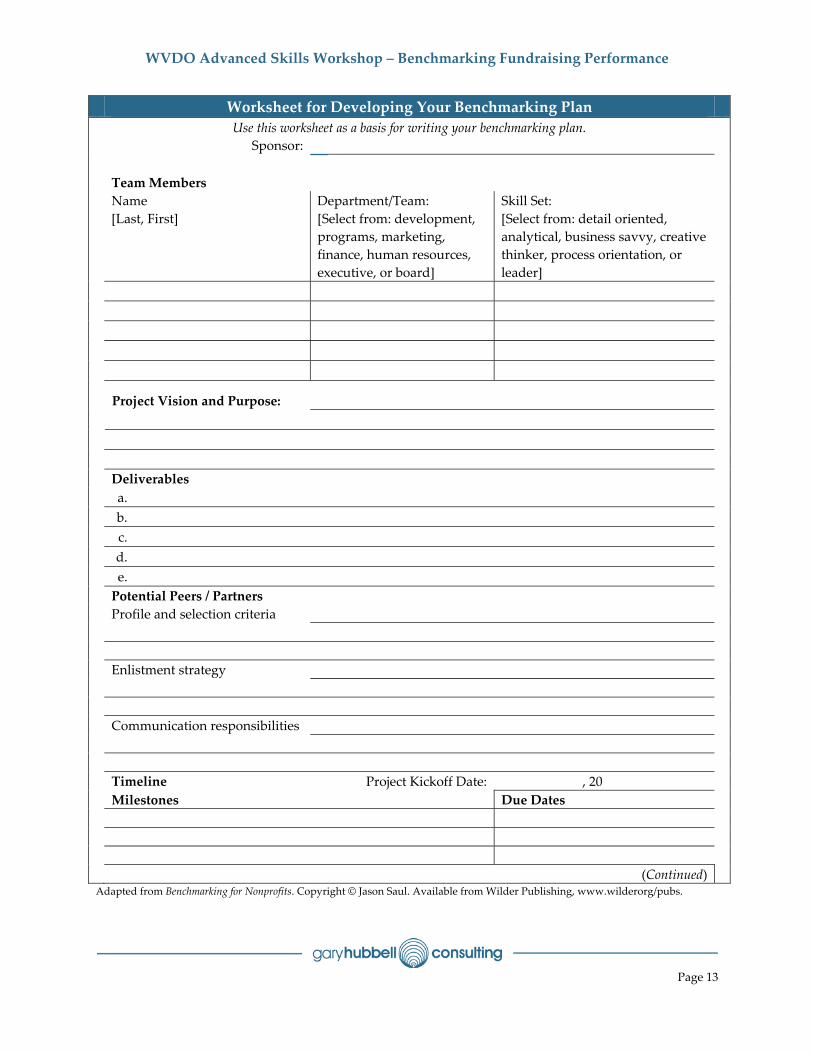
Worksheet for Developing Your Benchmarking Plan Use this worksheet as a basis for writing your benchmarking plan. Sponsor: Team Members
Name [Last, First]
Department/Team: [Select from: development, programs, marketing, finance, human resources, executive, or board]
Skill Set: [Select from: detail oriented, analytical, business savvy, creative thinker, process orientation, or leader]
Project Vision and Purpose:
Deliverables a. b. c. d. e. Potential Peers / Partners Profile and selection criteria Enlistment strategy Communication responsibilities Timeline Project Kickoff Date: , 20 Milestones Due Dates (Continued) Adapted from Benchmarking for Nonprofits. Copyright © Jason Saul. Available from Wilder Publishing, www.wilderorg/pubs.
WVDO Advanced Skills Workshop – Benchmarking Fundraising Performance
Page 14
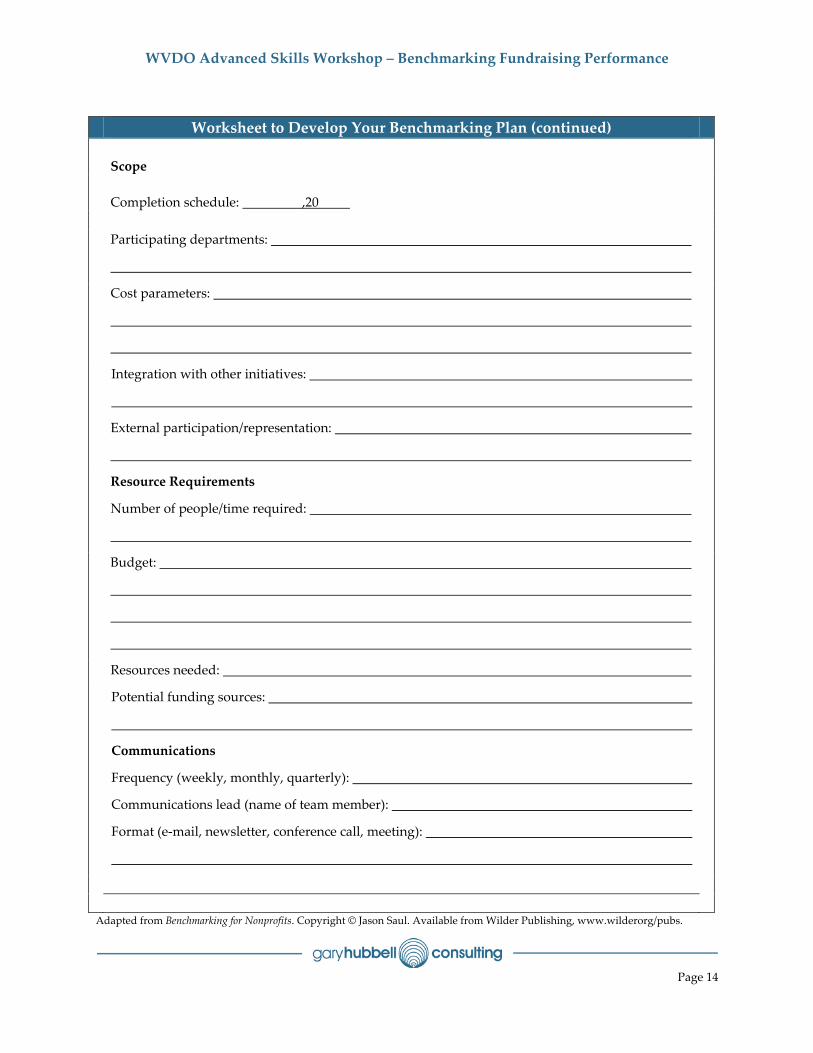
Worksheet to Develop Your Benchmarking Plan (continued) Scope
Completion schedule: ,20
Participating departments:
Cost parameters:
Integration with other initiatives:
External participation/representation:
Resource Requirements
Number of people/time required:
Budget:
Resources needed:
Potential funding sources:
Communications
Frequency (weekly, monthly, quarterly):
Communications lead (name of team member):
Format (e‐mail, newsletter, conference call, meeting):
Adapted from Benchmarking for Nonprofits. Copyright © Jason Saul. Available from Wilder Publishing, www.wilderorg/pubs.
WVDO Advanced Skills Workshop – Benchmarking Fundraising Performance
Page 15
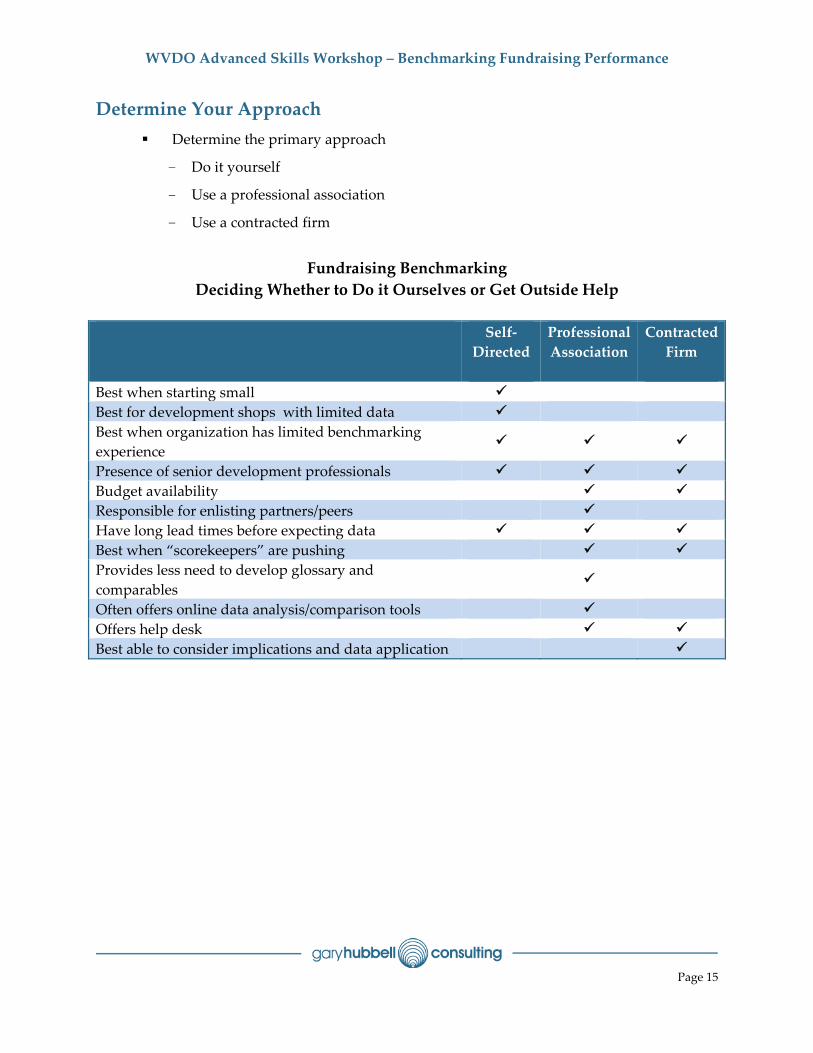
Determine Your Approach Determine the primary approach
- Do it yourself
- Use a professional association
- Use a contracted firm
Fundraising Benchmarking Deciding Whether to Do it Ourselves or Get Outside Help
Self‐
Directed
Professional Association
Contracted Firm
Best when starting small Best for development shops with limited data Best when organization has limited benchmarking experience
Presence of senior development professionals Budget availability Responsible for enlisting partners/peers Have long lead times before expecting data Best when “scorekeepers” are pushing Provides less need to develop glossary and comparables
Often offers online data analysis/comparison tools Offers help desk Best able to consider implications and data application
WVDO Advanced Skills Workshop – Benchmarking Fundraising Performance
Page 16
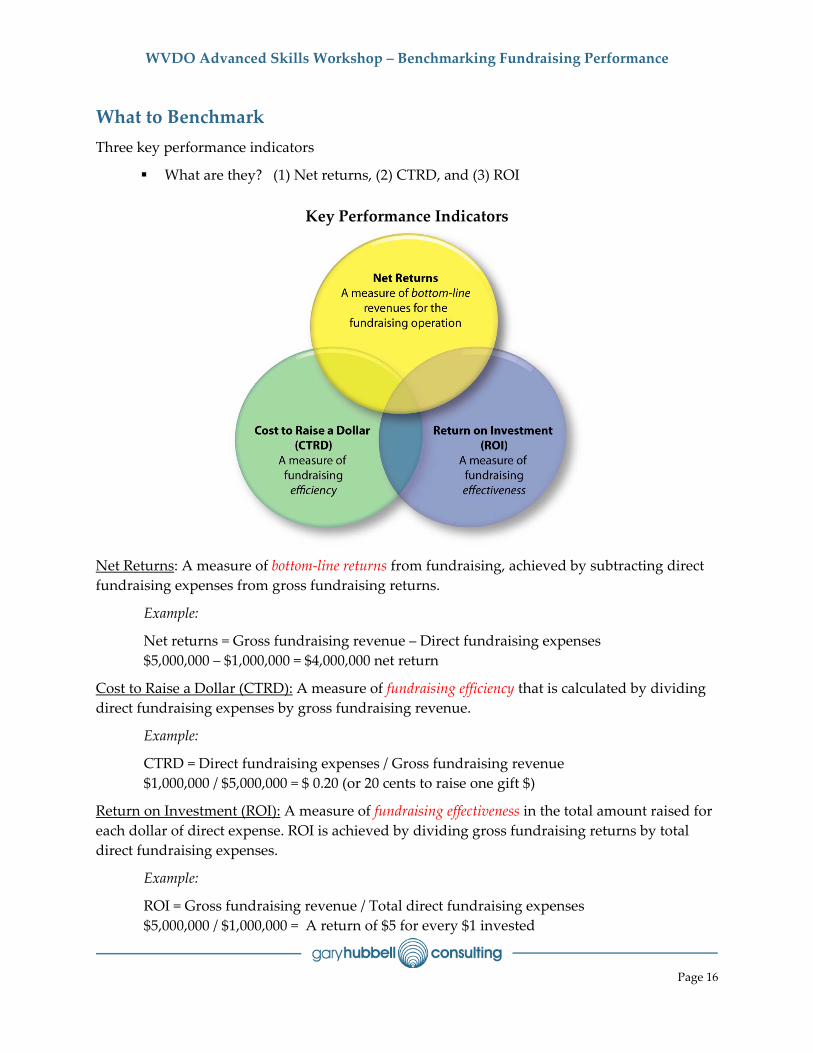
What to Benchmark Three key performance indicators
What are they? (1) Net returns, (2) CTRD, and (3) ROI
Key Performance Indicators
Net Returns: A measure of bottom‐line returns from fundraising, achieved by subtracting direct fundraising expenses from gross fundraising returns.
Example:
Net returns = Gross fundraising revenue – Direct fundraising expenses $5,000,000 – $1,000,000 = $4,000,000 net return
Cost to Raise a Dollar (CTRD): A measure of fundraising efficiency that is calculated by dividing direct fundraising expenses by gross fundraising revenue.
Example:
CTRD = Direct fundraising expenses / Gross fundraising revenue $1,000,000 / $5,000,000 = $ 0.20 (or 20 cents to raise one gift $)
Return on Investment (ROI): A measure of fundraising effectiveness in the total amount raised for each dollar of direct expense. ROI is achieved by dividing gross fundraising returns by total direct fundraising expenses.
Example:
ROI = Gross fundraising revenue / Total direct fundraising expenses $5,000,000 / $1,000,000 = A return of $5 for every $1 invested
WVDO Advanced Skills Workshop – Benchmarking Fundraising Performance
Page 17
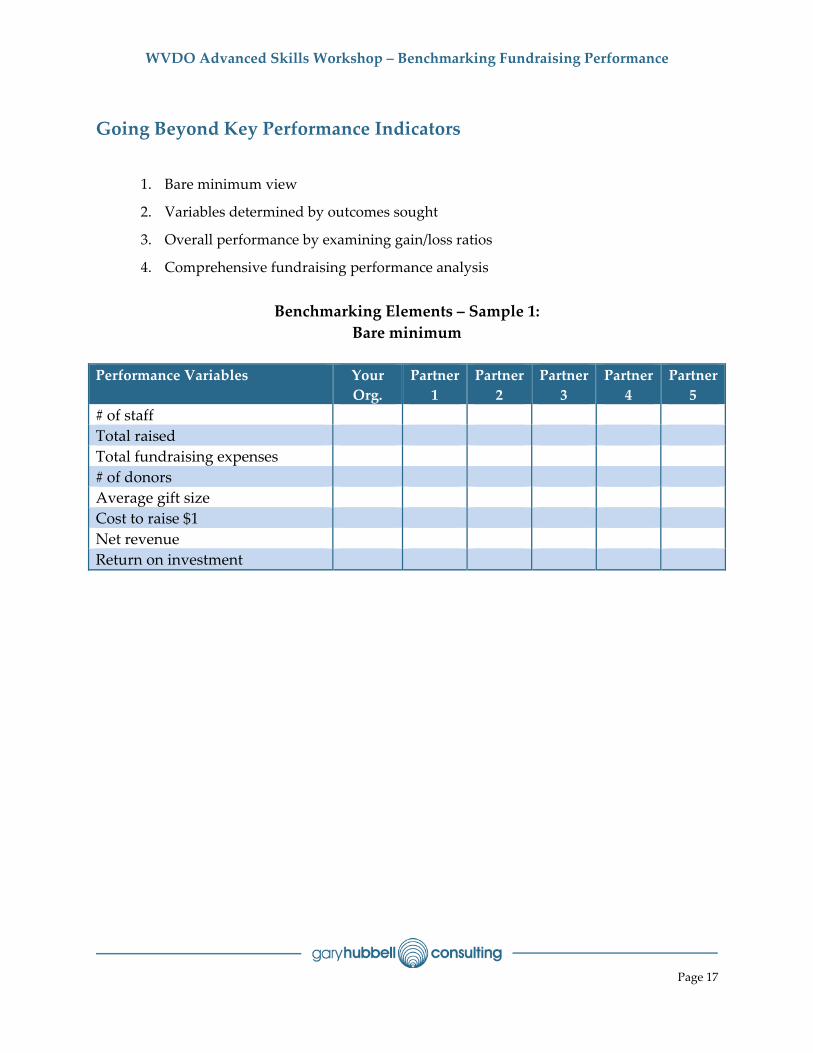
Going Beyond Key Performance Indicators
1. Bare minimum view
2. Variables determined by outcomes sought
3. Overall performance by examining gain/loss ratios
4. Comprehensive fundraising performance analysis
Benchmarking Elements – Sample 1: Bare minimum
Performance Variables Your
Org. Partner 1
Partner 2
Partner 3
Partner 4
Partner 5
# of staff Total raised Total fundraising expenses # of donors Average gift size Cost to raise $1 Net revenue Return on investment
WVDO Advanced Skills Workshop – Benchmarking Fundraising Performance
Page 18
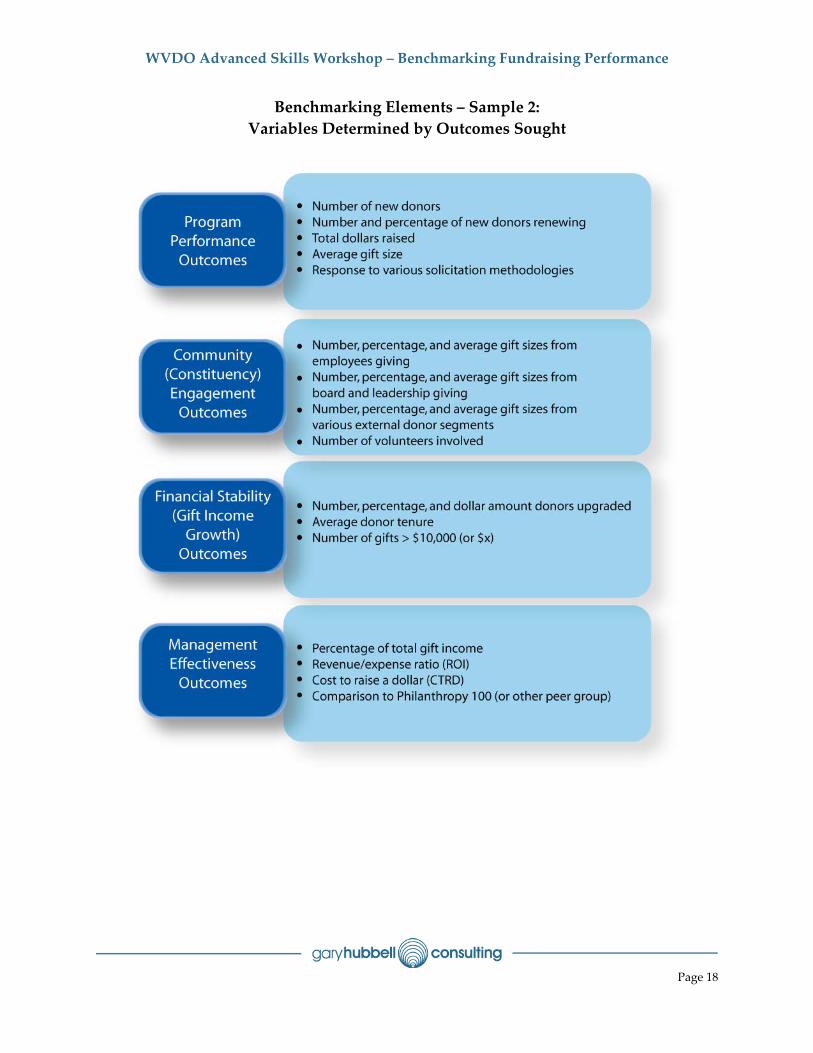
Benchmarking Elements – Sample 2: Variables Determined by Outcomes Sought
WVDO Advanced Skills Workshop – Benchmarking Fundraising Performance
Page 19
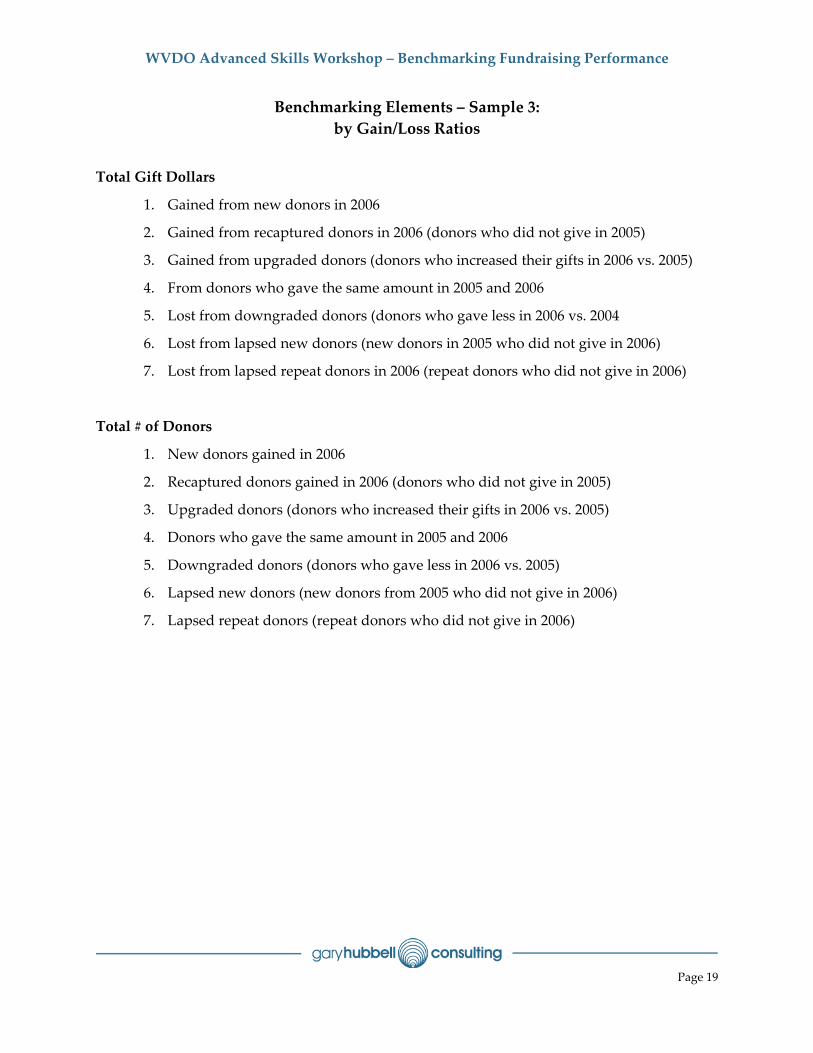
Benchmarking Elements – Sample 3: by Gain/Loss Ratios
Total Gift Dollars
1. Gained from new donors in 2006
2. Gained from recaptured donors in 2006 (donors who did not give in 2005)
3. Gained from upgraded donors (donors who increased their gifts in 2006 vs. 2005)
4. From donors who gave the same amount in 2005 and 2006
5. Lost from downgraded donors (donors who gave less in 2006 vs. 2004
6. Lost from lapsed new donors (new donors in 2005 who did not give in 2006)
7. Lost from lapsed repeat donors in 2006 (repeat donors who did not give in 2006)
Total # of Donors
1. New donors gained in 2006
2. Recaptured donors gained in 2006 (donors who did not give in 2005)
3. Upgraded donors (donors who increased their gifts in 2006 vs. 2005)
4. Donors who gave the same amount in 2005 and 2006
5. Downgraded donors (donors who gave less in 2006 vs. 2005)
6. Lapsed new donors (new donors from 2005 who did not give in 2006)
7. Lapsed repeat donors (repeat donors who did not give in 2006)
WVDO Advanced Skills Workshop – Benchmarking Fundraising Performance
Page 20
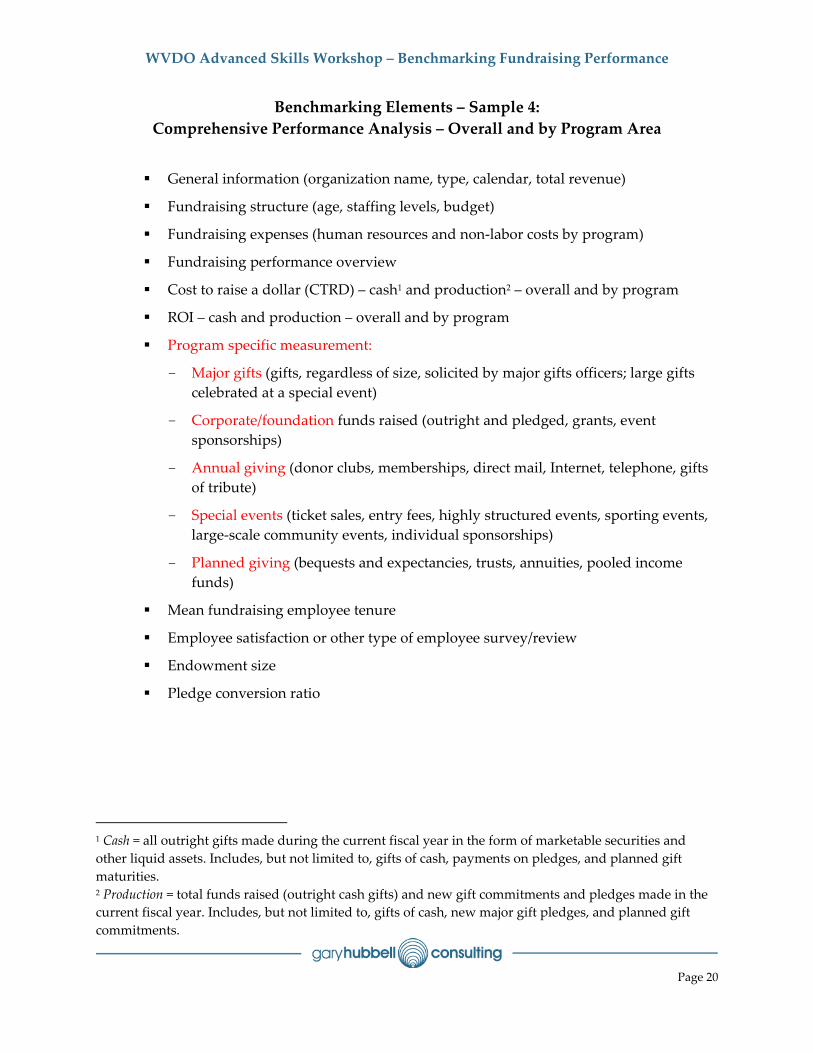
Benchmarking Elements – Sample 4: Comprehensive Performance Analysis – Overall and by Program Area
General information (organization name, type, calendar, total revenue)
Fundraising structure (age, staffing levels, budget)
Fundraising expenses (human resources and non‐labor costs by program)
Fundraising performance overview
Cost to raise a dollar (CTRD) – cash1 and production2 – overall and by program
ROI – cash and production – overall and by program
Program specific measurement:
- Major gifts (gifts, regardless of size, solicited by major gifts officers; large gifts celebrated at a special event)
- Corporate/foundation funds raised (outright and pledged, grants, event sponsorships)
- Annual giving (donor clubs, memberships, direct mail, Internet, telephone, gifts of tribute)
- Special events (ticket sales, entry fees, highly structured events, sporting events, large‐scale community events, individual sponsorships)
- Planned giving (bequests and expectancies, trusts, annuities, pooled income funds)
Mean fundraising employee tenure
Employee satisfaction or other type of employee survey/review
Endowment size
Pledge conversion ratio
1 Cash = all outright gifts made during the current fiscal year in the form of marketable securities and other liquid assets. Includes, but not limited to, gifts of cash, payments on pledges, and planned gift maturities. 2 Production = total funds raised (outright cash gifts) and new gift commitments and pledges made in the current fiscal year. Includes, but not limited to, gifts of cash, new major gift pledges, and planned gift commitments.
WVDO Advanced Skills Workshop – Benchmarking Fundraising Performance
Page 21
Selecting Benchmarking Partners
Value in selecting peers vs. participating in a “pool”
Select non‐competitors
Peers or aspirational partners
What to consider:
- Market characteristics
- Organizational characteristics
- Fundraising characteristics
Assure that you speak the same language—develop the glossary among all partners

WVDO Advanced Skills Workshop – Benchmarking Fundraising Performance
Page 22
Worksheet for Determining Partners/Peers
Your Org.
Partner 1
Partner 2
Partner 3
Partner 4
Partner 5
Organization name & location Contact person/information Partner: peer or aspirational Market Characteristics Market wealth Population density National vs. local appeal Community generosity Seasonal residents Market competition Organizational Characteristics Revenue comparability Service scope similarity Operating margin Religious sponsorship Fundraising Characteristics Age of continuous fundraising program Fundraising budget Culture of philanthropy Volunteer or staff‐driven Stand‐alone vs. system effort Overall “fit” rating for this partner (Good, Acceptable, Poor)
Ease of enlistment due to existing connection? (Good, Acceptable, Poor)
WVDO Advanced Skills Workshop – Benchmarking Fundraising Performance
Page 23
Common Input Expectations The shallower the look, the less time needed
For comprehensive performance benchmarking, expect 50–100 hours of development staff time
- Plan to involve (at varying times) the CDO, data administrator, lead program professionals, and CFO/treasurer
See sample internal time estimates (p. 11) for steps
What Might the Data Look Like?
Four samples for types of data reporting:
- AHP board monitor report sample
- Rehab facilities sample
- Education sample—annual giving performance
- FEP sample—gain/loss report
WVDO Advanced Skills Workshop – Benchmarking Fundraising Performance
Page 24
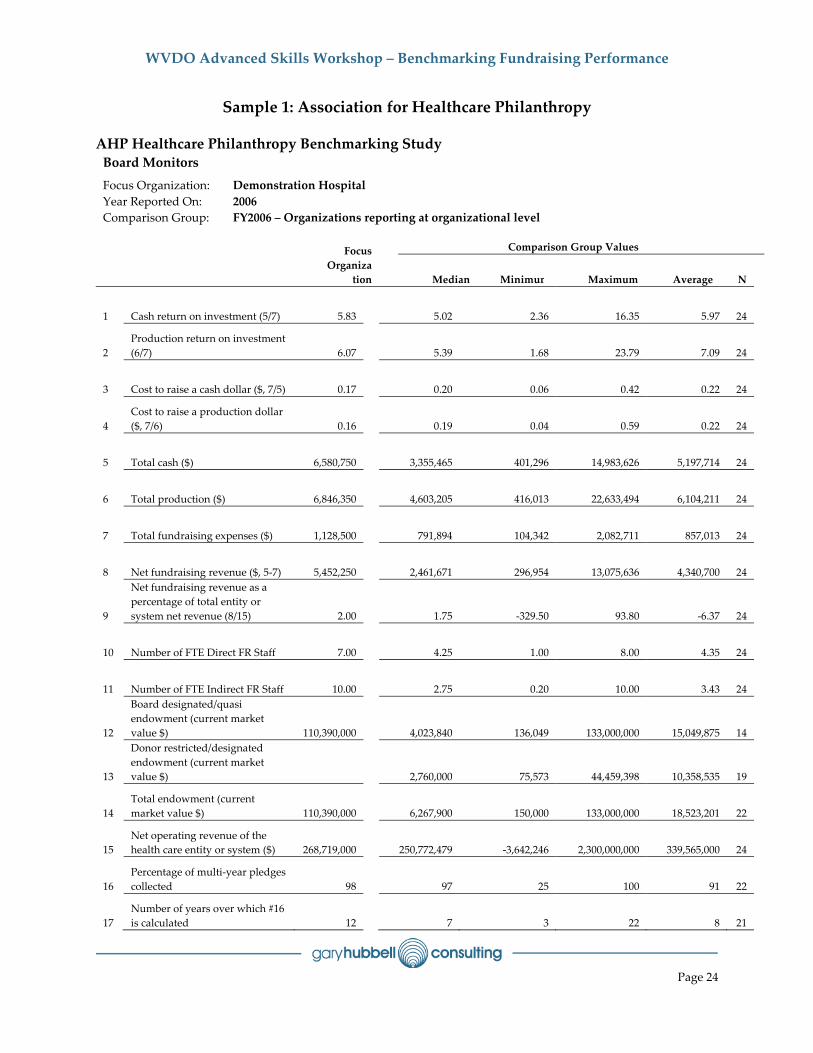
Sample 1: Association for Healthcare Philanthropy
AHP Healthcare Philanthropy Benchmarking Study Board Monitors
Focus Organization: Demonstration Hospital Year Reported On: 2006 Comparison Group: FY2006 – Organizations reporting at organizational level Focus
Organization
Comparison Group Values
Median Minimum Maximum Average N
1 Cash return on investment (5/7) 5.83 5.02 2.36 16.35 5.97 24
2 Production return on investment (6/7) 6.07 5.39 1.68 23.79 7.09 24
3 Cost to raise a cash dollar ($, 7/5) 0.17 0.20 0.06 0.42 0.22 24
4 Cost to raise a production dollar ($, 7/6) 0.16 0.19 0.04 0.59 0.22 24
5 Total cash ($) 6,580,750 3,355,465 401,296 14,983,626 5,197,714 24
6 Total production ($) 6,846,350 4,603,205 416,013 22,633,494 6,104,211 24
7 Total fundraising expenses ($) 1,128,500 791,894 104,342 2,082,711 857,013 24
8 Net fundraising revenue ($, 5‐7) 5,452,250 2,461,671 296,954 13,075,636 4,340,700 24
9
Net fundraising revenue as a percentage of total entity or system net revenue (8/15) 2.00 1.75 ‐329.50 93.80 ‐6.37 24
10 Number of FTE Direct FR Staff 7.00 4.25 1.00 8.00 4.35 24
11 Number of FTE Indirect FR Staff 10.00 2.75 0.20 10.00 3.43 24
12
Board designated/quasi endowment (current market value $) 110,390,000 4,023,840 136,049 133,000,000 15,049,875 14
13
Donor restricted/designated endowment (current market value $) 2,760,000 75,573 44,459,398 10,358,535 19
14 Total endowment (current market value $) 110,390,000 6,267,900 150,000 133,000,000 18,523,201 22
15 Net operating revenue of the health care entity or system ($) 268,719,000 250,772,479 ‐3,642,246 2,300,000,000 339,565,000 24
16 Percentage of multi‐year pledges collected 98 97 25 100 91 22
17 Number of years over which #16 is calculated 12 7 3 22 8 21

WVDO Advanced Skills Workshop – Benchmarking Fundraising Performance
Page 25
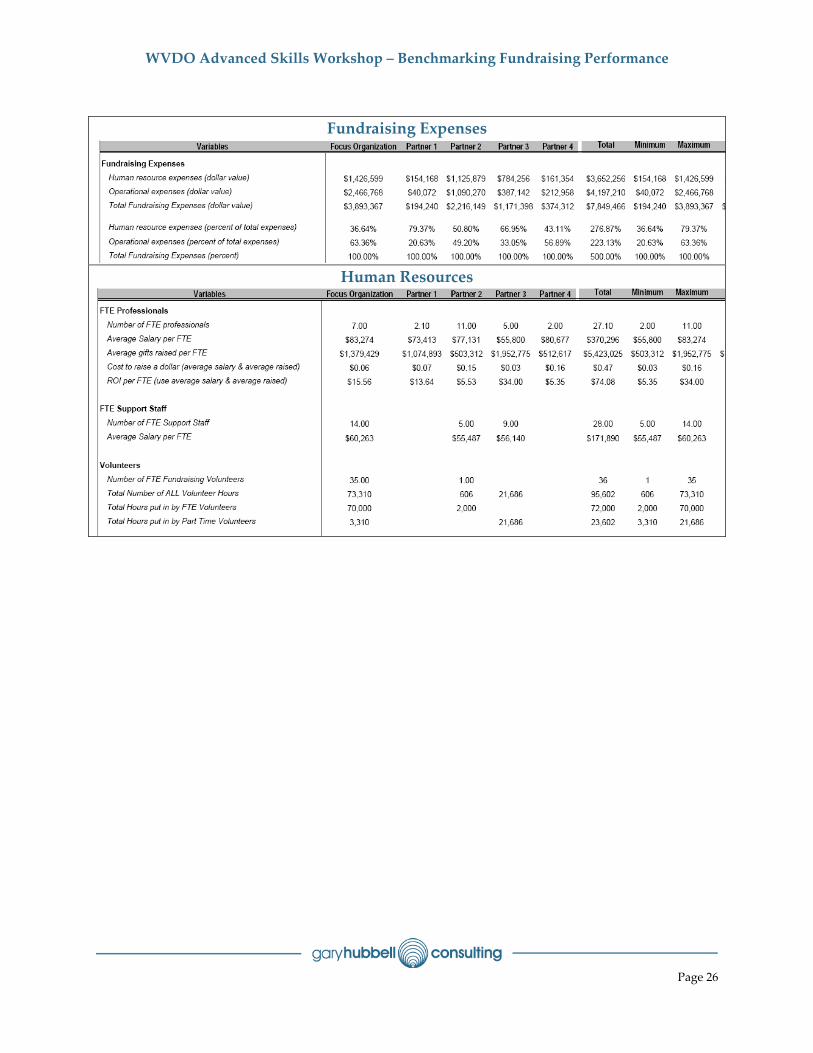
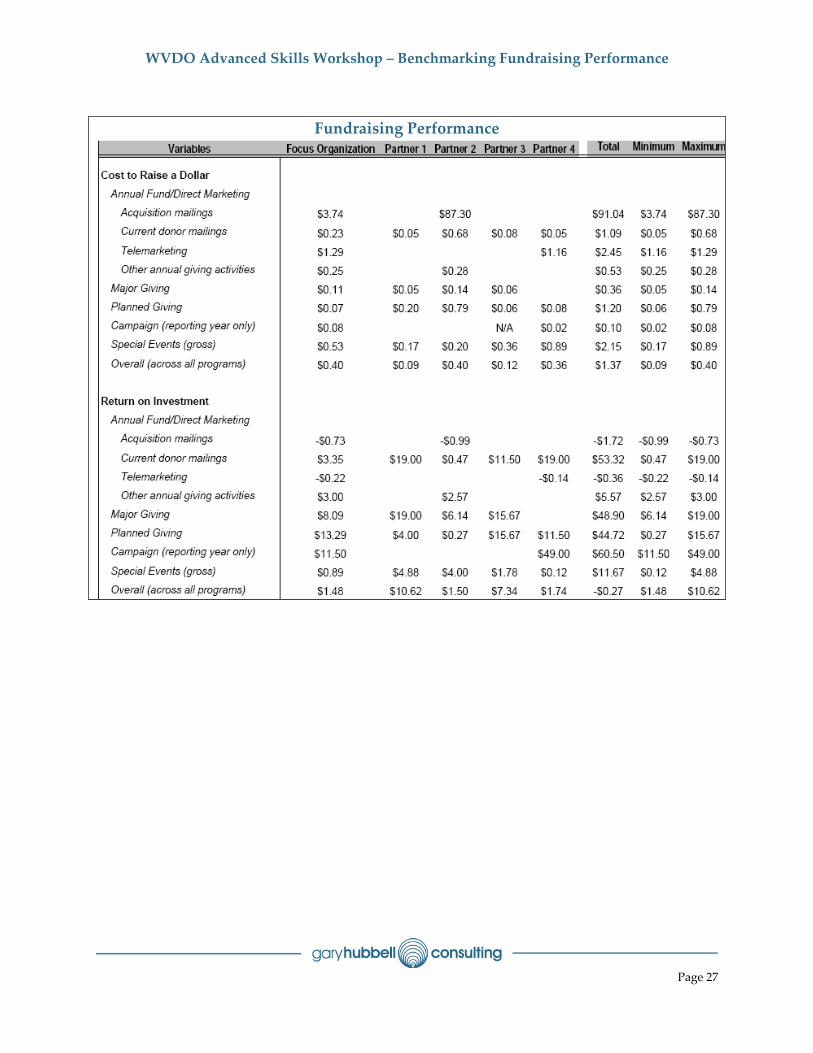
Sample 2: Rehab Facilities (partial report)
Fundraising Revenue
WVDO Advanced Skills Workshop – Benchmarking Fundraising Performance
Page 26
Fundraising Expenses
Human Resources
WVDO Advanced Skills Workshop – Benchmarking Fundraising Performance
Page 27
Fundraising Performance
WVDO Advanced Skills Workshop – Benchmarking Fundraising Performance
Page 28
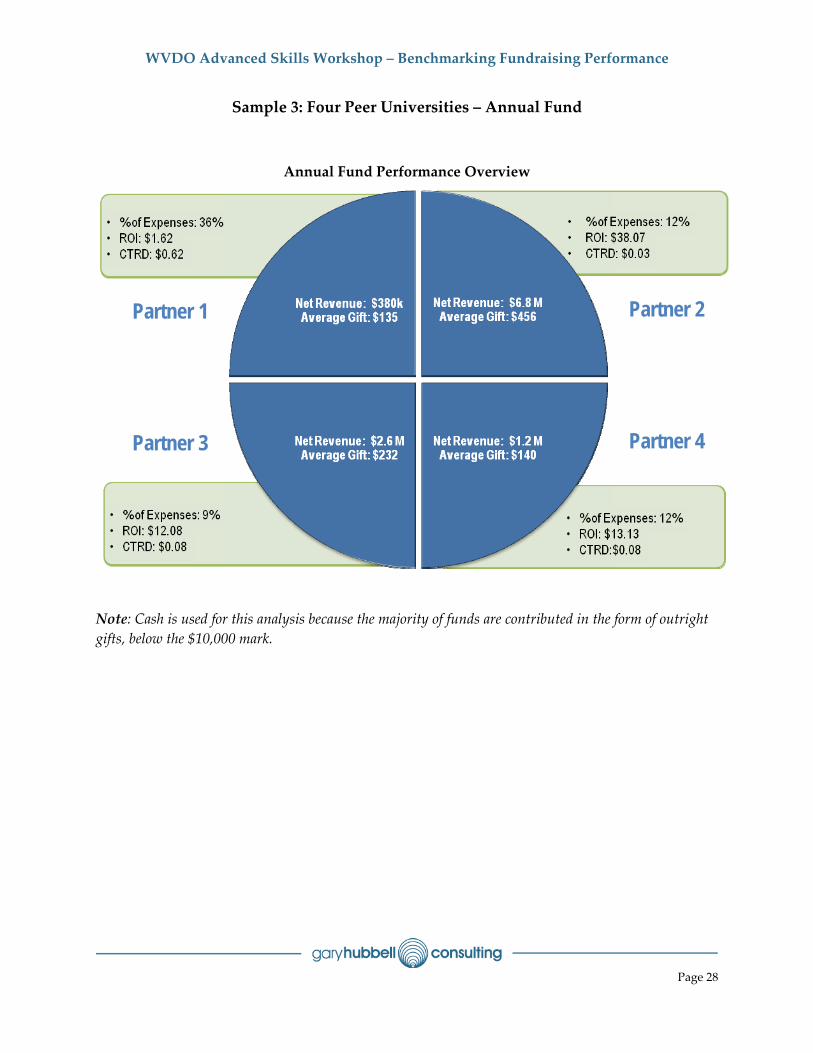
Sample 3: Four Peer Universities – Annual Fund
Annual Fund Performance Overview
Note: Cash is used for this analysis because the majority of funds are contributed in the form of outright gifts, below the $10,000 mark.
Partner 1
Partner 3
Partner 2
Partner 4
WVDO Advanced Skills Workshop – Benchmarking Fundraising Performance
Page 29
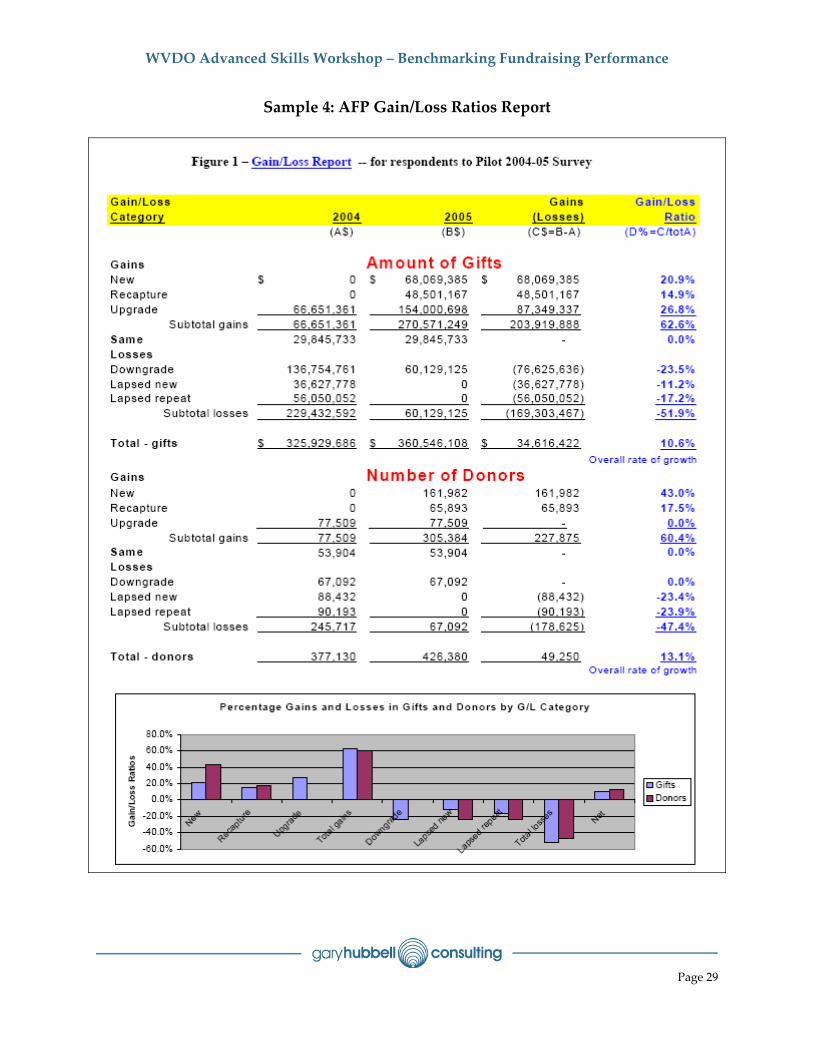
Sample 4: AFP Gain/Loss Ratios Report

WVDO Advanced Skills Workshop – Benchmarking Fundraising Performance
Page 30
WVDO Advanced Skills Workshop – Benchmarking Fundraising Performance
Page 31
Section Three:
Lessons from Benchmarking: Applying Results for Impact

WVDO Advanced Skills Workshop – Benchmarking Fundraising Performance
Page 32
WVDO Advanced Skills Workshop – Benchmarking Fundraising Performance
Page 33
Common Concerns You’ll Encounter and How to Handle Them “We don’t have time—we’re too busy raising money.”
“We can’t afford it.”
“We’re too small to adopt ‘best practices.’”
“We do things differently than everyone else.”
“Isn’t this just a way to tighten oversight on the staff?”
“Maybe I’m not doing as well as I think I’m doing!”
Reality Therapy If you haven’t been already, you will be asked questions by your CEO, board, and
donors —get ready
Additional resources depend on your ability to make an effective case
You can’t make good decisions without real data
You have an obligation to the donors and to your program participants to be as effective as possible
Watchdog groups often monitor only a piece of the puzzle (often the wrong piece).
Completing a comprehensive benchmarking project is akin to the 5 stages of grief:
1) Denial and isolation
2) Anger
3) Bargaining
4) Depression
5) Acceptance

WVDO Advanced Skills Workshop – Benchmarking Fundraising Performance
Page 34
Conventional Rating Agencies Don’t Account for Impact3
Organization GuideStar Rating
America’s Second Harvest
Center on Budget and Policy Priorities
City Year
Environmental Defense
Exploratorium
Habitat for Humanity
The Heritage Foundation
National Council of La Raza
Share Our Strength
Teach for America
YouthBuild USA
Note: Self‐Help is not rated
Interestingly, the authors, clearly focused on impact, make the following observations:
“The problem with using these metrics is that they fall into the trap of measuring financial inputs or ratios as a proxy for success, rather than measuring impact, or the amount of change accomplished with that investment.4 Worse yet, they assume that nonprofits can implement programs without any infrastructure or support. They may encourage donors to support groups that spend too little on people, IT systems, or management, which can lead to weak organizations at best, or accounting trickery at worst” (p. 203).
3 Crutchfield, L.R., and Grant H. McLeod (2008). Forces for good: The six practices of high‐impact nonprofits. Jossey‐Bass: San Francisco. The authors found 12 nonprofit organizations among their study participants to have the highest impact. Yet, they also found most of these organizations were rated less favorably by GuideStar. See page 203. 4 Also see S Lowell, B. Trelstad, and B. Meehan (2005). “The ratings game: Evaluating the three groups that rate the charities.” Stanford Social Innovation Review, Summer, pp. 39‐45.
WVDO Advanced Skills Workshop – Benchmarking Fundraising Performance
Page 35
What Do I Do After I Gather the Data? How Should I Interpret It? Key questions to ask yourself once the data is analyzed and digested:
1. What does this report lead me to conclude about my development program and
its predictable future? a. Do we compare favorably to our peers? Why? Why not? b. By continuing the current approach, will our program meet institutional needs
in the future?
2. How does my program’s performance compare to the high performers? a. Who are the high performers to which I’ll compare our program? b. What are they doing differently that we should consider? c. Are they willing to talk with me in real time and exchange ideas?
3. Given this data, what one change can I make in my program mix that would likely have the greatest impact on gift income over the next three years? a. Should we be doing more with one program area (e.g., major gifts)? b. Should we do less of something (e.g., reduce # of events by 1)? c. What analysis of our program supports this type of change?
4. In what ways will my program benefit by inviting our CFO to track and report our fundraising benchmarks along with other operating dashboards used in our organization? What education will be needed for the CFO, CEO, board, and development staff in order to flourish with this kind of data transparency? a. How are other organizational operating dashboards being tracked and
reported? By whom? b. What summary data will I report as part of the organizational dashboards and
what other data might I want to view for fundraising program management and our board committee or foundation?
c. What would my CFO need from me, and when, in order to integrate fundraising dashboards into existing reports?
d. Do the CFO, CEO, and I agree on the interpretation of the fundraising dashboards?
WVDO Advanced Skills Workshop – Benchmarking Fundraising Performance
Page 36
5. Would a thorough understanding of this data lead my CEO to think differently about the role of philanthropy in our organization? How would the data on the high performers’ emphasis on government grants, sustained major giving initiatives, and campaigns affect when and how the foundation/fundraising department is engaged in our strategic planning discussions? a. What behavior is behind the data on high performers? b. How do the high performers describe the involvement of the CEO and board(s)
in the fundraising process? How do those descriptions compare to my situation?
c. How do the high performers describe their cultures of philanthropy and are there lessons that could be applied in our case?
6. Have we become so dependent on annual gift income that the resulting activities seemingly prevent us from emphasizing programs with demonstrated higher returns? a. What do we seem to talk most often about, what do we value, and what do we
reward? b. Are we driven to get incremental growth from our programs year after year, or
have we asked what it would take to see exponential growth in philanthropy?
7. Based on this data, if I could invest $X in our development program, where would that investment produce the greatest sustainable return? Alternatively, if I were asked to reduce expenses by $X, where would that reduction cause us to rethink our longstanding program mix? a. Do I know the ROI for each element of my program (annual giving, major gifts,
planned gifts, events, etc.)? b. What if we stopped some aspects of our current program and redeployed the
saved resources into an area with higher return? What results would that have?
8. In what ways should I use this data when planning for our next campaign? a. If we anticipate a major gifts focus in the next campaign, what conclusions can
I draw now about our readiness based on this data? b. How do our benchmarking peers compare in campaign performance?
9. Is my behavior (and my calendar) a reflection of my program priorities? If not, what is the most important action I should take today? a. I tell people what’s most important to do in raising money. If they watch my
behavior (rather than my words), would they know I’m pursuing the priorities?
b. What changes in my calendar would help me be more focused on priority work?
WVDO Advanced Skills Workshop – Benchmarking Fundraising Performance
Page 37
What Others Are Finding From Benchmarking Focus shifts from overall net returns to increasing net donor revenue by minimizing
the number of lost and downgraded donors. (FEP)
Data show that the most successful programs have adequate resources, staff, and greater emphasis devoted to identifying, cultivating, and securing major gifts from all sources (e.g., individuals, corporations, foundations). (AHP)
Professional fundraising staffing, compensation levels, and retention are directly related to fundraising program effectiveness in many cases. (AHP)
Uncontrollable contextual factors such as geography, demographics, and size/structure of the health care facility simply do not impact overall returns to the extent that many previously believed. While the items such as bed size can reduce fundraising effectiveness by increasing the costs associated with fundraising, they are not meaningful barriers that overshadow controllable, management‐related strategies. (AHP)
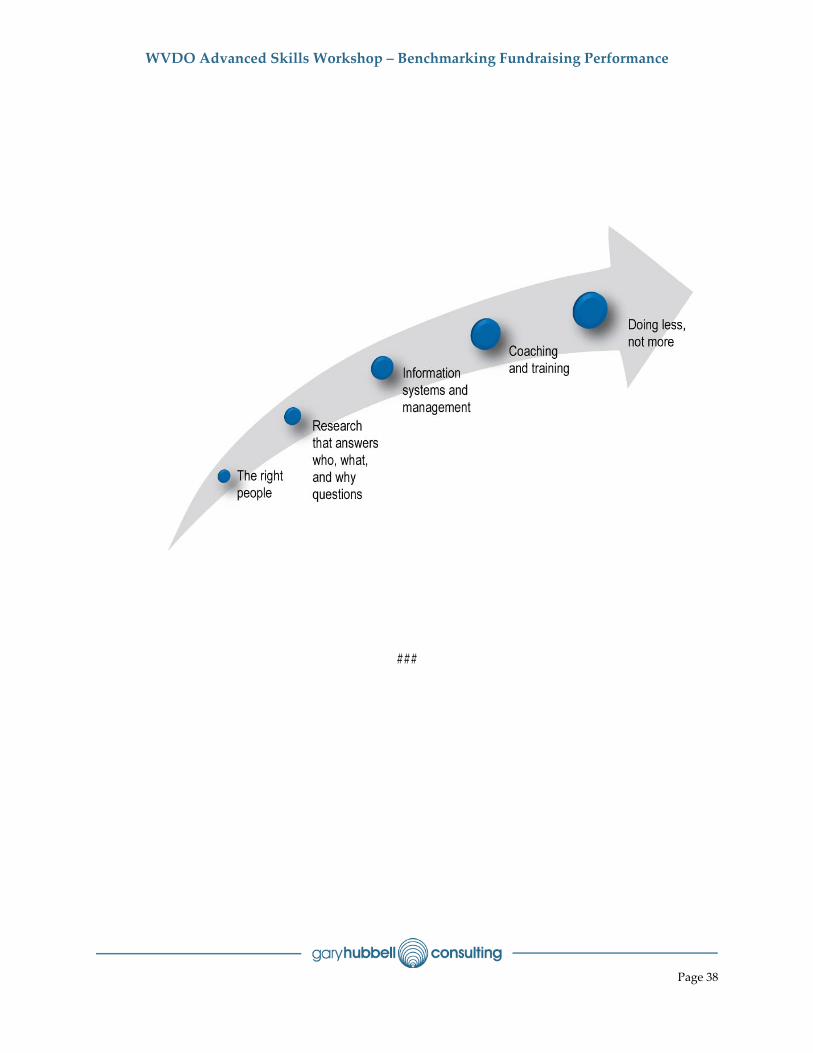
Five Recommendations for Fast‐Forwarding the Maturity of Your Fundraising Operation5
Lessons from benchmarking have led us to conclude that investments made in five areas of endeavor will accelerate the maturity of your development program. If you are committed to benchmarking and recognize the need to leverage its teachings, you will need to consider appropriate resources. Greatest returns will come from investments in:
1. Getting the right people on board.
2. Research to identify who, what, and why questions.
3. Harvesting and managing information.
4. Coaching up and down.
5. Doing less, not more.
5 Hubbell, G. J., and M. K. Reinders (2007). Lessons from Benchmarking: Fast‐Forwarding the Maturity of Your Fundraising Operation.
WVDO Advanced Skills Workshop – Benchmarking Fundraising Performance
Page 38
###
Gary Hubbell Consulting works with organizations that are on the cusp of doing great things—retooling business income and philanthropy strategies; engaging board members and community in unprecedented ways; raising more money than ever before. Clients
contact us seeking help to develop strategies that foster organizational agility, setting a plan in place around which commitment runs deep, and determining how to generate
philanthropy and other resources to fuel the resource engines of the future.