benchmarking of deep learning algorithms for skin cancer
TRANSCRIPT
Turk J Elec Eng & Comp Sci(2021) 29: 2634 – 2648© TÜBİTAKdoi:10.3906/elk-2103-65
Turkish Journal of Electrical Engineering & Computer Sciences
http :// journa l s . tub i tak .gov . t r/e lektr ik/
Research Article
Benchmarking of deep learning algorithms for skin cancer detection based on ahybrid framework of entropy and VIKOR techniques
Baidaa AL-BANDER1,∗, Qahtan M. YAS1, Hussain MAHDI1, Rwayda KH. S.AL-HAMD2
1Department of Computer Engineering, Faculty of Engineering, University of Diyala, Diyala, Iraq2School of Applied Sciences, Abertay University, Dundee, UK
Received: 12.03.2021 • Accepted/Published Online: 06.08.2021 • Final Version: 04.10.2021
Abstract: Skin cancer is one of the most common cancers worldwide caused by excessive development of skin cells.Considering the rapid growth of the use of deep learning algorithms for skin cancer detection, selecting the optimalalgorithm has become crucial to determining the efficiency of computer-aided diagnosis (CAD) systems developed for thehealthcare sector. However, a sufficient number of criteria and parameters must be considered when selecting an ideal deeplearning algorithm. A generally accepted method for benchmarking deep learning models for skin cancer classification isunavailable in the current literature. This paper presents a multi-criteria decision-making framework for evaluating andbenchmarking deep learning models for skin cancer detection based on hybridisation of entropy and VIseKriterijumskaOptimizacija I Kompromisno Resenje (VIKOR) methods. Twelve well-known convolution networks are evaluated andtested on eleven publicly available image datasets to achieve the target of the study. Several criteria related to deepconvolutional neural networks (CNNs) architectures, including optimisation technique, transfer learning, class balancing,transfer learning, data augmentation, and network complexity, have been considered in the multi-criteria evaluation. Thedecision matrix (DM) is designed based on a crossover of the five evaluation criteria and twelve (CNNs) classificationmodels on different datasets. Subsequently, in the benchmarking and ranking of deep learning classification models,multi-criteria decision making (MCDM) techniques are used. The MCDM uses a scheme that involves the integration ofentropy with VIKOR approaches. For the weight calculations of evaluation criteria, entropy is applied, while VIKORis used to benchmark and rank the models. The obtained results reveal that the InceptionResNetV2 model gained thefirst rank and is selected as the optimal architecture for skin cancer detection considering the five criteria investigatedin our study. The presented framework achieves a significant performance in selecting the best algorithm, which couldprovide substantial guidance to the researcher working in the field.
Key words: Skin cancer, deep convolutional neural networks, benchmarking
1. IntroductionCancer is an irregular and uncontrolled growth of dividing cell that damages various body cells and leads tothe second major cause of death in the world [1]. In 2040, 466,914 new cases of skin cancer (54.27% males and45.73% females) are expected to be diagnosed, according to the World Health Organisation, and 105904 (58.14% males and 41.86% females) are predicted to die. The five-year survival rate of malignant melanoma tumour,the deadliest type of skin cancer, is as high as 99.0%, but delayed diagnosis dramatically contributes to a 23.0%drop in survival rate. Reliable early detection, however, is vital as the five-year survival rate would increase by∗Correspondence: [email protected]
This work is licensed under a Creative Commons Attribution 4.0 International License.2634

AL-BANDER et al./Turk J Elec Eng & Comp Sci
approximately 90.0% 1. In general, dermatologists investigate images by naked-eye visual inspection, involvinga high degree of skill and concentration. Dermatologists’ manual review is also very tedious, time-consuming,subjective, and error-prone. In the US, South Australia, and Europe, the ratio of dermatologists per 1.0 millionpopulation is 34.0, 26.0, and 59.34, respectively, which are very few compared to the needed numbers 23 [2].However, automated computer-aided diagnosis (CAD) systems have become widespread among dermatologiststo overcome the limitations mentioned above, reduce dermatologists’ workload, and enable rapid diagnosticrates. Deep learning (DL) has recently gained considerable popularity as one of the artificial intelligencetechniques that achieved a crucial role in developing accurate and precise CAD systems due to its reliability andrapid progress. In deep learning field, convolutional neural network (CNN) is among the most popular algorithmused for medical image analysis [3]. By developing various CNN architectures, choosing the architecture thatyields a reliable and error-free solution is challenging. There is no single deep learning classification algorithmthat is superior for skin cancer diagnosis. Selecting the best DL model has posed a significant demand fordecision-makers, who develop CAD systems for medical centres, in identifying and evaluating various DLclassifiers for skin cancer diagnosis. When several DL classifiers and multiple criteria are present, the taskbecomes more complicated. Thus, benchmarking the deep learning models under various criteria is crucial.
In the literature [4], extensive efforts conducted by researchers have shown an expert-level performanceof CNN in the identification of skin cancer, particularly in malignant melanoma detection [5–11]. However, adeep convolutional neural network’s performance is widely dependent on the quality of the data used to trainit, the architecture of the network, and many other criteria. Accordingly, this study is designed to evaluateand benchmark the performance of the deep convolutional neural networks trained using images collected frommultiple datasets and captured under different conditions for skin cancer detection. In this context, our studyexploits decision-making methods to systematically prioritise the deep convolutional neural network models byconsidering multiple criteria. This could provide an assistance tool and inspire the researchers to choose themost appropriate network architecture targeting to developing robust CAD systems.
Multi-criteria decision-making methods (MCDM) are among the most critical human activities in indus-try, manufacturing, product selection, etc., as it is prevalent for the various attributes (criteria) to play animportant role in selecting the best alternatives among the existing ones. Optimisation of multi-criteria is theway of assessing the best feasible solution according to the set of predefined criteria. Practical problems arealso defined by many competing and conflicting criteria, and all criteria can not be satisfied simultaneously bya single solution. Thus, the solution is a compromise solution according to the desires of the decision-maker.For a problem with conflicting criteria, the compromise solution was developed by Zeleny [12], which can helpdecision-makers find a final solution. The compromise solution is a viable solution that is the nearest to theideal. Based on multi-criteria perspectives, the benchmarking for the selection of the best deep learning algo-rithms for automated skin cancer diagnosis considering multiple criteria and datasets is a challenging task dueto (i) multiple assessment criteria, (ii) significance of criteria, (iii) variation of datasets, (iv) conflict amongcriteria, and (v) trade-off among criteria.
In light of the above, this study attempts to contribute to the literature by proposing a hybrid entropy and
1WHO (2021). Skin Cancer Prevention and Information Sites [online]. Website https://www.who.int/uv/resources/link/cancerlinks/en/ [accessed 15 January 2021].
2D Schmid (2017). Number of Dermatologists in Selected European Countries in 2015 [online]. Website https://www.statista.com/statistics/873707/number-from-dermatologists-in-europe/ [accessed 01 February 2021].
3Department of Health (Commonwealth of Australia) (2016). Dermatology, 2016 Fact Sheet [online]. Website https://hwd.health.gov.au/webapi/customer/documents/factsheets/2016/Dermatology.pdf [accessed 01 February 2021].
2635

AL-BANDER et al./Turk J Elec Eng & Comp Sci
VIKOR (VIseKriterijumska Optimizacija I Kompromisno Resenje) methodology for the prioritisation of twelvedeep learning models used for skin cancer diagnosis. The entropy approach objectively indicates the importanceof five criteria by assigning a certain weight for each criterion. Further, the multiple criteria optimisationcompromise solution (VIKOR) method [13] is employed to rank deep learning models. The key contributionsand novelty of this work can be described as follows:
• This is the first attempt to develop benchmarking approach for deep learning algorithms used for skincancer detection. This has been achieved using decision-making methods.
• This study compares and assesses the performance of twelve models trained on eleven datasets. Thisextensive study would help to evaluate and assess the suitability of a particular CNN model consideringpredefined criteria.
• Our study takes into consideration the most important criteria that have a substantial effect on theperformance of the deep learning models. Those criteria were checked and verified by using dermoscopicand non-dermoscopic image data.
• Our framework integrates Shannon’s entropy with the MCDM approach (VIKOR) for ranking the modelsand selecting the optimal deep learning model for skin cancer detection. The leveraging of the MCDMmethods with DL models could help rank the CNN architectures according to their suitability, based onthe trade-off among the conflicts criteria, and subsequently, selecting the optimal network architecture fora specific task.
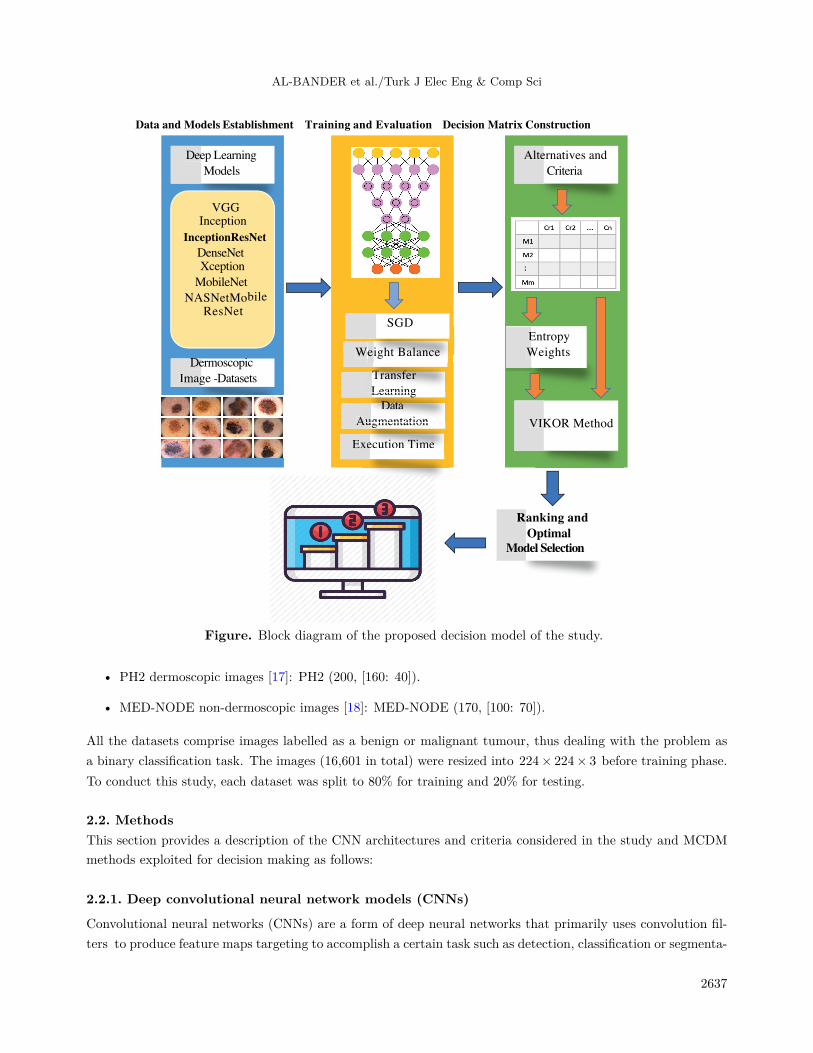
2. Materials and methodsThe block diagram of the proposed integrated decision-making framework is illustrated in Figure. All thenetworks named in the yellow box (including different versions of the CNN architectures) have been trainedon eleven datasets. The CNNs’ performance was evaluated and compared in terms of five criteria: SGD,weight balance, transfer learning, data augmentation, and execution time. In the first phase of the frameworkdescribed in Figure, the deep convolutional neural networks and the datasets are established and implemented.In the second phase, the networks are trained, and the key criteria are identified and measured. In the thirdphase, MCDM methods are employed to prioritise the alternatives (i.e., deep learning models). In the followingsub-sections, a thorough elaboration of each module of the proposed decision model is given.
2.1. MaterialsEleven public datasets are used to train and validate deep learning models. The description of datasetsis presented below in the format: the name of the dataset (number of images, class distribution [benign:malignant]).
• MSK dermoscopic images [14]: MSK1 (1088, [787: 301]), MSK2 (1522, [1168: 354]), MSK3 (225, [206:19]), and MSK4 (943, [727: 216]).
• UDA dermoscopic images [15]: UDA1 (557, [398: 159]) and UDA2 (60, [23: 37]).
• ISBI dermoscopic images [14, 15]: ISBI1 (1273, [1023: 250]) and ISBI2 (2745, [2223: 522]).
• HAM10000 dermoscopic images [16]: HAM10000 (7818, [6705: 1113]).
2636
AL-BANDER et al./Turk J Elec Eng & Comp Sci
Data and Models Establishment Training and Evaluation Decision Matrix Construction
Deep Learning
Models
Deep
Entropy
Weights
E
WeightDermoscopic
Image -Datasets
Dermoscopic
Imag
Execution TimeEx
VGGInception
InceptionResNet
DenseNetXception
MobileNet
NASNetMobile
ResNet
ecution Timexec
Data
AugmentationAu
DataData
ugmentationAu
Transfer
LearningLearnin
TTransfsfesfsf r
LearningLe
Weight BalanceWeight BalancWeight BalanceWeig
SGD
Ranking and
Optimal
Model Selection
Ranking
Model Selecti
VIKOR MethodVIKO
Alternatives and
Criteria
Alternatives
Figure. Block diagram of the proposed decision model of the study.
• PH2 dermoscopic images [17]: PH2 (200, [160: 40]).
• MED-NODE non-dermoscopic images [18]: MED-NODE (170, [100: 70]).
All the datasets comprise images labelled as a benign or malignant tumour, thus dealing with the problem asa binary classification task. The images (16,601 in total) were resized into 224× 224× 3 before training phase.To conduct this study, each dataset was split to 80% for training and 20% for testing.
2.2. MethodsThis section provides a description of the CNN architectures and criteria considered in the study and MCDMmethods exploited for decision making as follows:
2.2.1. Deep convolutional neural network models (CNNs)
Convolutional neural networks (CNNs) are a form of deep neural networks that primarily uses convolution fil-ters to produce feature maps targeting to accomplish a certain task such as detection, classification or segmenta-
2637

AL-BANDER et al./Turk J Elec Eng & Comp Sci
tion. With graphical user interface (GPUs’) advancement, there have been numerous convolutional architecturessince Yann LeCun’s LeNet-5 [19], and more recently, with the first deep neural network implemented in the mostsuccessful object recognition competition (ImageNet large scale visual recognition competition (ILSVRC)); theAlexNet network [20]. Every year, new architectures emerge, outperforming the previous one and improvingperformance. In our study, twelve CNN architectures are targeted including VGG16,19 [21], InceptionV3 [22],InceptionV4 and InceptionResNetV2 [23], ResNet50 [24], DenseNet121,169,201 [25], Xception [26], MobileNet[27], and NASNetMobile [28].
2.2.2. CNNs criteriaSeveral criteria are considered in the benchmarking process in our study. Each criterion has a specific priorityand is used for a particular purpose to achieve a specific goal. The presence of a trade-off among the evaluationcriteria in various DL models results from the variation in the significance of each criterion. In the evaluationprocess, it is possible to achieve a reasonable balance between a criterion’s low importance priority and anothercriterion’s high importance priority. In the current work, we investigate five parameters that highly affect in theperformance of the CNN models, which are the optimisation algorithm [29], cost-sensitive class weighting [30],transfer learning scheme [31], data augmentation strategy [32], and network complexity-computational time[33].
2.2.3. Multi-criteria decision making (MCDM)
In this section, a description of MDCM methods used in the decision-making process is presented as follows.Entropy: When calculating the weights of parameters, the entropy weighting approach considers uncertainty. Asharp distribution is, thus, less unpredictable than a large distribution. This method mathematically interpretsthe relative intensities of the criterion significance based on data discrimination to analyse relative weights [34].The constructed decision matrix of MDCM DM is defined by m alternatives (twelve deep learning models)and n criteria (five criteria) intercrossing the ith alternative to the jth criteria as follows:
DM = [xij ]m×n (1)
From the decision matrix DM , the following steps are followed to measure the weights using entropy weightingmethods:Step1: Normalising the decision matrix using the following equation:
pij =xij∑mi=1 xij
, (1 ≤ i ≤ m, 1 ≤ j ≤ n) (2)
Step2: Measuring the entropy value for each criterion as follows:
ej = −k
n∑i=1
pij ln pij , (k = 1/ lnm, 1 ≤ j ≤ n)
.
(3)
Step3: Determining the inherent contrast intensity of each criterion as follows:
di = 1− ej , (1 ≤ j ≤ n) (4)
2638

AL-BANDER et al./Turk J Elec Eng & Comp Sci
Step4: The entropy weights of criteria are then defined as follows:
wj = dj/
n∑j=1
dj , (1 ≤ j ≤ n) (5)
VIKOR: The VIKOR method was introduced to optimise complex systems using multiple parameters. Itgenerates a compromise ranking list and a compromise solution using the provided weights. In the presenceof conflicting parameters, this approach focuses on rating and choosing from a collection of alternatives. Itestablishes a multi-criteria rating index based on a specific measure of ”closeness” to the ”ideal” solution [13].Thus, the following procedure is followed to establish the compromise ranking algorithm of the VIKOR method:Step1: Determining the best value as xj
∗ and the worst value as xj− of the criteria as j = 1, 2, ..., n . This
also leads to configure the criteria as beneficial and non-beneficial values. The beneficial attributes require tobe maximised while the non-beneficial need to be minimised, which are identified as follows:Rule1: Best value for beneficial criteria is xj
∗ = maxxij , and for non-beneficial is xj∗ = minxij ,
Rule2: Worst value for beneficial criteria is xj− = minxij , and for non-beneficial is xj
− = maxxij .Step2: Determining the values of Si and Ri , where i = 1, 2, ...,m using the following equations:
Si =
n∑j=1
wj
(x∗j − xij
)/(x∗j − x−
j
),
Ri = maxj
wj
(x∗j − xij
)/(x∗j − x−
j
),
(6)
where wj are the weights of criteria computed using entropy method.Step3: Determining the values of S∗ and R∗ as follows:
S∗ = mini
Si, R∗ = min
iRi,
S− = maxi
Si, R− = max
iRi
(7)
Step4: Determining the values of Qi ; where i = 1, 2, ,m and v is defined as weight of the scheme of “themajority of criteria” using the following equation:
Qi = v (Si − S∗) /(S− − S∗)+ (1− v) (Ri −R∗) /
(R− −R∗) (8)
Step5: Ranking the alternatives by sorting the values of Qi in ascending order.Step6: Proposing alternative M
′ as a compromise solution, which is ranked best by the measure Q (Minimum)if the following conditions are fulfilled:Condition1: ”Acceptable advantage”, Q(M
′′) − Q(M
′) ≥ DQ , where M
′′ is the alternative assigned thesecond position in the ranking list Q , DQ = 1/ (m− 1) and m is the number of alternatives.Condition2: ”Acceptable stability in decision making”, this condition requires that the best alternative M
′
must also be the best ranked by S or/and R ranking lists. If one of these two conditions is not fulfilled, anumber of compromise solutions are suggested.
2639

AL-BANDER et al./Turk J Elec Eng & Comp Sci
3. Results and discussionThis section summarises the experiments performed to determine the efficacy of CNN models in skin cancerdiagnosis. We conducted the experiments by harnessing twelve CNN architectures on eleven datasets (describedin the previous section). The models used for training and evaluation are two versions of VGG (16 and 19), twoversion of inception (3 and 4), InceptionResNet2, ResNet50, three versions of DenseNet (121, 169, and 201),Xception, MobileNet, and NASNetMobile. This selection was made with the aim of evaluating a diverse set ofCNN models with various architectures, depths, and complexities [11]. Xavier method [35] is used to initiatethe weights of the CNNs’ architecture. The networks are learned for 150 epochs with a mini-batch size of 8.
To study the impact of the variety of parameters and settings on deep learning models’ performance,this work considers five different criteria. Firstly, all these deep learning models (CNNs) are trained using alearning rate of 0.01, and a binary-cross entropy loss function minimises the error with SGD as an optimisationalgorithm. Secondly, to mitigate the effect of the data imbalance issue, as the majority of samples are benign,wights of classes are balanced by assigning a higher penalty for minatory classes in the cost function. Third,to explore the effect of the transfer of feature representation, pre-trained models trained on ImageNet [20] areutilised for further training and fine-tuning the weights using skin cancer data. Fourth, to increase the sizeof data artificially, aiming to tackle the data imbalance and subsequently increase generalisation performance,data augmentation is applied. The data is augmented by flipping (vertically and horizontally) each minor classin the training data until the number of minority class images (malignant) is equal to the major one. Finally,the time required for each model’s training is reported (in hours) and considered the fifth criterion.
The performance of each model considering each criterion is determined. The performance evaluationmetric used in our study is the Matthews correlation coefficient (MCC) [36], which has a prediction value rangedbetween -1 and 1. The stronger correlation between the original classes and predicated one, the closer of MCCto 1. The value of 0 in the MCC metric refers to the absence of correlation between the ground truth label andthe predicated one. The following formula defines the formula of MCC:
MCC =(tp × tn − fp × fn)√
(tp + fp) (tp + fn) (tn + fp) (tn + fn)(9)
where tp, tn, fp, fn refer to true positive, true negative, false positive, and false negative, respectively. Table 1(except for the last column) illustrates the evaluation performance of the twelve models trained over eleven datasets considering the five criteria. The attained results of DL models reveal that, with the availability of largedatasets and ground truth annotations, deep learning models show very successful performance in skin cancerdiagnosis. From the experimental results, transfer learning application was beneficial to improve the canceridentification level in all CNN models (compared to the baseline results described in the first column (OPT.SGD).It is also revealed that data augmentation application could slightly improve the prediction results on bothdermoscopic and non-dermoscopic images. Unlikely, weight balancing did not seem to substantially increase theperformance of DL models in our conducted experiments. Furthermore, the benefits of using residual connectionsor combining this form of connection with inception modules were also highlighted using InceptionResnetV2and DenseNet, demonstrating the advantages of using either residual links or the fusion of this configurationwith Inception modules. In terms of execution time (training time), MobileNet achieved the fastest training timeof 20 min, whereas InceptionResNetV2 has the slowest training time due to the complexity of its architecture.The presented CNN models were found to be appropriate for skin cancer diagnosis. However, explainingthe predictions made by the models remains an essential task for the proper design and adoption of CNNs
2640

AL-BANDER et al./Turk J Elec Eng & Comp Sci
in real-life environments. This role is critical for determining the reliability of the predictions made by DLmodels and, as a result, for a successful interaction between biomedical experts and deep learning systems.To ease selecting the suitable CNN model that could be deployed in a CAD system considering a given setof criteria, the establishment of a link between the skin cancer diagnosis models and support decision-makingmethods becomes crucial. To accomplish this goal in our study, the criteria described in Table 1 are harnessedto construct the decision-making matrix typically used in the decision-making systems.
Table 1. The decision matrix along with VIKOR ranking.
Models Dataset/Cr.
OPT.SGD WB TL DAU NC.RT VIKOR-Rank
DenseNet121
HAM10000 0.553 0.559 0.75 0.558 3.88 7ISBI2016 0.342 0.314 0.441 0.318 1.13 62ISBI2017 0.179 0.235 0.442 0.284 1.75 89MED-NODE 0.506 0.496 0.678 0.485 0.68 28MSK-1 0.575 0.559 0.658 0.587 1.06 20MSK-2 0.314 0.282 0.45 0.306 1.24 73MSK-3 0.093 0.088 0.225 0.153 0.7 116MSK-4 0.406 0.318 0.568 0.3 0.99 66PH2 0.778 0.779 0.872 0.675 0.69 12UDA-1 0.386 0.432 0.549 0.378 0.84 43UDA-2 0.465 0.46 0.332 0.428 0.66 61
DenseNet169
HAM10000 0.547 0.554 0.757 0.552 5.14 4ISBI2016 0.321 0.294 0.437 0.301 1.56 60ISBI2017 0.224 0.242 0.439 0.322 2.37 65MED-NODE 0.504 0.462 0.691 0.503 0.95 30MSK-1 0.56 0.544 0.653 0.591 1.46 17MSK-2 0.323 0.303 0.429 0.295 1.69 56MSK-3 0.114 0.162 0.328 0.168 1 110MSK-4 0.391 0.329 0.557 0.254 1.36 75PH2 0.766 0.773 0.909 0.741 0.97 5UDA-1 0.4 0.351 0.513 0.38 1.17 45UDA-2 0.455 0.408 0.397 0.464 0.91 37
DenseNet201
HAM10000 0.628 0.568 0.756 0.57 6.5 2ISBI2016 0.367 0.316 0.444 0.278 1.93 54ISBI2017 0.217 0.27 0.448 0.303 2.97 51MED-NODE 0.508 0.464 0.701 0.514 1.16 27MSK-1 0.555 0.545 0.665 0.594 1.81 15MSK-2 0.325 0.276 0.436 0.315 2.11 49MSK-3 0.165 0.129 0.315 0.163 1.21 109MSK-4 0.393 0.311 0.577 0.282 1.67 55PH2 0.771 0.819 0.861 0.679 1.18 10UDA-1 0.394 0.406 0.514 0.395 1.44 33UDA-2 0.596 0.345 0.465 0.385 1.11 44
2641

AL-BANDER et al./Turk J Elec Eng & Comp Sci
Table 1. (Continued).Models Dataset/
Cr.OPT.SGD WB TL DAU NC.RT VIKOR-
Rank
InceptionResNetV2
HAM10000 0.55 0.564 0.674 0.536 7.83 1ISBI2016 0.389 0.329 0.441 0.322 2.06 39ISBI2017 0.284 0.281 0.412 0.236 3.36 41MED-NODE 0.505 0.561 0.6 0.562 1.09 23MSK-1 0.592 0.595 0.701 0.55 1.9 14MSK-2 0.327 0.323 0.458 0.261 2.29 50MSK-3 0.095 0.162 0.084 0.322 1.14 113MSK-4 0.398 0.36 0.536 0.366 1.77 34PH2 0.762 0.794 0.716 0.789 1.12 6UDA-1 0.419 0.437 0.501 0.524 1.49 31UDA-2 0.438 0.385 0.325 0.484 1.01 57
InceptionV3
HAM10000 0.591 0.588 0.686 0.55 3.87 8ISBI2016 0.307 0.288 0.427 0.316 0.97 77ISBI2017 0.225 0.255 0.457 0.242 1.63 83MED-NODE 0.567 0.54 0.68 0.614 0.48 29MSK-1 0.574 0.607 0.668 0.582 0.9 19MSK-2 0.282 0.265 0.45 0.262 1.08 81MSK-3 0.08 0.167 0.125 0.218 0.51 118MSK-4 0.365 0.331 0.516 0.323 0.82 64PH2 0.647 0.771 0.738 0.703 0.5 24UDA-1 0.336 0.368 0.509 0.386 0.65 63UDA-2 0.54 0.537 0.406 0.477 0.44 40
InceptionV4
HAM10000 0.462 0.476 0.724 0.438 5.46 9ISBI2016 0.155 0.209 0.492 0.26 1.27 102ISBI2017 0.089 0.092 0.444 0.2 2.22 105MED-NODE 0.494 0.532 0.62 0.417 0.57 35MSK-1 0.368 0.3 0.695 0.557 1.16 52MSK-2 0.197 0.202 0.429 0.19 1.43 96MSK-3 0.044 0.069 0.383 0.273 0.61 119MSK-4 0.27 0.27 0.513 0.288 1.05 80PH2 0.58 0.661 0.781 0.72 0.58 18UDA-1 0.281 0.318 0.527 0.347 0.81 78UDA-2 0.514 0.322 0.404 0.444 0.5 70
2642

AL-BANDER et al./Turk J Elec Eng & Comp Sci
Table 1. (Continued).Models Dataset/
Cr.OPT.SGD WB TL DAU NC.RT VIKOR-
Rank
MobileNet
HAM10000 0.463 0.47 0.725 0.481 1.68 25ISBI2016 0.309 0.302 0.481 0.298 0.4 84ISBI2017 0.095 0.216 0.439 0.21 0.68 114MED-NODE 0.533 0.575 0.671 0.639 0.18 95MSK-1 0.494 0.524 0.654 0.523 0.36 46MSK-2 0.263 0.281 0.478 0.262 0.45 90MSK-3 0.124 0.121 0.272 0.256 0.2 115MSK-4 0.269 0.252 0.525 0.204 0.33 104PH2 0.7 0.78 0.834 0.78 0.19 82UDA-1 0.36 0.395 0.507 0.38 0.26 87UDA-2 0.375 0.432 0.471 0.355 0.16 108
NASNetMobile
HAM10000 0.578 0.584 0.709 0.568 6.03 3ISBI2016 0.254 0.29 0.402 0.286 1.94 67ISBI2017 0.23 0.229 0.41 0.261 2.85 53MED-NODE 0.466 0.514 0.707 0.501 1.24 26MSK-1 0.533 0.55 0.628 0.564 1.82 16MSK-2 0.269 0.235 0.385 0.271 2.09 72MSK-3 0.119 0.09 0.201 0.238 1.28 111MSK-4 0.302 0.288 0.455 0.247 1.72 74PH2 0.64 0.727 0.618 0.63 1.25 13UDA-1 0.351 0.295 0.515 0.313 1.47 59UDA-2 0.427 0.317 0.322 0.49 1.17 58
ResNet50
HAM10000 0.41 0 0.315 0.41 3.29 101ISBI2016 0.303 0.231 0.35 0.303 0.79 93ISBI2017 0 0.177 0.255 0 1.35 120MED-NODE 0 0 0.472 0 0.37 130MSK-1 0.366 0.427 0.539 0.366 0.72 48MSK-2 0.258 0.197 0.375 0.258 0.89 99MSK-3 0.166 0.25 0.15 0.166 0.39 112MSK-4 0.27 0.244 0.361 0.27 0.65 94PH2 0.719 0.76 0.467 0.719 0.38 36UDA-1 0.33 0.364 0.521 0.33 0.52 71UDA-2 0.414 0.478 0.484 0.414 0.33 69
2643

AL-BANDER et al./Turk J Elec Eng & Comp Sci
Table 1. (Continued).Models Dataset/
Cr.OPT.SGD WB TL DAU NC.RT VIKOR-
Rank
VGG16
HAM10000 0.383 0.369 0.546 0.461 3.81 22ISBI2016 0 0.196 0.341 0.205 0.76 121ISBI2017 0.176 0.199 0.272 0.232 1.45 98MED-NODE 0 0 0.495 0.567 0.25 125MSK-1 0.487 0.431 0.405 0.466 0.68 38MSK-2 0.239 0.256 0.365 0.222 0.87 97MSK-3 0 0 0.013 0.107 0.29 132MSK-4 0 0.218 0.344 0.273 0.6 122PH2 0.317 0.678 0.635 0.705 0.27 76UDA-1 0.286 0.279 0.449 0.369 0.43 85UDA-2 0 0 0.485 0.45 0.21 127
VGG19
HAM10000 0.363 0.367 0.424 0.424 4.38 21ISBI2016 0 0 0.248 0.235 0.85 124ISBI2017 0.188 0.181 0.155 0.222 1.65 100MED-NODE 0 0 0.459 0.504 0.26 126MSK-1 0.461 0.153 0.357 0.462 0.77 106MSK-2 0.157 0.223 0.301 0.239 0.98 107MSK-3 0 0 0.032 0.136 0.31 131MSK-4 0 0.139 0.336 0.214 0.67 123PH2 0.204 0.28 0.543 0.431 0.28 103UDA-1 0.259 0.059 0.256 0.375 0.47 117UDA-2 0 0 0.443 0.412 0.22 128
Xception
HAM10000 0.479 0.467 0.702 0.477 4.62 11ISBI2016 0.281 0.266 0.463 0.242 0.96 86ISBI2017 0.193 0.183 0.456 0.178 1.79 91MED-NODE 0.539 0.534 0.718 0.544 0.35 47MSK-1 0.405 0.407 0.645 0.375 0.86 42MSK-2 0.232 0.221 0.437 0.236 1.1 92MSK-3 0.149 0.133 0 0.275 0.38 129MSK-4 0.273 0.259 0.45 0.247 0.77 88PH2 0.808 0.794 0.773 0.744 0.37 32UDA-1 0.348 0.348 0.535 0.331 0.56 68UDA-2 0.439 0.416 0.357 0.488 0.3 79
This decision matrix DM , composed of OPT.SGD, WB, TL, DAU, NC.RT columns in Table 1, introducesthe twelve models as alternatives for eleven data sets producing 132 cases evaluated under five attributes(criteria). The entries of DM represent the evaluation performance of these models. To prepare the DM
(Eq.1) for ranking and subsequently selecting the optimal model, weights should be assigned to each criterion.The weights are computed by applying the entropy method (described in Section 2.2.3). The DM is firstlynormalised using the formula defined in (Eq.2), and then the entropy values are determined using the equation
2644

AL-BANDER et al./Turk J Elec Eng & Comp Sci
introduced in (Eq.3). The inherent contrast intensity of each criterion is then computed using the equationdefined in (Eq.4). Finally, each criterion’s weight is measured using the formula defined in (Eq.5). Thesummation of the decision making values in each criterion (Sum), entropy values ej , the values of the inherentcontrast intensity 1− ej , and weights assigned for each criterion wj are reported in Table 2.
Table 2. The weights of criteria defined by entropy.
OPT.SGD WB TL DAU NC.RTSum –4.68234 –4.69665 –4.80655 –4.78727 –4.53395ej –0.96044 –0.96338 –0.98592 –0.98196 –0.931− ej 1.960441 1.963375 1.985919 1.981964 1.930004wj 0.199603 0.199902 0.202197 0.201794 0.196504
To generate a compromise ranking list and a compromise solution using the provided weights, theVIKOR method is applied. Firstly, the criteria are dividing into two sets which are beneficial and non-beneficial attributes. Among CNNs’ attributes, optimisation using stochastic gradient descent (OPT.SGD),class weight balance (WB), transfer learning (TL), and data augmentation (DAU) are defined as beneficialattributes, whereas NC.RT is non-beneficial. Thus, the first four attributes are subjected to maximisation,contrary, NC.RT is targeted to be minimised according to the VIKOR approach. Therefore the best valuefor beneficial criteria is the largest value while for the non-beneficial criteria is the smallest one according toStep1-Rule1 (xj
∗ ) of VIKOR (described in Section 2.2.3). Likewise, the worst value is the smallest value for thebeneficial criteria and the largest value for the non-beneficial criteria, according to Step1-Rule2 (xj
− ). Usingthe obtained best and worst values, the parameters Si and Ri are determined based on the DM and accordingto the equation defined in (eq.6). Following that, the parameters of S∗ , S− , R∗ , and R− are computed to beused for determining Qi (defined in eq.8). The value of v parameter (defined in eq.8) is set to value of 0.5.Qi list is sorted in ascending order to produce a ranking list of deep learning models. The recommended bestmodel is the model that has the lowest of Qi , and value one is assigned to it. While the less recommendedmodel is the model with the highest Qi and rank 132 is assigned to it. The ranks located between 1 and 132indicate each model’s importance according to the rank assigned to the model in a certain dataset. From Table1, it can be noticed that the InceptionResNetV2 model trained on HAM10000 data is the best model with arank one. It achieves Qi value of 0.138326586 while the less recommended model is VGG16 trained on Mask-3dataset that reports Qi value of 1. For other models, DenseNet201, for instance, is scored as two on HAM10000data achieving a Qi value of 0.174821171. The values of Qi , Si and Ri for the remaining models have notbeen reported to keep this section as concise as possible.
To validate the presented benchmarking approach, the rank list should satisfy the two conditionsdescribed in Step 6 of the VIKOR method. Suppose that the alternative M
′ is the model with rank1 (InceptionResNetV2), M
′′ is the alternative with position 2 (DenseNet201) where Q(1) = 0.138326586and Q(2) = 0.174821171. The ”acceptable advantage” condition (Q(M
′′) − Q(M
′) ≥ DQ) is then true
(0.036494 ≥ 0.007633588), where DQ = 1/ (m− 1) , m=132 giving DQ = 0.007633588. To fulfil the sec-ond condition, ”acceptable stability in decision-making” requires that the alternative M
′ (model with rank1) must have the best value in S or/and R ranking lists. This condition is also satisfied in the S rankinglist where (InceptionResNetV2) achieves the lowest value reporting value of –1.510361893. Satisfying these
2645

AL-BANDER et al./Turk J Elec Eng & Comp Sci
conditions proves that the compromise solution (the best model) has an acceptable advantage and is stablewithin a decision-making process. The developed framework helps the decision-maker in evaluating the actualperformance of a specific deep learning model through selection process, making it easier to distinguish amongmodels based on various criteria.
4. ConclusionThe growing number of proposed skin cancer diagnosis models has brought up the question of which diagnosismodel is best for a particular diagnosis task and what sort of criteria should be taken into consideration duringthe selection of the optimal model. To address this issue, an evaluation and benchmarking framework aredeveloped. This paper presented a framework for investigating several deep learning models used to assess skincancer diagnosis, and then the optimal model is selected by integrated entropy and VIKOR approaches. Twelvedeep learning models on a various datasets treated as alternatives and five CNNs’ attributes used as criteria havebeen analysed and considered to construct MCDM system. The developed framework enabled us to understandthe decision made by the statistical methods to recommend the best model for the automated cancer diagnosisunder multiple criteria and various datasets. Thus, the recommendation scheme, which is based on settingpriorities and ranking deep learning models, is viable and should be applied prior to designing diagnostic CADsystems.
References
[1] Siegel R, Miller K, Jemal A. Cancer statistics, 2020. CA: A Cancer Journal for Clinicians 2020; 70 (1):7-30.
[2] Glazer A, Rigel D. Analysis of trends in geographic distribution of us dermatology workforce density. JAMADermatology 2017; 153 (5):472-473. doi: 10.1001/jamadermatol.2016.6032
[3] Sarvamangala D, Kulkarni R. Convolutional neural networks in medical image understanding: a survey. Evolu-tionary Intelligence 2021; 1-22. doi: 10.1007/s12065-020-00540-3
[4] Naeem A, Farooq M, Khelifi A, Abid A. Malignant melanoma classification using deep learning: datasets, per-formance measurements, challenges and opportunities. IEEE Access 2020; 8:110575-110597. doi: 10.1109/AC-CESS.2020.3001507
[5] Esteva A, Kuprel B, Novoa R, Ko J, Swetter S et al. Dermatologist-level classification of skin cancer with deepneural networks. Nature 2017; 542 (7639):115-118. doi:10.1038/nature21056
[6] Haenssle H, Fink C, Schneiderbauer R, Toberer F, Buhl T et al. Man against machine: diagnostic performance ofa deep learning convolutional neural network for dermoscopic melanoma recognition in comparison to 58 dermatol-ogists. Annals of Oncology 2018; 29 (8):1836-1842. doi: 10.1093/annonc/mdy166
[7] Fujisawa Y, Otomo Y, Ogata Y, Nakamura Y, Fujita R at al. Deep-learning-based, computer-aided classifierdeveloped with a small dataset of clinical images surpasses board-certified dermatologists in skin tumour diagnosis.British Journal of Dermatology 2019; 180 (2): 373-381. doi: 10.1111/bjd.16924
[8] Tschandl P, Rosendahl C, Akay B, Argenziano G, Blum A et al. Expert-level diagnosis of nonpigmented skin cancerby combined convolutional neural networks. JAMA Dermatology 2019; 155 (1): 58-65. doi: 10.1001/jamaderma-tol.2018.4378
[9] Gessert N, Nielsen M, Shaikh M, Werner R, Schlaefer A. Skin lesion classification using ensembles of multi-resolutionefficientnets with meta data. MethodsX 2020; 7: 100864. doi:10.1016/j.mex.2020.100864
[10] Ha Q, Liu B, Liu F. Identifying melanoma images using efficientnet ensemble: Winning solution to the SIIM-ISICmelanoma classification challenge. arXiv Preprint; 2020. arXiv:2010.05351.
2646

AL-BANDER et al./Turk J Elec Eng & Comp Sci
[11] Pérez E, Reyes O, Ventura S. Convolutional neural networks for the automatic diagnosis of melanoma: An extensiveexperimental study. Medical Image Analysis 2021; 67: 101858. doi:10.1016/j.media.2020.101858
[12] Zeleny M. Multiple criteria decision making Kyoto 1975. Springer Science & Business Media, 2012.
[13] Opricovic S, Tzeng G. Extended vikor method in comparison with outranking methods. European Journal ofOperational Research 2007; 178 (2): 514-529. doi:10.1016/j.ejor.2006.01.020
[14] Codella N, Gutman D, Celebi M, Helba B, Marchetti M et al. Skin lesion analysis toward melanoma detection: Achallenge at the 2017 international symposium on biomedical imaging. In: IEEE 15th International Symposium onBiomedical Imaging (ISBI ); 2018. pp. 168-172.
[15] Gutman D, Codella N, Celebi E, Helba B, Marchetti M et al. Skin lesion analysis toward melanoma detection: Achallenge at the international symposium on biomedical imaging (ISBI). arXiv Preprint; 2016. arXiv:1605.01397.
[16] Tschandl P, Rosendahl C, Kittler H. The ham10000 dataset, a large collection of multi-source dermatoscopic imagesof common pigmented skin lesions. Scientific Data 2018; 5 (1): 1-9. doi: 10.1038/sdata.2018.161
[17] Mendonça T, Ferreira P, Marques J, Marcal A, Rozeira J. Ph 2-a dermoscopic image database for research andbenchmarking. In: 35th Annual International Conference of the IEEE Engineering in Medicine and Biology Society(EMBC); 2013. pp. 5437-5440.
[18] Giotis I, Molders N, Land S, Biehl M, Jonkman M et al. Med-node: A computer-assisted melanoma diag-nosis system using non-dermoscopic images. Expert Systems with Applications 2015; 42 (19):6578-6585. doi:10.1016/j.eswa.2015.04.034
[19] LeCun Y, Bottou L, Bengio Y, Haffner P. Gradient-based learning applied to document recognition. In: Proceedingsof the IEEE; 1998. pp. 2278-2324.
[20] Krizhevsky A, Sutskever I, Hinton G. Imagenet classification with deep convolutional neural networks. Advancesin Neural Information Processing Systems 2012; 25:1097-1105. doi:10.1145/3065386
[21] Simonyan K, Zisserman A. Very deep convolutional networks for large-scale image recognition. arXiv Preprint2014. arXiv:1409.1556.
[22] Szegedy C, Vanhoucke V, Ioffe S, Shlens J, Wojna Z. Rethinking the inception architecture for computer vision.In: Proceedings of the IEEE Conference on Computer Vision and Pattern Recognition; 2016. pp. 2818-2826.
[23] Szegedy C, Ioffe S, Vanhoucke V, Alemi A. Inception-v4, inception-resnet and the impact of residual connectionson learning. In: Proceedings of the AAAI Conference on Artificial Intelligence; 2017. pp. 1-31.
[24] He K, Zhang X, Ren S, Sun J. Deep residual learning for image recognition. In: Proceedings of the IEEE Conferenceon Computer Vision and Pattern Recognition; 2016. pp. 770-778.
[25] Huang G, Liu Z, Maaten L, Weinberger K. Densely connected convolutional networks. In: Proceedings of the IEEEConference on Computer Vision and Pattern Recognition; 2017. pp. 4700-4708.
[26] Chollet F. Xception: Deep learning with depthwise separable convolutions. In: Proceedings of the IEEE Conferenceon Computer Vision and Pattern Recognition; 2017. pp. 1251-1258.
[27] Howard A, Zhu M, Chen B, Kalenichenko D, Wang W et al. Mobilenets: Efficient convolutional neural networksfor mobile vision applications. arXiv Preprint 2017. arXiv:1704.04861.
[28] Zoph B, Vasudevan V, Shlens J, Le Q. Learning transferable architectures for scalable image recognition. In:Proceedings of the IEEE Conference on Computer Vision and Pattern Recognition; 2018. pp. 8697-8710.
[29] Goodfellow I, Bengio Y, Courville A, Bengio Y. Deep learning. MIT Press Cambridge, 2016.
[30] Cui Y, Jia M, Lin T, Song Y, Belongie S. Class-balanced loss based on effective number of samples. In: Proceedingsof the IEEE/CVF Conference on Computer Vision and Pattern Recognition; 2019. pp. 9268-9277.
[31] Yosinski J, Clune J, Bengio Y, Lipson H. How transferable are features in deep neural networks? arXiv Preprint2014. arXiv:1411.1792.
2647

AL-BANDER et al./Turk J Elec Eng & Comp Sci
[32] Wong S, Gatt A, Stamatescu V, McDonnell M. Understanding data augmentation for classification: when to warp?In: 2016 International Conference on Digital Image Computing: Techniques and Applications (DICTA), IEEE;2016. pp. 1-6.
[33] He K, Sun J. Convolutional neural networks at constrained time cost. In: Proceedings of the IEEE Conference onComputer Vision and Pattern Recognition; 2015. pp. 5353-5360.
[34] Hainmueller J. Entropy balancing for causal effects: A multivariate reweighting method to produce balancedsamples in observational studies. Political Analysis; 2012, 25-46. doi:10.1093/pan/mpr025
[35] Glorot X, Bengio Y. Understanding the difficulty of training deep feedforward neural networks. In: Proceedings ofthe Thirteenth International Conference on Artificial Intelligence and Statistics; 2010. pp. 249-256.
[36] Boughorbel S, Jarray F, El-Anbari M. Optimal classifier for imbalanced data using matthews correlation coefficientmetric. PloS One 2017; 12 (6): e0177678. doi: 10.1371/journal.pone.0177678
2648