benchmarking of hse performance - aiche · outline of the presentation background &...
TRANSCRIPT
Benchmarking of HSE Performance For Oil & Gas Industries
Mohammad K S Mohiuddeen, CSP, CMIOSH Kuwait Oil Company; Kuwait [email protected]
+965 66604652
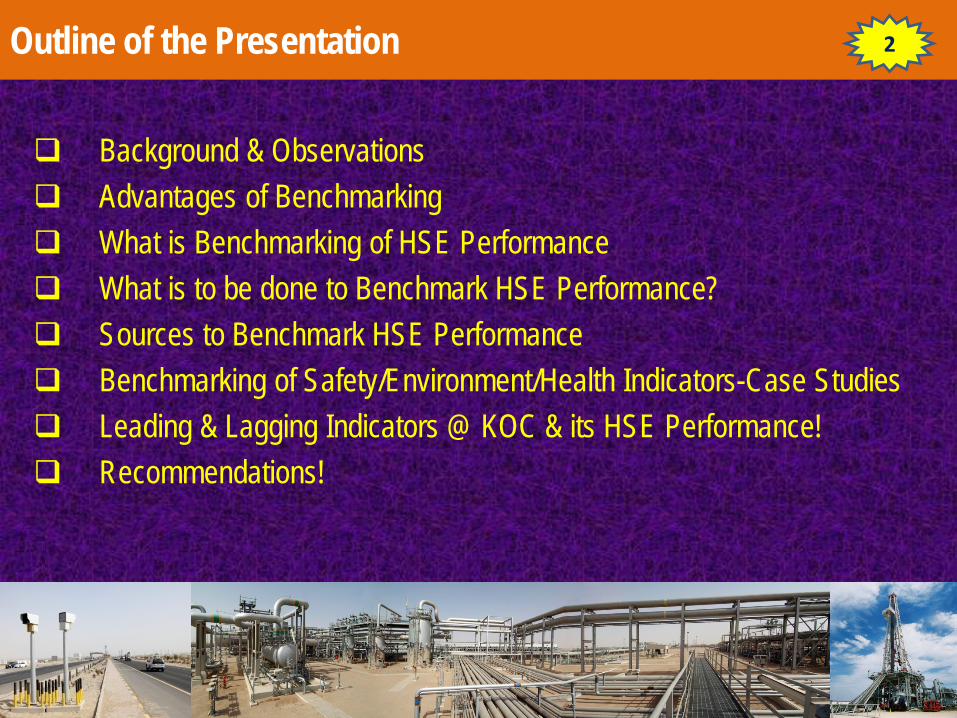
Outline of the Presentation Background & Observations Advantages of Benchmarking What is Benchmarking of HSE Performance What is to be done to Benchmark HSE Performance? Sources to Benchmark HSE Performance Benchmarking of Safety/Environment/Health Indicators-Case Studies Leading & Lagging Indicators @ KOC & its HSE Performance! Recommendations!
2
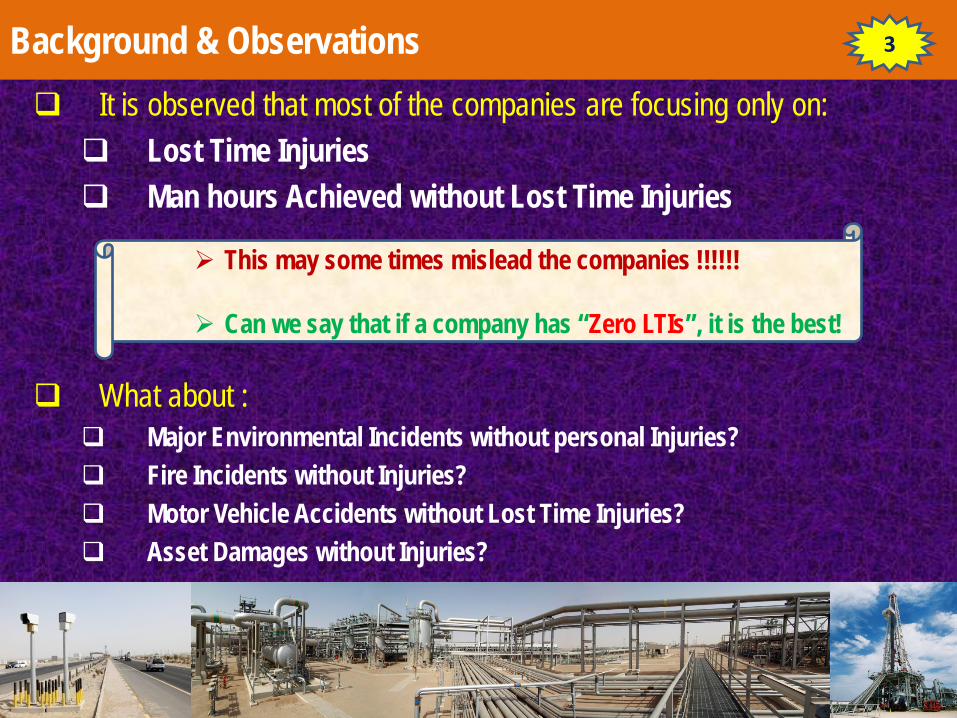
Background & Observations It is observed that most of the companies are focusing only on: Lost Time Injuries Man hours Achieved without Lost Time Injuries
What about :
Major Environmental Incidents without personal Injuries? Fire Incidents without Injuries? Motor Vehicle Accidents without Lost Time Injuries? Asset Damages without Injuries?
3
This may some times mislead the companies !!!!!! Can we say that if a company has “Zero LTIs”, it is the best!
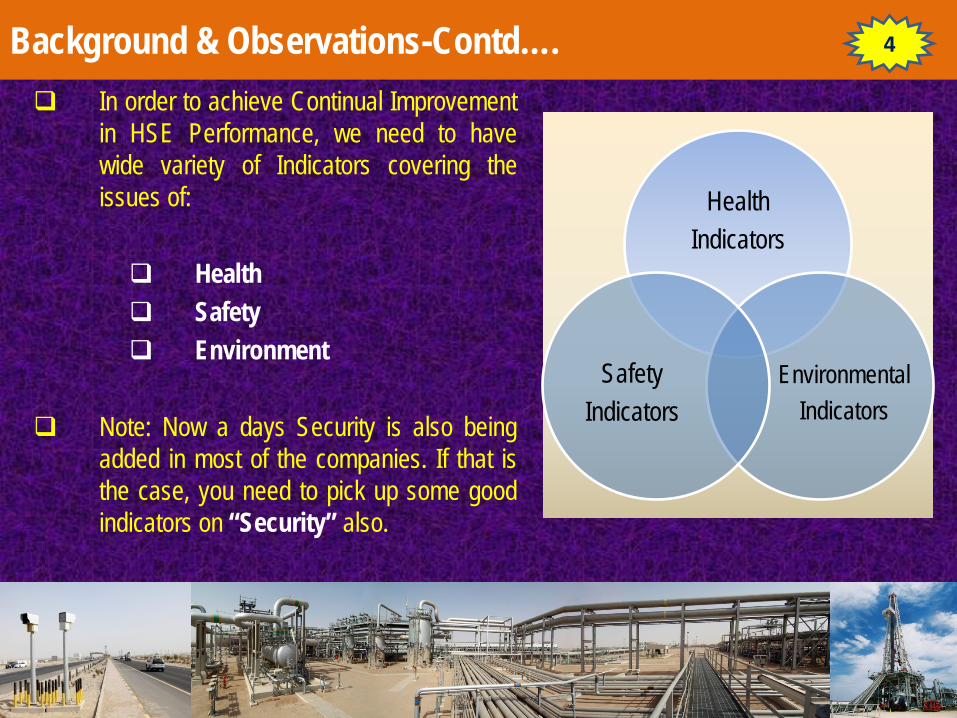
Background & Observations-Contd…. In order to achieve Continual Improvement
in HSE Performance, we need to have wide variety of Indicators covering the issues of:
Health Safety Environment
Note: Now a days Security is also being added in most of the companies. If that is the case, you need to pick up some good indicators on “Security” also.
Health Indicators
Environmental Indicators
Safety Indicators
4
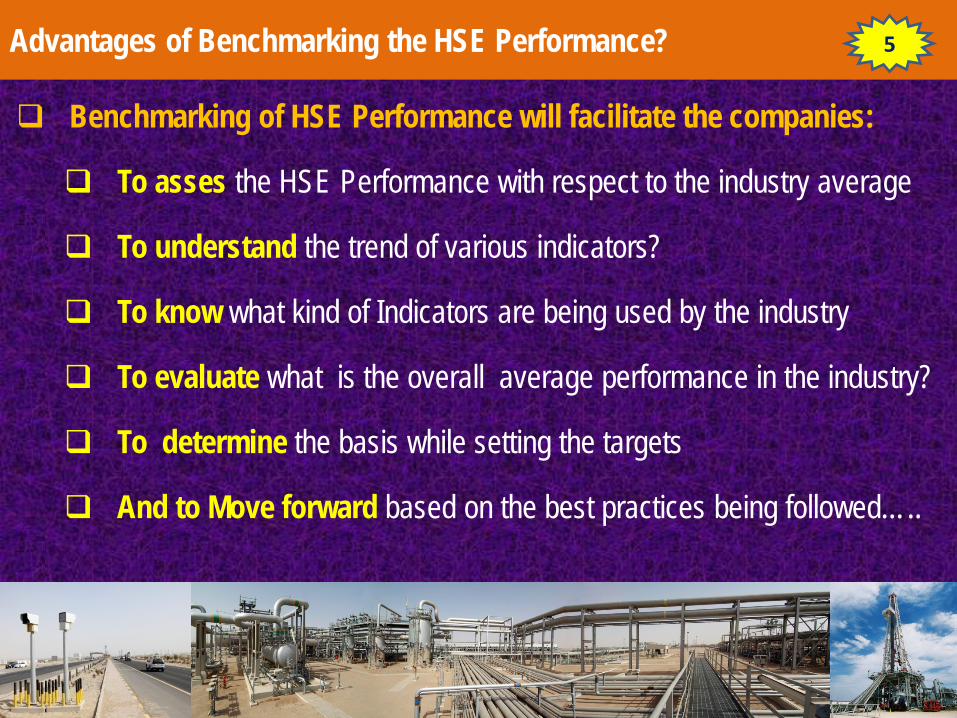
Advantages of Benchmarking the HSE Performance?
Benchmarking of HSE Performance will facilitate the companies:
To asses the HSE Performance with respect to the industry average
To understand the trend of various indicators?
To know what kind of Indicators are being used by the industry
To evaluate what is the overall average performance in the industry?
To determine the basis while setting the targets
And to Move forward based on the best practices being followed…..
5
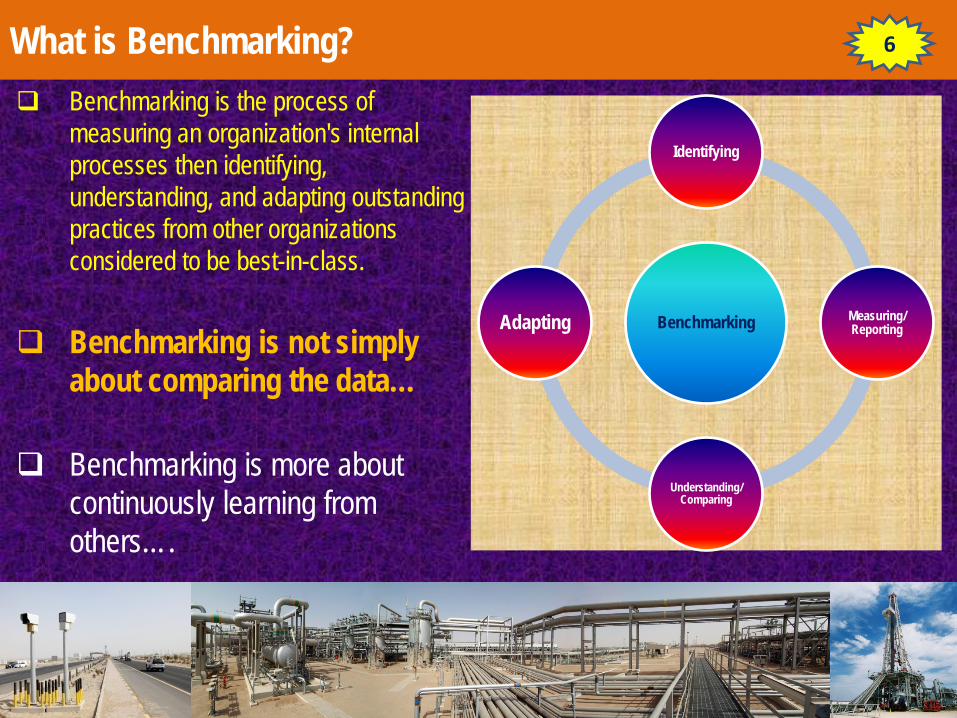
What is Benchmarking? Benchmarking is the process of
measuring an organization's internal processes then identifying, understanding, and adapting outstanding practices from other organizations considered to be best-in-class.
Benchmarking is not simply
about comparing the data… Benchmarking is more about
continuously learning from others….
Benchmarking
Identifying
Measuring/ Reporting
Understanding/ Comparing
Adapting
6
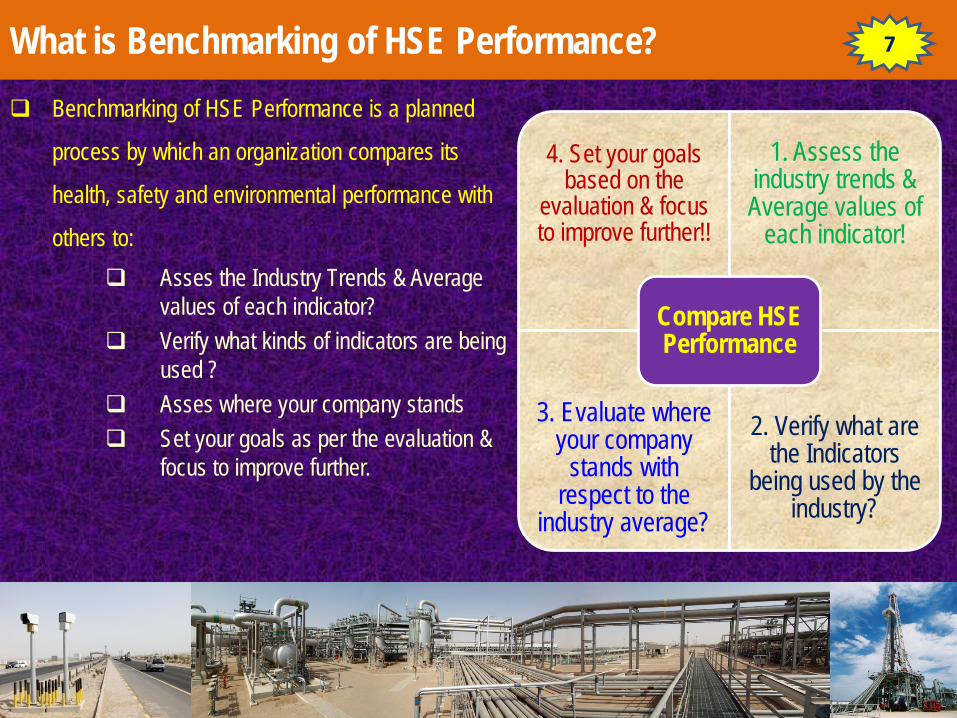
What is Benchmarking of HSE Performance? Benchmarking of HSE Performance is a planned
process by which an organization compares its
health, safety and environmental performance with
others to: Asses the Industry Trends & Average
values of each indicator? Verify what kinds of indicators are being
used ? Asses where your company stands Set your goals as per the evaluation &
focus to improve further.
4. Set your goals based on the
evaluation & focus to improve further!!
1. Assess the industry trends & Average values of
each indicator!
3. Evaluate where your company
stands with respect to the
industry average?
2. Verify what are the Indicators
being used by the industry?
Compare HSE Performance
7
Sources to Benchmark HSE Performance
OGP Safety Indicators Performance Reports OGP Environmental Indicators Performance Reports OGP Health Performance Indicators Reports GCC Petroleum Companies Loss Prevention Statistical Reports IADC Reports
OGP : International Association of Oil & Gas Producers GCC : Gulf Cooperation Council IADC : International Association of Drilling Contractors
Note: These are some of the sources suitable for Oil Industry.
8
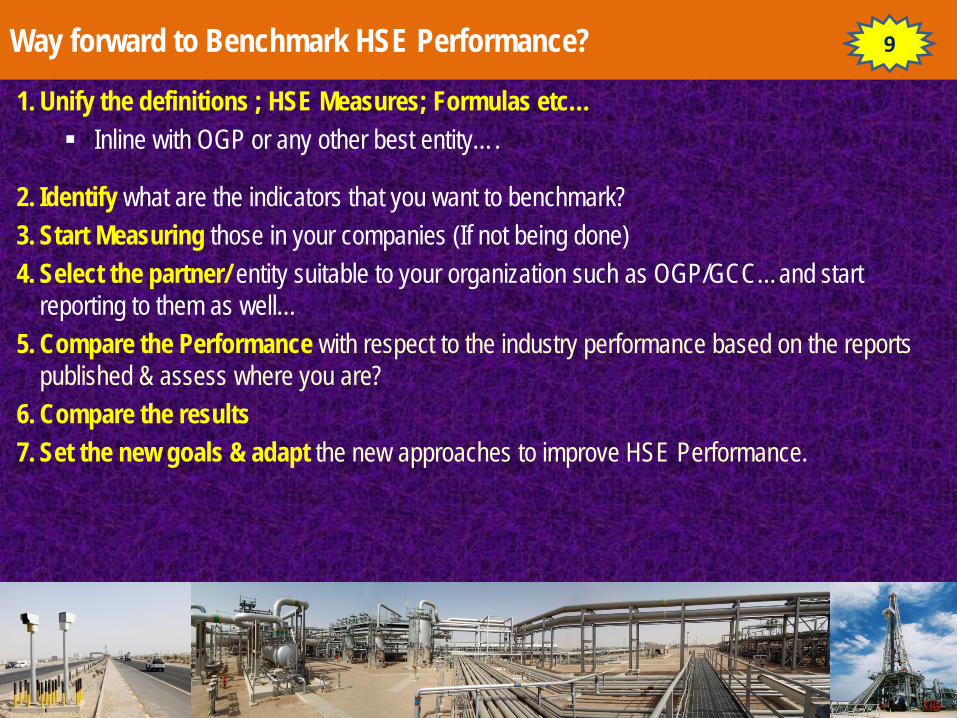
Way forward to Benchmark HSE Performance?
1. Unify the definitions ; HSE Measures; Formulas etc… Inline with OGP or any other best entity….
2. Identify what are the indicators that you want to benchmark? 3. Start Measuring those in your companies (If not being done) 4. Select the partner/ entity suitable to your organization such as OGP/GCC…and start
reporting to them as well… 5. Compare the Performance with respect to the industry performance based on the reports
published & assess where you are? 6. Compare the results 7. Set the new goals & adapt the new approaches to improve HSE Performance.
9
Sample Reports and trend analysis of HSE Measures based on OGP/GCC
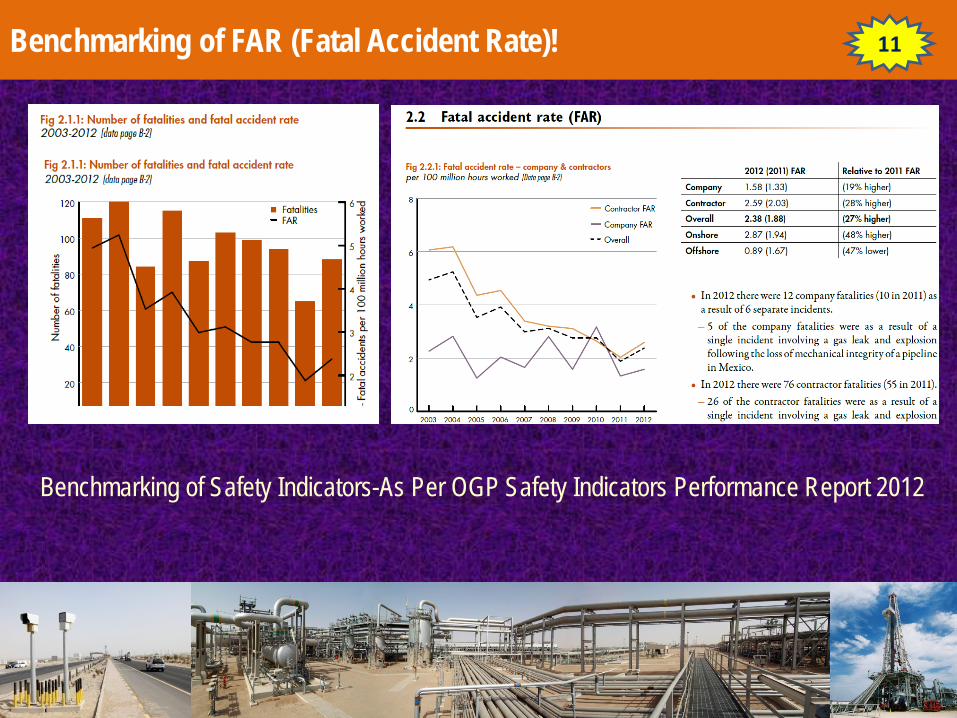
Benchmarking of FAR (Fatal Accident Rate)!
Benchmarking of Safety Indicators-As Per OGP Safety Indicators Performance Report 2012
11
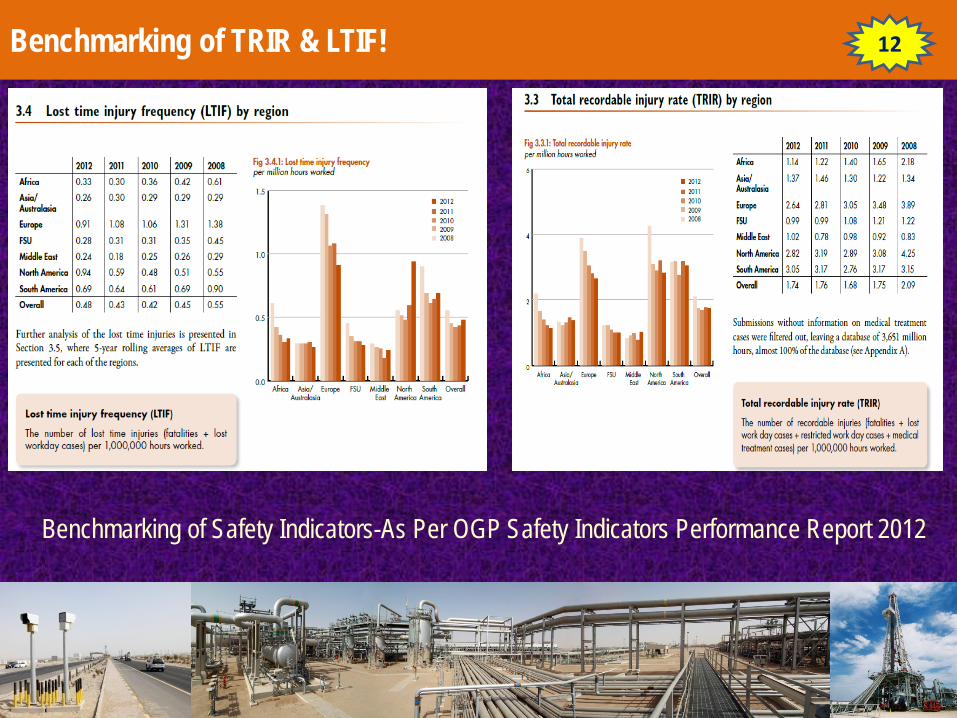
Benchmarking of TRIR & LTIF!
Benchmarking of Safety Indicators-As Per OGP Safety Indicators Performance Report 2012
12
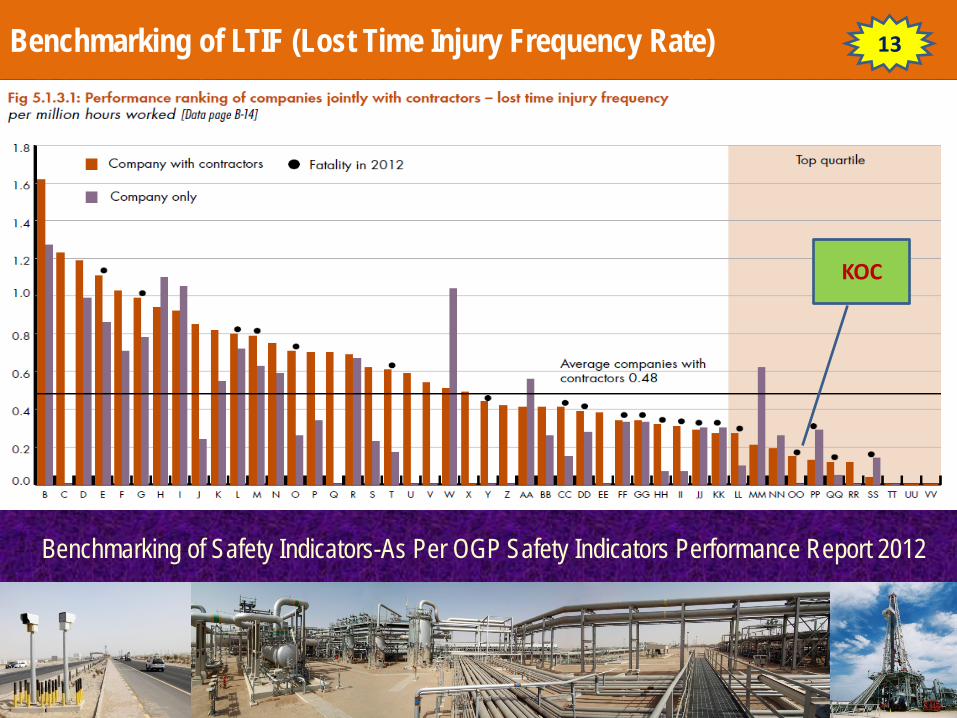
Benchmarking of LTIF (Lost Time Injury Frequency Rate)
Benchmarking of Safety Indicators-As Per OGP Safety Indicators Performance Report 2012
KOC
13
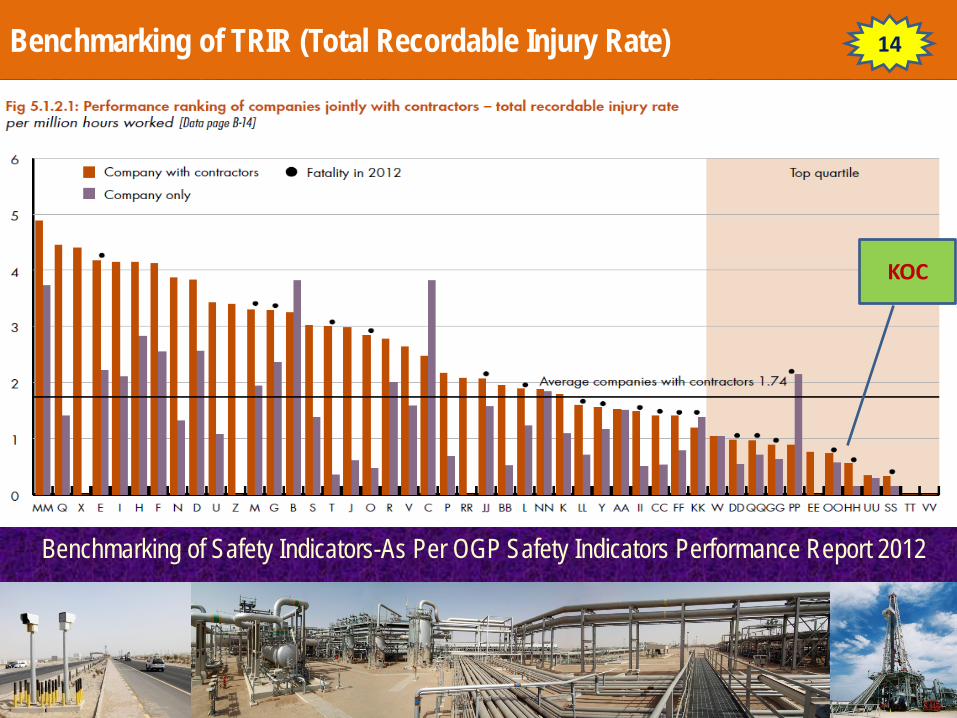
Benchmarking of TRIR (Total Recordable Injury Rate)
Benchmarking of Safety Indicators-As Per OGP Safety Indicators Performance Report 2012
KOC
14
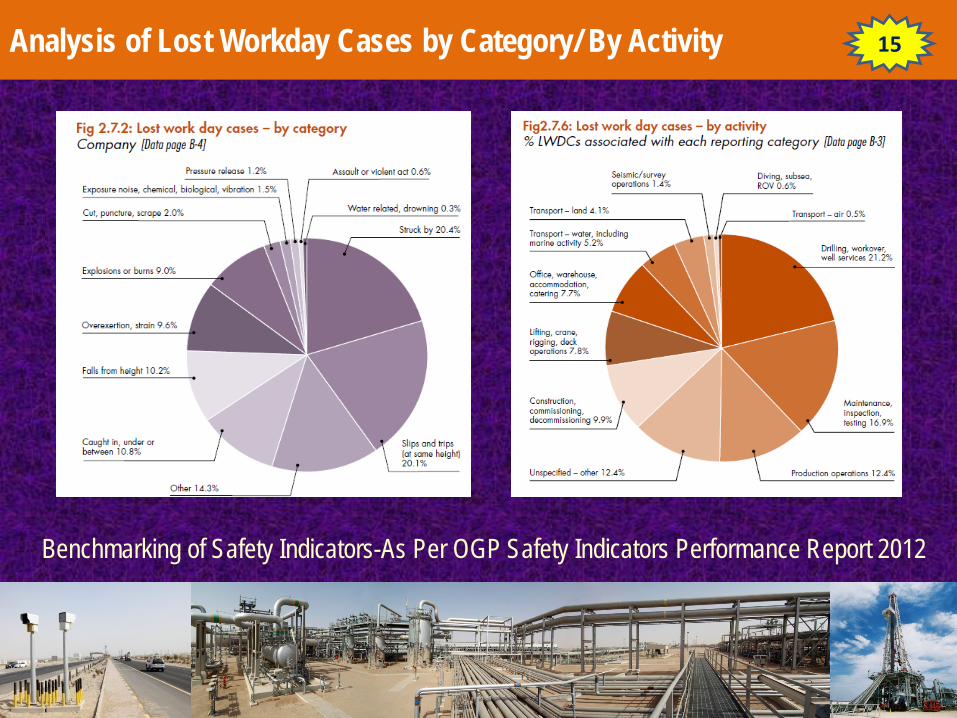
Analysis of Lost Workday Cases by Category/ By Activity
Benchmarking of Safety Indicators-As Per OGP Safety Indicators Performance Report 2012
15
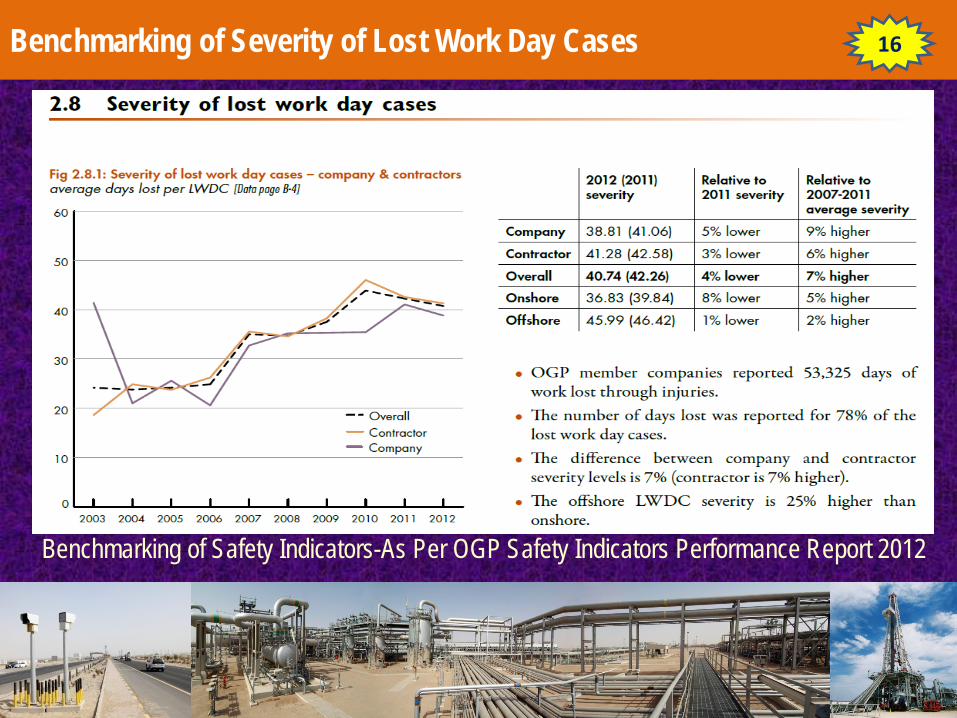
Benchmarking of Severity of Lost Work Day Cases
Benchmarking of Safety Indicators-As Per OGP Safety Indicators Performance Report 2012
16
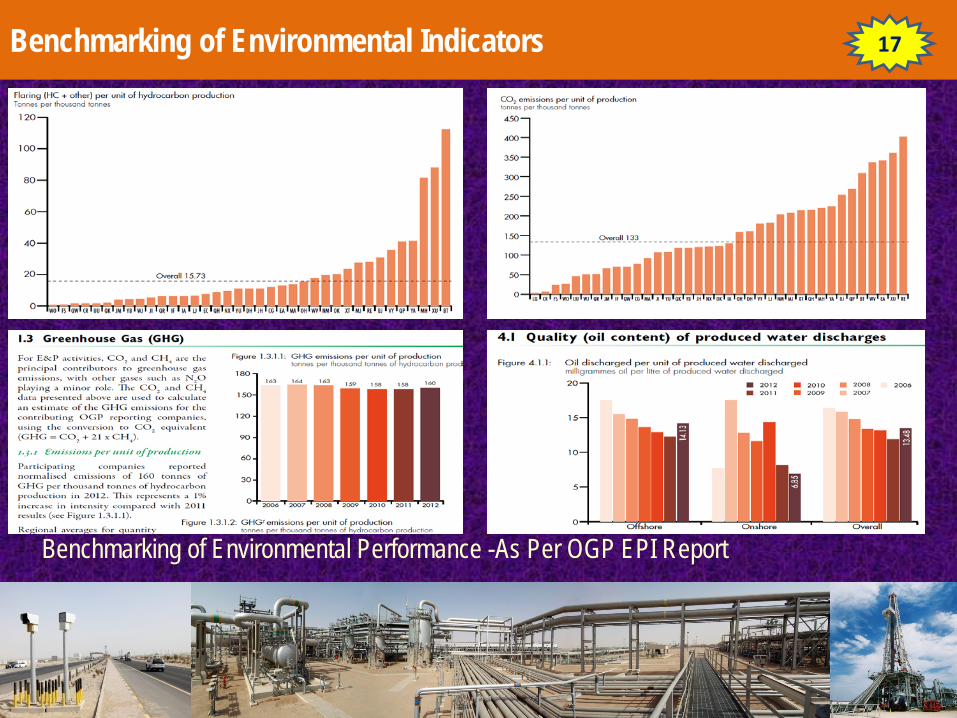
Benchmarking of Environmental Indicators
Benchmarking of Environmental Performance -As Per OGP EPI Report
17
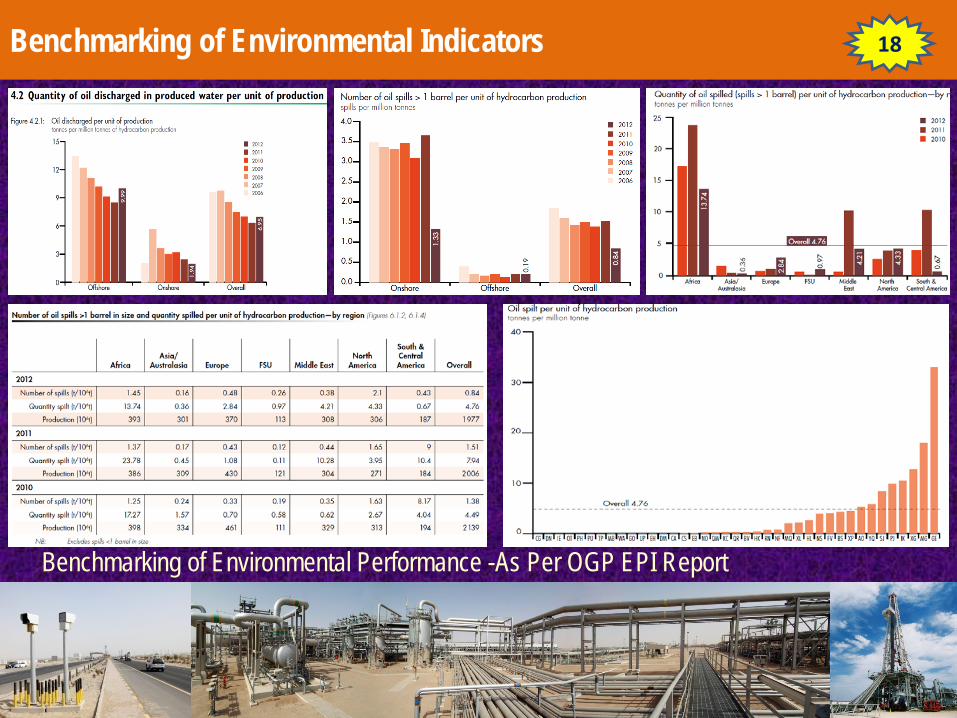
Benchmarking of Environmental Indicators
Benchmarking of Environmental Performance -As Per OGP EPI Report
18
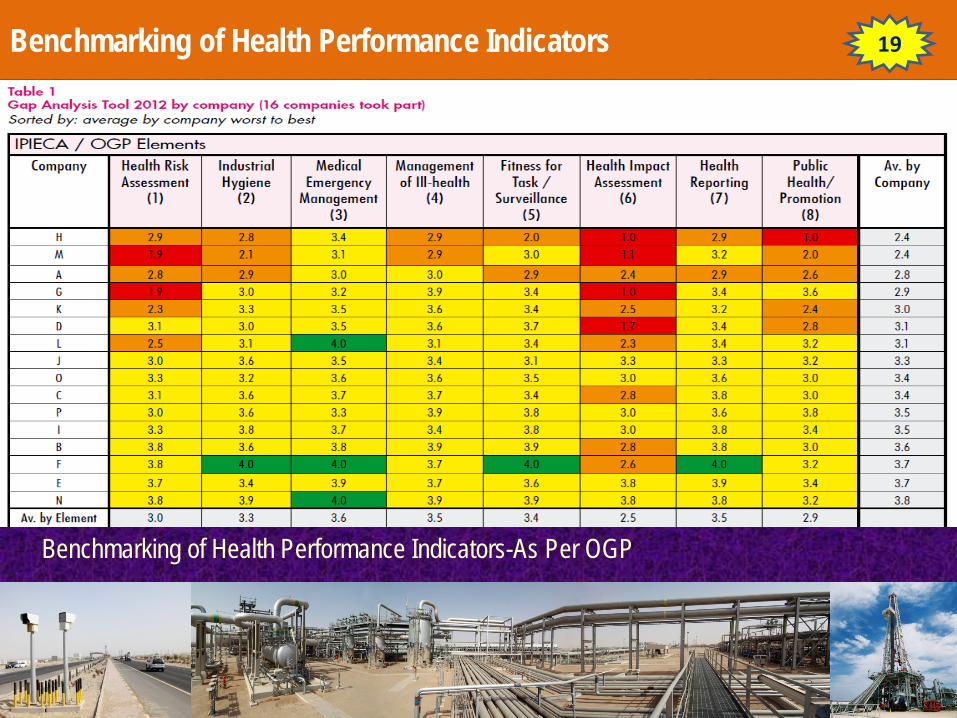
Benchmarking of Health Performance Indicators
Benchmarking of Health Performance Indicators-As Per OGP
19
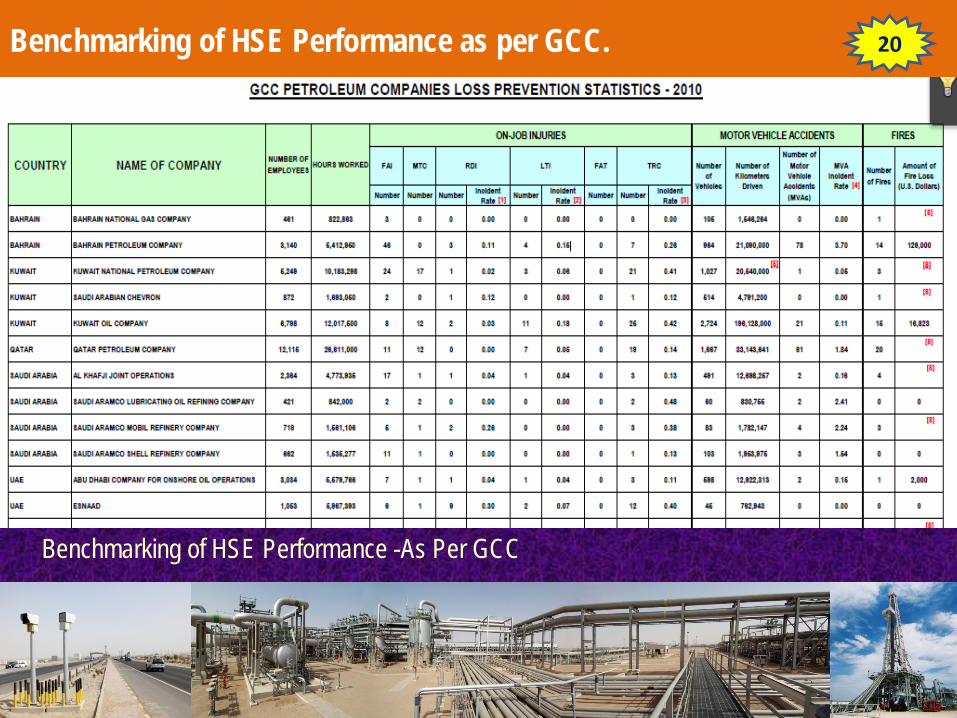
Benchmarking of HSE Performance as per GCC.
Benchmarking of HSE Performance -As Per GCC
20
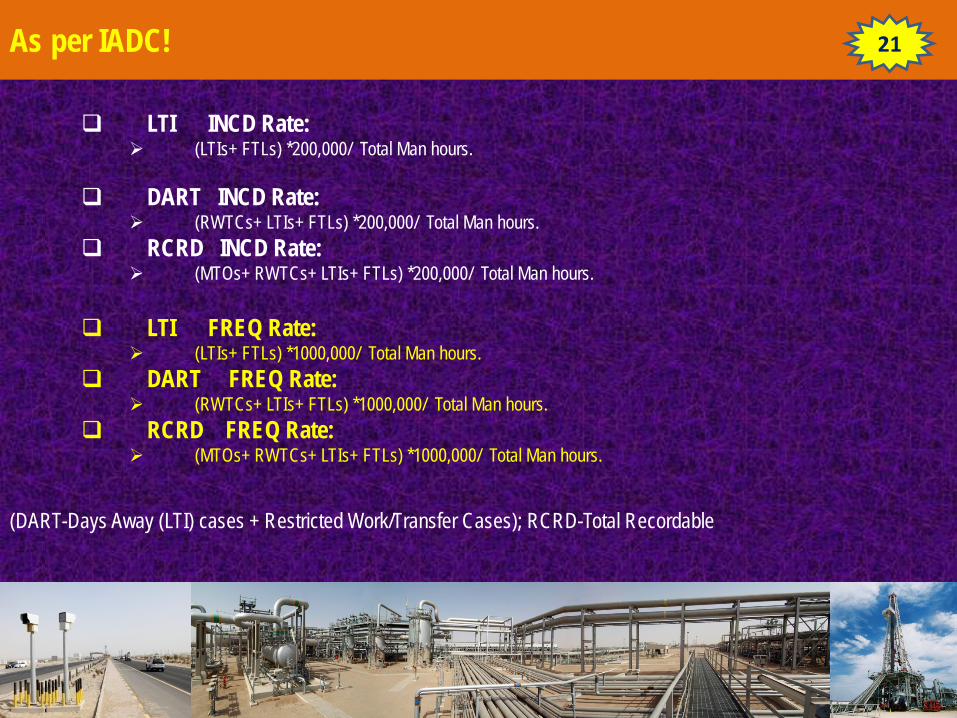
As per IADC! 21
LTI INCD Rate: (LTIs+ FTLs) *200,000/ Total Man hours.
DART INCD Rate: (RWTCs+ LTIs+ FTLs) *200,000/ Total Man hours.
RCRD INCD Rate: (MTOs+ RWTCs+ LTIs+ FTLs) *200,000/ Total Man hours.
LTI FREQ Rate:
(LTIs+ FTLs) *1000,000/ Total Man hours. DART FREQ Rate:
(RWTCs+ LTIs+ FTLs) *1000,000/ Total Man hours. RCRD FREQ Rate:
(MTOs+ RWTCs+ LTIs+ FTLs) *1000,000/ Total Man hours.
(DART-Days Away (LTI) cases + Restricted Work/Transfer Cases); RCRD-Total Recordable
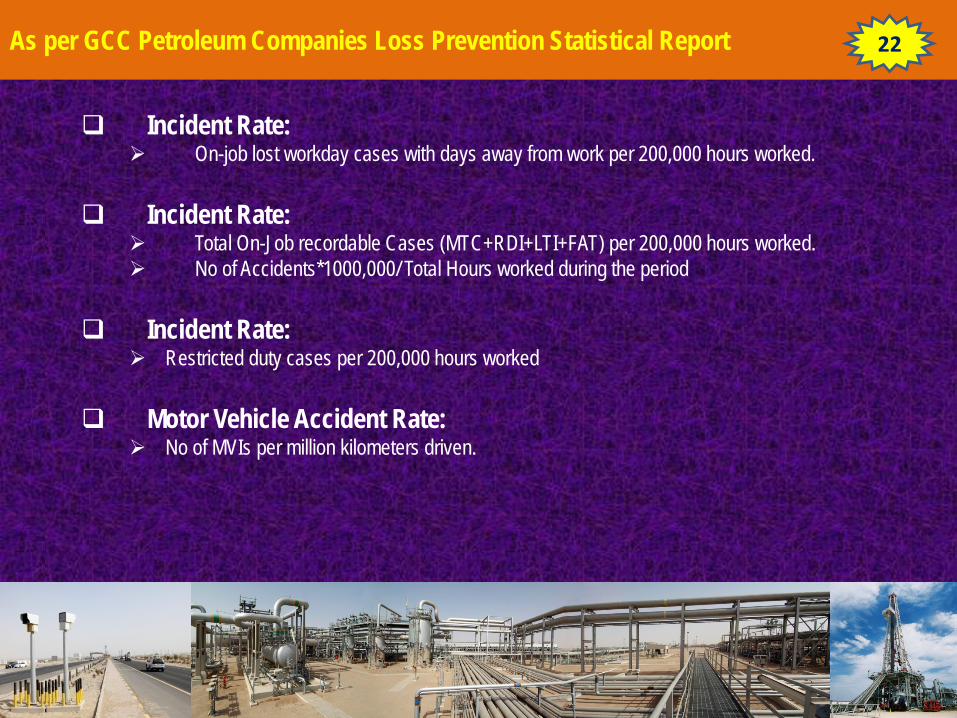
As per GCC Petroleum Companies Loss Prevention Statistical Report 22
Incident Rate: On-job lost workday cases with days away from work per 200,000 hours worked.
Incident Rate: Total On-Job recordable Cases (MTC+RDI+LTI+FAT) per 200,000 hours worked. No of Accidents*1000,000/ Total Hours worked during the period
Incident Rate: Restricted duty cases per 200,000 hours worked
Motor Vehicle Accident Rate: No of MVIs per million kilometers driven.
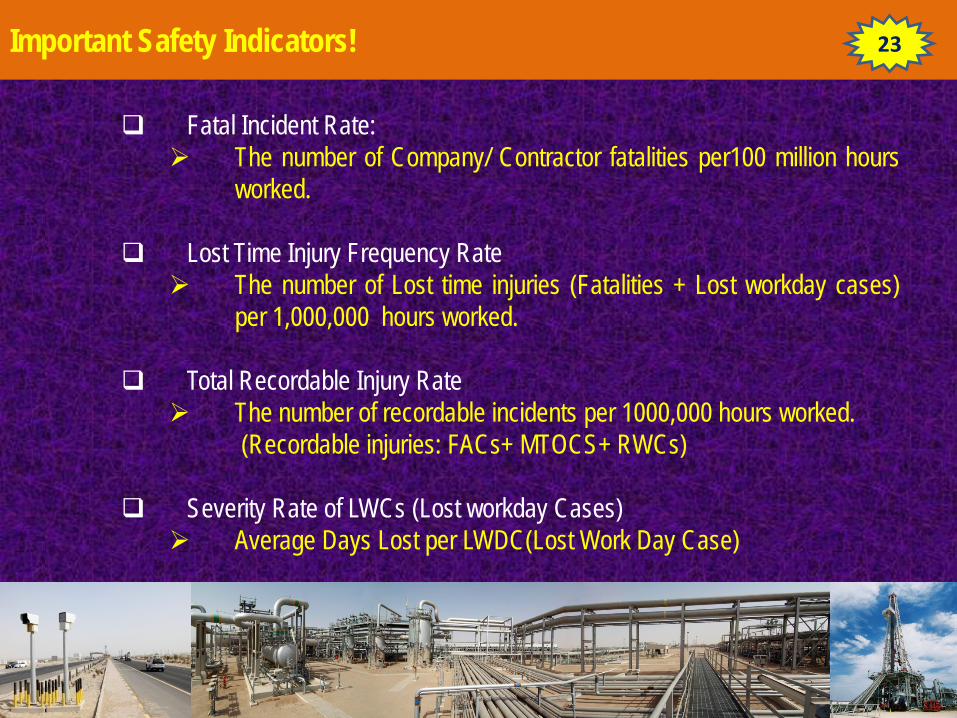
Important Safety Indicators! 23
Fatal Incident Rate: The number of Company/ Contractor fatalities per100 million hours
worked.
Lost Time Injury Frequency Rate The number of Lost time injuries (Fatalities + Lost workday cases)
per 1,000,000 hours worked.
Total Recordable Injury Rate The number of recordable incidents per 1000,000 hours worked.
(Recordable injuries: FACs+ MTOCS+ RWCs)
Severity Rate of LWCs (Lost workday Cases) Average Days Lost per LWDC(Lost Work Day Case)
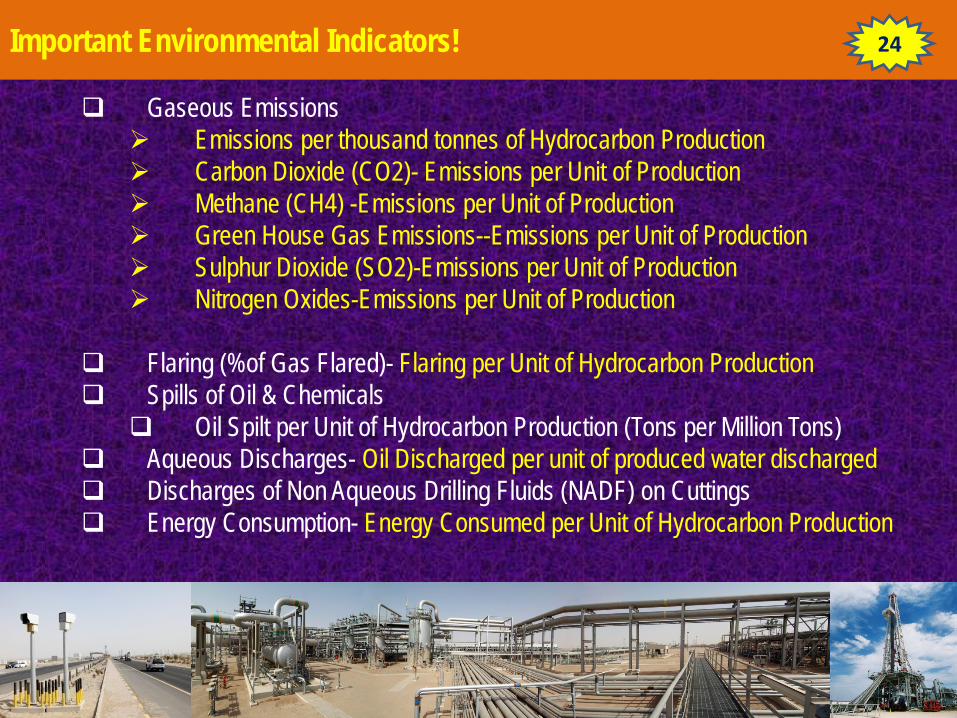
Important Environmental Indicators! 24
Gaseous Emissions Emissions per thousand tonnes of Hydrocarbon Production Carbon Dioxide (CO2)- Emissions per Unit of Production Methane (CH4) -Emissions per Unit of Production Green House Gas Emissions--Emissions per Unit of Production Sulphur Dioxide (SO2)-Emissions per Unit of Production Nitrogen Oxides-Emissions per Unit of Production
Flaring (%of Gas Flared)- Flaring per Unit of Hydrocarbon Production Spills of Oil & Chemicals
Oil Spilt per Unit of Hydrocarbon Production (Tons per Million Tons) Aqueous Discharges- Oil Discharged per unit of produced water discharged Discharges of Non Aqueous Drilling Fluids (NADF) on Cuttings Energy Consumption- Energy Consumed per Unit of Hydrocarbon Production
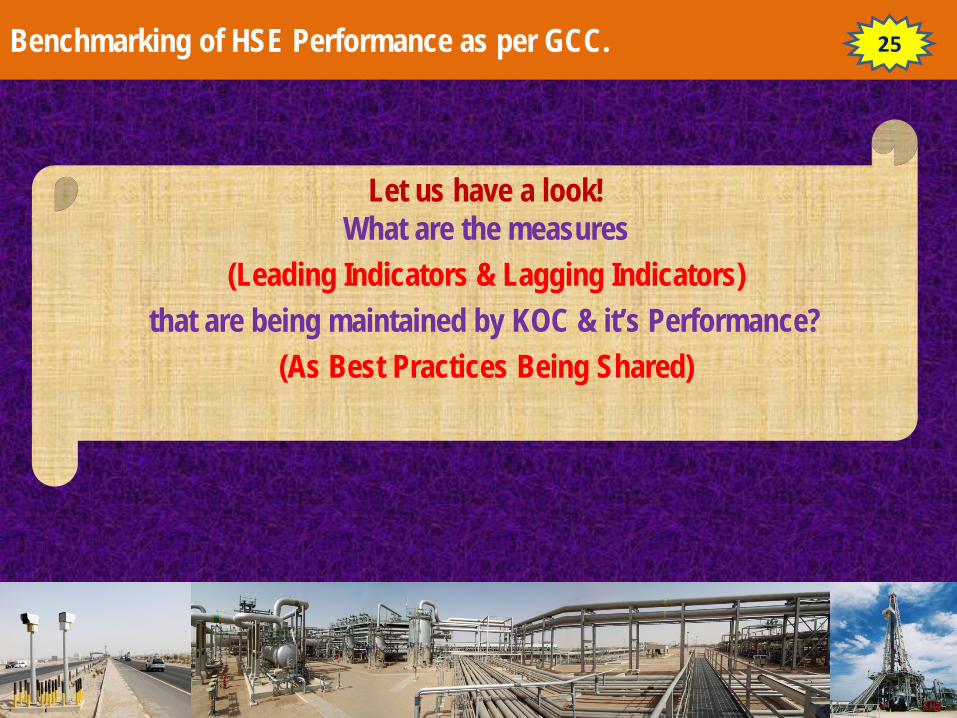
Benchmarking of HSE Performance as per GCC. 25
Let us have a look! What are the measures
(Leading Indicators & Lagging Indicators) that are being maintained by KOC & it’s Performance?
(As Best Practices Being Shared)
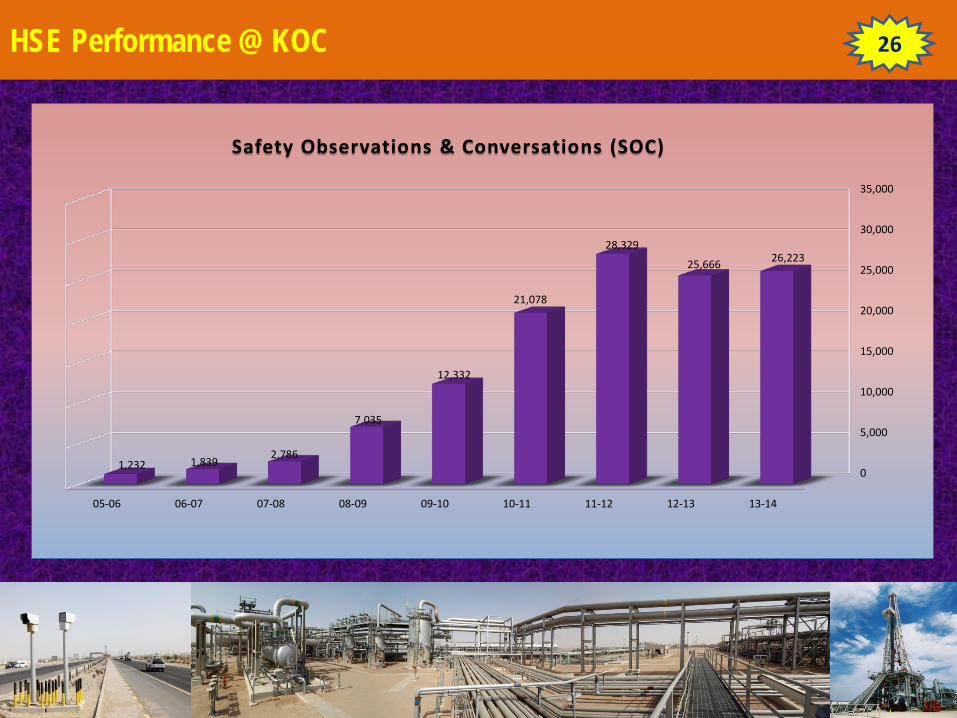
HSE Performance @ KOC 26
0
5,000
10,000
15,000
20,000
25,000
30,000
35,000
05-06 06-07 07-08 08-09 09-10 10-11 11-12 12-13 13-14
1,232 1,839 2,786
7,035
12,332
21,078
28,329
25,666 26,223
Safety Observations & Conversations (SOC)
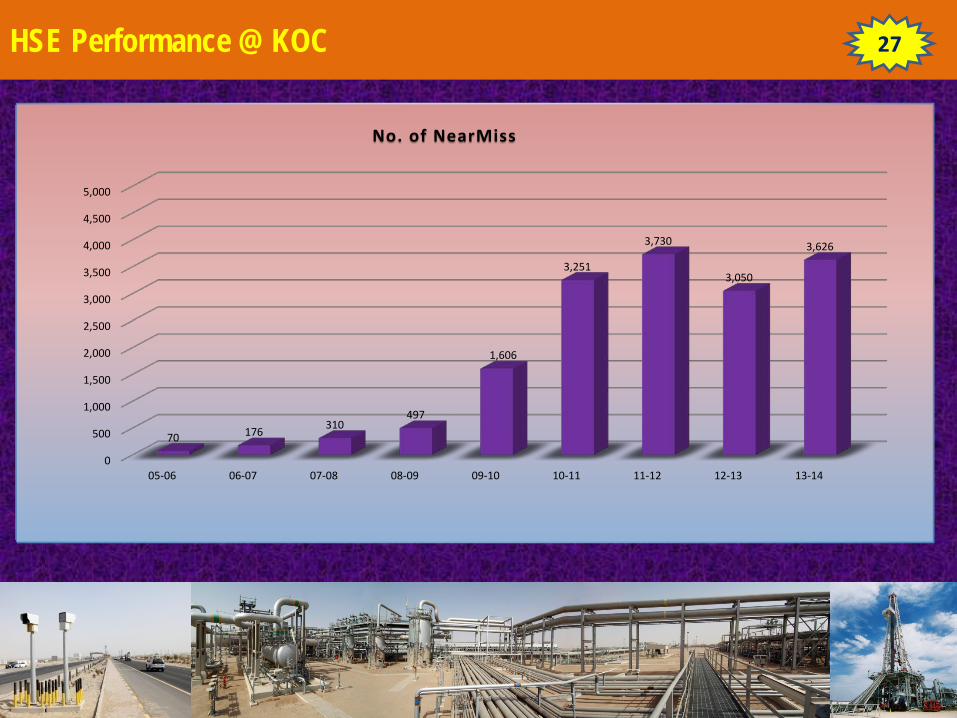
HSE Performance @ KOC 27
0
500
1,000
1,500
2,000
2,500
3,000
3,500
4,000
4,500
5,000
05-06 06-07 07-08 08-09 09-10 10-11 11-12 12-13 13-14
70 176 310 497
1,606
3,251
3,730
3,050
3,626
No. of NearMiss
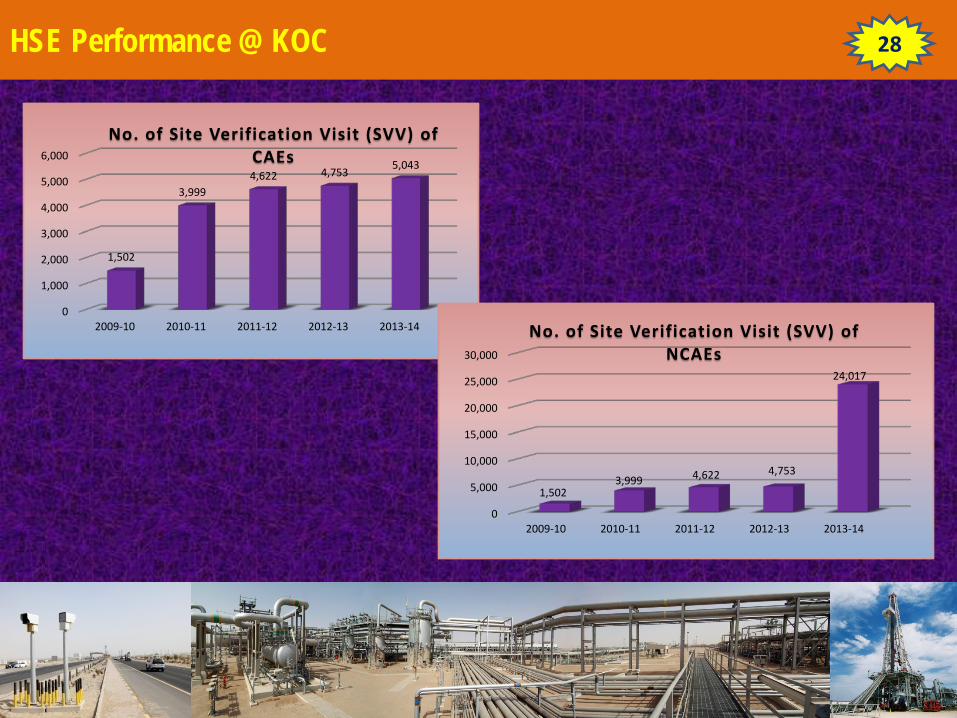
HSE Performance @ KOC 28
0
1,000
2,000
3,000
4,000
5,000
6,000
2009-10 2010-11 2011-12 2012-13 2013-14
1,502
3,999 4,622 4,753 5,043
No. of Site Verification Visit (SVV) of CAEs
0
5,000
10,000
15,000
20,000
25,000
30,000
2009-10 2010-11 2011-12 2012-13 2013-14
1,502 3,999 4,622 4,753
24,017
No. of Site Verification Visit (SVV) of NCAEs
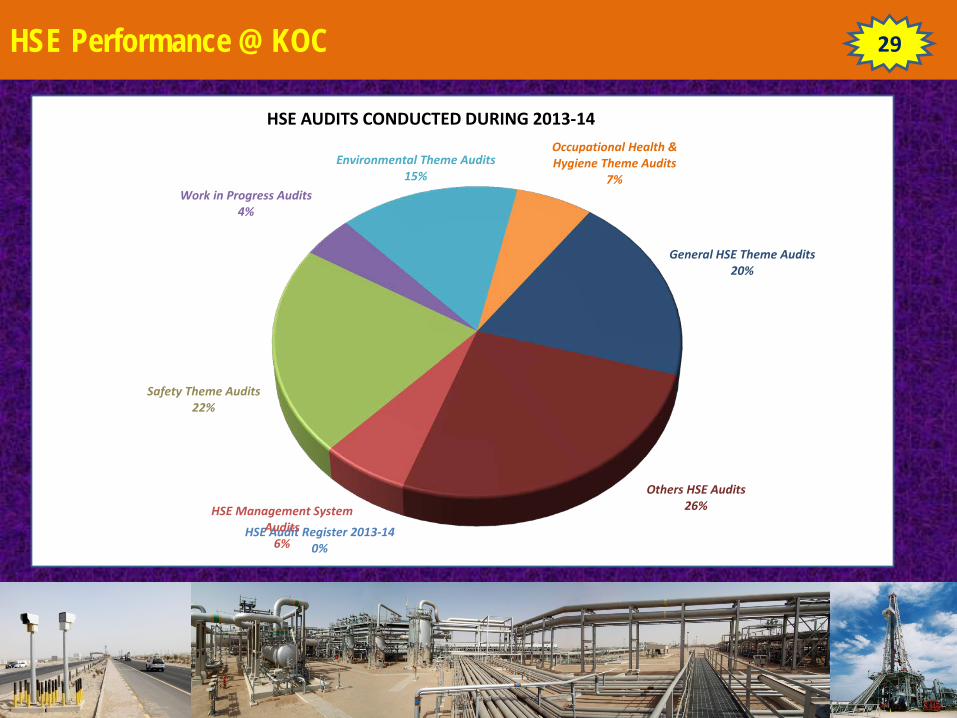
HSE Performance @ KOC 29
HSE Audit Register 2013-14 0%
HSE Management System Audits
6%
Safety Theme Audits 22%
Work in Progress Audits 4%
Environmental Theme Audits 15%
Occupational Health & Hygiene Theme Audits
7%
General HSE Theme Audits 20%
Others HSE Audits 26%
HSE AUDITS CONDUCTED DURING 2013-14
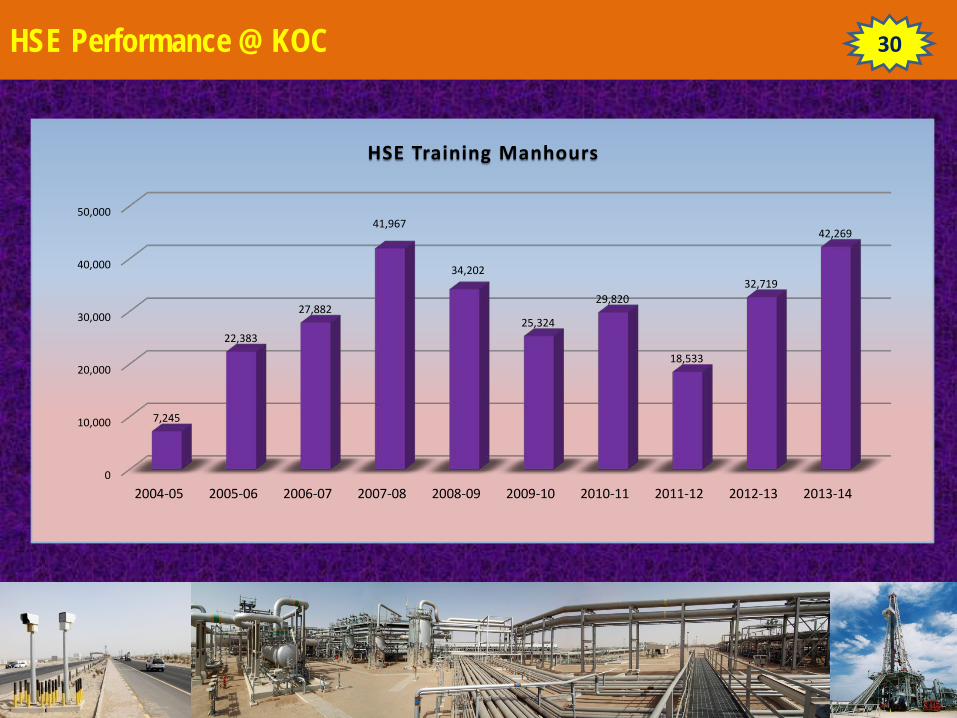
HSE Performance @ KOC 30
0
10,000
20,000
30,000
40,000
50,000
2004-05 2005-06 2006-07 2007-08 2008-09 2009-10 2010-11 2011-12 2012-13 2013-14
7,245
22,383
27,882
41,967
34,202
25,324
29,820
18,533
32,719
42,269
HSE Training Manhours
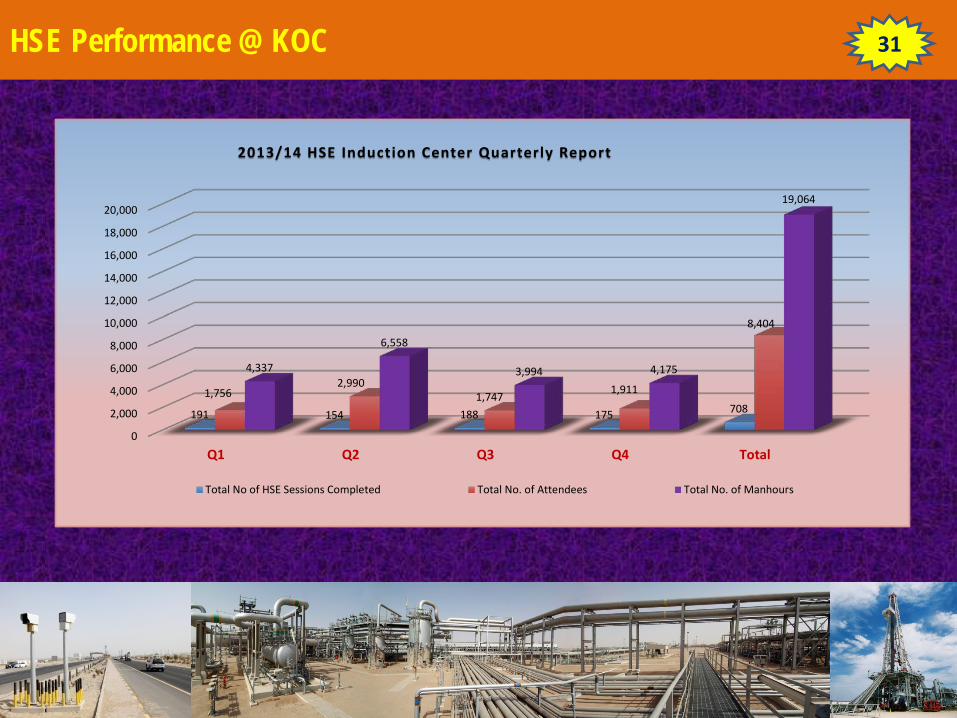
HSE Performance @ KOC 31
0
2,000
4,000
6,000
8,000
10,000
12,000
14,000
16,000
18,000
20,000
Q1 Q2 Q3 Q4 Total
191 154 188 175 708 1,756
2,990 1,747 1,911
8,404
4,337
6,558
3,994 4,175
19,064
2013/14 HSE Induction Center Quarterly Report
Total No of HSE Sessions Completed Total No. of Attendees Total No. of Manhours
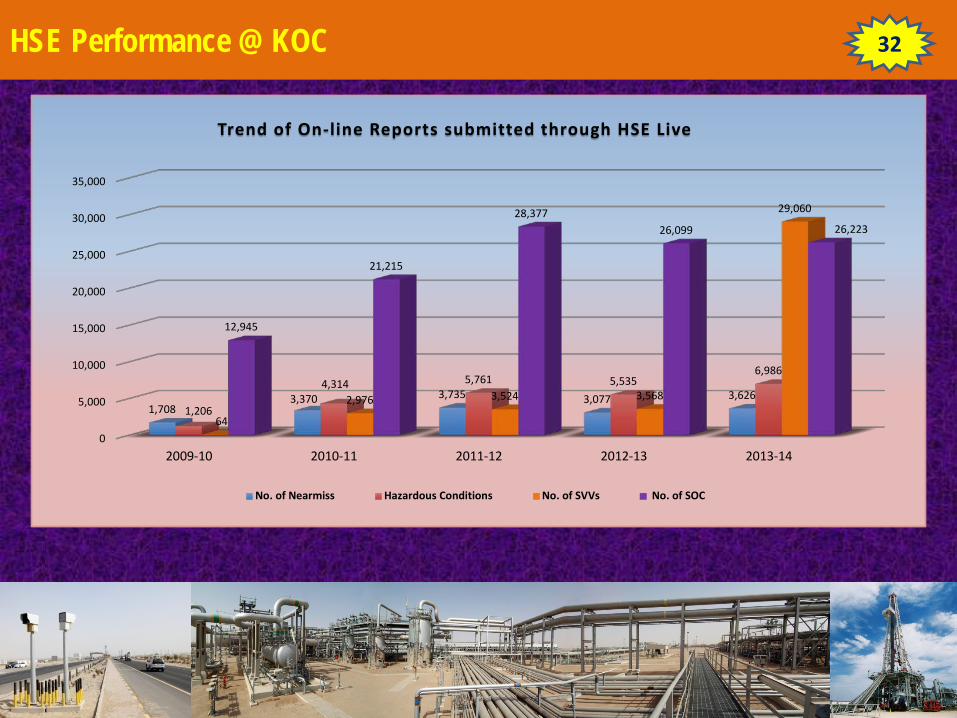
HSE Performance @ KOC 32
0
5,000
10,000
15,000
20,000
25,000
30,000
35,000
2009-10 2010-11 2011-12 2012-13 2013-14
1,708 3,370 3,735 3,077 3,626
1,206
4,314 5,761 5,535 6,986
64
2,976 3,524 3,568
29,060
12,945
21,215
28,377 26,099 26,223
Trend of On-line Reports submitted through HSE Live
No. of Nearmiss Hazardous Conditions No. of SVVs No. of SOC
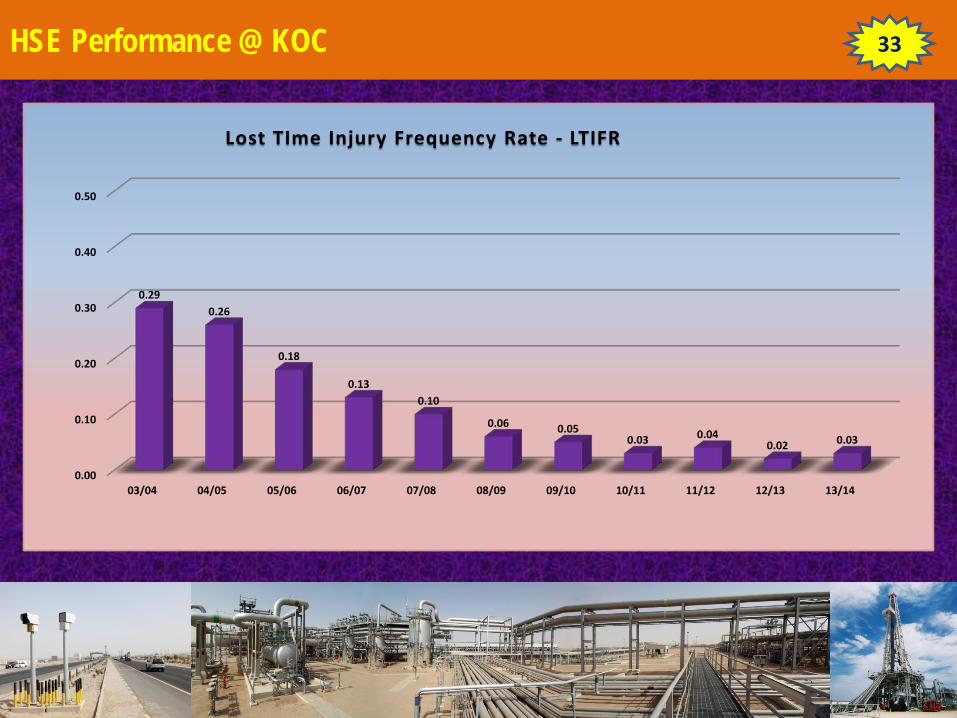
HSE Performance @ KOC 33
0.00
0.10
0.20
0.30
0.40
0.50
03/04 04/05 05/06 06/07 07/08 08/09 09/10 10/11 11/12 12/13 13/14
0.29 0.26
0.18
0.13 0.10
0.06 0.05 0.03 0.04
0.02 0.03
Lost TIme Injury Frequency Rate - LTIFR
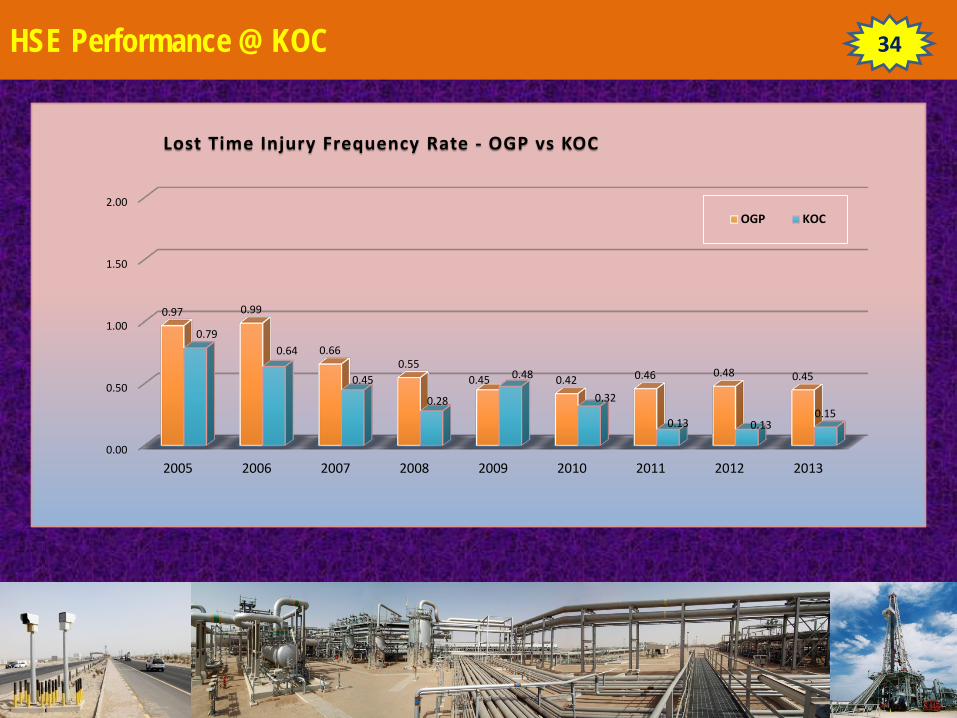
HSE Performance @ KOC 34
0.00
0.50
1.00
1.50
2.00
2005 2006 2007 2008 2009 2010 2011 2012 2013
0.97 0.99
0.66 0.55
0.45 0.42 0.46 0.48 0.45
0.79 0.64
0.45
0.28
0.48
0.32
0.13 0.13 0.15
Lost Time Injury Frequency Rate - OGP vs KOC
OGP KOC
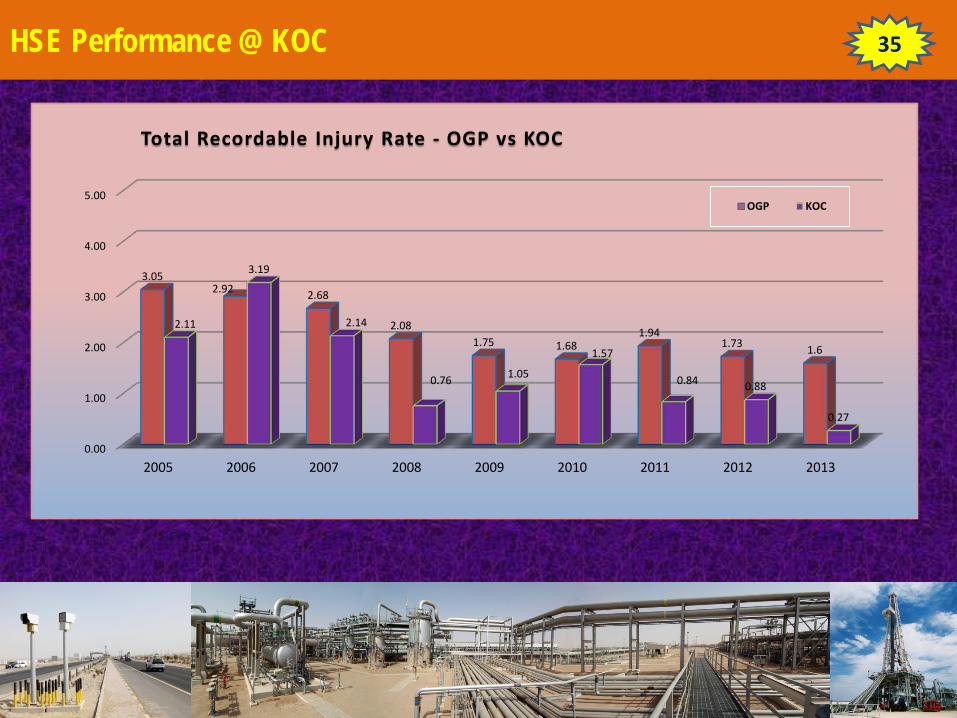
HSE Performance @ KOC 35
0.00
1.00
2.00
3.00
4.00
5.00
2005 2006 2007 2008 2009 2010 2011 2012 2013
3.05 2.92 2.68
2.08 1.75 1.68
1.94 1.73 1.6
2.11
3.19
2.14
0.76 1.05
1.57
0.84 0.88
0.27
Total Recordable Injury Rate - OGP vs KOC
OGP KOC
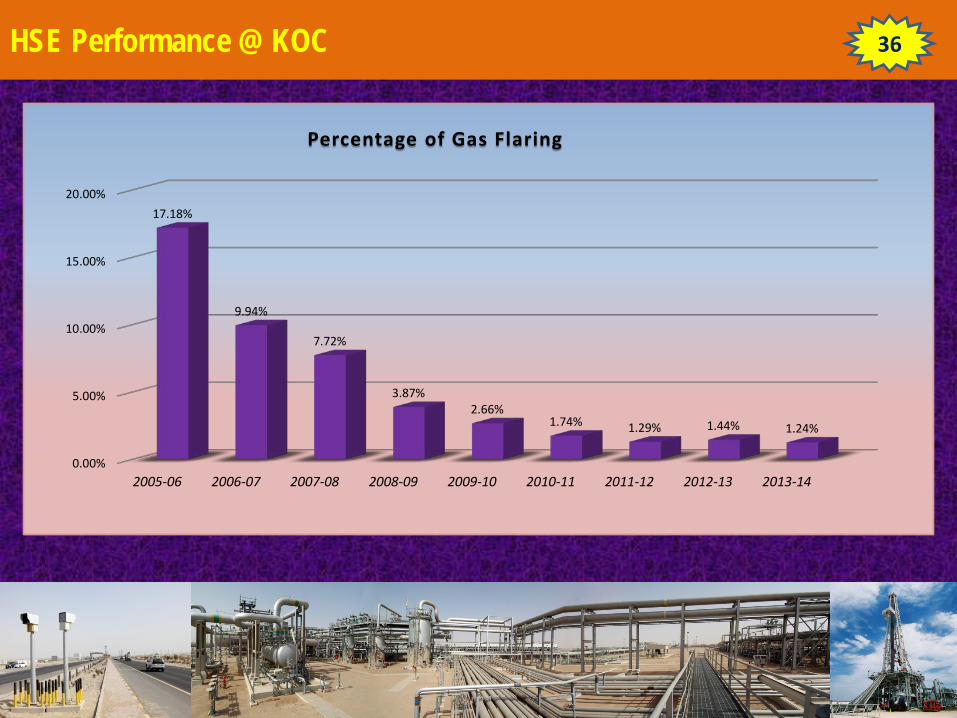
HSE Performance @ KOC 36
0.00%
5.00%
10.00%
15.00%
20.00%
2005-06 2006-07 2007-08 2008-09 2009-10 2010-11 2011-12 2012-13 2013-14
17.18%
9.94%
7.72%
3.87% 2.66%
1.74% 1.29% 1.44% 1.24%
Percentage of Gas Flaring
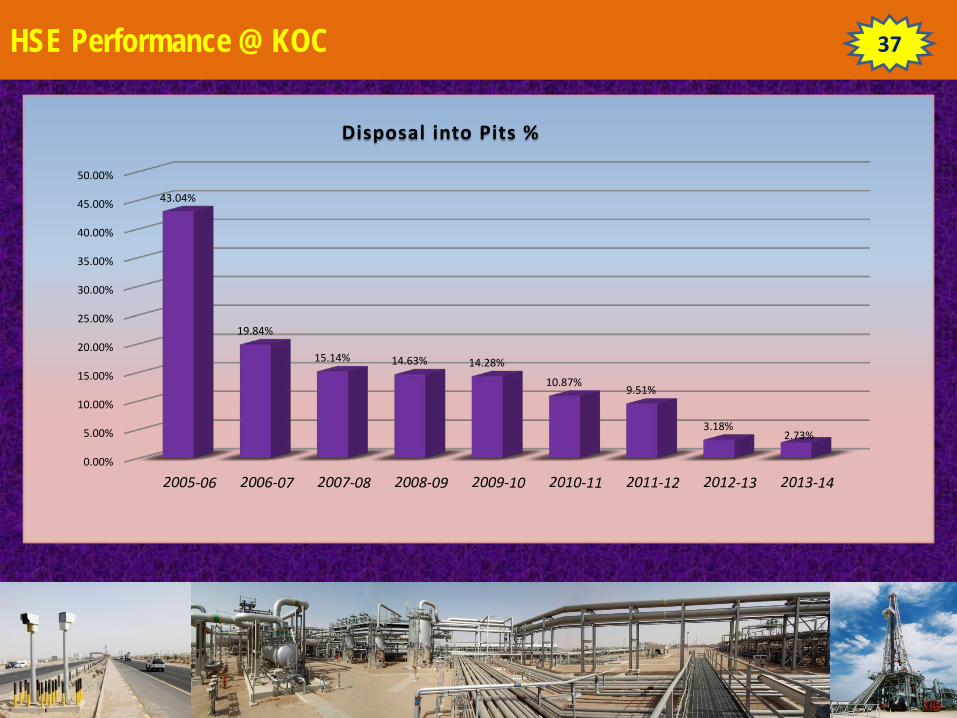
HSE Performance @ KOC 37
0.00%
5.00%
10.00%
15.00%
20.00%
25.00%
30.00%
35.00%
40.00%
45.00%
50.00%
43.04%
19.84%
15.14% 14.63% 14.28%
10.87% 9.51%
3.18% 2.73%
Disposal into Pits %
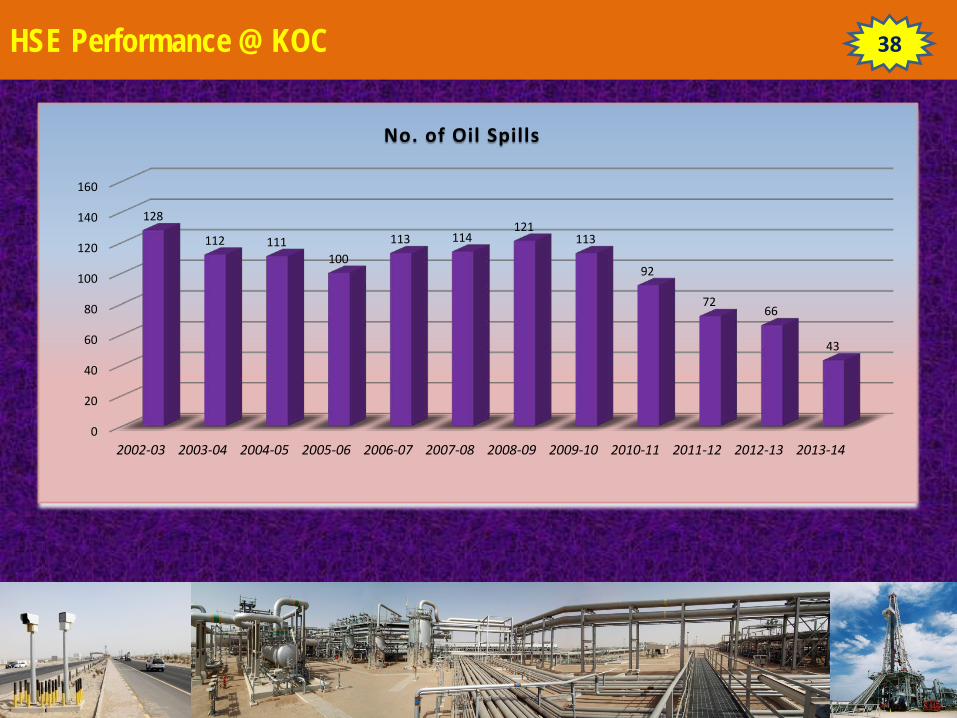
HSE Performance @ KOC 38
0
20
40
60
80
100
120
140
160
2002-03 2003-04 2004-05 2005-06 2006-07 2007-08 2008-09 2009-10 2010-11 2011-12 2012-13 2013-14
128
112 111 100
113 114 121
113
92
72 66
43
No. of Oil Spills
Recommendations?
Always try to Benchmark your HSE Performance Make use of the expertise available. Be part of entities such as OGP, GCC,
IADC…ETC. which is applicable to your company. You need not reinvent the wheel! Verify whether your measures are addressing the problems and enhancing the
employees commitment to achieve? Evaluate your performance periodically Choose Right measures for your company Balanced Score Card Link each measure with some Tolerances/Targets. Set your targets/tolerances based on the Industry average values. If you want to
improve further, you can have stringent targets/tolerances Have sufficient programs to achieve these targets/tolerances.
39
Thanks
With Best wishes from
HSE Group, Kuwait Oil Company