benchmarking of tax administrations - eurosai.org eurosai benchmarking of tax administrations 1...
TRANSCRIPT
Benchmarking of Tax Administrations
Report of the EUROSAI Study Group Prepared by: National Audit Office, SAI of the United Kingdom (Chair) National Audit Office, SAI of Finland Cour des Comptes, SAI of France Najwyższa Izba Kontroli, SAI of Poland Riksrevisionen, SAI of Sweden
March 2008
EUROSAI Benchmarking of Tax Administrations
Contents
1 Introduction 2
2 The benchmarking challenge 3
3 The diversity of tax administrations and the implications for benchmarking 5
4 The performance indicators used by tax administrations and definitions 8
5 Clustering tax administrations to enable meaningful comparisons 14
6 Implications for Supreme Audit Institutions 20
7 Summary and possible discussion points for the EUROSAI congress 25
1
EUROSAI Benchmarking of Tax Administrations
1 Introduction
1.1 The EUROSAI Congress in Bonn in 2005 recommended:
“EUROSAI members should be encouraged to exchange benchmarking information,
definitions and criteria to enable them to compare internationally the costs and performance of tax administrations”
1.2 A Study Group of EUROSAI members chaired by the UK and including Finland, France,
Poland and Sweden gathered information and conducted research into benchmarking the cost and performance of tax administrations, to illustrate benchmarking in practice and to identify the challenges faced when comparing performance internationally. The Group intend
to present their findings in a Report to the VII EUROSAI Congress in Krakow in 2008.
1.3 The Group met several times and drew on the experience of members’ respective tax administrations to bring together performance information and identify good practice
examples of performance indicators which could be used to assess the respective costs and performance of tax administrations.
1.4 The Group commissioned RAND Europe1 to undertake a wider review of performance
indicators used by tax administrations within and outside Europe This included work done by other international organisations such as the World Bank and the OECD, in particular the OECD report “Tax Administration in OECD and Selected Non-OECD Countries: Comparative
Information Series (2006)” published in February 2007. Representatives from the OECD and from the Office of the Auditor General in Canada attended meetings of the Group and provided their perspectives.
1.5 The Group developed a categorisation of performance measures to enable further analysis, identifying three main categories of performance indicator: Compliance, Cost, and Quality and Service. The performance indicators provide a basis for assessing the
performance of tax administrations taking account of the complexity of the tax administration and their priorities.
1.6 In November 2006 the Group surveyed all EUROSAI members to gather information on
their tax administration, the categories of performance indicators used and to collect specific information on VAT to illustrate benchmarking in practice on a common area of activity (Appendices 2 and 3 of the technical note). Over seventy per cent of audit institutions in the
EUROSAI community returned completed questionnaires. The Group’s methodology is set out in Appendix 1of the technical note2. The Study Group would like to thank EUROSAI members and their respective tax administrations for their assistance in gathering the data for
this report.
1 RAND Europe is an independent not-for-profit policy research organisation with clients across Europe including governments, institutions, and firms (www.rand.org). 2 The survey data will available to interested SAIs after the Congress.
2
EUROSAI Benchmarking of Tax Administrations
2 The benchmarking challenge
2.1 Tax administrations are in the same business of collecting taxes and have many common
functions such as processing tax returns, debt management and conducting tax audits and inspections. However tax administrations vary in organisation, operations, functions, tax policy and priorities. In addition the definitions, completeness and robustness of underlying
performance data, and comparability of what appear to be similar functions in different environments can cloud rather than illuminate the benchmarking process. It is this diversity which presents the biggest challenge to comparing internationally the costs and performance
of tax administrations, but comparing performance information may identify good performance and provide good practice.
For example from our survey:
37 per cent of countries have a single tax administration; the remainder have more than one organisation administering taxes.
77 per cent of countries’ tax administrations also perform non-tax related functions such
as collecting social security contributions.
45 per cent share support services with other government departments.
2.2 Comparing costs and performance is only the first step in the process. The second stage is to identify the reasons for differences in performance so that good practice in the
administration of tax can be shared. Audit institutions can have an important role in identifying sound performance indicators, promoting good practice and benchmarking the performance of tax administrations.
Performance and costs of tax administrations
2.3 The Group found that the measurement of performance varies between countries and this, in part, reflects the different institutional set-ups, range of activities and performance
measurement systems and indicators and differing strategies of tax administrations. Cost is one measure of performance but comparing the costs of tax administrations is not straightforward. There are often differences between tax administrations in the way costs are
calculated and attributed to aggregate administration costs. For instance, the OECD has found that there is no ‘universally’ accepted definition for the measurement of administrative costs.3
3 ‘Support to the EUROSAI Steering Group on the Benchmarking of Tax Administrations’ (October 2006) RAND Europe report section 16 and OECD Tax Administration in OECD and Selected Non-OECD Countries: Comparative Information Series (2004)
3
EUROSAI Benchmarking of Tax Administrations
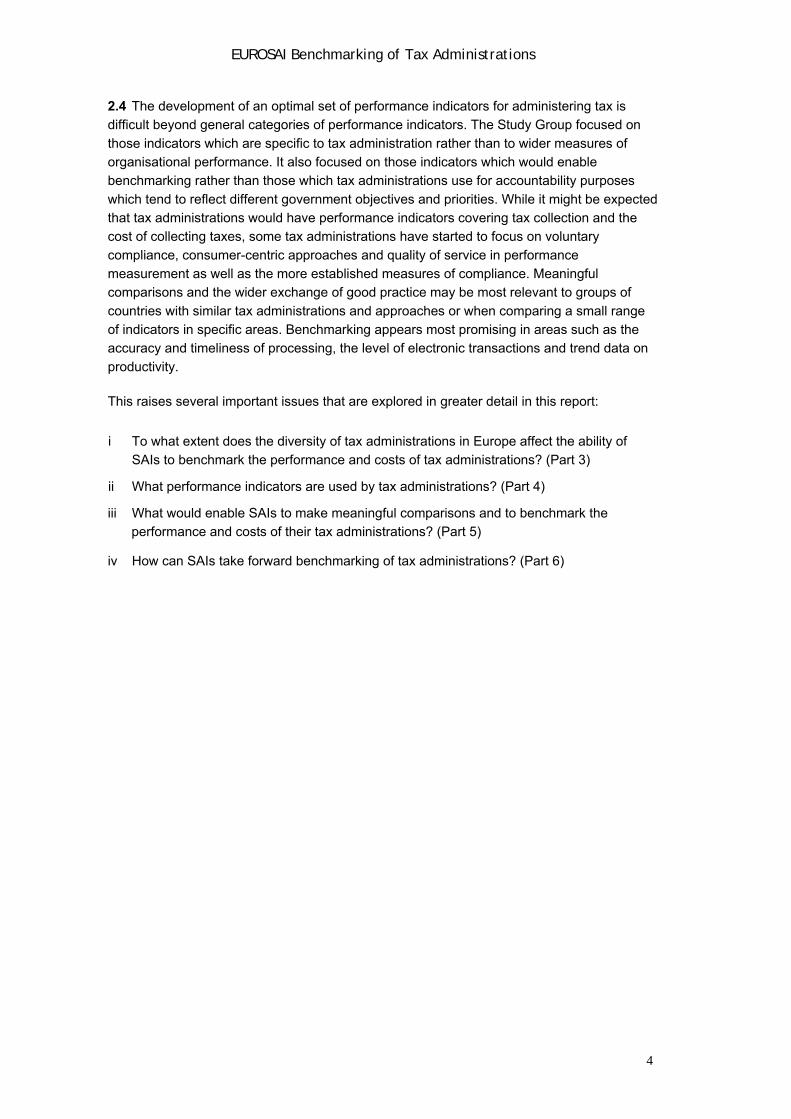
2.4 The development of an optimal set of performance indicators for administering tax is difficult beyond general categories of performance indicators. The Study Group focused on
those indicators which are specific to tax administration rather than to wider measures of organisational performance. It also focused on those indicators which would enable benchmarking rather than those which tax administrations use for accountability purposes
which tend to reflect different government objectives and priorities. While it might be expected that tax administrations would have performance indicators covering tax collection and the cost of collecting taxes, some tax administrations have started to focus on voluntary
compliance, consumer-centric approaches and quality of service in performance measurement as well as the more established measures of compliance. Meaningful comparisons and the wider exchange of good practice may be most relevant to groups of
countries with similar tax administrations and approaches or when comparing a small range of indicators in specific areas. Benchmarking appears most promising in areas such as the accuracy and timeliness of processing, the level of electronic transactions and trend data on
productivity.
This raises several important issues that are explored in greater detail in this report:
i To what extent does the diversity of tax administrations in Europe affect the ability of SAIs to benchmark the performance and costs of tax administrations? (Part 3)
ii What performance indicators are used by tax administrations? (Part 4)
iii What would enable SAIs to make meaningful comparisons and to benchmark the performance and costs of their tax administrations? (Part 5)
iv How can SAIs take forward benchmarking of tax administrations? (Part 6)
4
EUROSAI Benchmarking of Tax Administrations
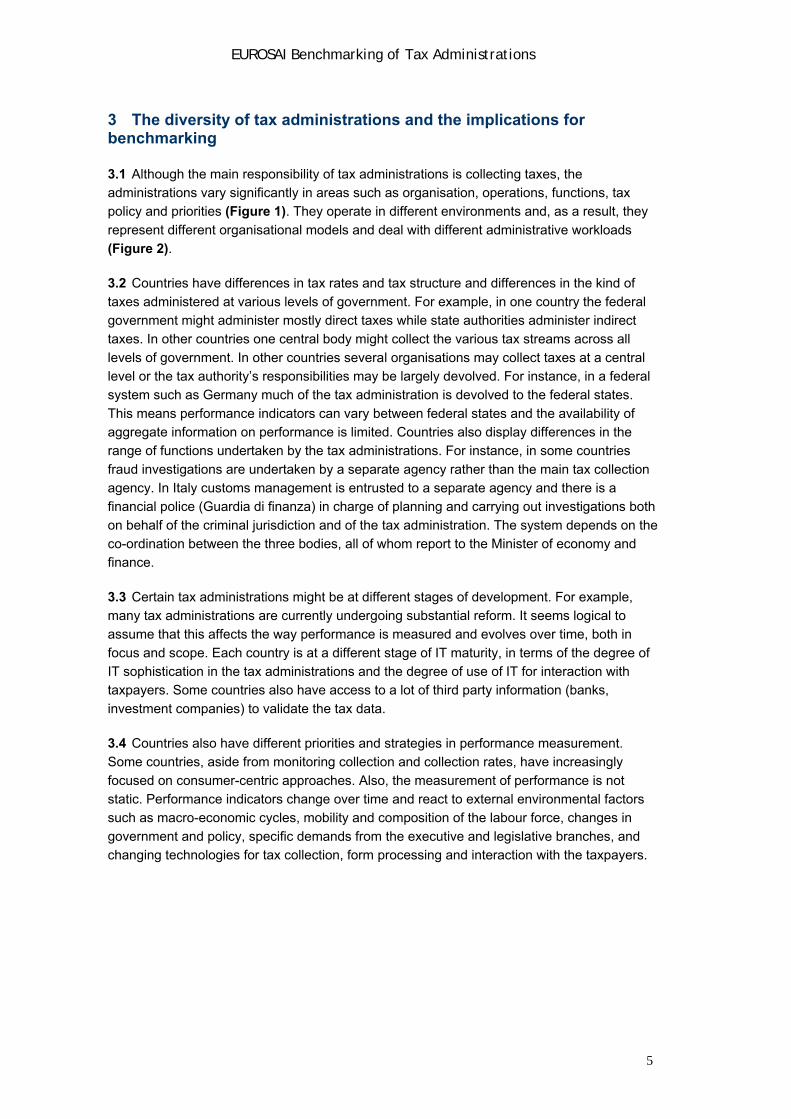
3 The diversity of tax administrations and the implications for benchmarking
3.1 Although the main responsibility of tax administrations is collecting taxes, the administrations vary significantly in areas such as organisation, operations, functions, tax policy and priorities (Figure 1). They operate in different environments and, as a result, they
represent different organisational models and deal with different administrative workloads (Figure 2).
3.2 Countries have differences in tax rates and tax structure and differences in the kind of
taxes administered at various levels of government. For example, in one country the federal government might administer mostly direct taxes while state authorities administer indirect taxes. In other countries one central body might collect the various tax streams across all
levels of government. In other countries several organisations may collect taxes at a central level or the tax authority’s responsibilities may be largely devolved. For instance, in a federal system such as Germany much of the tax administration is devolved to the federal states.
This means performance indicators can vary between federal states and the availability of aggregate information on performance is limited. Countries also display differences in the range of functions undertaken by the tax administrations. For instance, in some countries
fraud investigations are undertaken by a separate agency rather than the main tax collection agency. In Italy customs management is entrusted to a separate agency and there is a financial police (Guardia di finanza) in charge of planning and carrying out investigations both
on behalf of the criminal jurisdiction and of the tax administration. The system depends on the co-ordination between the three bodies, all of whom report to the Minister of economy and finance.
3.3 Certain tax administrations might be at different stages of development. For example, many tax administrations are currently undergoing substantial reform. It seems logical to assume that this affects the way performance is measured and evolves over time, both in
focus and scope. Each country is at a different stage of IT maturity, in terms of the degree of IT sophistication in the tax administrations and the degree of use of IT for interaction with taxpayers. Some countries also have access to a lot of third party information (banks,
investment companies) to validate the tax data.
3.4 Countries also have different priorities and strategies in performance measurement. Some countries, aside from monitoring collection and collection rates, have increasingly
focused on consumer-centric approaches. Also, the measurement of performance is not static. Performance indicators change over time and react to external environmental factors such as macro-economic cycles, mobility and composition of the labour force, changes in
government and policy, specific demands from the executive and legislative branches, and changing technologies for tax collection, form processing and interaction with the taxpayers.
5
EUROSAI Benchmarking of Tax Administrations
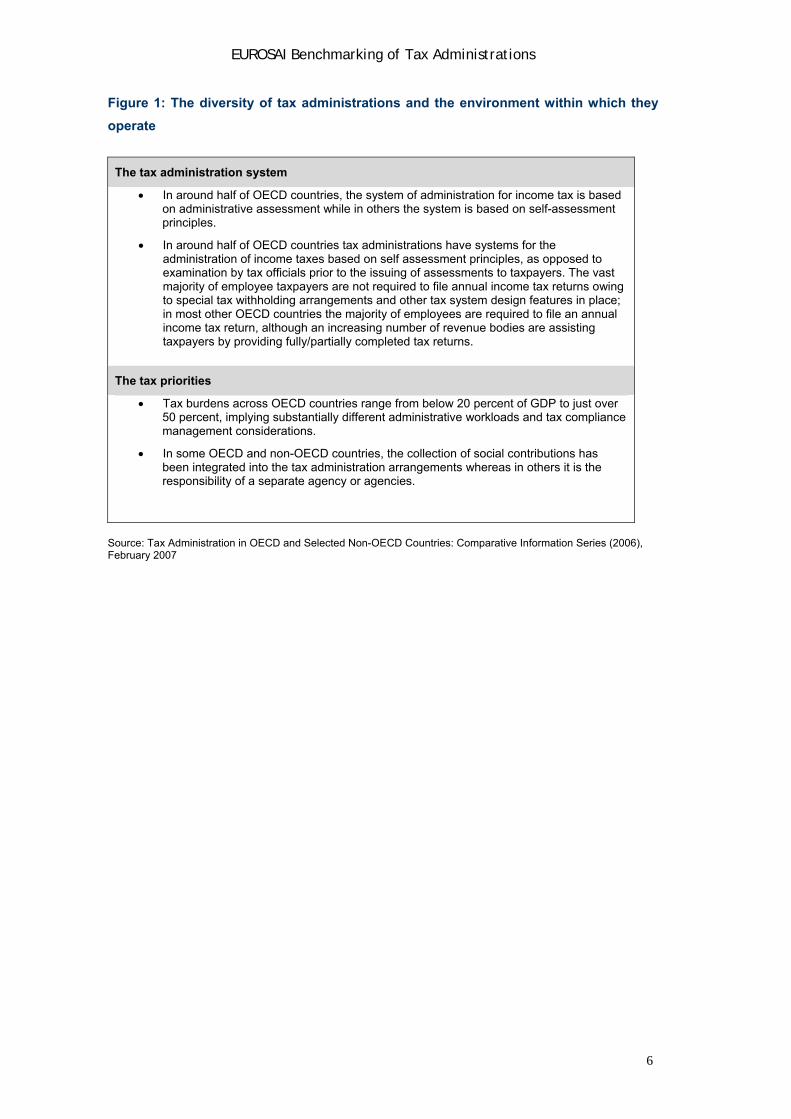
Figure 1: The diversity of tax administrations and the environment within which they
operate
The tax administration system
In around half of OECD countries, the system of administration for income tax is based on administrative assessment while in others the system is based on self-assessment principles.
In around half of OECD countries tax administrations have systems for the administration of income taxes based on self assessment principles, as opposed to examination by tax officials prior to the issuing of assessments to taxpayers. The vast majority of employee taxpayers are not required to file annual income tax returns owing to special tax withholding arrangements and other tax system design features in place; in most other OECD countries the majority of employees are required to file an annual income tax return, although an increasing number of revenue bodies are assisting taxpayers by providing fully/partially completed tax returns.
The tax priorities
Tax burdens across OECD countries range from below 20 percent of GDP to just over 50 percent, implying substantially different administrative workloads and tax compliance management considerations.
In some OECD and non-OECD countries, the collection of social contributions has been integrated into the tax administration arrangements whereas in others it is the responsibility of a separate agency or agencies.
Source: Tax Administration in OECD and Selected Non-OECD Countries: Comparative Information Series (2006), February 2007
6
EUROSAI Benchmarking of Tax Administrations
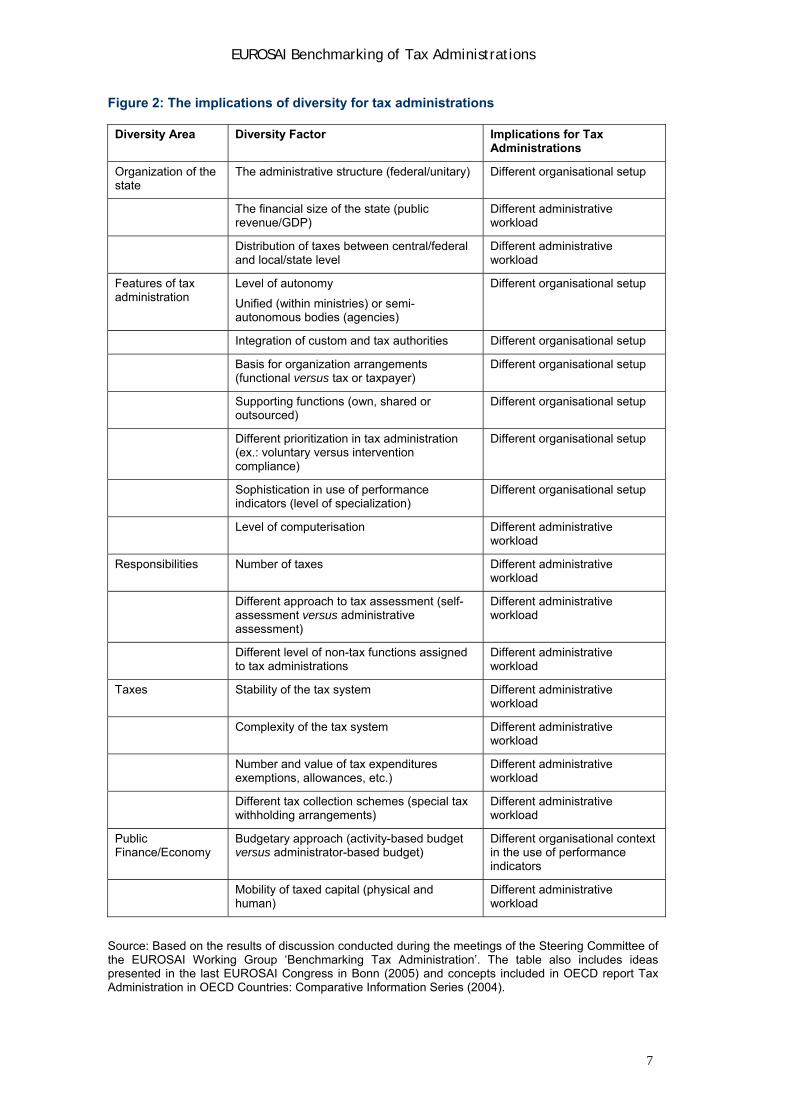
Figure 2: The implications of diversity for tax administrations
Diversity Area Diversity Factor Implications for Tax Administrations
Organization of the state
The administrative structure (federal/unitary) Different organisational setup
The financial size of the state (public revenue/GDP)
Different administrative workload
Distribution of taxes between central/federal and local/state level
Different administrative workload
Features of tax administration
Level of autonomy
Unified (within ministries) or semi-autonomous bodies (agencies)
Different organisational setup
Integration of custom and tax authorities Different organisational setup
Basis for organization arrangements (functional versus tax or taxpayer)
Different organisational setup
Supporting functions (own, shared or outsourced)
Different organisational setup
Different prioritization in tax administration (ex.: voluntary versus intervention compliance)
Different organisational setup
Sophistication in use of performance indicators (level of specialization)
Different organisational setup
Level of computerisation Different administrative workload
Responsibilities Number of taxes Different administrative workload
Different approach to tax assessment (self-assessment versus administrative assessment)
Different administrative workload
Different level of non-tax functions assigned to tax administrations
Different administrative workload
Taxes Stability of the tax system Different administrative workload
Complexity of the tax system Different administrative workload
Number and value of tax expenditures exemptions, allowances, etc.)
Different administrative workload
Different tax collection schemes (special tax withholding arrangements)
Different administrative workload
Public Finance/Economy
Budgetary approach (activity-based budget versus administrator-based budget)
Different organisational context in the use of performance indicators
Mobility of taxed capital (physical and human)
Different administrative workload
Source: Based on the results of discussion conducted during the meetings of the Steering Committee of the EUROSAI Working Group ‘Benchmarking Tax Administration’. The table also includes ideas presented in the last EUROSAI Congress in Bonn (2005) and concepts included in OECD report Tax Administration in OECD Countries: Comparative Information Series (2004).
7
EUROSAI Benchmarking of Tax Administrations
4 The performance indicators used by tax administrations and definitions
4.1 Most performance indicators used by government organisations cover economy, effectiveness and efficiency. Economy is about keeping the cost low, efficiency is about
getting the most or best output from available resources and effectiveness is about achieving the stipulated aims or objectives4. The Group’s analysis of the questionnaire responses from SAIs, OECD reports5 and the research commissioned from RAND Europe6 revealed that the
performance indicators used by tax administrations can be grouped into three main categories - compliance, cost and quality and service. However it should be noted that some indicators could be placed under more than one category as they may refer to activity that
has more than one purpose. For example, activities aiming to improve quality and service, such as improving the provision of advice and guidance, will also have an effect on compliance.
Compliance
4.2 ‘Compliance’ will essentially relate to the extent to which a taxpayer meets their
obligations. While the exact obligations placed on a taxpayer are going to vary from one taxation role to another and from one jurisdiction to the next, there are broad categories of obligation that are likely to exist for almost all taxpayers, irrespective of jurisdiction. The
OECD defines these as:
Registration in the system
Timely filing or lodgement of requisite taxation information
Reporting of complete and accurate information (incorporating good record keeping)
Payment of taxation obligations on time.
If taxpayers fail to meet any of the above obligations then they may be considered to be non-compliant. However, the OECD stresses that there are clearly different degrees of non-
compliance.7 4.3 The Group’s work has identified two broad categories of compliance indicators; voluntary
compliance by the taxpayer and intervention by the tax authority. The two categories are interdependent as the taxpayers’ voluntary compliance can affect the tax administrations’ intervention and vice versa.
4 INTOSAI Implementation Guidelines for Performance Auditing 2004, pages 15-20 5 Tax Administration in OECD and Selected Non-OECD Countries: Comparative Information Series (2006), February 2007 6 ‘Support to the EUROSAI Steering Group on the Benchmarking of Tax Administrations’ (October 2006) RAND Europe 7 OECD Guidance Note “Compliance Risk Management: Managing and improving Tax Compliance”, page 7.
8
EUROSAI Benchmarking of Tax Administrations
On voluntary compliance the Group subcategorised the indicators according to the following:
i Filing - Timely filing or lodgement of requisite taxation information
ii Payment on time of taxes debited - One type of indicator reflecting this category could be
indicators on delay charges / interest on late payments or alternatively, indicators on the share of taxes paid on time.
On interventions by the tax administration the Group subdivided these into:
i Tax gap - This term defines generally the difference between the amount of tax that is possible to charge according to fiscal law (theoretical tax) and the amount that is actually
debited. The tax gap may in turn be divided into two sub-terms: the Assessment gap being the difference between the theoretical tax and the taxes assessed and the Collection gap being the difference between taxes assessed and taxes debited. To
reduce the tax gap, the tax administration needs to be able to measure its size and composition. Estimations and indicators of the tax gap may be based on bottom-up models or top-down estimates or a combination of both models. Bottom-up models are
based on source data from samples of specific surveys or of individual tax records and tribunal or court cases and extrapolated across the relevant population. Top-down estimates use macroeconomic data from national accounts to calculate the total tax
revenue the tax administration should collect (the theoretical tax). Actual tax revenues are subtracted from such calculations to provide an estimate of the tax gap.8
ii Debt collection (tax arrears and collection losses) - Taxes not paid on time result in tax arrears. If a tax remains unpaid after a reminder, the tax administration normally applies a procedure of enforced debt collection. In some countries, taxes demanded but not paid
within a certain period of time (for example five years) are normally written off. These amounts could be referred to as collection losses. According to the OECD, a number of debt management powers are fairly universal across tax administrations. These may
include powers to9: grant extensions of time to pay;
formulate payment arrangements; collect tax debts through specific third parties who owe money to a taxpayer or hold
money on their account;
offset taxpayers’ tax debts against credits arising under other taxes; initiate (or arrange for) seizure action; and initiate bankruptcy/ liquidation action.
8 Draft report of the Core Group of the European VAT Working Group, for its meeting in Vilnius, 2005, section 6. 9 OECD, Tax Administration in OECD and Selected Non-OECD Countries: Comparative Information Series (2006), Prepared by the Forum on Tax Administration, section 91.
9
EUROSAI Benchmarking of Tax Administrations
iii Compliance checks (including tax audits or inspections) – These are intended to prevent and remedy errors and fraud so that the state receives the expected revenue. The
definition of a tax audit varies between countries, for example both desk audits and field audits (outside the premises of the tax administration) could be classified under audit. This illustrates how differences in definitions of indicators can make comparisons difficult.
iv Intervention of jurisdiction – Assessment decisions by tax authorities are not final but are subject to challenge before the courts. The level of successful challenges against the tax authority’s assessment decision could be a useful indicator for the quality of a tax
authority’s assessment function.
Cost
4.4 This category covers the cost of the tax administration and the efficiency of its operations.
The OECD report found that salary is the single largest item for tax administrations (sixty to ninety per cent of total tax administration costs in two thirds of countries surveyed). The category also covers the cost to the taxpayer or the ‘administrative burden’. While the cost
indicators collected in the questionnaire focus more heavily on the cost to the tax administration, a number of tax administrations have indicators which focus on reducing the costs to compliant taxpayers and businesses, for example through shorter forms and better
guidance. The cost to the taxpayer could also be used as an objective and clear indicator of quality and service as it can be actually and measurably perceived by taxpayers.
4.5 INTOSAI guidelines10 define efficiency as making the most of available resources.
Applied to the cost category, the question could be whether the tax administration is getting the most output – in terms of quantity and quality – from its inputs and actions. The disparity in definitions and in the way the data is collected suggest that for benchmarking purposes the
most useful sub-groups of efficiency indicators could be:
i Costs over time and cost ratios (e.g. administrative costs to collection)
ii Productivity (e.g. number of staff per taxpayer, number of staff per return)
However these measures need careful interpretation as the OECD report also observed that
cost of collection ratios (the ratio of tax administration costs to tax revenue collection) and relative staffing levels can vary substantially, due in part to factors unrelated to efficiency and effectiveness such as the scope of the taxes and non-tax related activities.
10 INTOSAI Implementation Guidelines for Performance Auditing
10
EUROSAI Benchmarking of Tax Administrations
Quality and Service
4.6 A number of tax administrations have increasingly developed indicators to measure the overall quality of the tax administrations and the quality of service provided to taxpayers. Some of the indicators in this category could also be used to assess compliance, as tax
administrations’ quality and service have an indirect effect on compliance. An indicator in this category could be either a ‘way and means’ indicator (for example, measuring the number of minutes a customer waits on the phone) or a final indicator (for example, measuring customer
satisfaction with how their call has been dealt with). The weakness of the first category is that you are measuring directly the quality of service, without having any information about how it is perceived by tax payers. The problem of the second category is that customer satisfaction
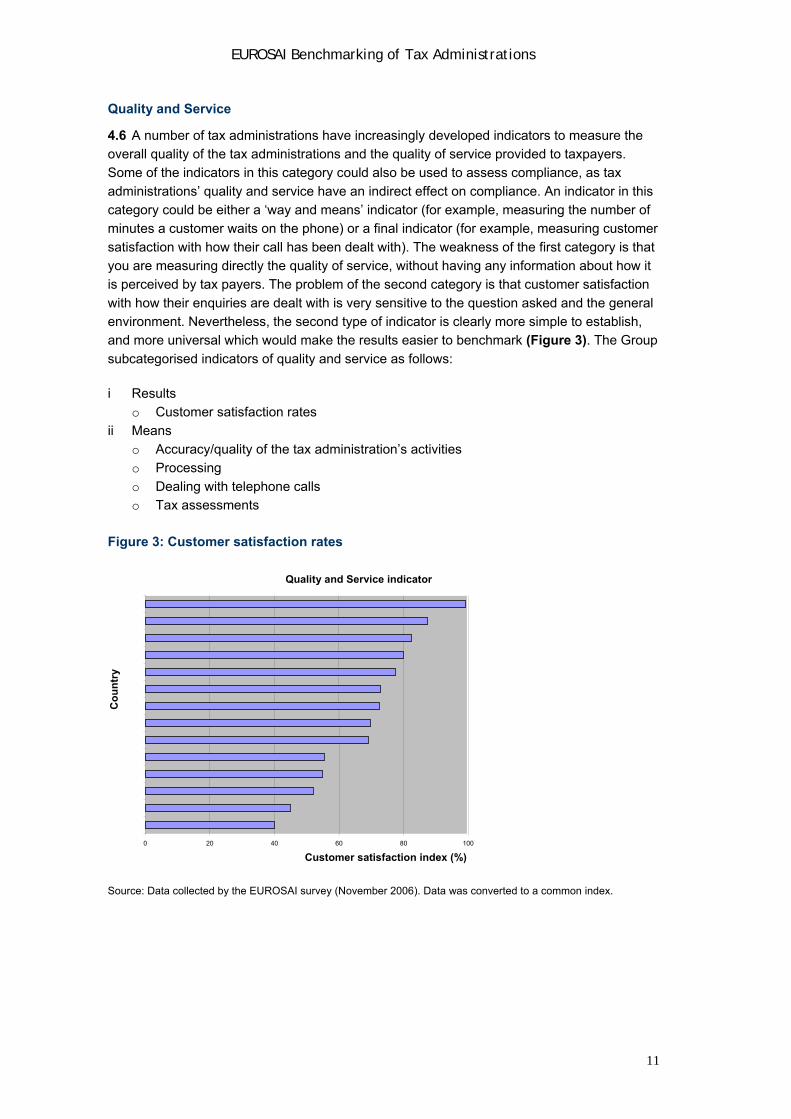
with how their enquiries are dealt with is very sensitive to the question asked and the general environment. Nevertheless, the second type of indicator is clearly more simple to establish, and more universal which would make the results easier to benchmark (Figure 3). The Group
subcategorised indicators of quality and service as follows:
i Results o Customer satisfaction rates
ii Means o Accuracy/quality of the tax administration’s activities o Processing
o Dealing with telephone calls o Tax assessments
Figure 3: Customer satisfaction rates
Quality and Service indicator
40 20 0
Co
un
try
60 80 100
Customer satisfaction index (%)
Source: Data collected by the EUROSAI survey (November 2006). Data was converted to a common index.
11
EUROSAI Benchmarking of Tax Administrations
Use of Performance indicators
4.7 Tax administrations use a wide range of different performance measures to track their own performance. The definition of the indicator is important to enable comparisons to be made between tax administrations. Sub-dividing the indicators into subgroups enables the
indicators to be better defined for use by SAIs. The analysis has also identified indicators which appear to measure more than one area of performance and indicators which depend on the modernity of the tax administration.
4.8 In using any specific indicator to benchmark a tax administration the indicator should be measurable, time-related and comparable. These characteristics would define a ‘good’ measure of performance as the information is able to be measured, can be measured over
time to determine trends in performance, and is comparable with other countries and therefore able to be used in benchmarking performance internationally. A good performance indicator should describe outputs or achievements rather than the activity itself. At their best,
indicators can be used to draw up time series to illustrate the development over a longer period of time or to enable comparisons between different actors. Performance factors also include operational quality and quality management. Quality can be examined as an internal
concept, closely related to efficiency, but operational quality can also be examined externally when it is closer to the concept of effectiveness. The reference then is the quality of the product itself.
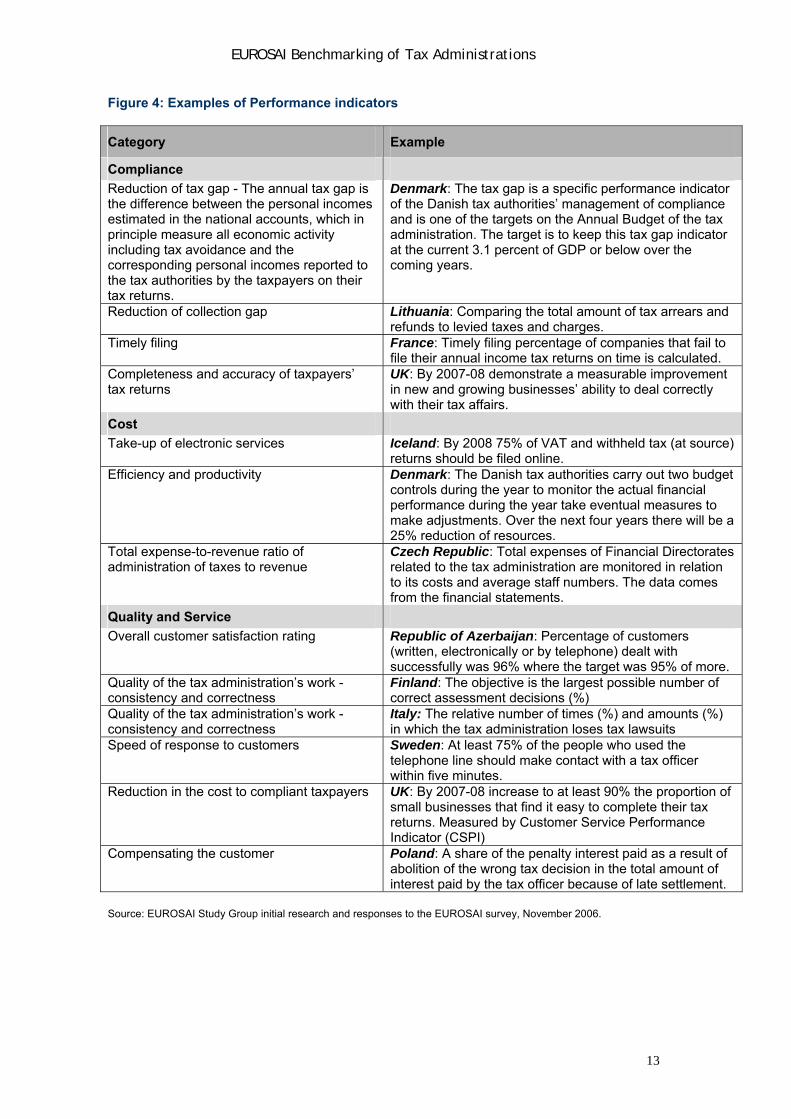
4.9 Figure 4 provides examples of indicators that are measurable, time-related and comparable, drawn from responses to the EUROSAI survey. Taking these factors into account, the group has identified a set of common measures which SAIs might encourage
their tax administrations to apply to improve measurement of their performance and to move towards greater comparability of performance.
12
EUROSAI Benchmarking of Tax Administrations
Figure 4: Examples of Performance indicators
Category Example
Compliance
Reduction of tax gap - The annual tax gap is the difference between the personal incomes estimated in the national accounts, which in principle measure all economic activity including tax avoidance and the corresponding personal incomes reported to the tax authorities by the taxpayers on their tax returns.
Denmark: The tax gap is a specific performance indicator of the Danish tax authorities’ management of compliance and is one of the targets on the Annual Budget of the tax administration. The target is to keep this tax gap indicator at the current 3.1 percent of GDP or below over the coming years.
Reduction of collection gap Lithuania: Comparing the total amount of tax arrears and refunds to levied taxes and charges.
Timely filing France: Timely filing percentage of companies that fail to file their annual income tax returns on time is calculated.
Completeness and accuracy of taxpayers’ tax returns
UK: By 2007-08 demonstrate a measurable improvement in new and growing businesses’ ability to deal correctly with their tax affairs.
Cost
Take-up of electronic services Iceland: By 2008 75% of VAT and withheld tax (at source) returns should be filed online.
Efficiency and productivity Denmark: The Danish tax authorities carry out two budget controls during the year to monitor the actual financial performance during the year take eventual measures to make adjustments. Over the next four years there will be a 25% reduction of resources.
Total expense-to-revenue ratio of administration of taxes to revenue
Czech Republic: Total expenses of Financial Directorates related to the tax administration are monitored in relation to its costs and average staff numbers. The data comes from the financial statements.
Quality and Service
Overall customer satisfaction rating Republic of Azerbaijan: Percentage of customers (written, electronically or by telephone) dealt with successfully was 96% where the target was 95% of more.
Quality of the tax administration’s work - consistency and correctness
Finland: The objective is the largest possible number of correct assessment decisions (%)
Quality of the tax administration’s work - consistency and correctness
Italy: The relative number of times (%) and amounts (%) in which the tax administration loses tax lawsuits
Speed of response to customers Sweden: At least 75% of the people who used the telephone line should make contact with a tax officer within five minutes.
Reduction in the cost to compliant taxpayers UK: By 2007-08 increase to at least 90% the proportion of small businesses that find it easy to complete their tax returns. Measured by Customer Service Performance Indicator (CSPI)
Compensating the customer Poland: A share of the penalty interest paid as a result of abolition of the wrong tax decision in the total amount of interest paid by the tax officer because of late settlement.
Source: EUROSAI Study Group initial research and responses to the EUROSAI survey, November 2006.
13
EUROSAI Benchmarking of Tax Administrations
5 Clustering tax administrations to enable meaningful comparisons
5.1 The differences amongst tax administrations are likely to explain some of the variations in performance and efficiency. This suggests that any comparative analysis of performance and
the performance indicators used to measure the efficiency and effectiveness of tax administrations should take into account the different environments within which tax administrations operate.
5.2 A way of enabling the comparison of the performance of tax administrations is to put ‘similar’ tax administrations into ‘clusters’ to assist comparisons. Clusters of tax administrations can be defined on the basis of certain similarities in organisation, remit or
approach in order to enable international comparisons. Clusters also enable analysis of the range of performance indicators used. Our initial research, corroborated by the RAND report, has found that comparisons may be most relevant to groups of countries with similar tax
administrations and approaches or when comparing a small range of indicators in specific contexts.
5.3 Clusters can be defined using simple differentials such as the size of the tax
administration measured using staff data, or the size of the tax population or the amount of tax collected. It may be reasonable to compare performance information of tax administrations of a similar size as they may have similar issues and some may have
implemented economies of scale or efficiencies in the process that others could learn from. However there are many factors that affect performance, size being but one, and different factors can have a varying effect on performance in different areas of a tax administration’s
activities. Therefore there is not one ideal set of clusters and it is important to define the clusters appropriately, in accordance to what area of a tax administration’s activities is being compared.
Using the results of the survey
5.4 The survey sent to EUROSAI members contained a section on the organisation and remit
of their tax administration, for example if there was one central body to administer taxes or whether responsibility was devolved, and whether the tax administration had other responsibilities such as the administration of customs duties or social security contributions. It
also asked whether the tax administration had performance indicators covering the categories of compliance, cost and quality and service (see Part Four). The range of performance indicators across the different categories would provide an indication of the level
of awareness and use of performance measurement within the tax administration.
5.5 The survey to EUROSAI members requested selected performance information on the administration of VAT, a common tax administered by all EUROSAI countries. The EUROSAI
survey results indicated that cost indicators such as total cost of administering VAT and total staff cost of administering VAT have limited use for benchmarking, since only eight out of the 32 countries surveyed record the total cost of administering VAT. The remaining 24 countries
do not record the total cost of administering VAT due to no distinction being made between VAT and other tax administration costs being incurred. The survey also collected data in the category of quality and service but this measured quality and service of the tax administration
overall as customer satisfaction indices tend to measure an overall score rather than related to the administration of a particular tax. The survey collected performance data on:
14

EUROSAI Benchmarking of Tax Administrations
15
EUROSAI Benchmarking of Tax Administrations
The number of VAT returns filed on time
The ratio of outstanding VAT at year end to net annual VAT yield
The number of VAT returns filed online, as greater online filing tends to reduce
administrative costs
Cluster analysis
5.6 To illustrate the concept of clustering in order to be able to make meaningful comparisons
between tax administrations with ‘similar’ characteristics or operating in a similar context, the Group identified six ways of grouping tax administrations by using data from the EUROSAI survey responses and the OECD Report (Figure 5 below).
Figure 5: Selected variables to define clusters
Variable Source
VAT collected/Total tax collected OECD Report11 – Table 22 Registered VAT population OECD Report – Table 30 VAT collected/GDP OECD Report – Table 21 Number of activities carried out by the country’s tax administration
EUROSAI survey responses
Number of tax bodies in the country EUROSAI survey responses Score for range of performance indicators12
EUROSAI survey responses
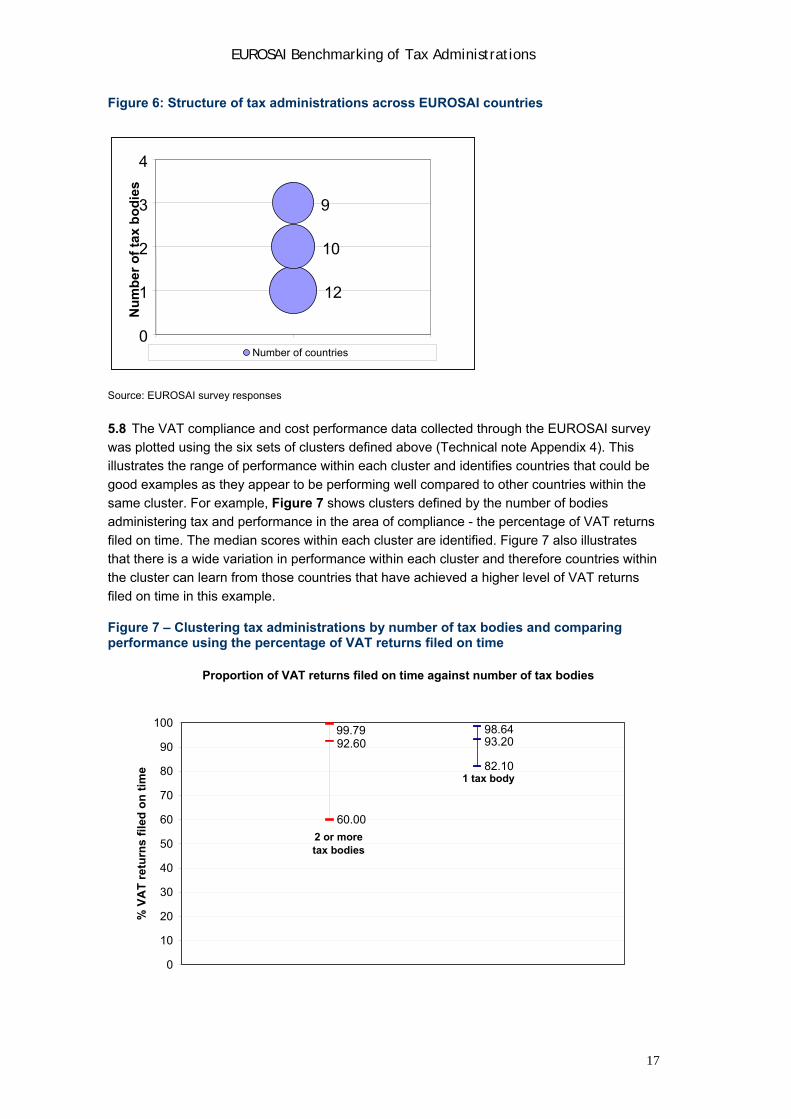
5.7 The Group used the above differentials to cluster countries. For example, on the number of different tax bodies within each country (Figure 6) the data was evenly spread between
having one, two or three bodies, with slightly more having one central body than having two or three. Therefore in this case, clusters could be formed with cluster 1 containing countries that have a single body administering taxes and cluster 2 containing countries that have more
than one body administering tax. The same exercise was conducted using the other differentials listed above, dividing the countries into two clusters based on the spread of data.
11 OECD, Tax Administration in OECD and Selected Non-OECD Countries: Comparative Information Series (2006) 12 The score for the range of performance indicators was calculated using survey responses to whether the tax administration used performance indicators in the categories of compliance, cost and quality and service. Scores were given for ‘yes’, ‘partial’ and ‘no’, giving a total performance indicator score of between zero and three.
16
EUROSAI Benchmarking of Tax Administrations
Figure 6: Structure of tax administrations across EUROSAI countries
12
10
9
0
1
2
3
Nu
mb
er o
f ta
x b
od
ies
4
0 1 2Number of countries
Source: EUROSAI survey responses
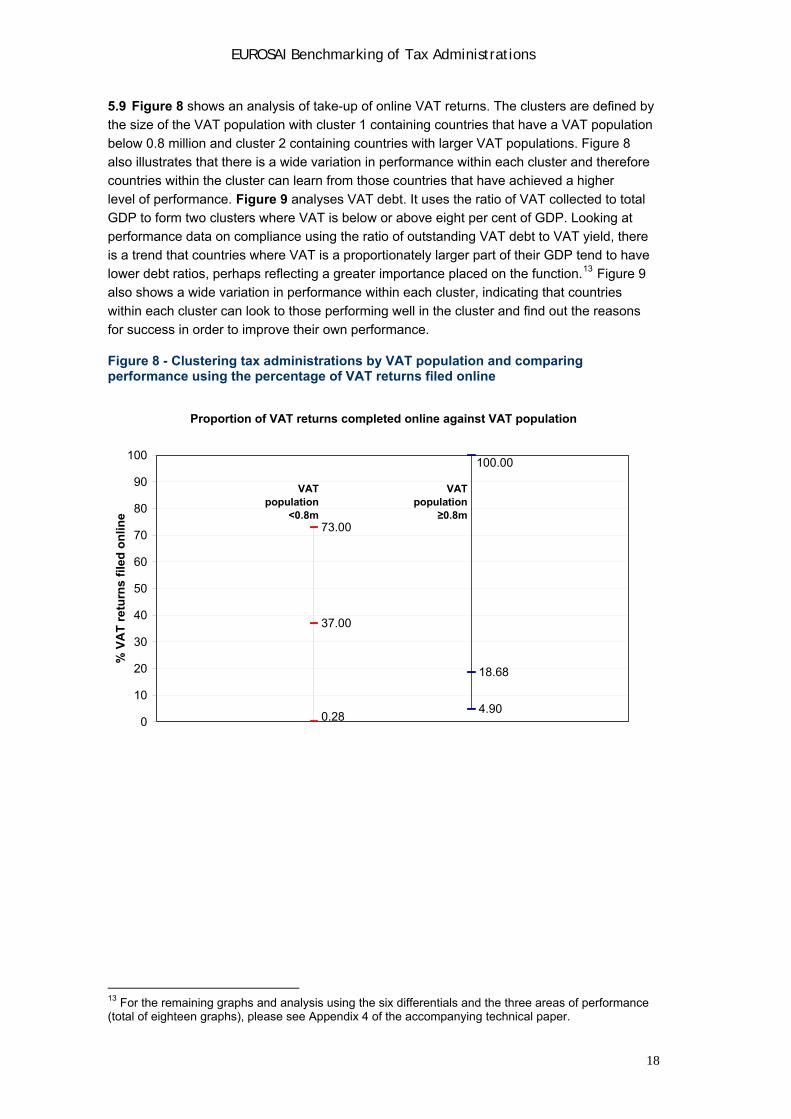
5.8 The VAT compliance and cost performance data collected through the EUROSAI survey was plotted using the six sets of clusters defined above (Technical note Appendix 4). This illustrates the range of performance within each cluster and identifies countries that could be
good examples as they appear to be performing well compared to other countries within the same cluster. For example, Figure 7 shows clusters defined by the number of bodies administering tax and performance in the area of compliance - the percentage of VAT returns
filed on time. The median scores within each cluster are identified. Figure 7 also illustrates that there is a wide variation in performance within each cluster and therefore countries within the cluster can learn from those countries that have achieved a higher level of VAT returns
filed on time in this example.
Figure 7 – Clustering tax administrations by number of tax bodies and comparing performance using the percentage of VAT returns filed on time
Proportion of VAT returns filed on time against number of tax bodies
60.00
82.10
99.7992.60
98.6493.20
0
10
20
30
40
50
60
70
80
90
100
% V
AT
re
turn
s f
iled
on
tim
e
2 or more tax bodies
1 tax body
17
EUROSAI Benchmarking of Tax Administrations
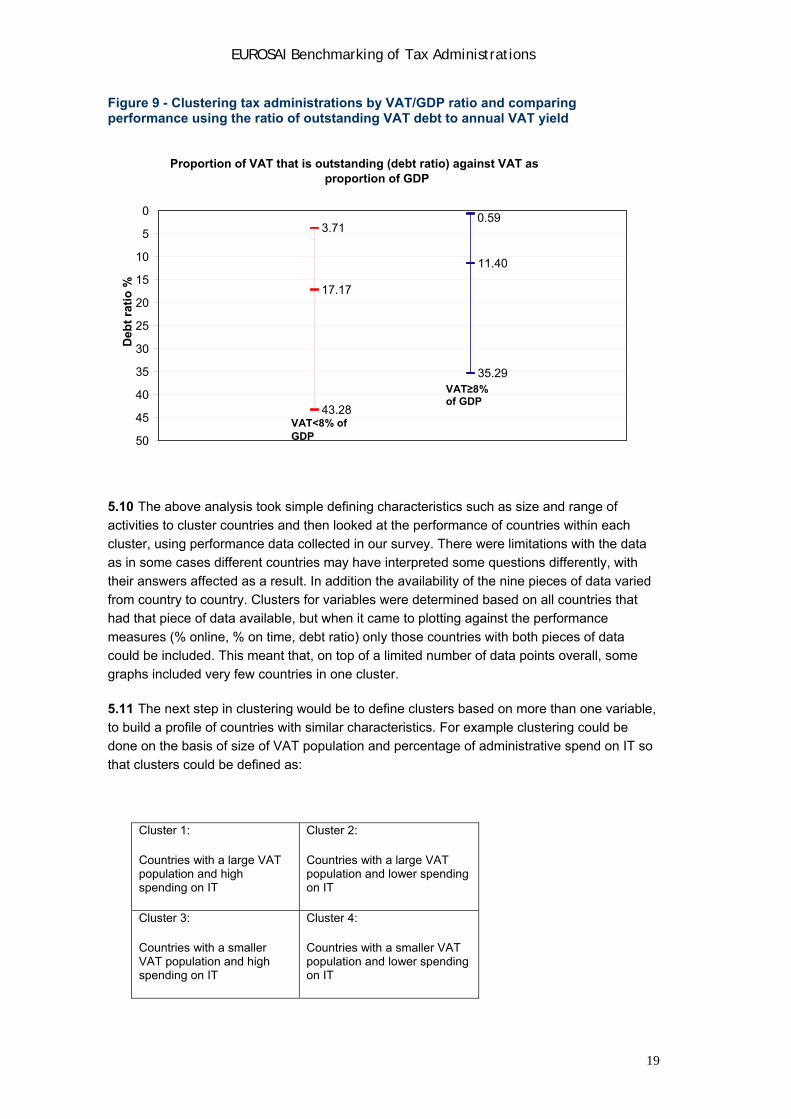
5.9 Figure 8 shows an analysis of take-up of online VAT returns. The clusters are defined by the size of the VAT population with cluster 1 containing countries that have a VAT population
below 0.8 million and cluster 2 containing countries with larger VAT populations. Figure 8 also illustrates that there is a wide variation in performance within each cluster and therefore countries within the cluster can learn from those countries that have achieved a higher
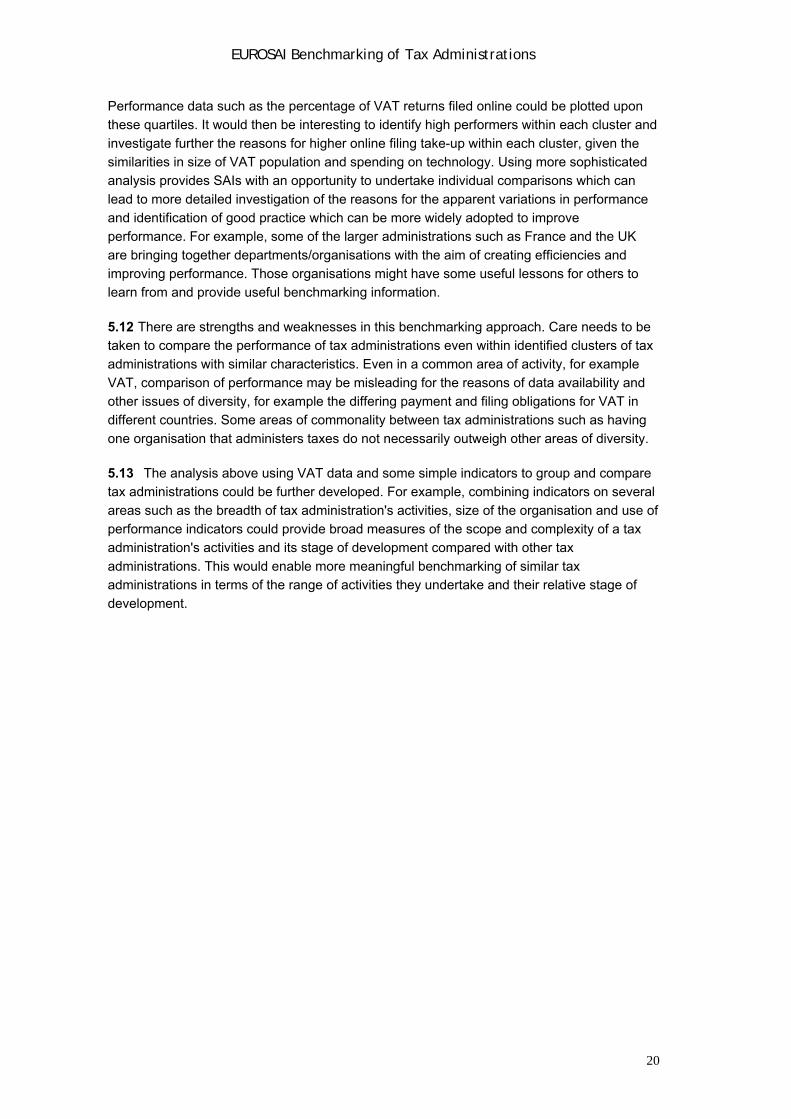
level of performance. Figure 9 analyses VAT debt. It uses the ratio of VAT collected to total GDP to form two clusters where VAT is below or above eight per cent of GDP. Looking at performance data on compliance using the ratio of outstanding VAT debt to VAT yield, there
is a trend that countries where VAT is a proportionately larger part of their GDP tend to have lower debt ratios, perhaps reflecting a greater importance placed on the function.13 Figure 9 also shows a wide variation in performance within each cluster, indicating that countries
within each cluster can look to those performing well in the cluster and find out the reasons for success in order to improve their own performance.
Figure 8 - Clustering tax administrations by VAT population and comparing performance using the percentage of VAT returns filed online
Proportion of VAT returns completed online against VAT population
73.00
37.00
4.90
18.68
0.28
100.00
0
10
20
30
40
50
60
70
80
90
100
% V
AT
re
turn
s fi
led
on
line
VAT population
<0.8m
VAT population
≥0.8m
13 For the remaining graphs and analysis using the six differentials and the three areas of performance (total of eighteen graphs), please see Appendix 4 of the accompanying technical paper.
18
EUROSAI Benchmarking of Tax Administrations
Figure 9 - Clustering tax administrations by VAT/GDP ratio and comparing performance using the ratio of outstanding VAT debt to annual VAT yield
Proportion of VAT that is outstanding (debt ratio) against VAT as proportion of GDP
0
VAT≥8% f GDP o
0.59
11.40
35.29
17.17
3.71
43.28VAT<8% of GDP
5
10
15
20
25
30 Deb
t ra
tio
%
35
40
45
50
5.10 The above analysis took simple defining characteristics such as size and range of
activities to cluster countries and then looked at the performance of countries within each cluster, using performance data collected in our survey. There were limitations with the data as in some cases different countries may have interpreted some questions differently, with
their answers affected as a result. In addition the availability of the nine pieces of data varied from country to country. Clusters for variables were determined based on all countries that had that piece of data available, but when it came to plotting against the performance
measures (% online, % on time, debt ratio) only those countries with both pieces of data could be included. This meant that, on top of a limited number of data points overall, some graphs included very few countries in one cluster.
5.11 The next step in clustering would be to define clusters based on more than one variable, to build a profile of countries with similar characteristics. For example clustering could be done on the basis of size of VAT population and percentage of administrative spend on IT so
that clusters could be defined as:
Cluster 1:
Countries with a large VAT population and high spending on IT
Cluster 2:
Countries with a large VAT population and lower spending on IT
Cluster 3:
Countries with a smaller VAT population and high spending on IT
Cluster 4:
Countries with a smaller VAT population and lower spending on IT
19
EUROSAI Benchmarking of Tax Administrations
Performance data such as the percentage of VAT returns filed online could be plotted upon these quartiles. It would then be interesting to identify high performers within each cluster and
investigate further the reasons for higher online filing take-up within each cluster, given the similarities in size of VAT population and spending on technology. Using more sophisticated analysis provides SAIs with an opportunity to undertake individual comparisons which can
lead to more detailed investigation of the reasons for the apparent variations in performance and identification of good practice which can be more widely adopted to improve performance. For example, some of the larger administrations such as France and the UK
are bringing together departments/organisations with the aim of creating efficiencies and improving performance. Those organisations might have some useful lessons for others to learn from and provide useful benchmarking information.
5.12 There are strengths and weaknesses in this benchmarking approach. Care needs to be taken to compare the performance of tax administrations even within identified clusters of tax administrations with similar characteristics. Even in a common area of activity, for example
VAT, comparison of performance may be misleading for the reasons of data availability and other issues of diversity, for example the differing payment and filing obligations for VAT in different countries. Some areas of commonality between tax administrations such as having
one organisation that administers taxes do not necessarily outweigh other areas of diversity.
5.13 The analysis above using VAT data and some simple indicators to group and compare tax administrations could be further developed. For example, combining indicators on several
areas such as the breadth of tax administration's activities, size of the organisation and use of performance indicators could provide broad measures of the scope and complexity of a tax administration's activities and its stage of development compared with other tax
administrations. This would enable more meaningful benchmarking of similar tax administrations in terms of the range of activities they undertake and their relative stage of development.
20
EUROSAI Benchmarking of Tax Administrations
6 Implications for Supreme Audit Institutions
6.1 SAIs can highlight relevant performance benchmarking information to the tax administrations in their countries. SAIs can:
Draw on benchmarking information.
Use that information to assess whether organisations make effective and efficient use of the resources available to them.
Make comparisons with organisations operating in a similar field, or with a subset of these as in our cluster analysis.
6.2 While SAIs do not have the authority to impose performance measurement systems on
tax administrations, they are in a position to influence and promote good practice. SAIs can use the range of their audits to review the indicators used by the tax administration to ensure that they cover all activities. INTOSAI guidelines highlight that one theme for performance
auditing is whether performance measurement systems in government are efficient and effective and audits could address whether performance indicators measure the right things or whether the performance measurement systems can provide credible measured results.14
6.3 One conclusion drawn from the questionnaire sent to EUROSAI countries was that there is no unique set of indicators covering all EUROSAI tax administrations to enable meaningful benchmarking of performance across all areas of compliance, cost and quality and service.
Therefore, the Study Group decided to analyse the national indicators provided by each country and highlight a selection of them. This provides a set of key common measures which SAIs might encourage their tax administrations to adopt.
6.4 These indicators are not necessarily the ‘best’ indicators but they do all have three basic characteristics of a ‘good’ indicator for benchmarking purposes:
They are clearly constructed in a way that does not undermine the result calculated.
They are simple to calculate which is important if they are to be promoted widely.
They are already used by some tax administrations.
6.5 There are some indicators which appear to measure more than one area of performance
and some which may be more important depending on the evolution of the tax administration. These indicators would establish a higher extent of standardisation in the indicators used by every country and would allow comparing the impact in terms of cost, quality and compliance
of the national tax administrations.
6.6 The Study Group identified one indicator for each category of measurement which would enable SAIs to collect information to facilitate benchmarking and sharing of good practice.
These are a starting point, to be expanded over time to develop a suite of indicators:
Compliance - a good benchmarking indicator could be the ‘Percentage of taxpayers filing their income tax returns/declarations on time’. This indicator is
flexible, as the time limit can vary from one country to another. This indicator could be calculated by dividing the number of taxpayers who file before the national legal date (by opposition to another date that could be the operational date to which services process
14 INTOSAI Implementation Guidelines for Performance Auditing
21
EUROSAI Benchmarking of Tax Administrations
verification) by the total number of taxpayers who are required to file a return. This indicator is used in Cyprus, France, Iceland and Portugal. A similar indicator is used in
Macedonia. This indicator can be developed further as filing tax returns on time depends to some extent on the severity of sanctions associated with late compliance and on how effectively sanctions themselves are enforced.
Cost – a good indicator could be a simple indicator based on the cost of administering VAT such as ‘the ratio of administering domestic VAT over the total amount of domestic VAT recovered’. The VAT recovered would be normalised to
smooth differences in the rates of VAT applied by countries. This would be a good indicator because this is a common tax and because the volume of VAT internet filing is growing thereby reducing administration costs. However the administrative ‘cost’ element
needs to be defined carefully in order to be able to benchmark. For example it could cover just direct costs and exclude back-office or support unit costs. In addition VAT on imports would be excluded as, in some countries, this is covered by a different
administration. Countries which have such indicators include Albania, Czech Republic, Finland, France, Italy, Lithuania and Azerbaijan.
Quality and Service – a good indicator could be a measure of overall customer
satisfaction such as ‘the percentage of satisfied compliant individual taxpayers’. The indicator could be measured on an annual basis through a customer survey and be formalised through one single question: ‘Overall, are you satisfied of the quality of service
provided by your tax administration? This indicator has limitations in that it is subjective and based on taxpayer perception which can be affected by a number of factors. However it is useful as a broad indicator and as a starting point for comparisons as
several countries such as Denmark, Estonia, Finland, Lithuania, Portugal, Macedonia, Sweden and the UK already use this type of indicator.
6.7 The level of benchmarking that can be achieved depends on the level of measurable,
time related and comparable performance information. A considerable amount of benchmarking data already exists, for example the OECD report15 which provides internationally comparative data on aspects of tax systems and their administration and is
updated every two years. The OECD report also refers to a performance oriented trend across OECD member countries in budgeting and performance management. It states that many governments have sought to adopt a results-based approach to both management and
budgeting in which organisations are given flexibility to improve performance and are held accountable for results measured in the form of outputs and/or outcomes, moving away from the traditional emphasis on controlling inputs. It discerns four broad objectives for which
countries have adopted the formalisation of targets and measures:
Managing the efficiency and effectiveness of organisations and the internal control and accountability.
Improving decision-making in the budget process and/or in the allocation of resources.
Improving external transparency and accountability to parliament and to the public.
Achieving savings.
15 “Tax Administration in OECD and Selected Non-OECD Countries: Comparative Information Series (2006)” OECD, February 2007
22
EUROSAI Benchmarking of Tax Administrations
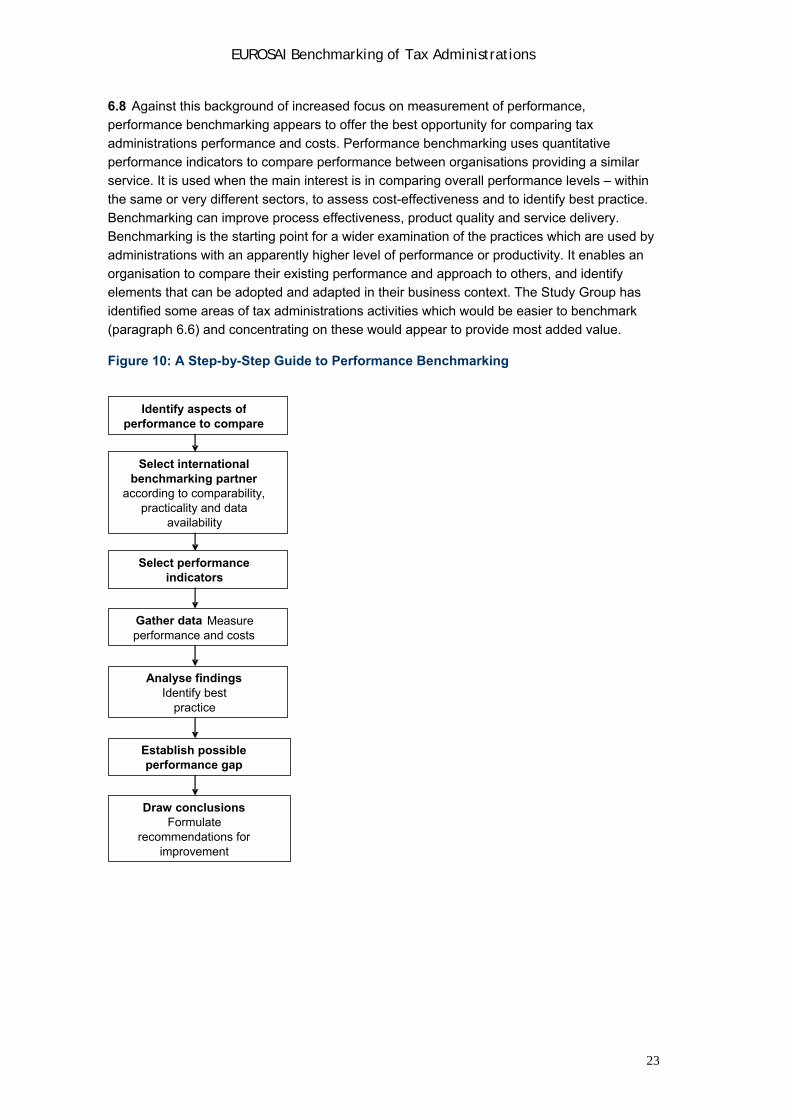
6.8 Against this background of increased focus on measurement of performance, performance benchmarking appears to offer the best opportunity for comparing tax
administrations performance and costs. Performance benchmarking uses quantitative performance indicators to compare performance between organisations providing a similar service. It is used when the main interest is in comparing overall performance levels – within
the same or very different sectors, to assess cost-effectiveness and to identify best practice. Benchmarking can improve process effectiveness, product quality and service delivery. Benchmarking is the starting point for a wider examination of the practices which are used by
administrations with an apparently higher level of performance or productivity. It enables an organisation to compare their existing performance and approach to others, and identify elements that can be adopted and adapted in their business context. The Study Group has
identified some areas of tax administrations activities which would be easier to benchmark (paragraph 6.6) and concentrating on these would appear to provide most added value.
Figure 10: A Step-by-Step Guide to Performance Benchmarking
Identify aspects ofperformance to compare
Select international benchmarking partner
according to comparability, practicality and data
availability
Select performance indicators
Gather data
Measure performance and costs
Analyse findingsIdentify best
practice
Establish possible performance gap
Draw conclusions Formulate
recommendations for improvement
23
EUROSAI Benchmarking of Tax Administrations
6.9 SAIs can recommend improved performance measurement to enhance the performance of tax administrations. Improved performance measurement can enable benchmarking of the
costs and performance of tax administrations which in turn may add further impetus to the ongoing improvement of tax administrations’ performance. There is considerable variation in the performance indicators used by tax administrations. The OECD survey of revenue bodies
found that the vast majority of tax administrations prepare and publish an annual performance report describing the overall results of their tax administration activities for each fiscal year. However there are substantial variations in the quality of the information provided.
This provides an opportunity for SAIs to audit the performance of their tax administration, to assess whether they have an appropriate set of measures in place and to use this to support performance audit work.
6.10 The OECD Report found that countries face challenges in performance measurement. A key challenge is the existence of good quality information which is valid, reliable and timely. Other challenges include:
Setting objectives – setting clear objectives can be a problem when there are diverse interests.
Finding accurate measures of performance – outcomes are more difficult to measure.
Establishing and maintaining systems of data collection – to ensure quality there needs to be a process by which data collected is verified and validated.
The report goes on to say that the auditing of performance information can help to improve
standards and provide some legitimacy for the reported results.
6.11 In auditing the performance of tax administrations, SAIs should be able to assess whether the performance indicators measure the right things or whether the performance
measurement systems involved are capable of providing credible measured results. Using clear indicators can be considered a basic requirement for performance reporting. The indicators should also:
Give a good and intelligible basis for establishing accountability and target setting.
Offer an illustrative tool for evaluating performance for the political decision makers.
Cover the most essential activities of the tax administration.
Measure performance in key areas.
Be supported by accurate, timely and consistent management information.
For example the provision of online services is one level of indicator but a more effective indicator would be a measure of the take-up of online services by customers, with a target to
increase take-up to a defined percentage over a designated time period. Indicators need to be supported by good management information to enable assessment of performance, for example monitoring the percentage of VAT returns submitted online, which would allow for
development of a target to increase this percentage. It should also be noted that more indicators do not necessarily mean better performance management as using too many indicators may cloud the whole picture.
24
EUROSAI Benchmarking of Tax Administrations
6.12 Although it may be difficult to compare all aspects of a tax administration’s performance, benchmarking provides SAIs with an opportunity to highlight performance measurement good
practice. Measuring performance should be based on systematic collecting of information. Creating a measurement system requires defining not only the indicators but also the scales and sources used. Responsibilities for conducting measurement, compiling the data and final
reporting should be clearly defined. Precision and reliability requirements should also be clearly specified for the measurement data.
6.13 During the course of their performance audits of tax administrations SAIs have an
opportunity to review a tax administration’s performance management system. Some areas to cover could include:
The coverage of the indicators – whether there are too few or too many
The difference between performance indicators and activity indicators
Indicators measuring outputs, for example reducing the level of debts/tax arrears
Interaction with the taxpayers, quality of service, time
Targets – whether they are set up at an appropriate level
Whether the performance information allow comparisons over time
Different areas of performance indicators, for example customer satisfaction indicators or
compliance indicators
6.14 In addition some SAIs have responsibility for validating the performance information and reliability of the tax administration’s data, for example by exploring the quality and robustness of the underlying performance data. Poor data in the revenue area can lead to incorrect
allocations of resources between individual areas.
6.15 There is also diversity in the role of SAIs which have varying remits and relationships with their tax authorities. Some SAIs may be in a position to suggest areas of performance
measurement which the tax administration may wish to explore and support the tax administration in areas it may wish to develop. These SAIs could draw on performance indicators used by other tax administrations to highlight ways in which a tax administration
can improve measurement of its performance across the full range of its activities, for example in areas which it may traditionally not have measured such as quality and service. They could also review how performance indicators are used by different tax administrations,
for example to drive improvements, affect pay and bonuses, allocate resources, report publicly and to influence behaviour. However comparability should not be at the expense of a broader review of performance against the tax administration’s indicators.
25
EUROSAI Benchmarking of Tax Administrations
26
7 Summary and possible discussion points for the EUROSAI congress
7.1 Benchmarking the performance and costs of tax administrations is not straightforward. While there is much data available from tax administrations on their performance and costs
care needs to be taken in using that data to draw meaningful comparisons about relative efficiency and effectiveness. Nevertheless, the Study Group has:
Identified a group of performance indicators which reflect the activities of most tax
administrations core activities covering compliance, cost and quality and service.
Indicated a practical way of grouping similar tax administrations which enables more meaningful comparisons to be made of the administration of common taxes. Such analysis allows better identification of those tax administrations which may have good practice which can be applied more widely to improve performance and efficiency.
Produced detailed analysis of performance on one tax stream which provides the
basis for further benchmarking work by individual SAIs or groups of SAIs to identify good practice for tax administrations both within EUROSAI and the wider INTOSAI community16.
7.2 The work completed by the Study Group provides a sound basis for future work by SAIs when reviewing the performance and costs of tax administrations. It also provides a methodology for small groups of SAIs to compare tax administrations performance
measurement systems and the performance and cost of tax administrations. The suggestions below are aimed at the development of a core set of performance indicators with clear definitions to provide a sounder basis for meaningful comparisons of the costs and
performance of tax administrations.
7.3 The EUROSAI Congress is invited to discuss areas where SAIs might be encouraged to use and build on the work already done by the Study Group, in particular to:
i Regularly exchange performance information - SAIs could use the framework of performance indicators identified in this report to assess the quality of the performance indicators used by their own tax administrations and promote a set of performance
measures for benchmarking.
ii Compare the performance indicators being used by different tax administrations – SAIs could use the primary analysis of benchmarking in this report to commission
secondary/further analysis. The improved information from the performance indicators would allow SAIs to better benchmark the performance of their tax administrations.
iii Set up a EUROSAI forum (virtual or otherwise) to share good practice in performance measurement and gather data on a regular basis in order to allow benchmarking in the future.
16 Discussions at the INCOSAI in Mexico in 2007 on performance assessment systems suggested the setting up of an INTOSAI working group to share knowledge and lessons learned in working with key national indicators through exchanges and strategic alliances with other SAIs, the seven INTOSAI regional working groups and other international organisations