benchmarking report of the ceramics...
TRANSCRIPT
Benchmarking Report of the Ceramics Sector
2016
INDUSTRIAL ENERGY EFFICIENCY PROJECT


Industrial Energy Efficiency Benchmarking Report of the Ceramics Sector
Prepared by
Copyright © 2016 United Nations Industrial Development Organization
Dr. Fatheya SolimanDr. Amr Osama

III
Summary
One of the main purposes of the project “Industrial Energy Efficiency in Egypt” implemented by the United
Nations Industrial Development Organization (UNIDO) and funded by the Global Environmental Facility (GEF),
was to prepare industrial energy efficiency (IEE) benchmarking reports for the key industrial sectors. This report
covers the benchmarking study results for the ceramic tiles industry.
Chapter 2 explains the methodology applied for establishing the benchmarking studies. It relates, for the most
part, to the UNIDO methodology described in the UNIDO Working Paper “Global Industrial Energy Efficiency
Benchmarking – An Energy Policy Tool, Working Paper, 2010”. Furthermore, Chapter 2 describes the approach
for estimating energy saving potentials, for collecting data, for defining system boundaries and for checking the
reliability of data.
For the Egyptian benchmarking curves, comprehensive data single-handed collected by national experts in
selected companies were applied. This approach gives much more precise results than simply applying statistical
data. The data were checked by the national experts and outliers were deleted.
Chapter 3 contains the basic sector information, including the economic and legislative framework, the number
of companies and ownership, production capacities, main products and markets. Furthermore, Chapter 3 shows
the main drivers for energy consumption in the ceramic tiles industry and the energy consumption of the whole
sector according to national statistical information. These energy consumption values are not very reliable and
were not taken for drawing the energy consumption and saving scenarios in Chapter 4.
Chapter 3 further describes the main drivers for energy consumption in the ceramic tiles industry. The energy
consumption for ceramic tiles production is divided into thermal energy consumption, and electric energy
consumption. The main drivers for thermal energy consumption are kiln firing process, drying and spray drying
processes. On the other hand, the main drivers for electric energy consumption are grinding mills, pressing, in
addition to drying and firing.
The “Best Available Techniques (BAT) Reference Document for the Production of Ceramic Manufacturing
Industry” was used to obtain the world BAT value with of total specific energy consumption 3.31 GJ/t ceramic
tiles. This value was used for calculating the saving potentials of the whole ceramic tiles sector in Egypt.
Chapter 4 shows the results of the analysis of the data collected in Egyptian ceramic tiles plants. From the 38
ceramic tiles plants operating in Egypt, 19 plants (representing 13 companies) were analyzed. These 13 plants
have a share of 58% of the total energy consumption of the ceramic tiles sector in Egypt, which is quite a
representative sample.
One important result of the study is the construction of energy efficiency benchmark curves. The graph below
shows the benchmark curve for the ceramic tiles industry for the total energy consumption. These types of
benchmark curves show the specific energy consumption of the analyzed companies per ton of ceramic tiles
produced (GJ/t) as a function of the production volume share. The most efficient plants are represented to the
left and lower part of the curve, and the least efficient plants to the right and upper part of the curve.

IV
The most efficient plant of the analyzed companies in Egypt has a specific total energy consumption of 5.66 GJ/t
ceramic and a production volume share of 5.4%. This value defines the national BAT value. The red line indicates
the international BAT value which corresponds to a specific total energy consumption of 3.31 GJ/t ceramic. The
second lowest specific energy consumption in this curve is defined as the national best practice technology (BPT)
value, which is 5.8 GJ/t ceramic. The international BPT value is 4.13 GJ/t based on literature review. The weighted
average specific energy consumption of the ceramic tiles industry in Egypt is 6.76 GJ/ t ceramic.
For this study, the BPT value was only applied for the saving scenarios in Chapter 4 in order to draw up the BPT
scenario. It was defined that the lowest known BPT value, either on national or international level, would be
applied for the scenario. For the ceramic tiles industry, the international BPT for total energy consumption is
4.13 GJ/t ceramic, which is much lower than the national BPT value of 5.8 GJ/t ceramic.
In Chapter 4.5, energy saving potentials were calculated, on one hand, for the 13 companies that participated in
the benchmarking study (one of them was considered an outlier) and on the other hand, for the whole Egyptian
ceramic tiles sector. The 13 companies have an energy saving potential for thermal energy of about 2,387,444
GJ/yr. The saving potential for electrical energy of the 13 companies is about 1,128,553 GJ/yr. The potentials
were calculated with the national BAT value in the following method:
Saving Potential of Company x = (SEC of Company x – BAT national) * Annual Production of Company x
The total energy saving potential of the whole ceramic tiles industry sector in Egypt is about 22,698,174 GJ/yr.
The annual saving potential for the whole sector was calculated using the international BAT value in the following
equation:
Saving Potential of Whole Sector = (Weighted SEC of Analyzed Companies – BAT lowest) * Total Annual
Production of the Sector
The production of the whole sector was taken from IDA data. The annual production of the whole ceramic tiles
sector in Egypt is 366,006,561 square meters (Equivalent to 6,588,118 tons). As there is no reliable value for
energy consumption of the whole sector on statistical basis, it was calculated with the weighted specific total
energy consumption of the 13 analyzed ceramic tiles manufacturing companies. As the sample of benchmark
companies is quite decent, this approach gives a good approximation of the total energy sector energy
consumption.
Internationl BAT Value = 3.31 GJ/ton

V
Furthermore, in Chapter 4 different energy saving scenarios until 2030 and 2050 were drawn. The scenarios
correspond to the scenarios in the UNIDO Working Paper. The four scenarios are:
Frozen efficiency: No additional energy efficiency savings are made. The current levels of energy
efficiency are not improved upon.
Baseline efficiency: Energy efficiency improves at a rate of 0.3% a year.
BPT scenario: All plants are operating at the current levels of BPT by 2050. This is equivalent to an
energy efficiency improvement of 1.32% a year in the period 2016 to 2050. The BPT is the lowest
known BPT, either on international or on national level. For the ceramics sector the BPT value is the
international BPT value 4.13 GJ/ton.
All plants are operating at the current levels of BPT by 2030. This is equivalent to an energy efficiency
improvement of 3.46% a year in the period 2016 to 2030.
The study also conducted this analysis on using national BPT value of 5.8 GJ/ton, and the results are
shown in Chapter 4.
BAT scenario: All plants are operating at current levels of BAT by 2050. This is equivalent to an energy
efficiency improvement of 2.08% a year in the period 2016 to 2050. The BAT is the lowest known BAT,
either on international or on national level. For the ceramics sector the BAT value is the international
BAT value 3.31 GJ/ton.
All plants are operating at the current levels of BAT by 2030. This is equivalent to an energy efficiency
improvement of 4.97% a year in the period 2016 to 2030.
The study also conducted this analysis on using national BAT value of 5.66 GJ/ton, and the results are
shown in Chapter 4.
An important factor for drawing the scenarios is the rate of production growth. Data on projections of ceramic
tiles productivity is rare; hence, different approaches were used and illustrated in Chapter 4.6. The approach
applied in this study takes in account the population growth until 2050, in addition to the ceramic productivity
per capita. A relation was derived to obtain the factor for the increase in ceramic tiles productivity, which is 6.7
until 2050 and 3.3 until 2030.
The following graph shows the four scenarios until 2050 for the growth of total energy consumption in the
ceramic tiles manufacturing industry using international BPT and BAT values. According to the frozen efficiency
scenario, the annual total energy consumption in 2050 will reach about 180,497,714 GJ for the whole sector. The
annual energy consumption in 2050 according to the international BAT scenario will be about 88,379,798 GJ.
Comparing the frozen efficiency scenario and the BAT scenario, the total saving potential would be about
92,117,916 GJ, which is 51%.

VI
The following table below shows the total annual energy consumption of the whole sector in 2016, 2030 and
2050 according to the four scenarios. Furthermore, the table shows the annual and cumulative energy saving
potentials if all companies of the sector reach the BAT specific energy consumption in 2030 or 2050.
Year Frozen Scenario (GJ)
Baseline Scenario (GJ)
BPT Scenario (GJ)
BAT Scenario (GJ)
Savings Frozen - BAT Scenario
(GJ)
Cumulative Savings BAT Scenario (GJ)
2016 40,653,114 40,653,114 40,653,114 40,653,114 -
2030 87,522,231 83,975,264 53,451,462 42,884,511 44,637,721 300,998,149
2050 180,497,714 162,969,784 110,157,008 88,379,798 92,117,916 1,248,204,810
In Chapter 4, the sector-specific energy saving opportunities and measures are described. This study offers a
basis for further energy efficiency projects for the Egyptian ceramic tiles sector. These projects should focus on
implementation of energy management systems and identifying specific energy efficiency measures through
detailed energy audits and assisting companies in implementation.

VII
Abstract
The report contains the main results for the Egyptian ceramic tiles sector of the project “Industrial Energy
Efficiency in Egypt”, financed by the United Nations Industrial Development Organization (UNIDO) and the Global
Environmental Facility (GEF).
Within this project, energy efficiency benchmark curves were established. The methodology relates, for the most
part, to the UNIDO methodology described in the UNIDO Working Paper “Global Industrial Energy Efficiency
Benchmarking – An Energy Policy Tool, Working Paper, 2010”. Furthermore, specific approaches for estimating
energy saving potentials, for collecting data, for defining system boundaries and for checking the reliability of
data were developed.
The main results of the study are the benchmark curves, the energy saving potentials and the energy saving
scenarios. Following saving potentials were calculated:
Frozen efficiency: No additional energy efficiency savings are made.
Baseline efficiency: Energy efficiency improves at a rate of 0.3% a year.
BPT scenario: All plants are operating at the current levels of BPT by 2030 and 2050.
BAT scenario: All plants are operating at current levels of BAT by 2030 and 2050.
The following table below shows the annual energy consumption of the whole sector in 2016, 2030 and 2050
according to the four scenarios using international BAT and BPT values. Furthermore, the table shows the annual
and cumulative energy saving potentials if all companies of the sector reach the BAT specific energy consumption
in 2030 or 2050.
Year Frozen Scenario (GJ)
Baseline Scenario
(GJ)
BPT Scenario (GJ)
BAT Scenario (GJ)
Savings Frozen - BAT Scenario
(GJ)
Cumulative Savings BAT Scenario (GJ)
2016 40,653,114 40,653,114 40,653,114 40,653,114 -
2030 87,522,231 83,975,264 53,451,462 42,884,511 44,637,721 300,998,149
2050 180,497,714 162,969,784 110,157,008 88,379,798 92,117,916 1,248,204,810


IX
Acknowledgement
This report is one of a series of benchmarking reports of energy intensive sectors in Egypt, namely; Ceramics, Cement, Iron & Steel and Fertilizers. The reports were developed by the United Nations Industrial Development
Organization within the scope of the Industrial Energy Efficiency Project in Egypt (IEE). The project is funded by
the Global Environmental Facility (GEF) and implemented by UNIDO in cooperation with the Egyptian
Environmental Affairs Agency (EEAA), the Ministry of Industry and Foreign Trade of Egypt (MoIFT) and the
Federation of Egyptian Industries (FEI).
The reports were developed under the overall responsibility and guidance of Rana Ghoneim and the
coordination of Dr. Gihan Bayoumi and Ashraf Zeitoun. The Ceramics Sector Benchmarking Report was
authored by Dr. Amr Osama and Dr. Fatheya Soliman.
A special thanks to the staff and management of the Industrial Development Authority especially El Saaed
Ibrahim for their valuable support in facilitating the data collection, without which the development of these
reports would not have been possible.

IX
Contents
SUMMARY III ABSTRACT VII 1 INTRODUCTION 11 1.1 UNIDO Industrial Energy Efficiency Program 11
1.2 Aim of the Project 11
2 METHODOLOGY TO ESTABLISH BENCHMARKING STUDIES 13 2.1 UNIDO Benchmarking Methodology 13
2.2 Drawing the Benchmarking Curves for Egyptian Industry 14
2.2.1 System Boundaries for Benchmarking 14
2.2.2 Approach for Data Collection in Companies 17
2.2.3 Selection of the Companies for Data Collection 18
2.2.4 Schedule for Data Collection 20
2.2.5 Limitations of Data Collection and Barriers Encountered 20
2.3 International Benchmarks for Comparison 21
2.3.1 International Best Practice 21
2.3.2 International Best Available Techniques (BAT) 22
2.4 Approach for Estimating Energy Saving Potentials 23
2.4.1 Saving Potential of Participating Companies 23
2.4.2 Saving Potential of the Whole Sector in Egypt 23
2.4.3 Saving Potentials for the BPT Scenario 23
2.5 Possible Sources on National Level 23
2.5.1 Energy Consumption Data on National Level (Top-Down) 24
2.5.2 Production Data on National Level (Top-Down) 24
2.6 Process to Check Reliability of Data 24
3 BASIC SECTOR INFORMATION 26 3.1 Economic and Legislative Framework 26
3.2 Production Capacities 27
3.3 Economics of the Sector 29
3.3.1 Main Products 29
3.3.2 Annual Turnover 29
3.3.3 Main Markets 30
3.3.4 Main Drivers for Energy Consumption 30
3.4 Energy Data of the whole sector 31
3.4.1 Thermal Energy Consumption of the Whole Sector 31
3.4.2 Electricity Consumption of the Whole Sector 31
3.4.3 Energy Costs 31
3.5 Energy Efficiency Measures Implemented and/or Planned 31
4 ANALYSIS OF RESULTS 32 4.1 Achieved Data Sets for Analysis 32

X
4.1.1 Production Volume of Analyzed Companies 32
4.1.2 Energy Consumption of Analyzed Companies 33
4.1.3 Status of Energy Management System in Analyzed Companies 40
4.2 Energy Performance Indicators of Analyzed Companies 41
4.2.1 Benchmark Curve on National Level 41
4.3 Share of Energy Costs of Turnover 53
4.4 Energy Cost Benchmark Curve for Egyptian Companies 54
4.5 Annual Saving Potential 55
4.5.1 Annual Saving Potential for Each Plant 55
4.5.2 Annual Saving Potential for the Whole Sector 58
4.6 Saving Scenarios until 2050 and until 2030 59
4.6.1 Saving Scenarios until 2050, 2030 (using International BAT and BPT) 59
4.6.2 Energy Savings in 2030 and 2050 63
4.6.3 Saving Scenarios until 2050, 2030 (using National BAT and BPT) 63
4.6.4 Energy Savings in 2030 and 2050 66
4.7 Saving Opportunities 66
5 RECOMMENDATIONS 71 5.1 Strengthening the Statistical Data Collection Process in Egypt 71
5.2 Implementing Support Programmes for Industry 71
5.2.1 Energy Management Programmes 71
5.2.2 Energy Audit Programmes 72
6 LITERATURE 73
7 ABBREVIATIONS 74
8 LIST OF FIGURES 75
9 LIST OF TABLES 76


BENCHMARKING REPORT OF THE CERAMICS SECTOR
11
1 Introduction
The Egyptian industrial sector is responsible for approximately 43% of national final energy consumption, and 33%
of national electricity consumption (IEA, 2013). Overall industry-related emissions accounted for 29% of the total
emissions in 2005 and are expected to increase their relative share to 36% by 2030 (McKinsey, 2010).
The final energy consumption per unit of output in the most important industries in Egypt is typically 10 to 50%
higher than the international average. Therefore, increased energy efficiency (EE) in the Egyptian industry has the
potential to make a significant contribution to meeting the growing energy supply challenges facing the country.
1.1 UNIDO Industrial Energy Efficiency Program
Energy efficiency in industry contributes to decoupling economic growth and environmental impact while reducing
industrial energy intensity and improving competitiveness. Industry is responsible for more than one third of global
primary energy consumption and energy-related carbon dioxide emissions. Industrial energy use is estimated to
grow at an annual rate of between 1.8 per cent and 3.1 per cent over the next 25 years. In developing countries
and countries with economies in transition, the portion of energy supply (excluding transport) required for industry
can be up to 50 per cent. This often creates tension between economic development goals and constrained energy
supply.
Still, worldwide, the energy efficiency in the industry is well below the technically feasible and economic optimum.
It has been estimated that the industry has the technical potential to decrease its energy intensity by up to 26 per
cent and emissions by up to 32 per cent providing a striking 8.0 per cent and 12.4 per cent reduction in total global
energy use and CO2 emissions (IEA, 2012).
Improving energy efficiency in industry is one of the most cost-effective measures to help supply-constrained
developing and emerging countries meet their increasing energy demand and loosen the link between economic
growth and environmental degradation.
The UNIDO approach in energy efficiency is a holistic approach. It not only focuses on technical improvement, but
also on improvement in policy, management, operations and financing. It introduces optimization of an entire
energy system rather than optimization of individual equipment components. To ensure sustainability, it focuses
on creating a well-functioning local market for IEE services.
1.2 Aim of the Project
The project seeks to address some of the key barriers to industrial energy efficiency (IEE), to deliver measureable
results and to make an impact on how Egyptian industries manage energy through an integrated approach that
combines capacity building and technical assistance interventions at the policy and energy efficiency project level.
Primary target groups of the project are industrial decision-makers (managers), engineers, vendors and other
professionals and IEE policy-making and/or implementing institutions. The project will provide technical assistance
to develop and help establish market-oriented policy instruments needed to support sustainable progression of
Egyptian industries toward international best energy performance and to stimulate the creation of a market for IEE
products and services.

BENCHMARKING REPORT OF THE CERAMICS SECTOR
12
The project will broaden knowledge and in-depth technical capacity for IEE, with an emphasis on system
organization and ISO energy management in industry, energy professionals and relevant institutions, such as the
Egyptian Environmental Affairs Agency and other concerned institutions. The project will provide technical
assistance, including energy audits, and support a limited number of pilot IEE projects with high replication and/or
energy saving potential in the key industrial sectors to reach implementation.

BENCHMARKING REPORT OF THE CERAMICS SECTOR
13
2 Methodology to Establish Benchmarking Studies
The methodology applied for establishing the benchmarking studies relates for the most part to the UNIDO
methodology described in the UNIDO Working Paper “Global Industrial Energy Efficiency Benchmarking – An
Energy Policy Tool, Working Paper, 2010”. Furthermore, the approach for estimating energy saving potentials, the
data collection process, the definition of system boundaries and the process to check the reliability of data are part
of the methodology and are explained in this chapter.
2.1 UNIDO Benchmarking Methodology
According to the UNIDO Working Paper, a typical benchmark curve plots the efficiency of plants as a function of
the total production volume from all similar plants or as a function of the total number of plants that operate at
that level of efficiency or below.
Figure 1: Illustrative Energy Benchmark Curve for the Manufacturing Industry (UNIDO, 2010)

BENCHMARKING REPORT OF THE CERAMICS SECTOR
14
SEC in figure 1 is “Specific Energy Consumption”, BAT means “Best Available Technology” and BPT means “Best
Practice Technology”. The benchmark curve is described as follows: “The most efficient plants are represented to
the left and lower part of the curve, and the least efficient plants to the right and upper part of the curve. The
shape of benchmark curves would vary for different sectors and regions. However, typically a few plants are very
efficient and a few plants are very inefficient. This is generally represented by the steep slopes of the benchmark
curve before the first decile and after the last decile, respectively.”
This relationship can be used to support a rough assessment of the energy efficiency potential for an industrial
process, which is defined as 50% of the difference between the efficiencies observed at the first and last deciles.
In the UNIDO Working Paper, the first decile is defined as the BPT and as the international benchmark. While, the
most efficient plant is defined as Best Available Technology (BAT).
Where possible, the analysis uses physical production levels to define the deciles. Where the lack of data makes
such an approach inappropriate or unreliable, deciles are based on the number of plants.
The benchmark curves in the UNIDO Working Paper show energy efficiency benchmarks on a global level for a lot
of industries. Since the UNIDO Working Paper did not present the benchmarks for the ceramic tiles industry, the
BAT Reference Document (BREF) for Ceramic manufacturing industry published by the EU Commission was used in
this report. The data for country-specific benchmarks were based on the collected data from the facilities.
Depending on the data availability either
The Energy Efficiency Index (EEI), or
The average Specific Energy Consumption, also referred to as “Energy Performance Indicator” (EPI), is
calculated in the UNIDO Working Paper.
2.2 Drawing the Benchmarking Curves for Egyptian Industry
For the Egyptian benchmarking curves, data collected by national experts were applied. This approach gives much
more precise results. The data was checked by other national experts, system boundaries were kept and outliers
were deleted. Therefore, the results of the benchmarking studies can be applied to support improving the national
data collection on energy consumption and production volumes.
2.2.1 System Boundaries for Benchmarking
In order to make the energy efficiency benchmarks of different companies comparable, the data used for
calculating the EPI or EEI have to be defined very clearly. Following questions have to be considered:
Where is the boundary around the company? Is the quarry included? Is the truck fleet included? Is the
storage of final products included? Is the transport and shipment of final products included, etc.?
How to deal with the input of energy consumption? How to deal with data about on-site energy
production in combined heat and power plants (CHP), or in photovoltaic (PV) plants etc.?
What about energy services not produced on-site but purchased? e.g. purchased compressed air or
purchased steam?
How to deal with raw material input and semi-finished products input? Some plants produce the semi-
finished products on-site, other purchase them, etc.
What about final products that were not produced on-site, but are packed on-site, etc.?

BENCHMARKING REPORT OF THE CERAMICS SECTOR
15
The better the system boundaries are defined, the more the benchmarking will be a comparison of “apples to
apples”.
The manufacture of ceramic products takes place in different types of kilns, with a wide range of raw materials and
in numerous shapes, sizes and colors. The general process of manufacturing ceramic products, however, is rather
uniform, and largely independent of the materials used and the final product (BREF Ceramics, 2007). In general,
raw materials are mixed and cast, pressed or extruded into shape. Water is regularly used for a thorough mixing
and shaping. This water is evaporated in dryers and the products are either placed by hand in the kiln (especially
in the case of periodically operated kilns) or placed onto carriages that are transferred through continuously
operated kilns. Figure 2 presents general overview of the typical ceramics manufacturing process.
As this report is specifically concerned with the manufacture of ceramic wall and floor tiles, more focus will be
provided to the details of this industry. Figure 3 presents a schematic view of wall and floor tile manufacturing.The
manufacturing process of ceramic wall and floor tiles starts with storage of raw materials, which are divided into
two categories: clays and kaolins, and non-plastic raw materials such as quartz, chamotte, feldspars, calcium
carbonate (calcite), talc, and dolomite. Afterwards, raw materials are prepared according to the type or form of
body to be produced. Raw materials are milled in wet drum mills that can be batch or continuous mills. Also, an
elutriation and homogenizing process takes place in large tanks, and suspension is pumped from those tanks to
wet drum mills. This suspension is then processed either to ceramic powder and subjected to dust-pressing through
a dry or wet process, or ceramic paste in a paste extrusion process. After shaping, drying is carried out at varied
temperatures based on the used technology, e.g. temperature ranges between 300-350 °C in tunnel dryers, while
in vertical dryers temperatures are within range of 200-220 °C. In order to prevent fissures and glazing errors from
occurrence during the firing process, residual moisture content of less than one per cent is required. The firing
process can be single, double or even triple in roller hearth kilns, tunnel kilns, or periodically operated kilns. In
tunnel kilns, the temperature lies between 1050-1150 °C for a duration of 20-50 hours, while in modern hearth
kilns it takes one to two hours. Glazing process takes place afterwards by watering or spraying, and glazed tiles are
then placed at temperature of 1050-1300 °C in tunnel kilns or roller hearth kilns. Finally, some tiles can be ground
or polished before being sorted manually or automatically, and then packed.

BENCHMARKING REPORT OF THE CERAMICS SECTOR
16
Figure 2: General overview of a ceramics manufacturing process, (BREF Ceramics, 2007)

BENCHMARKING REPORT OF THE CERAMICS SECTOR
17
Figure 3: Schematic view of wall and floor tile manufacturing (BREF Ceramics, 2007)
The defined system boundary for the ceramics industry within this benchmarking study is (as shown in Figure 2)
“the process from the raw materials storage in ceramic plant to the tiles packaging”. The quarrying of raw materials,
transporting them to the ceramic plant, and transportation of the final product (shipping, trucks) are not part of
the system boundary, and hence the benchmarks.
2.2.2 Approach for Data Collection in Companies
Data from individual companies from the last available three years were collected. These data show the trend in
the development of energy consumption and production and allows defining the most representative EPI of the
plant to be used for the benchmark curve.
For the data collection, two different kinds of data collection sheets were developed:
Detailed data collection sheet to be used for companies that were visited by the national expert
Simplified data collection sheet to be used for companies contacted by phone and email
The detailed collection file contains the following excel sheets:
General information

BENCHMARKING REPORT OF THE CERAMICS SECTOR
18
Basic information of the company
Collected data: plant capacity and plant production [m2], number of shifts, hours of operation per year,
etc.
Resulting information: amount of produced end products [m2], production capacity
Basic technical information
Detailed information about end products and energy demanding production facilities
Collected data: type and amount of end products, boilers, compressors, etc.
Resulting information: type and amount of end products, energy consumption of most energy demanding
production facilities
Energy management
Information about implemented energy management systems
Collected data: responsible person for energy management, energy meters/sub-meters installed, energy
efficiency targets available, planned energy saving measures, etc.
Resulting information: assessment of existing or possibility of establishing an energy management system
Input data
Assessment of input flow
Collected information: primary energy input, conversion factors, raw materials and energy sources and
others
Output data
Assessment of output flow
Collected information: amount of produced end products per year
Process information
Additional written information about the different production processes
Collected information: specific manufacturing process/technology information
Resulting information: detailed information of production process
Implemented energy efficiency measures
Written information of energy efficiency measures
Collected information: saving potential of realized and planned energy efficiency measures
2.2.3 Selection of the Companies for Data Collection
According to IDA, the ceramics sector in Egypt include 38 industrial plants. The sector is designed to produce
366,006,561 m2/year of ceramic tiles (Wall, floor and porcelain tiles). The following table overviews the industrial
plants producing ceramic tiles in Egypt.
Table 1: Overview of Ceramic tiles plants in Egypt
# Plant Name Location
1 Lecico Egypt Alexandria Governorate
2 The International Ceramics Company Alexandria Governorate

BENCHMARKING REPORT OF THE CERAMICS SECTOR
19
3 Eldorado company for manufacturing of ceramics Ain Sokhna - Suez
4 Ceramica Fancy Ain Sokhna - Suez
5 El Alamia company ( ceramica rock) Ain Sokhna - Suez
6 Cleopatra company ( cleopatra Galaria) Ain Sokhna - Suez
7 The Egyptian Italian company Suez Governorate
8 Karas for manufacturing of ceramics and porcelain (ceramica orient) Suez Governorate
9 Ceramica Glamour Suez Governorate
10 Ceramica Cleopatra 10th of Ramadan
11 Ceramica Cleopatra Group 10th of Ramadan
12 Ceramica EL-Amir 10th of Ramadan
13 Ceramica Cleopatra 10th of Ramadan
14 ceramica laboteh 10th of Ramadan
15 Venous Ceramics 10th of Ramadan
16 Porcelain Majestic 10th of Ramadan
17 El Ragaa for clay products (Ceramica Venus Egypt , omega and pyramids) 10th of Ramadan
18 Porcelain and ceramic EL-Amir 10th of Ramadan
19 The Arabic company for ceramics - Aracemco El Obour City
20 Royal company for manufacturing ceramics and porcelain El Obour City
21 Sheeni Qalubiya
22 EL-Ezz company for ceramics - Gemma El Sadat City- Menoufiya
23 EL-Ezz company for ceramics and porcelain - Gemma El Sadat City- Menoufiya
24 ceramica Prima (EJMY) El Sadat City- Menoufiya
25 ceramica Granito El Sadat City- Menoufiya
26 EL-Ezz for ceramics and porcelain-Gemma El Sadat City- Menoufiya
27 Ceramica Misr Quesna- Minufya
28 EL-Ahlia company for ceramics 6th of October- Giza
29 Alfa group 6th of October- Giza
30 Venezia group 6th of October- Giza
31 New Alfa 6th of October- Giza
32 Ceramica Gloria Beni Suef Governorate
33 Ceramica Mayorka Beni Suef Governorate
34 EL-Amal company Fayoum Governorate
35 Pharaos company for ceramics Fayoum Governorate
36 Pharaos company for porcelain Fayoum Governorate
37 Pharaos Style for manufacturing of ceramics and porcelain Fayoum Governorate
BENCHMARKING REPORT OF THE CERAMICS SECTOR
20
2.2.4 Schedule for Data Collection
For the purpose of data collection, ceramics plants were contacted and site visits were arranged. However, several
plants showed reluctance to cooperate
Table 2: Schedule for data collection
Plant Number
Visit date Remarks
1st Round 2nd Round
1 10/02/2016 12/04/2016 Cooperative
2 18/01/2016 Cooperative
3 01/02/2016 Cooperative
4 01/02/2016 Non Cooperative
5 01/02/2016 Non Cooperative
6 15/02/2016 21/04/2016 Cooperative
7 08/02/2016 10/05/2016 Cooperative
8 13/01/2016 02/06/2016 Cooperative
9 11/01/2016 02/06/2016 Cooperative
10 11/01/2016 02/06/2016 Cooperative
11 11/01/2016 02/06/2016 Cooperative
12 15/02/2016 21/04/2016 Cooperative
13 28/01/2016 28/04/2016 Cooperative
14 28/01/2016 28/04/2016 Cooperative
15 28/01/2016 28/04/2016 Non Cooperative
16 15/02/2016 Non Cooperative
17 21/01/2016 18/05/2016 Cooperative
18 21/01/2016 18/05/2016 Non Cooperative
2.2.5 Limitations of Data Collection and Barriers Encountered
Of the 38 plants in Egypt, 19 plants (13 companies) were willing to cooperate in the project. According to the
design capacity data, the 13 companies included in the study produce 211,931,561 m2/year of ceramic tiles, which

BENCHMARKING REPORT OF THE CERAMICS SECTOR
21
cover 58% of the sector as shown in the following figure. After analyzing the data, one company Company 11, was
removed because it was considered an outlier. Most of the other companies were unwilling to share their data,
and few others claimed that their data will not be respresentative since they have production-related problems.
Figure 4 Production share of the participating companies
2.3 International Benchmarks for Comparison
Most of the studies relevant to the energy consumption in the ceramic tiles industry refers to the “Best Available
Techniques (BAT) Reference Document for the Ceramic Manufacturing Industry”, published in 2007. The study “World
Best Practice Energy Intensity Values for Selected Industrial Sectors” does not include the ceramic tiles. Moreover,
the UNIDO Working Paper “Global Industrial Energy Efficiency Benchmarking – An Energy Policy Tool, 2010” just
focuses on the ceramic bricks without any relevant content about the ceramic tiles.
2.3.1 International Best Practice
Spain and Brazil are two of the world's biggest ceramic tile producers. Recent studies have been published for both
countries focusing on specific thermal energy consumption (Monfort, E et al, 2012). The following table presents
the minimum, maximum and average values for both countries, in addition to the BAT value. The average specific
thermal energy consumption values in two countries are low compared to many other countries. It is to be noted
that there are many factors that affect the specific thermal energy consumption of ceramic tiles manufacturing.
These include the type of kiln (tunnel versus rotary hearth), type of firing (single versus double firing), type of raw
materials, and the provision of energy recovery.
Table 3: Specific thermal energy consumption of ceramic tiles in Spain and Brazil compared to BAT
Benchmark
(BM)
Spain
Brazil Best Available Technology (BAT)
Range Average Range Average BAT
GJ/t (thermal) 3.82-7.1 5.14 3.98-6.35 4.98 3.13
For calculating the energy saving scenarios in section 4.6, the international BPT value for themal energy
consumption was taken as 3.82 GJ/t ceramic.
42.10
57.90
Non-participatingCompanies
ParticipatingCompanies

BENCHMARKING REPORT OF THE CERAMICS SECTOR
22
2.3.2 International Best Available Techniques (BAT)
The “Best Available Techniques (BAT) Reference Document for the Production of Ceramic Manufacturing Industry”
published in 2007 indicates BAT-associated energy consumption levels for the different processing steps in the
ceramic tiles manufacture as shown in the table below.
Table 4: BAT-Associated Energy Consumption Levels in different processing steps
Process Unit Industry Benchmark
Thermal energy: Spray drying process
GJ/t 0.98−2.2
Thermal energy: Drying process
GJ/t 0.25−0.75
Thermal energy: Firing: single-fired tiles (Tunnel kilns)
GJ/t 5.42−6.3
Thermal energy: Firing: double-fired tiles (Tunnel kilns)
GJ/t 5.92−7.3
Thermal energy: Firing: single-fired tiles (Roller hearth kilns)
GJ/t 1.9−4.8
Thermal energy: Firing: double-fired tiles (Roller hearth kilns)
GJ/t 3.4−4.62
Electric energy:
Dry grinding
GJ/t 0.04−0.07
Electric energy:
Wet grinding
GJ/t 0.05−0.35
Electric energy:
Spray drying
GJ/t 0.01−0.07
Electric energy: Pressing
GJ/t 0.05−0.15
Electric energy: Drying
GJ/t 0.01−0.04
Electric energy: Firing
GJ/t 0.02−0.15
By adding the lower ends of the different processes, it can be concluded that the thermal BAT value is 3.13 GJ/t
ceramic, while the electric BAT value is 0.18 GJ/t ceramic.

BENCHMARKING REPORT OF THE CERAMICS SECTOR
23
2.4 Approach for Estimating Energy Saving Potentials
The following chapter describes the methods used for calculating energy saving potentials for the ceramics sector
in Egypt. The results are shown in chapter 4.5
2.4.1 Saving Potential of Participating Companies
For each participating company, the specific energy consumption (SEC) was calculated.
The lowest SEC of all analyzed companies is defined as best available technology (BAT) and the second
lowest SEC is defined as best practice technology (BPT).
Assumption for saving potential of companies that participated on the benchmarking study:
All participating companies achieve the SEC of the company with the lowest SEC (BAT).
Saving Potential of Company x = (SEC of Company x- BAT national) * Production of Company x
2.4.2 Saving Potential of the Whole Sector in Egypt
The second type of saving potentials calculated was the saving potential of the whole sector in Egypt. For this
calculation the following data was necessary:
The total annual production of the sector. This information was taken from the IDA data.
The SEC of the total sector: As this information is not available, the project team defined the weighted
average SEC of the companies participating in the benchmarking study (SECy) as SEC of the whole sector.
This assumption is eligible as the companies that participated the benchmark studies represent a good
sample of the whole sector.
With this information the saving potential of the whole sector can be calculated with the same formula:
Potential of the Whole Sector = (Weighted SEC of the Analyzed Companies – International BAT) * Total
Production of the Whole Sector
The saving potential of the whole sector is calculated with the lowest known BAT. This can be either the national
BAT or the international BAT. For the ceramics sector in Egypt, the international BAT is lower than the national
BAT.
2.4.3 Saving Potentials for the BPT Scenario
In chapter 4.6, different saving scenarios are shown. For the BPT scenario also the lowest known BPT value was
taken. This value can either be a national or an international one. For the ceramic tiles sector in Egypt, the
international BPT is lower than the national BPT.
2.5 Possible Sources on National Level
In the beginning of the project, it was planned to establish in addition to the benchmark curves of individual
companies, similar benchmark curves as in the UNIDO working paper by using national statistical data from the
Industrial Development Authority (IDA) and the Central Agency for Public Mobilization and Statistics (CAPMAS).
During the project activities the Egyptian experts evaluated the data of IDA and CAPMAS and came to the

BENCHMARKING REPORT OF THE CERAMICS SECTOR
24
conclusion, that the data is too outdated and in some cases not reliable. Therefore, the project team decided not
to establish benchmark curves with the statistical data.
2.5.1 Energy Consumption Data on National Level (Top-Down)
On the national level, the information about energy consumption of individual companies is collected by the
Ministry of Electricity and Renewable Energy and by the Ministry of Petroleum. The ministries in charge of
electricity and energy in Egypt collect accurate data from industrial companies on energy consumption, on a
monthly basis. As this data is not publicly available; it requires approval from individual companies to be shared.
Unfortunately, it was not possible to get the data for the UNIDO project. Basically, the Egyptian government could
establish benchmark curves with the energy consumption data from the ministry and the production data from
CAPMAS.
Another source for energy consumption data on national level is the IDA. IDA is responsible for granting licenses
for energy supply for industrial enterprises. If a factory starts its operation, it will get a contract and license for five
years of energy supply from IDA. Therefore, IDA data reflect “planned energy consumption data” and not “metered
energy consumption data”. Every five years the license for energy supply needs to be renewed that brings an
update of the planned data of IDA.
The energy consumption would have been overestimated as it reflects the licensed energy supply, but knowing
this, the curve would have given a first insight in the sectors’ specific energy consumption. As already mentioned,
after a closer evaluation of the IDA and CAPMAS data, it was decided not to use this data for establishing
benchmark curves.
UNIDO's main counterpart is EEAA which represented the Ministry of Environment. The other project partners
are the Industrial Development Authority (IDA), Industrial Modernization Center (IMC) and Egyptian Organization
for Standardization (EOS) from the Ministry of Industry and Foreign Trade (MoIFT) and the Federation of Egyptian
Industries (FEI).
2.5.2 Production Data on National Level (Top-Down)
For establishing benchmarks on national level, data on annual production of the whole ceramics industry is also
required. The Central Agency for Public Mobilization and Statistics (CAPMAS) collects production data on sector
level. The national expert analyzed the CAPMAS data and came to the conclusion that this data is not reliable.
Therefore, this report does not contain a benchmark curve with national statistical data but with much more
reliable data from individual companies.
2.6 Process to Check Reliability of Data
The data collected from the companies have been checked by the national experts. Plausibility checks of data filled
into the excel sheets included the following comparisons and evaluation:
Annual production hours in comparison to maximum annual hours
Production capacity to production output
Trend of energy consumption and production (3 years)
Total energy consumption / production (EPI)
Input / output balance

BENCHMARKING REPORT OF THE CERAMICS SECTOR
25

BENCHMARKING REPORT OF THE CERAMICS SECTOR
26
3 Basic Sector Information
3.1 Economic and Legislative Framework
Egypt is one of the top 15 manufacturing countries in the ceramic tiles industry with a production rate of 200 million
squared meters in 2012, which comprised 1.8% of the total world’s production by then (Stock, 2013).
The ceramics industry in Egypt was initiated in the late 50s through “SHINI”, a public sector company that started
by manufacturing ceramic tiles, sanitary wares and pottery. Many reasons have encouraged Egyptian investors to
invest in this industry. This includes the harmonization of the Egyptian consumers requirements with the ceramic
tiles properties such as easy maintenance, easy to clean, suitable to hot weather, and reasonable cost. The increase
of the domestic consumption due to the population growth and the availability of the body raw materials (feldspar,
kaolin, clay, and quartz) are other reasons that encouraged investors. In the late 60s, LECICO started to produce
ceramic tiles and sanitary ware as the first private company. Later in the 70s, a joint venture company of
ARACEMCO and private companies of ALAHLIA for tiles and GRAVENA for sanitary wares followed in the same field.
Egypt then stopped being a net importer in the late 80s and has become a player in the international markets with
the introduction of new private companies like CERAMICA CLEOPATRA that was established in 1987. As the per
capita consumption increased, the domestic sector tried to satisfy this development. In the late 90s, the production
capacity has increased due to new investments of some companies; however, they were still focused on the
domestic market whereas LECICO started to export sanitary ware to Europe through a European multi-brand group
(SANITEC). Most of the ceramic companies have been established in the new industrial cities around Cairo and
Alexandria. Consequently, the main governing laws are law No. 8 of 1997 concerning investment guarantees and
incentives in addition to law No. 159 of 1981 concerning the new industrial cities (IMC, 2005).
There are various major sectors that depend on the ceramic products such as wall and floor tiles, refractory
products, sanitary ware, bricks and roof tiles, technical ceramics, vitrified clay pipes, expanded clay aggregates, and
inorganic bonded abrasive. However, the main focus of this report is the ceramic wall and floor tiles. According to
IDA, there are 38 ceramic tiles industrial plants in Egypt with a total design capacity of 366 Million squared meters.
The data presented in this report was collected from 19 ceramic tiles plants (representing 13 companies), which
represents about 58% of Egypt’s production.
Generally, ceramic products are made of inorganic materials with the possibility of containing some organic
materials. Ceramic products can have a small fraction of clay or none at all, and they can be glazed or unglazed,
porous or vitrified. Properties of ceramic products include high strength, long service life, chemical inertness, wear
resistance, non-toxicity, resistance to heat and fire, and usually electric resistance (European Commission, 2007).
The manufacturing process of the ceramic products is independent of the type of used kilns, and the used raw
materials, which can be different in shape, size, or color. The main steps of the ceramics manufacturing process
are: mining/quarrying of raw materials, transport to the ceramic plant, storage of raw materials, preparation of
raw materials, shaping, drying, surface treatment, firing, and subsequent treatment, as shown above in Figure 2.
However, the firing process is often of multiple stages when used for manufacturing wall and floor tiles.
Specifically, the manufacturing process of ceramic wall and floor tiles starts with storage of raw materials, which
are divided into two categories: plastic raw materials like clays and kaolins, and non-plastic raw materials such as
quartz, chamotte, feldspars, calcium carbonate (calcite), talc, and dolomite. Afterwards, raw materials are
proportioned gravimetrically considering the moisture content of those materials. Raw materials are milled in wet
drum mills that can be batch or continuous mills. Also, an elutriation and homogenizing process takes place in large
tanks, and suspension is pumped from those tanks to wet drum mills. This suspension is then processed either to

BENCHMARKING REPORT OF THE CERAMICS SECTOR
27
ceramic powder and subjected to dust-pressing through a dry or wet process, or ceramic paste in a paste extrusion
process. After shaping, drying is carried out at varied temperatures based on the used technology, e.g. temperature
ranges between 300-350 °C in tunnel dryers, while in vertical dryers temperatures are within a range of 200-220
°C. Glazing process is taking place afterwards by watering or spraying, and glazed tiles are then placed at
temperature of 1050-1300 °C in tunnel kilns or roller hearth kilns. In order to prevent fissures and glazing errors
from occurrence during the firing process, residual moisture content of less than one per cent is required. The firing
process can be single, double or even triple in roller hearth kilns, tunnel kilns, or periodically operated kilns. In
tunnel kilns, the temperature lies between 1050-1150 °C for a duration of 20-50 hours, while in modern hearth
kilns it takes one to two hours. For specially formed tiles, they are fired in shuttle kilns or tunnel kilns at
temperature up to 1100 °C. Finally, some tiles can be ground or polished before being sorted manually or
automatically, and then packed.
The best available technique for ceramic tiles attains a total specific energy consumption of 3.31 GJ/t. In order to
reduce the energy consumption of the ceramic tiles industry, the general BAT that should be applied can be
summarized in improving the design of kilns and dryers, recovery of excess heat from kilns especially from the
cooling zone, modification of ceramic bodies, and cogeneration/combined heat and power plants.
3.2 Production Capacities
As of today, there are 38 ceramics factories in Egypt with a total design capacity of around 366 million square
meters of tiles, according to the Industrial Development Authority. The available data in this report are obtained
from 19 ceramics plants (representing 13 companies) that represent 58% of Egypt’s production capacity. The
following table demonstrates the name and the design capacity of the different ceramic tiles industrial plants in
Egypt. Most of these companies belong to the private sector.
Table 5: Number of Ceramic Tiles Plants in Egypt (Source: IDA)
Factory Design Capacity (Million m2/yr)
1. Pharaohs 6.0
2. Royal 16.5
3. Gloria 12.0
4. Granito 45.0
5. Masr Ceramics M.I.C.C 14.0
6. Ceramica Cleopatra Group 16.0
7. Eldorado - Cleopatra 12.5
8.Fancy - Cleopatra
8.0

BENCHMARKING REPORT OF THE CERAMICS SECTOR
28
Factory Design Capacity (Million m2/yr)
9. Galaria 1,2 23.0
10. El-Ezz Company for Ceramics - Gemma 3.2
11. Alfa 10.0
112.1112. New Alfa 0.3
13. Venus 6.5
14. Lecico Egypt 24.0
15. ElAlamia Company (ceramica rock) 10.0
16. The Egyptian Italian Company 4.0
17. Karas for manufacturing of ceramics and porcelain (ceramic orient)
4.0
18. Ceramica Glamour 6.0
19. Ceramica Cleopatra 1 2.9
20. Ceramica Cleopatra 2 4.0
21. Ceramica El-Amir 4.9
22. Ceramica Laboteh 17.5
23. Porcelain Majestic 3.0
24. El Ragaa for clay products (Ceramica Venus Egypt, Omega, and Pyramids)
14.0
25. Porcelain and Ceramic El-Amir 7.5
26. The Arabic company for ceramics - Aracemco
20.0
27. Sheeni 2.8
28. El-Ezz company for ceramics and porcelain – Gemma 1
11.0
29. Ceramica Prima (EJMY) 8.1

BENCHMARKING REPORT OF THE CERAMICS SECTOR
29
Factory Design Capacity (Million m2/yr)
30. El-Ezz company for ceramics and porcelain – Gemma 2
6.0
31. Ceramica Misr 15.0
32. El-Ahlia company for ceramics 2.7
33. Venezia Group 11.0
34. Ceramica Art 9.0
35. Ceramica Mayorka 3.6
36. El-Amal Company 4.4
37. Pharaohs company for ceramics 3.0
38. Pharaohs Style for manufacturing of ceramics and porcelain
3.0
Total 374.4
3.3 Economics of the Sector
3.3.1 Main Products
The ceramic tiles industry in Egypt focuses on three main categories based on the price, which are:
Low price products: price of the low price products ranges between 16-18 EGP (price as of 2005).
Medium price products: price of the medium products varies from 19 to 24 EGP (price as of 2005).
High price products: price of this category ranges between 25-30 EGP (price as of 2005).
Common wall tiles dimensions are 10*10, 20*20, 20*30, and 20*35 cm2. On the other hand, common floor tiles
dimensions are 30*30, 30*35, 42*42, and 50*50 cm2. All these dimensions are available as low price, medium price
and high price products. In a survey conducted in 2004, 42% of the manufacturers work on the low price products,
40% on the medium price products, and the rest work in the high price products. Generally, the price of the three
categories is deemed cheap compared to the international prices in Europe and worldwide. Those inexpensive prices
can be an advantage for exporting, but it can also limit the Egyptian products to cheap products category that might
be difficult to change later (IMC, 2005). All the Egyptian products are abiding by the Egyptian standards No.3168-1,
2, 3, 4, 5, 6/2000. These standards are based on ISO 13006 standards for dry-pressed ceramic tiles.
3.3.2 Annual Turnover
As of 2004, the ceramic tiles and sanitary ware industry in Egypt contributed to the Egyptian macroeconomic total
turnover with approximately 300 million dollars, which is almost 0.4% of the country’s GDP. Also, the export
turnover was about 60 million dollars, which accounts as 20% of the total ceramic tiles and sanitaryware sector’s

BENCHMARKING REPORT OF THE CERAMICS SECTOR
30
turnover and about 0.35% of the total Egyptian exports. Moreover, around 25,000 persons were employed directly
in the sector, which represented about 0.5% of the total industrial manpower in Egypt. More recent data about
the turnover of the ceramic tiles is scarce in the literature. However, the above-mentioned values have of course
increased significantly (may be more than doubled) since the Egyptian production capacity increased from 90
million m2 in 2004 to 220 million m2 in 2010 (IMC, 2005). In addition, and according to a study conducted by the
ceramic division in the Federation of Egyptian Industries (FEI), the Egyptian exports amounted to 391 million dollars
in 2012 and 178 million dollars in 2015. This decline started to take place due to the devaluation of the Egyptian
pound that led to massive increase in the production cost, which in return impacted the competitive price of
Egyptian products in the region e.g. Iran, Saudi Arabia, Turkey, and UAE (Daily News Egypt, 2016) .
3.3.3 Main Markets
According to the Central Agency for Public Mobilization and Statistics in Egypt (CAPMAS), the main market for the
Egyptian ceramic products is the local market. Therefore, low percentage of about 20-25% of the production is
exported to foreign markets. It is also obvious that the final destination markets are generally the neighboring
markets in the MENA region specifically Libya, Sudan, Syria, Palestine, and Yemen, except for the two market
leaders, which are able to export to Europe.
3.3.4 Main Drivers for Energy Consumption
The energy consumption for ceramic tiles production is divided into thermal energy consumption, and electric
energy consumption. The main drivers for thermal energy consumption are kiln firing process, drying and spray
drying processes. On the other hand, the main drivers for electric energy consumption are grinding mills, pressing,
in addition to drying and firing. The following table shows the different energy inputs for each production process.
Table 6: Overview of Specific Energy Consumption of Different Production Processes for ceramic tile manufacturing (EU BREF, 2005)
Production Process
Type of input energy
Unit
Industry Benchmark
Spray drying process Thermal energy GJ/ton 0.98-2.20
Drying process Thermal energy GJ/ton 0.25-0.75
Firing: single-fired tiles (Tunnel kilns)
Thermal energy GJ/ton 5.4-6.3
Firing: double-fired tiles (Tunnel kilns)
Thermal energy GJ/ton 6.0-7.3
Firing: single-fired tiles (Roller hearth kilns)
Thermal energy GJ/ton 1.9-4.8
Firing: double-fired tiles (Roller hearth kilns)
Thermal energy GJ/ton 3.4-4.6
Pressing Electric energy GJ/ton 0.05-0.15

BENCHMARKING REPORT OF THE CERAMICS SECTOR
31
Drying Electric energy GJ/ton 0.01-0.04
Firing Electric energy GJ/ton 0.02-0.15
3.4 Energy Data of the whole sector
The following conversion factors were used in the calculations.
Table 7: Conversion factors
Source Natural Gas (MJ/m3)
IPCC 2006 Guidelines (Default Values)
37.74
Source Natural Gas (m2 ton)
IDA 0.018
3.4.1 Thermal Energy Consumption of the Whole Sector
Generally, the commonly used fuels in the ceramic tiles sector are Natural Gas, Diesel, LPG, Mazout as well as solid
fuels, LNG and biogas/biomass. According to IDA, the Egyptian ceramic tiles sector consumption is approximately
687 Million m³/year of natural gas for the 38 plants.
3.4.2 Electricity Consumption of the Whole Sector
The total electrical energy consumption of the Egyptian ceramic tiles sector is estimated to be 781,000 MWh/year
of electricity from the 38 ceramic tiles plants, according to IDA.
3.4.3 Energy Costs
For studying the financial efficiency in the ceramic tiles production, the energy cost per m2 of tiles was calculated
for each factory along the plant’s year of operation. The energy costs varied from one year to another in each plant
due to the increase in energy prices. Average energy costs per m2 of ceramic tiles ranged from 2.59 EGP/ m2 in 2013
to 6.83 EGP/ m2 in 2015.
3.5 Energy Efficiency Measures Implemented and/or Planned
All factories participated in this study have energy saving measures planned. Most of the plants consider energy
efficiency in investment decisions and have energy efficiency targets. The energy efficiency plans can include the
design of kilns and dryers, recovery of excess heat from kilns, cogeneration/combined heat and power plants, and
modification of ceramic bodies.

BENCHMARKING REPORT OF THE CERAMICS SECTOR
32
4 Analysis of Results
All companies in the Egyptian ceramics sector were contacted to participate in the benchmarking study. A total of
38 companies were invited to cooperate. After conducting site visits to 18 companies, only 13 companies were
willing to cooperate and participate in the project. That’s because some of the private sector companies were
afraid to share their production data and numbers publicly (data confidentiality), while others claimed they have
problems with their plants and production lines, that will make them unable to participate.
The methodology of data collection involved sending a simplified data collection sheet to the companies that were
contacted via phone or e-mail before the site visit, and presenting and discussing the detailed data collection sheet
during the site visit. Some companies had concerns regarding the confidentiality of the data provided from their
side, and this issue was solved by signing a confidentiality letter with UNIDO. Frequent communication was
maintained with the participating companies after the site visits to follow up on the data collection and also to
address their inquiries regarding the detailed data collection sheets.
The ceramic tiles production capacities of the 19 analyzed plants out of the 38 plants represent around 58% of
the total production capacity of the Egyptian ceramic tiles industry.
4.1 Achieved Data Sets for Analysis
This subsection describes the data regarding ceramic tiles production and energy consumption of the analyzed
companies. These data were gathered for years 2013, 2014 and 2015.
4.1.1 Production Volume of Analyzed Companies
The following table represents the ceramic tiles production volume of the analyzed companies for years 2013,
2014 and 2015. As mentioned before, and after the analysis of data, Company 11 was considered an outlier, and
hence its data will not be used in the upcoming sections.

BENCHMARKING REPORT OF THE CERAMICS SECTOR
33
Table 8: Production Volume of Analyzed Companies
Design Capacity
(sq. m/yr)
2013
(sq. m/yr)
2014
(sq. m/yr)
2015
(sq. m/yr)
Company 1 12,000,000 22,798,548 24,140,534 26,357,737
Company 2 16,500,000 14,343,304 12,699,076 10,620,453
Company 3 12,000,000 8,612,483 11,048,089 8,745,422
Company 4 45,000,000 15,396,268 16,639,183 15,540,688
Company 5 15,000,000 14,893,560 15,028,245 10,372,882
Company 6 22,897,000 12,740,472 14,003,536 14,996,856
Company 7 12,500,000 5,030,249 6,711,166 7,570,508
Company 8 8,527,000 6,468,810 5,854,897 6,837,090
Company 9 23,000,000 19,947,240 21,998,047 23,693,646
Company 10 20,240,000 13,766,803 12,680,944 9,287,661
Company 12 267,561 5,634,147 8,656,915 11,984,116
Company 13 14,000,000 12,600,000 12,600,000 12,600,000
The design capacity of the 12 analyzed companies (201,931,561 sq. m/year) represents about 55% of the total
design capacity.
4.1.2 Energy Consumption of Analyzed Companies
The following conversion factors were used to calculate the energy consumption of the analyzed companies.
Table 9: Conversion factors
Source Natural Gas (MJ/m3)
IPCC 2006 Guidelines (Default Values)
37.74
Source Natural Gas (m2 ton)
IDA 0.018
4.1.2.1 Thermal Energy Consumption
The following table represents the amount of thermal energy consumed and ceramic tiles produced annually by
the analyzed ceramic companies. All gathered data are along the range of years from 2013 to 2015. The main fuel
that is used in the Egyptian ceramic industry is Natural Gas.

BENCHMARKING REPORT OF THE CERAMICS SECTOR
34
Table 10: Thermal energy consumed by the analyzed ceramic companies
Plant No. 2013 2014 2015
Avg. Thermal Energy Consumption
Avg. SEC
GJ/Year GJ/ton GJ/Year GJ/ton GJ/Year GJ/ton (GJ/year) (GJ/ton)
Company 1 2,464,800 6.006 2,755,211 6.341 2,713,543 5.719 2,644,518 6.022
Company2 1,381,673 5.352 1,380,953 6.041 1,255,744 6.569 1,339,457 5.987
Company3 785,307 5.066 1,045,472 5.257 853,525 5.422 894,768 5.248
Company4 1,552,529 5.602 1,587,119 5.299 1,480,380 5.292 1,540,009 5.398
Company5 1,461,411 5.451 1,474,627 5.451 1,056,973 5.661 1,331,003 5.521
Company6 1,602,956 6.990 1,747,030 6.931 1,917,267 7.102 1,755,751 7.008
Company7 608,608 6.722 721,737 5.975 773,969 5.680 701,438 6.125
Company8 839,108 7.206 770,799 7.314 830,542 6.749 813,483 7.090
Company9 2,380,103 6.629 2,480,680 6.265 2,425,278 5.687 2,428,687 6.193
Company10 1,303,716 5.261 1,269,927 5.564 1,072,723 6.417 1,215,455 5.747
Company12 803,923 7.927 890,486 5.715 1,303,363 6.042 999,257 6.561
Company13 1,426,567 6.290 1,521,672 6.709 1,616,776 7.129 1,521,672 6.709

BENCHMARKING REPORT OF THE CERAMICS SECTOR
35
Figure 5 illustrates the range of thermal SEC among the analyzed companies. The figure demonstrates that the
specific thermal energy consumption of the analyzed companies is close to the higher end values for plants
operating in Brazil and Spain presented in chapter 2 of the study.
Figure 5: Range of Thermal SEC among the Analyzed Companies in GJ/ton
4.1.2.2 Electrical Energy Consumption
Table 11 demonstrates the electrical energy consumed annually by the analyzed ceramic plants, gathered in the
range of years from 2013 to 2015.
0
1
2
3
4
5
6
7
8
C01 C02 C03 C04 C05 C06 C07 C08 C09 C10 C12 C13

BENCHMARKING REPORT OF THE CERAMICS SECTOR
36
Table 11: Electric Energy Used by the analyzed ceramics companies
2013
(MWh/Year)
2014
(MWh/Year)
2015
(MWh/Year)
Average (MWh/year)
Average SEC (GJ/ton)
Company 1 63,194 62,185 70,807 65,395 0.54
Company 2 40,412 38,631 36,377 38,473 0.62
Company 3 25,555 29,715 29,780 28,350 0.60
Company 4 40,686 47,679 48,505 45,623 0.58
Company 5 37,234 37,571 26,969 33,925 0.51
Company 6 55,427 59,251 59,968 58,215 0.84
Company 7 20,379 23,811 26,689 23,626 0.74
Company 8 42,770 39,965 43,623 42,119 1.32
Company 9 80,352 84,118 86,378 83,616 0.77
Company 10 52,549 47,550 43,253 47,784 0.81
Company 12 7,463 12,716 14,673 11,617 0.27
Company 13 48,227 40,197 42,197 43,540 0.69
Figure 6 illustrates the range of electrical SEC among the analyzed companies. The figure demonstrates that the
specific electrical energy consumption for most of the analyzed companies is close to the higher end values of
the BAT industry benchmark described in chapter 2 of the study.

BENCHMARKING REPORT OF THE CERAMICS SECTOR
37
Figure 6: Range of Electrical SEC among the Analyzed Companies in GJ/ton
4.1.2.3 Total Energy Consumption
Table 12 demonstrates the total energy (thermal and electrical) consumed annually by the analyzed ceramic
companies, gathered in the range of years from 2013 to 2015.
0
0.2
0.4
0.6
0.8
1
1.2
1.4
C01 C02 C03 C04 C05 C06 C07 C08 C09 C10 C12 C13

BENCHMARKING REPORT OF THE CERAMICS SECTOR
38
Table 12: Overview Energy Consumption and Specific Energy Consumption of Analyzed Plants: Thermal, Electrical and Total
Company No. Average Production (Sq.
m/year)
Average Thermal Energy
Consumption
Average electrical Energy
Consumption
Average Total Energy
Consumption
Specific Thermal Energy
Consumption
Specific Electrical Energy
Consumption
Specific Total Energy
Consumption
(GJ/year) (GJ/year) GJ/year GJ/t GJ/t GJ/t
Company 1 24,432,273.00 2,644,518 235,422 2,879,940 6.02 0.54 6.56
Company 2 12,554,277.67 1,339,457 138,504 1,477,961 5.99 0.62 6.61
Company 3 9,468,664.67 894,768 102,060 996,828 5.25 0.60 5.85
Company 4 15,858,713.00 1,540,009 164,244 1,704,253 5.40 0.58 5.97
Company 5 13,431,562.33 1,331,003 122,129 1,453,132 5.52 0.51 6.03
Company 6 13,913,621.33 1,755,751 209,575 1,965,326 7.01 0.84 7.85
Company 7 6,437,307.67 701,438 85,055 786,493 6.13 0.74 6.87
Company 8 6,386,932.33 813,483 151,630 965,113 7.09 1.32 8.41
Company 9 21,879,644.33 2,428,687 301,018 2,729,705 6.19 0.77 6.96
Company 10 11,911,802.67 1,215,455 172,023 1,387,478 5.75 0.81 6.56
Company 12 8,758,392.67 999,257 41,822 1,041,079 6.56 0.27 6.83
Company 13 12,600,000.00 1,521,672 156,744 1,678,416 6.71 0.69 7.40
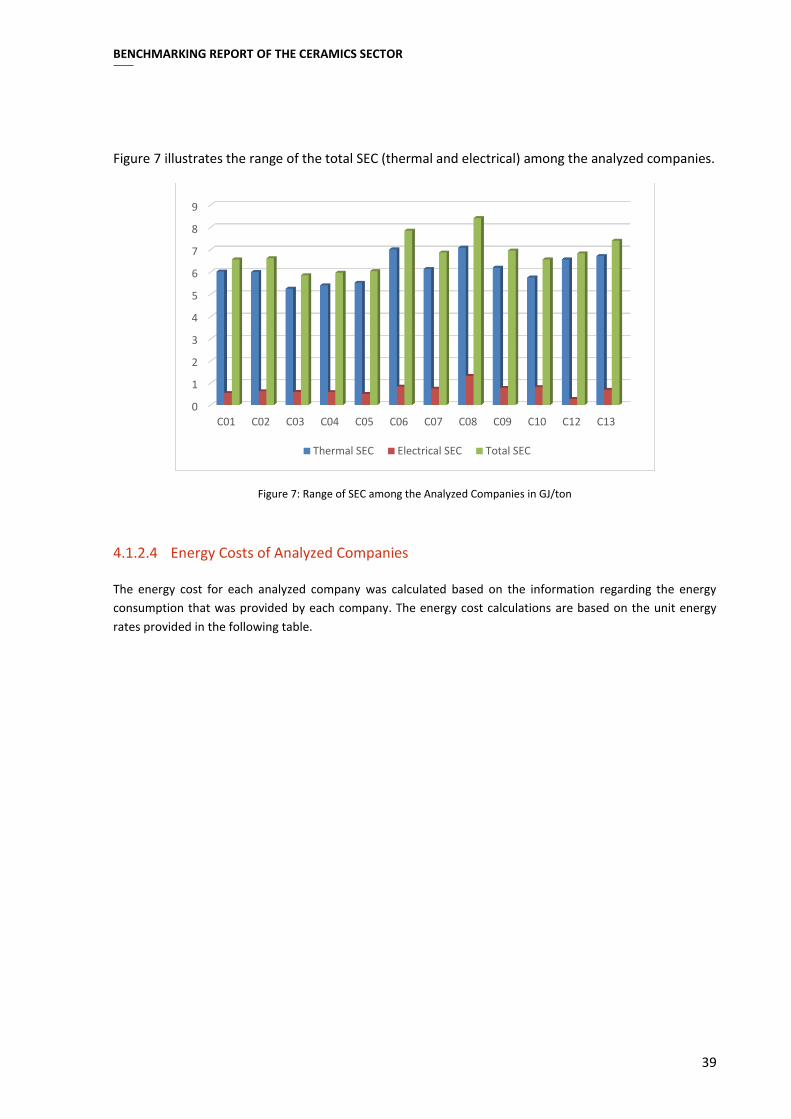
Weighted SEC of analyzed companies 6.09 0.67 6.76
National BAT 5.066 0.24 5.66
International BAT 3.13 0.18 3.31
BENCHMARKING REPORT OF THE CERAMICS SECTOR
39
Figure 7 illustrates the range of the total SEC (thermal and electrical) among the analyzed companies.
Figure 7: Range of SEC among the Analyzed Companies in GJ/ton
4.1.2.4 Energy Costs of Analyzed Companies
The energy cost for each analyzed company was calculated based on the information regarding the energy
consumption that was provided by each company. The energy cost calculations are based on the unit energy
rates provided in the following table.
0
1
2
3
4
5
6
7
8
9
C01 C02 C03 C04 C05 C06 C07 C08 C09 C10 C12 C13
Thermal SEC Electrical SEC Total SEC

BENCHMARKING REPORT OF THE CERAMICS SECTOR
40
Table 13 : Unit Prices of Energy (IDA)
Year Electricity Natural Gas
Unit Price Unit Price
2013 0.263 EGP/kWh 0.569 EGP/m³
2014 0.3 EGP/kWh 1.769 EGP/m³
2015 0.38 EGP/kWh 1.885 EGP/m³
Figure 8: Energy Cost for Ceramics Production in the Analyzed Companies (2013 – 2015) in EGP/m2
The energy cost of the analyzed plants in year 2013 ranged from 2.1 EGP/m2 to 3.7 EGP/m2 with an average of
2.6 EGP/m2. The energy cost of the analyzed plants in year 2014 ranged from 5.25 EGP/m2 to 8.2 EGP/m2 with
an average of 6.13 EGP/m2, and the energy cost of the analyzed plants in year 2015 ranged from 5.9 EGP/m2 to
8.5 EGP/m2 with an average of 6.8 EGP/m2. These values reflect the significant effect of increasing energy prices
on the production cost of Egyptian ceramic tiles.
4.1.3 Status of Energy Management System in Analyzed Companies
The following criteria have been defined in order to determine the status of energy management system
implementation in each plant:
C1. Assigning of an Energy Manager
C2. Analysis of Energy Consumption
C3. Installation of Meters/Sub-meters
C4. Availability of Resources for EnMS implementation
C5. Consideration of energy efficiency in investment decisions
C6. Availability of energy efficiency targets

BENCHMARKING REPORT OF THE CERAMICS SECTOR
41
C7. Availability of previous energy audits
C8. Planning/Implementation of energy saving measures
C9. Execution of regular maintenance
Table 14 summarizes the status of energy management system implementation in the analyzed ceramics
companies.
Table 14: Status of Energy Management System Implementation in the Analyzed Ceramic Companies
Criteria C1 C2 C3 C4 C5 C6 C7 C8 C9
Company 1 No Yes No No Yes Yes Yes Yes Yes
Company 2 Yes Yes Yes No No Yes No Yes Yes
Company 3 No No Yes No Yes Yes No Yes Yes
Company 4 No Yes No Yes Yes No No Yes Yes
Company 5 No Yes Yes No Yes No No Yes Yes
Company 6 Yes Yes Yes Yes Yes Yes Yes Yes Yes
Company 7 Yes Yes Yes Yes Yes Yes Yes Yes Yes
Company 8 Yes Yes Yes Yes Yes Yes Yes Yes Yes
Company 9 Yes Yes Yes Yes Yes Yes Yes Yes Yes
Company 10 No Yes Yes Yes Yes Yes No Yes Yes
Company 12 No Yes Yes Yes Yes Yes No Yes Yes
Company 13 No No No No Yes Yes No Yes No
4.2 Energy Performance Indicators of Analyzed Companies
4.2.1 Benchmark Curve on National Level
The energy performance indicators (EPIs) calculated for the analyzed companies in the ceramic tiles sector are
Specific thermal energy consumption (GJ/ton)
Specific electrical energy consumption (GJ/ton) and
Total specific energy consumption (GJ/ton)

BENCHMARKING REPORT OF THE CERAMICS SECTOR
42
4.2.1.1 Specific Thermal Energy Consumption
Table 15: Specific Thermal Energy Consumption of the Analyzed Ceramic Plants (GJ/ton) for the year 2013
Ceramics Production
(Sq. m/year)
Production Share
Cumulative Production
Share
Specific Thermal Energy Consumption
(GJ/ton)
Company 3 8,612,483 0.057 0.06 5.07
Company 10 13,766,803 0.090 0.15 5.26
Company 2 14,343,304 0.094 0.24 5.35
Company 5 14,893,560 0.098 0.34 5.45
Company 4 15,396,268 0.101 0.44 5.60
Company 1 22,798,548 0.150 0.59 6.01
Company 13 12,600,000 0.083 0.67 6.29
Company 9 19,947,240 0.131 0.80 6.63
Company 7 5,030,249 0.033 0.84 6.72
Company 6 12,740,472 0.084 0.92 6.99
Company 8 6,468,810 0.042 0.96 7.21
Company 12 5,634,147 0.037 1.00 7.93
Figure 9: Specific Thermal Energy Consumption Benchmark Curve for 2013
The specific thermal energy consumption EPI corresponding to the national BAT value in 2013 = 5.07
GJ/t ceramic
International BAT 3.13 GJ/ton
National BAT 5.06 GJ/ton

BENCHMARKING REPORT OF THE CERAMICS SECTOR
43
The specific thermal energy consumption EPI corresponding to the international BPT value in 2013 =
3.82 GJ/t ceramic
The specific thermal energy consumption EPI corresponding to the international BAT value in 2013 =
3.13 GJ/t ceramic
Table 16: Specific Thermal Energy Consumption of the Analyzed Ceramic Plants (GJ/ton) for the year 2014
Ceramics Production
(Sq. m/year)
Production Share
Cumulative Production
Share
Specific Thermal Energy Consumption
(GJ/ton)
Company 03 11,048,089 0.07 0.07 5.26
Company 04 16,639,183 0.10 0.17 5.30
Company 05 15,028,245 0.09 0.26 5.45
Company 10 12,680,944 0.08 0.34 5.56
Company 12 8,656,915 0.05 0.40 5.71
Company 07 6,711,166 0.04 0.44 5.97
Company 02 12,699,076 0.08 0.52 6.04
Company 09 21,998,047 0.14 0.65 6.26
Company 01 24,140,534 0.15 0.80 6.34
Company 13 12,600,000 0.08 0.88 6.71
Company 06 14,003,536 0.09 0.96 6.93
Company 08 5,854,897 0.04 1.00 7.31

BENCHMARKING REPORT OF THE CERAMICS SECTOR
44
Figure 10: Specific Thermal Energy Consumption Benchmark Curve for 2014
The specific thermal energy consumption EPI corresponding to the national BAT value in 2014 = 5.26
GJ/t ceramic
The specific thermal energy consumption EPI corresponding to the international BPT value in 2014 =
3.82 GJ/t ceramic
The specific thermal energy consumption EPI corresponding to the international BAT value in 2014 =
3.13 GJ/t ceramic
Table 17: Specific Thermal Energy Consumption of the Analyzed Ceramic Plants (GJ/ton) for the year 2015
Ceramics Production
(Sq. m/year)
Production Share
Cumulative Production Share
Specific Thermal Energy Consumption
(GJ/ton)
Company 04 15,540,688 0.10 0.10 5.29
Company 03 8,745,422 0.06 0.15 5.42
Company 05 10,372,882 0.07 0.22 5.66
Company 07 7,570,508 0.05 0.27 5.68
Company 09 23,693,646 0.15 0.42 5.69
Company 01 26,357,737 0.17 0.58 5.72
Company 12 11,984,116 0.08 0.66 6.04
Company 10 9,287,661 0.06 0.72 6.42
Company 02 10,620,453 0.07 0.78 6.57
National BAT 5.06 GJ/ton
International BAT 3.13 GJ/ton

BENCHMARKING REPORT OF THE CERAMICS SECTOR
45
Company 08 6,837,090 0.04 0.83 6.75
Company 06 14,996,856 0.09 0.92 7.10
Company 13 12,600,000 0.08 1.00 7.13
Figure 11: Specific Thermal Energy Consumption Benchmark Curve for 2015
The specific thermal energy consumption EPI corresponding to the national BAT value in 2015 = 5.29
GJ/t ceramic
The specific thermal energy consumption EPI corresponding to the international BPT value in 2015 =
3.82 GJ/t ceramic
The specific thermal energy consumption EPI corresponding to the international BAT value in 2015 =
3.13 GJ/t ceramic
4.2.1.2 Specific Electrical Energy Consumption
Table 18: Specific Electrical Energy Consumption of the Analyzed Ceramic Plants (GJ/ton) for the year 2013
Ceramics Production
(Sq. m/year)
Production Share
Cumulative Production Share
Specific Electrical Energy Consumption
(GJ/ton)
Company 12 5,634,147 0.04 0.04 0.26
Company 5 14,893,560 0.10 0.13 0.50
Company 4 15,396,268 0.10 0.24 0.53
Company 1 22,798,548 0.15 0.39 0.55
Company 2 14,343,304 0.09 0.48 0.56
National BAT 5.06 GJ/ton
International BAT 3.13 GJ/ton

BENCHMARKING REPORT OF THE CERAMICS SECTOR
46
Company 3 8,612,483 0.06 0.54 0.59
Company 10 13,766,803 0.09 0.63 0.76
Company 13 12,600,000 0.08 0.71 0.77
Company 9 19,947,240 0.13 0.84 0.81
Company 7 5,030,249 0.03 0.87 0.81
Company 6 12,740,472 0.08 0.96 0.87
Company 8 6,468,810 0.04 1.00 1.32
Figure 12: Specific Electrical Energy Consumption Benchmark Curve for 2013
The specific electrical energy consumption EPI corresponding to the national BAT value in 2013 = 0.26
GJ/t ceramic
The specific electrical energy consumption EPI corresponding to the international BPT value in 2013 =
0.31 GJ/t ceramic
The specific electrical energy consumption EPI corresponding to the international BAT value in 2013 =
0.18 GJ/t ceramic
Table 19: Specific Electrical Energy Consumption of the Analyzed Ceramic Plants (GJ/ton) for the year 2014
Ceramics Production
(Sq. m/year)
Production Share
Cumulative Production
Share
Specific Electrical Energy Consumption
(GJ/ton)
Company 12 8,656,915 0.05 0.05 0.29
Company 05 15,028,245 0.09 0.15 0.50
International BAT 0.18 GJ/ton
National BAT 0.24 GJ/ton

BENCHMARKING REPORT OF THE CERAMICS SECTOR
47
Company 01 24,140,534 0.15 0.30 0.52
Company 03 11,048,089 0.07 0.36 0.54
Company 04 16,639,183 0.10 0.47 0.57
Company 02 12,699,076 0.08 0.54 0.61
Company 13 12,600,000 0.08 0.62 0.64
Company 07 6,711,166 0.04 0.66 0.71
Company 10 12,680,944 0.08 0.74 0.75
Company 09 21,998,047 0.14 0.88 0.76
Company 06 14,003,536 0.09 0.96 0.85
Company 08 5,854,897 0.04 1.00 1.37
Figure 13: Specific Electrical Energy Consumption Benchmark Curve for 2014
The specific electrical energy consumption EPI corresponding to the national BAT value in 2014 = 0.29
GJ/t ceramic
The specific electrical energy consumption EPI corresponding to the international BPT value in 2014 =
0.31 GJ/t ceramic
The specific electrical energy consumption EPI corresponding to the international BAT value in 2014 =
0.18 GJ/t ceramic
International BAT 0.18 GJ/ton
National BAT 0.24 GJ/ton

BENCHMARKING REPORT OF THE CERAMICS SECTOR
48
Table 20: Specific Electrical Energy Consumption of the Analyzed Ceramic Plants (GJ/ton) for the year 2015
Ceramics Production
(Sq. m/year)
Production Share
Cumulative Production
Share
Specific Electrical Energy Consumption
(GJ/ton)
Company 12 11,984,116 0.08 0.08 0.24
Company 05 10,372,882 0.07 0.14 0.52
Company 01 26,357,737 0.17 0.31 0.54
Company 04 15,540,688 0.10 0.41 0.62
Company 13 12,600,000 0.08 0.48 0.67
Company 03 8,745,422 0.06 0.54 0.68
Company 02 10,620,453 0.07 0.61 0.69
Company 07 7,570,508 0.05 0.65 0.71
Company 09 23,693,646 0.15 0.80 0.73
Company 06 14,996,856 0.09 0.90 0.80
Company 10 9,287,661 0.06 0.96 0.93
Company 08 6,837,090 0.04 1.00 1.28
Figure 14: Specific Electrical Energy Consumption Benchmark Curve for 2015
The specific electrical energy consumption EPI corresponding to the national BAT value in 2015 = 0.24
GJ/t ceramic
The specific electrical energy consumption EPI corresponding to the international BPT value in 2015 =
0.31 GJ/t ceramic
The specific electrical energy consumption EPI corresponding to the international BAT value in 2015 =
0.18 GJ/t ceramic
International BAT 0.18 GJ/ton
National BAT 0.24 GJ/ton

BENCHMARKING REPORT OF THE CERAMICS SECTOR
49
4.2.1.3 Total Specific Energy Consumption
Table 21: Specific Total Energy Consumption (Thermal & Electrical) of the Analyzed Ceramic Plants (GJ/ton) for the year 2013
Ceramics Production
(Sq. m/year)
Production Share
Cumulative Production
Share
Specific Total Energy Consumption
(GJ/ton)
Company 3 8,612,483 0.057 0.06 5.66
Company 2 14,343,304 0.094 0.15 5.92
Company 5 14,893,560 0.098 0.25 5.95
Company 10 13,766,803 0.090 0.34 6.02
Company 4 15,396,268 0.101 0.44 6.13
Company 1 22,798,548 0.150 0.59 6.56
Company 13 12,600,000 0.083 0.67 7.06
Company 9 19,947,240 0.131 0.80 7.43
Company 7 5,030,249 0.033 0.84 7.53
Company 6 12,740,472 0.084 0.92 7.86
Company 12 5,634,147 0.037 0.96 8.19
Company 8 6,468,810 0.042 1.00 8.53
Figure 15: Specific Total Energy Consumption Benchmark Curve for 2013
International BAT 3.31 Gj/t
National BAT 5.66 Gj/t

BENCHMARKING REPORT OF THE CERAMICS SECTOR
50
The specific total energy consumption EPI corresponding to the national BAT value in 2013 = 5.66 GJ/t
ceramic
The specific total energy consumption EPI corresponding to the international BPT value in 2013 = 4.13
GJ/t ceramic
The specific total energy consumption EPI corresponding to the international BAT value in 2013 = 3.31
GJ/t ceramic

BENCHMARKING REPORT OF THE CERAMICS SECTOR
51
Table 22: Specific Total Energy Consumption (Thermal & Electrical) of the Analyzed Ceramic Plants (GJ/ton) for the year 2014
Ceramics Production
(Sq. m/year)
Production Share
Cumulative Production
Share
Specific Total Energy
Consumption (GJ/ton)
Company 03 11,048,089 0.07 0.07 5.80
Company 04 16,639,183 0.10 0.17 5.87
Company 05 15,028,245 0.09 0.26 5.95
Company 12 8,656,915 0.05 0.32 6.01
Company 10 12,680,944 0.08 0.40 6.31
Company 02 12,699,076 0.08 0.47 6.65
Company 07 6,711,166 0.04 0.52 6.68
Company 01 24,140,534 0.15 0.66 6.86
Company 09 21,998,047 0.14 0.80 7.03
Company 13 12,600,000 0.08 0.88 7.35
Company 06 14,003,536 0.09 0.96 7.78
Company 08 5,854,897 0.04 1.00 8.68
Figure 16: Specific Total Electricity Consumption Benchmark Curve for 2014
International BAT 3.31 Gj/t
National BAT 5.66 Gj/t

BENCHMARKING REPORT OF THE CERAMICS SECTOR
52
The specific total energy consumption EPI corresponding to the national BAT value in 2014 = 5.8 GJ/t
ceramic
The specific total energy consumption EPI corresponding to the international BPT value in 2014 = 4.13
GJ/t ceramic
The specific total energy consumption EPI corresponding to the international BAT value in 2014 = 3.31
GJ/t ceramic
Table 23: Specific Total Energy Consumption (Thermal & Electrical) of the Analyzed Ceramic Plants (GJ/ton) for the year 2015
Ceramics Production
(Sq. m/year)
Production Share
Cumulative Production Share
Specific Total Energy Consumption (GJ/ton)
Company 04 15,540,688 0.10 0.10 5.92
Company 03 8,745,422 0.06 0.15 6.10
Company 05 10,372,882 0.07 0.22 6.18
Company 01 26,357,737 0.17 0.38 6.26
Company 12 11,984,116 0.08 0.46 6.29
Company 07 7,570,508 0.05 0.51 6.38
Company 09 23,693,646 0.15 0.66 6.42
Company 02 10,620,453 0.07 0.72 7.25
Company 10 9,287,661 0.06 0.78 7.35
Company 13 12,600,000 0.08 0.86 7.80
Company 06 14,996,856 0.09 0.96 7.90
Company 08 6,837,090 0.04 1.00 8.02
The specific total energy consumption EPI corresponding to the national BAT value in 2015 = 5.92 GJ/t
ceramic
The specific total energy consumption EPI corresponding to the international BPT value in 2015 =
4.13 GJ/t ceramic
The specific total energy consumption EPI corresponding to the international BAT value in 2015 =
3.31 GJ/t ceramic

BENCHMARKING REPORT OF THE CERAMICS SECTOR
53
Figure 17: Specific Total Energy Consumption Benchmark Curve for 2015
The comparison between the previous three curves shows that this energy performance indicator for the sector
shows ups and downs indicating that there are no real actions towards enhancing energy efficiency in the sector.
The following figure shows the average total energy consumption benchmark between 2013 and 2015.
Figure 18 Average Specific Total Energy Consumption Benchmark Curve between 2013 and 2015
4.3 Share of Energy Costs of Turnover
There is no available data on the sector’s profits, neither any company revenues.
International BAT 3.31 Gj/t
National BAT 5.66 Gj/t
National BAT 5.66 Gj/t
International BAT 3.31 Gj/t

BENCHMARKING REPORT OF THE CERAMICS SECTOR
54
4.4 Energy Cost Benchmark Curve for Egyptian Companies
Energy Tariffs as per the Egyptian Ministerial Decrees in the ceramics sector were changed in 2013, 2014 and
2015 as presented above in Table 13. The following table presents the energy costs per unit product of ceramic
tiles in the sampled companies.
Table 24: Energy Cost per unit product of Ceramic tiles for the Examined Sample companies
2013 2014 2015 Average
(EGP/m2) (EGP/ton) (EGP/m2) (EGP/ton) (EGP/m2) (EGP/ton) (EGP/m2) (EGP/ton)
Company 1 2.36 131.04 6.12 340.07 6.16 342.35 4.88 271.15
Company 2 2.19 121.84 6.01 333.81 7.21 400.37 5.14 285.34
Company 3 2.15 119.72 5.24 291.19 6.17 342.68 4.52 251.19
Company 4 2.22 123.06 5.33 296.08 5.94 330.19 4.50 249.78
Company 5 2.14 118.70 5.35 297.12 6.08 337.61 4.52 251.15
Company 6 3.04 168.93 7.12 395.31 7.90 439.13 6.02 334.46
Company 7 2.89 160.52 6.10 339.11 6.45 358.08 5.15 285.90
Company 8 3.69 205.24 8.22 456.51 8.49 471.74 6.80 377.83
Company 9 2.86 158.78 6.43 357.31 6.50 360.97 5.26 292.35
Company 10 2.43 135.08 5.82 323.21 7.54 418.78 5.26 292.36
Company 12 2.50 138.85 5.26 292.28 5.90 327.60 4.55 252.91
Company 13 2.71 150.74 6.62 367.58 7.68 426.72 5.67 315.01

BENCHMARKING REPORT OF THE CERAMICS SECTOR
55
Figure 19: Energy Cost Benchmark Curve for the Ceramics Sector
The increased prices of natural gas and electricity have clear and direct effect on the energy cost of the companies
as shown in Figure 19. However, it’s worth noting that some companies which have worked to reduce their
specific energy consumption were less affected by such energy price increase (e.g. C01, C08 and C09).
4.5 Annual Saving Potential
4.5.1 Annual Saving Potential for Each Plant
On the national level, the annual saving potential for each ceramic plant was calculated by the following
equation:
Potential of company x = (SEC of company x – BAT national) * production of company x
The potential savings calculated by applying only the specific thermal energy or electricity consumption is only a
theoretical value. The most important and realistic saving potential is the one corresponding to the total energy
consumption.
Using the average values of 2013, 2014 and 2015, the annual saving potential of the analyzed companies in
comparison to “Company 3” which has the least SEC is 2,561,829 GJ.
0
1
2
3
4
5
6
7
8
9
C01 C02 C03 C04 C05 C06 C07 C08 C09 C10 C12 C13
Energy Cost 2013 (EGP/m2) Energy Cost 2014(EGP/m2) Energy Cost 2015 (EGP/m2) average

BENCHMARKING REPORT OF THE CERAMICS SECTOR
56
Table 25: Potential Savings Calculated with Specific Total Energy Consumption
Average Production (tons/year)
SEC (GJ/ton) Saving Potential (%) Saving Potential (GJ/year)
Company 1 439,781 6.56 10.76% 310,176
Company 2 225,977 6.61 11.41% 170,339
Company 3 170,436 5.85 0.00% -
Company 4 285,457 5.97 2.02% 34,435
Company 5 241,768 6.03 2.91% 42,414
Company 6 250,445 7.85 25.41% 499,381
Company 7 115,872 6.87 14.77% 117,554
Company 8 114,965 8.41 30.42% 294,130
Company 9 393,834 6.96 15.91% 436,193
Company 10 214,412 6.56 10.81% 152,148
Company 12 157,651 6.83 14.30% 153,977
Company 13 226,800 7.40 20.92% 351,083
SUM 2,561,829
Comparing the thermal and electrical BAT does not bring the same results as the calculation with the total specific
energy consumption BAT. This is caused by the fact, that a company with the lowest thermal energy consumption
does not necessarily correspond to the lowest consumption in electrical energy.

BENCHMARKING REPORT OF THE CERAMICS SECTOR
57
Table 26: Potential Savings in Thermal Energy
(EGP/ton) Average Production (tons/year)
SEC (GJ/ton) Saving Potential (%) Saving Potential (GJ/year)
Company 1 439,781 6.02 12.85% 340,313
Company 2 225,977 5.99 12.34% 166,984
Company 3 170,436 5.25 0.00% -
Company 4 285,457 5.40 2.77% 42,672
Company 5 241,768 5.52 4.94% 65,979
Company 6 250,445 7.01 25.11% 440,638
Company 7 115,872 6.13 14.32% 101,621
Company 8 114,965 7.09 25.97% 211,693
Company 9 393,834 6.19 15.26% 372,243
Company 10 214,412 5.75 8.68% 106,952
Company 12 157,651 6.56 20.01% 206,993
Company 13 226,800 6.71 21.78% 331,357
SUM 2,387,444
Using the average values of 2013, 2014 and 2015, the lowest thermal SEC (GJ/ton) was found to be in company
3.
Table 27: Potential Savings in Electrical Energy
(EGP/ton) Average Production (tons/year)
SEC (GJ/ton) Saving Potential (%) Saving Potential (GJ/year)
Company 1 439,781 0.54 50.0% 117,754
Company 2 225,977 0.62 56.7% 79,347
Company 3 170,436 0.60 55.7% 57,315
Company 4 285,457 0.58 53.4% 87,757
Company 5 241,768 0.51 47.1% 57,737
Company 6 250,445 0.84 68.1% 142,963
Company 7 115,872 0.74 63.9% 54,898
Company 8 114,965 1.32 79.7% 121,098
Company 9 393,834 0.77 65.1% 196,390
Company 10 214,412 0.81 67.1% 117,299
Company 12 157,651 0.27 0.0% -
Company 13 226,800 0.69 61.2% 95,995
SUM 1,128,553

BENCHMARKING REPORT OF THE CERAMICS SECTOR
58
Using the average values of 2013, 2014 and 2015, the lowest electrical SEC was found to be in plant 12 .
4.5.2 Annual Saving Potential for the Whole Sector
4.5.2.1 Annual Saving Potential for the Whole Sector using International BAT
The annual saving potential for the whole sector was calculated using the international BAT values for electricity,
thermal and total energy use in the following equation:
Potential of whole sector = (Weighted SEC of analyzed companies – BAT international) * production of the
whole sector
Table 28: Annual Total Energy Saving Potential for the Whole Sector Compared to International BAT
Annual Production Current Total Specific
Energy (weighted average)
BAT Benchmark Percent Reduction Total Technical Potential
(t/year) (GJ/t) (GJ/t) (%) (GJ/yr)
6,588,118 6.76 3.31 51% 22,698,174
Table 29: Annual Thermal Energy Saving Potential for the Whole Sector Compared to International BAT
Annual Production Current Thermal Specific Energy
(weighted average) BAT Benchmark Percent Reduction Total Technical Potential
(t/year) (GJ/t) (GJ/t) (%) (GJ/yr)
6,588,118 6.090 3.13 49% 19,499,010
Table 30: Annual Electrical Energy Saving Potential for the Whole Sector Compared to International BAT
Annual Production Current Electrical
Specific Energy (weighted average)
BAT Benchmark Percent Reduction Total Technical Potential
(t/year) GJ/t GJ/t (%) GJ/a
6,588,118 0.666 0.180 73% 3,199,164
4.5.2.2 Annual Saving Potential for the Whole Sector using National BAT
The annual saving potential for the whole sector was calculated once again using the national BAT values for
electricity, thermal and total energy use in the following equation:
Potential of whole sector = (Weighted SEC of analyzed companies – BAT national) * production of the whole
sector
Table 31: Annual Total Energy Saving Potential for the Whole Sector Compared to National BAT
Annual Production Current Total Specific
Energy (weighted average)
BAT National Benchmark
Percent Reduction Total Technical Potential
(t/year) (GJ/t) (GJ/t) (%) (GJ/yr)
6,588,118 6.76 5.66 16% 7,216,096

BENCHMARKING REPORT OF THE CERAMICS SECTOR
59
Table 32: Annual Thermal Energy Saving Potential for the Whole Sector Compared to National BAT
Annual Production Current Thermal Specific Energy
(weighted average)
BAT National Benchmark
Percent Reduction Total Technical Potential
(t/year) (GJ/t) (GJ/t) (%) (GJ/yr)
6,588,118 6.090 5.066 17% 6,744,414
Table 33: Annual Electrical Energy Saving Potential for the Whole Sector Compared to National BAT
Annual Production Current Electrical
Specific Energy (weighted average)
BAT National Benchmark
Percent Reduction Total Technical Potential
(t/year) GJ/t GJ/t (%) GJ/a
6,588,118 0.666 0.24 64% 2,803,876
It worth noting again that comparing the thermal and electrical BAT does not bring the same results as the
calculation with the total specific energy consumption BAT. This is caused by the fact, that a company with the
lowest thermal energy consumption does not necessarily correspond to the lowest consumption in electrical
energy.
4.6 Saving Scenarios until 2050 and until 2030
4.6.1 Saving Scenarios until 2050, 2030 (using International BAT and BPT)
Within this benchmark study four different saving scenarios have been drawn until 2050 and until 2030. The
scenarios correspond to the scenarios in the UNIDO Working Paper. The four scenarios are:
Frozen efficiency: No additional energy efficiency savings are made. The current levels of energy
efficiency are not improved upon.
Baseline efficiency: Energy efficiency improves at a rate of 0.3% a year.
BPT scenario: All plants are operating at the current levels of BPT by 2050. This is equivalent to an
energy efficiency improvement of 1.32% a year in the period 2016 to 2050. The BPT is the lowest
known BPT, either on international or on national level. For the ceramics sector the BPT value is the
international BPT value 4.13 GJ/ton.
All plants are operating at the current levels of BPT by 2030. This is equivalent to an energy efficiency
improvement of 3.46% a year in the period 2016 to 2030.
BAT scenario: All plants are operating at current levels of BAT by 2050. This is equivalent to an energy
efficiency improvement of 2.08% a year in the period 2016 to 2050. The BAT is the lowest known BAT,
either on international or on national level. For the ceramics sector the BAT value is the international
BAT value 3.31 GJ/ton.
All plants are operating at the current levels of BAT by 2030. This is equivalent to an energy efficiency
improvement of 4.97% a year in the period 2016 to 2030.
Regarding the significant differences between the average total specific energy consumption in the Egyptian
ceramic tiles companies and the corresponding BAT and BPT values, and as shown in the above bullet points,
huge annual energy efficiency improvement is required. This may be difficult to be achieved unless focused
efforts are exerted by the national authorities.

BENCHMARKING REPORT OF THE CERAMICS SECTOR
60
An important factor for drawing the scenarios is the rate of production growth. Data on projections of ceramic
tiles productivity is rare. Therefore, different approaches to project the production rates were tried as shown
below.
1) Approach 1:
Historical data for ceramic tiles productivity in Egypt between 1999 and 2010 in addition to the
population in the same period were used to estimate “Per-capita” value at each year. Rate of “per
capita” development within this period was estimated, and a straight line with high R2 value was
obtained as shown in the following figure. It was assumed that the same relation will continue till 2030
and 2050.
Figure 20 Development of Ceramic tiles per capita in Egypt
In addition, the population growth for Egypt for this period was taken from the United Nations, World
Population Prospects: The 2015 Revision, available on:
http://esa.un.org/wpp/unpp/panel_population.htm
From this source, the factor for the population growth of 1.84 between 2010 and 2050 for Egypt was
used.
To get the factor for the increase in the productivity between 2010 and 2050 those two factors are
multiplied. For ceramic tiles, the factor is 6.7 until 2050 and 3.3 until 2030.
2) Approach 2:
Historical data for ceramic tiles and cement productivity in Egypt between 1999 and 2010 were used,
and ratio between their productivities was estimated in each year. A straight line with good R2 value
was obtained, as shown in the following figure. It was assumed that the same relation will continue till
2030 and 2050. Linking the ceramic tiles production to the cement production is reasonable regarding
their interconnected consumption in buildings.

BENCHMARKING REPORT OF THE CERAMICS SECTOR
61
The projection of cement productivity in Egypt in 2030 and 2050 was sourced from the “UNIDO
Benchmarking Report for the Cement Sector in Egypt".
Using the equation relating ceramic tiles and cement productivity in addition to the projected cement
productivity, the increase in the ceramic tiles productivity between 2010 and 2050 was estimated to be
8.6, while it was estimated to be 3.4 until 2030.
Figure 21 Development of (Ceramic tiles/Cement) productivity ratio in Egypt
Approach 1 is the most recommended since it entails the least magnitude of uncertainties. Therefore, it was
applied in deriving the results of the different scenarios.

BENCHMARKING REPORT OF THE CERAMICS SECTOR
62
Figure 22: Total Energy Consumption in Egyptian Ceramics Industry, Four Scenarios 2016-2050 using International BAP and BPT
Figure 23: Total Energy Consumption in Egyptian Ceramics Industry, Four Scenarios 2016-2030 using International BAP and BPT

BENCHMARKING REPORT OF THE CERAMICS SECTOR
63
Figure 24: Total Energy Consumption in Egyptian Ceramics Industry in 2030 and 2050 according to the four Scenarios using International BAP and BPT
To reach the saving of 92,117,916 GJ in 2050, the sector would need to implement energy saving measures of
about 2,631,940 GJ per year. To reach the saving of 44,637,721 GJ in 2030, the sector would need to implement
energy saving measures of about 2,975,848 GJ per year.
4.6.2 Energy Savings in 2030 and 2050
The following table shows the energy saving of ceramics plants in Egypt in the year 2030 and 2050 if all companies
reach the international BAT value. Furthermore it shows the cumulated energy savings from 2016 to 2030 or
2050.
Table 34: Energy Savings in 2030 and 2050 and Cumulative Savings until 2030 and 2050 (International BAT)
Year
Frozen Scenario
(GJ/a)
Baseline Scenario
(GJ/a)
BPT Scenario
(GJ/a)
BAT Scenario
(GJ/a)
Savings Frozen – BAT Scenario
(GJ/a)
Cumulative Savings (Frozen-
BAT) (GJ)
2016 40,653,114 40,653,114 40,653,114 40,653,114 -
2030 87,522,231 83,975,264 53,451,462 42,884,511 44,637,721 300,998,149
2050 180,497,714 162,969,784 110,157,008 88,379,798 92,117,916 1,248,204,810
4.6.3 Saving Scenarios until 2050, 2030 (using National BAT and BPT)
In this section, the four saving scenarios were calculated by comparing to the national BAT and BPT until 2050,
and 2030. The four scenarios are:

BENCHMARKING REPORT OF THE CERAMICS SECTOR
64
Frozen efficiency: No additional energy efficiency savings are made. The current levels of energy
efficiency are not improved upon.
Baselines efficiency: Energy efficiency improves at a rate of 0.3% a year.
BPT scenario: All plants are operating at the current levels of BPT by 2050. This is equivalent to an
energy efficiency improvement of 0.45% a year in the period 2016 to 2050. The BPT here is the lowest
known national BPT. For the ceramics sector, the national BPT value is 5.85 GJ/ton.
All plants are operating at the current levels of BPT by 2030. This is equivalent to an energy efficiency
improvement of 1.08% a year in the period 2016 to 2030.
BAT scenario: All plants are operating at current levels of BAT by 2050. This is equivalent to an energy
efficiency improvement of 0.52% a year in the period 2016 to 2050. The BAT here is the lowest known
national BAT. For the ceramics sector the national BAT value is 5.66 GJ/ton.
All plants are operating at the current levels of BAT by 2030. This is equivalent to an energy efficiency
improvement of 1.26% a year in the period 2016 to 2030.
Figure 25: Total Energy Consumption in Egyptian Ceramics Industry, Four Scenarios 2016-2050 using National BAP and BPT

BENCHMARKING REPORT OF THE CERAMICS SECTOR
65
Figure 26: Total Energy Consumption in Egyptian Ceramics Industry, Four Scenarios 2016-2030 using National BAP and BPT
Figure 27: Total Energy Consumption in Egyptian Ceramics Industry in 2030 and 2050 according to the four Scenarios using National BAP and BPT
To reach the saving of 29,370,930 GJ in 2050, the sector would need to implement energy saving measures of
about 839,169 GJ per year. To reach the saving of 14,251,650 GJ in 2030, the sector would need to implement
energy saving measures of about 950,110 GJ per year.

BENCHMARKING REPORT OF THE CERAMICS SECTOR
66
4.6.4 Energy Savings in 2030 and 2050
The following table shows the energy saving of ceramics plants in Egypt in the year 2030 and 2050 if all companies
reach the national BAT value. Furthermore it shows the cumulated energy savings from 2013 to 2030 or 2050.
Table 35: Energy Savings in 2030 and 2050 and Cumulative Savings until 2030 and 2050 (National BAT)
Year
Frozen Scenario
(GJ/a)
Baseline Scenario
(GJ/a)
BPT Scenario (GJ/a)
BAT Scenario
(GJ/a)
Savings Frozen – BAT Scenario
(GJ/a)
Cumulative Savings (Frozen-
BAT) (GJ)
2016 40,653,114 40,653,114 40,653,114 40,653,114 -
2030 87,582,868 83,975,264 75,145,064 73,331,218 14,251,650 89,738,418
2050 180,497,714 162,969,784 154,864,903 151,126,785 29,370,930 372,584,913
4.7 Saving Opportunities
All factories participated in this study do have energy saving measures planned and most of them consider energy
efficiency in investment decisions and have energy efficiency targets. The energy efficiency plans can include
improving the design of kilns and dryers, recovery of excess heat from kilns, cogeneration/combined heat and
power plants, and modification of ceramic bodies.
The table below shows the energy efficiency measures in the ceramics sector and the companies that have
applied them.

BENCHMARKING REPORT OF THE CERAMICS SECTOR
67
Table 36: Status of Energy Efficiency Measures Implementation
Energy Efficiency Measure C 1 C 2 C 3 C 4 C 5 C 6 C 7 C 8 C 9 C 10 C 11 C 12 C 13
Measures Related to Drying Process
Lighter products No No Yes Yes No Yes Yes Yes Yes No Yes Yes Yes
Suitable initial moisture content (6% in Tiles)
Yes Yes Yes Yes Yes Yes Yes Yes Yes Yes No No No
Homogeneity in initial moisture content
Yes No Yes Yes Yes Yes Yes Yes Yes Yes Yes Yes Yes
Suitable ambient temperature Yes Yes Yes No No Yes Yes Yes Yes Yes Yes Yes No
Suitable ambient relative humidity
Yes Yes Yes No No Yes Yes Yes Yes Yes No No No
Suitable flow of air Yes No Yes Yes Yes Yes Yes Yes Yes Yes Yes Yes No
Using Pure waste air From Tunnel Kilns
Yes No No No No Yes Yes Yes Yes Yes No No No
Use a specified burner Yes No No Yes Yes Yes Yes Yes Yes Yes Yes Yes Yes
Choose better insulation with low density
No No Yes No No No No No No Yes No No No
Measures Related to Firing Process
Exhaust gas temperature should be kept as low as possible
No Yes Yes No No Yes Yes Yes Yes Yes Yes Yes Yes
Use better insulator which can bear higher temperature
No Yes Yes Yes Yes No No No No No No No No

BENCHMARKING REPORT OF THE CERAMICS SECTOR
68
Energy Efficiency Measure C 1 C 2 C 3 C 4 C 5 C 6 C 7 C 8 C 9 C 10 C 11 C 12 C 13
Recovering the cooling air No No No No No Yes Yes Yes Yes Yes Yes Yes No
Air ratio should be 2:1 (air: gas) for the burner to ensure a good combustion
No No Yes Yes Yes Yes Yes Yes Yes Yes Yes Yes No
Firing management (heat curve, temperature distribution in the kiln, kiln pressure, atmosphere)
No Yes Yes Yes Yes Yes Yes Yes Yes Yes Yes Yes Yes
Loading pattern on the kiln car No No No Yes Yes Yes Yes Yes Yes Yes Yes Yes No
Clearance between the kiln wall and kiln car
No No Yes No No No No No No No No No Yes
Sand seal No No No No No No No No No No No No Yes
Kiln car pushing speed No No Yes No No No No No No Yes No No Yes
Measures Related to Housekeeping
Purchasing the right materials to reduce energy
No Yes No Yes Yes Yes Yes Yes Yes Yes Yes Yes No
Storing any material costs money and uses energy in some way. Even bulk outside storage costs money in terms of the inventory cost
Yes No Yes Yes Yes Yes Yes Yes Yes No Yes Yes No
Fit interlocks or sensors to conveyors or link them to machine start-up/shutdown
Yes No No Yes Yes Yes Yes Yes Yes Yes Yes Yes Yes

BENCHMARKING REPORT OF THE CERAMICS SECTOR
69
Energy Efficiency Measure C 1 C 2 C 3 C 4 C 5 C 6 C 7 C 8 C 9 C 10 C 11 C 12 C 13
switches so that they only operate when the machines are operating.
Fit time delay switches to all grinding and milling machines to turn them off if no material is being processed
Yes No Yes Yes Yes Yes Yes Yes Yes Yes Yes Yes No
Large motors with high use on grinders and mills will benefit from being replaced by high efficiency motors
Yes No Yes Yes Yes Yes Yes Yes Yes Yes Yes Yes Yes
Reducing materials content should be an ongoing process. Define the product in terms of a performance specification and adjust the materials content to meet the specification.
Yes No No Yes Yes No No No No No No No No
Motors run most efficiently close to their design output – a large motor at part load is less efficient than a small one at full load.
No Yes No No No No No No No Yes No No No


BENCHMARKING REPORT OF THE CERAMICS SECTOR
71
5 Recommendations
5.1 Strengthening the Statistical Data Collection Process in Egypt
The statistical energy relevant data for industrial sectors in Egypt are not based on real production capacity and
energy consumption data, but on planning data. This should be improved and the statistical data collection
process of energy relevant data of companies in Egypt should be optimized including following steps:
1. Each company has to report relevant data e.g. energy consumption and production volumes on a
regular basis (monthly/yearly) to the statistical authorities. A standardized data collection template
should be applied. This template can be elaborated based on the data collection sheet for the
analysis in the participating companies.
2. Collection and aggregation of data should be done by the statistical authorities.
3. The statistical authorities should publish the aggregated data annually.
4. Regarding to the collected data an energy balance should be established.
To support the energy relevant statistical process the following steps and requirements are important:
Plausibility checks of all collected data
Received data should be verified onsite at random
There have to be enough personnel resources
Experts of statistical authorities, sector associations and companies (private and state owned) should
be well trained
5.2 Implementing Support Programmes for Industry
5.2.1 Energy Management Programmes
In companies not having an energy management system in place, there is no structured approach to improve
their energy performance. Although the possibilities to improve the energy performance may be known, either
identified within an energy audit or by internal staff, the measures are not simply implemented. This is due to
several reasons, one being that the top-management or other key stakeholders oppose such measures or prefer
other investment measures with better return on investment. In case the measures are implemented, often the
energy consumption starts to rise again after a certain time because there is a lack of precise roles and
responsibilities for maintaining the optimized systems.
Therefore a systematic approach is needed. Energy management can offer this approach: First of all, energy must
be a key topic in the company, from top-management down to all employees all relevant persons shall be
engaged in saving energy. Clear target setting and the follow-up of saving measures ensure that energy efficiency
steadily increases. Systematic energy management as systematic tracking, analysis and planning of energy use is
one of the most effective approaches to improve energy efficiency in industries ( (IEA, 2012). Energy
management programmes are policies and initiatives that encourage companies to adopt energy management.
There are various approaches to implement energy management programmes in a country or a region. The
approach depends on the existing policy framework, objectives, industrial composition and other country- or
region-specific factors.

Energy management programmes are most effective when planned and implemented as part of broader energy
efficiency agreements with the government. During the planning stage the purpose of the program should be
articulated, including inter-linkages with other policies. Important design steps include establishing what support
systems need to be created to boost implementation, how progress will be monitored, and setting up plans for
evaluating the results of the program. The success of the energy management program is clearly correlated with
the provision of appropriate resources and supporting mechanisms, including assistance, capacity building and
training, and provision of tools and guidance during the implementation stage.
Benefits of Energy Management Programmes
The main objectives of energy management programmes are to decrease industrial energy use and reduce
greenhouse-gas emissions. If properly designed, they also can help attain other objectives. By supporting industry
in using energy more productively they can boost competitiveness and redirect savings to more productive uses
and reduce maintenance cost.
A further benefit is that energy management programmes are flexible instruments that can be adapted to
changing policy needs and changes in industry thereby ensuring continued effectiveness and relevance. By
continuously monitoring implementation and through regular evaluation, policy makers can identify
opportunities to include new mechanisms or establish linkages to emerging policies.
In implementing energy management programmes, governments can play an important role in establishing a
framework to promote uptake of energy management systems, by developing methodologies and tools, and
promoting the creation of new business opportunities in the area of energy services. Energy management
programmes can tend to achieve significant and sustainable savings at very low cost in the initial years.
5.2.2 Energy Audit Programmes
Energy audit programmes are a very cost efficient way to reach national targets on greenhouse gas reduction or
increase of energy efficiency. From the energy audits, energy saving potentials and saving measures are
identified. The companies and organisations then decide whether to carry out saving measures or not, or put
them in a framework for investment and execution planning.
From the policy design point of view, an energy audit program usually consists of several elements:
Implementation tools like the legislative framework, the subsidy /financial scheme and other
incentives/promotion and marketing activities.
Administration of the program and interaction of the key players: the administrator (very often a
government level body), the operating agent (e.g. an energy agency), auditors and the participating
organizations. The operating agent is responsible for the development of the energy audit models and
the monitoring system.
Quality assurance comprises training and/or authorization of auditors and the quality control
(checking of the reports).
In addition, audit tools should be made available.

BENCHMARKING REPORT OF THE CERAMICS SECTOR
73
6 Literature
Ernst Worrell, L. P. (2008). World Best Practice Final Energy Intensity Values for Selected Industrial
Sectors. Ernest Orlando Lawrence Berkeley National Laboratory.
European Commission. (2007). Reference Document on Best Available Techniues in the Ceramic
Manufacturing Industry.
IEA. (2012). Energy Management Programmes for Industry. Paris: International Energy Agency.
IEA/OECD. (2009). IEA Energy Technology Transitions for Industry .
IFC. (2007). Environmental, Health, and Safety Guidelines for Ceramic Tile and Sanitary Ware
Manufacturing. World Bank Group.
IMC. (2005). A Strategic Study on the Egyptian Ceramic Tiles and Sanitary Ware Industry. Italian
Institute for Industrial Promotion.
Monfort, E, et al. (2012). Thermal energy consumption and carbon dioxide emissions in ceramic tile
manufacture - Analysis of the Spanish and Brazilian industries.
Gabaldón-Estevan,D., et al. (2016). Unwanted Effects of European Union Environmental Policy at
Promoting a Post-carbon Industry. The Case of Energy in the European Ceramic Tile Sector.
Stock, D. (2010). World Production and Consumption of Ceramic Tiles. Tile Today, 50-58.
UNIDO. (2010). UNIDO Working Paper on Global Industrial Energy Efficiency Benchmarking. United Nations
Industrial Development Organization.

7 Abbreviations
BAT Best Available Technology BPT Best Practice Technology BREF Reference Document on Best Available Techniques in the Industry CAPMAS Central Agency for Public Mobilization and Statistics CHP Combined Heat and Power EE Energy Efficiency EEI Energy Efficiency Index EPI Energy Performance Indicator FEI Federation of Egyptian Industries IDA Industrial Development Authority IEA International Energy Agency IEE Industrial Energy Efficiency MOIFT Ministry of Industry and Foreign Trade PV Photovoltaic SEC Specific Energy Consumption SME Small and Medium Sized Enterprise

BENCHMARKING REPORT OF THE CERAMICS SECTOR
75
8 List of Figures
Figure 1: Illustrative Energy Benchmark Curve for the Manufacturing Industry (UNIDO, 2010) ......... 13
Figure 2: General overview of a ceramics manufacturing process, (BREF Ceramics, 2007) ................. 16
Figure 3: Schematic view of wall and floor tile manufacturing (BREF Ceramics, 2007)........................ 17
Figure 4 Production share of the participating companies ................................................................... 21
Figure 5: Range of Thermal SEC among the Analyzed Companies in GJ/ton ........................................ 35
Figure 6: Range of Electrical SEC among the Analyzed Companies in GJ/ton ....................................... 37
Figure 7: Range of SEC among the Analyzed Companies in GJ/ton ...................................................... 39
Figure 8: Energy Cost for Ceramics Production in the Analyzed Companies (2013 – 2015) in EGP/m2 40
Figure 9: Specific Thermal Energy Consumption Benchmark Curve for 2013 ...................................... 42
Figure 10: Specific Thermal Energy Consumption Benchmark Curve for 2014 .................................... 44
Figure 11: Specific Thermal Energy Consumption Benchmark Curve for 2015 .................................... 45
Figure 12: Specific Electrical Energy Consumption Benchmark Curve for 2013 ................................... 46
Figure 13: Specific Electrical Energy Consumption Benchmark Curve for 2014 ................................... 47
Figure 14: Specific Electrical Energy Consumption Benchmark Curve for 2015 ................................... 48
Figure 15: Specific Total Energy Consumption Benchmark Curve for 2013 .......................................... 49
Figure 16: Specific Total Electricity Consumption Benchmark Curve for 2014 ..................................... 51
Figure 17: Specific Total Energy Consumption Benchmark Curve for 2015 .......................................... 53
Figure 18 Average Specific Total Energy Consumption Benchmark Curve between 2013 and 2015 ... 53
Figure 18: Energy Cost Benchmark Curve for the Ceramics Sector ...................................................... 55
Figure 19 Development of Ceramic tiles per capita in Egypt ................................................................ 60
Figure 20 Development of (Ceramic tiles/Cement) productivity ratio in Egypt ................................... 61
Figure 21: Total Energy Consumption in Egyptian Ceramics Industry, Four Scenarios 2016-2050 using
International BAP and BPT .................................................................................................................... 62
Figure 22: Total Energy Consumption in Egyptian Ceramics Industry, Four Scenarios 2016-2030 using
International BAP and BPT .................................................................................................................... 62
Figure 23: Total Energy Consumption in Egyptian Ceramics Industry in 2030 and 2050 according to
the four Scenarios using International BAP and BPT ............................................................................ 63
Figure 24: Total Energy Consumption in Egyptian Ceramics Industry, Four Scenarios 2016-2050 using
National BAP and BPT ........................................................................................................................... 64
Figure 25: Total Energy Consumption in Egyptian Ceramics Industry, Four Scenarios 2016-2030 using
National BAP and BPT ........................................................................................................................... 65
Figure 26: Total Energy Consumption in Egyptian Ceramics Industry in 2030 and 2050 according to
the four Scenarios using National BAP and BPT ................................................................................... 65

9 List of Tables
Table 1: Overview of Ceramic tiles plants in Egypt ............................................................................... 18
Table 2: Schedule for data collection .................................................................................................... 20
Table 3: Specific thermal energy consumption of ceramic tiles in Spain and Brazil compared to BAT 21
Table 4: BAT-Associated Energy Consumption Levels in different processing steps ........................... 22
Table 5: Number of Ceramic Tiles Plants in Egypt (Source: IDA) ........................................................... 27
Table 6: Overview of Specific Energy Consumption of Different Production Processes for ceramic tile
manufacturing (EU BREF, 2005) ............................................................................................................ 30
Table 7: Conversion factors ................................................................................................................... 31
Table 8: Production Volume of Analyzed Companies ........................................................................... 33
Table 9: Conversion factors ................................................................................................................... 33
Table 10: Thermal energy consumed by the analyzed ceramic companies .......................................... 34
Table 11: Electric Energy Used by the analyzed ceramics companies .................................................. 36
Table 12: Overview Energy Consumption and Specific Energy Consumption of Analyzed Plants:
Thermal, Electrical and Total ................................................................................................................. 38
Table 13 : Unit Prices of Energy (IDA) .................................................................................................... 40
Table 14: Status of Energy Management System Implementation in the Analyzed Ceramic Companies
............................................................................................................................................................... 41
Table 15: Specific Thermal Energy Consumption of the Analyzed Ceramic Plants (GJ/ton) for the year
2013 ....................................................................................................................................................... 42
Table 16: Specific Thermal Energy Consumption of the Analyzed Ceramic Plants (GJ/ton) for the year
2014 ....................................................................................................................................................... 43
Table 17: Specific Thermal Energy Consumption of the Analyzed Ceramic Plants (GJ/ton) for the year
2015 ....................................................................................................................................................... 44
Table 18: Specific Electrical Energy Consumption of the Analyzed Ceramic Plants (GJ/ton) for the year
2013 ....................................................................................................................................................... 45
Table 19: Specific Electrical Energy Consumption of the Analyzed Ceramic Plants (GJ/ton) for the year
2014 ....................................................................................................................................................... 46
Table 20: Specific Electrical Energy Consumption of the Analyzed Ceramic Plants (GJ/ton) for the year
2015 ....................................................................................................................................................... 48
Table 21: Specific Total Energy Consumption (Thermal & Electrical) of the Analyzed Ceramic Plants
(GJ/ton) for the year 2013 ..................................................................................................................... 49
Table 22: Specific Total Energy Consumption (Thermal & Electrical) of the Analyzed Ceramic Plants
(GJ/ton) for the year 2014 ..................................................................................................................... 51
Table 23: Specific Total Energy Consumption (Thermal & Electrical) of the Analyzed Ceramic Plants
(GJ/ton) for the year 2015 ..................................................................................................................... 52
Table 24: Energy Cost per unit product of Ceramic tiles for the Examined Sample companies ........... 54
Table 25: Potential Savings Calculated with Specific Total Energy Consumption ................................. 56
Table 26: Potential Savings in Thermal Energy...................................................................................... 57
Table 27: Potential Savings in Electrical Energy .................................................................................... 57

BENCHMARKING REPORT OF THE CERAMICS SECTOR
77
Table 28: Annual Total Energy Saving Potential for the Whole Sector Compared to International BAT
............................................................................................................................................................... 58
Table 29: Annual Thermal Energy Saving Potential for the Whole Sector Compared to International
BAT ........................................................................................................................................................ 58
Table 30: Annual Electrical Energy Saving Potential for the Whole Sector Compared to International
BAT ........................................................................................................................................................ 58
Table 31: Annual Total Energy Saving Potential for the Whole Sector Compared to National BAT ..... 58
Table 32: Annual Thermal Energy Saving Potential for the Whole Sector Compared to National BAT 59
Table 33: Annual Electrical Energy Saving Potential for the Whole Sector Compared to National BAT
............................................................................................................................................................... 59
Table 34: Energy Savings in 2030 and 2050 and Cumulative Savings until 2030 and 2050 (International
BAT) ....................................................................................................................................................... 63
Table 35: Energy Savings in 2030 and 2050 and Cumulative Savings until 2030 and 2050 (National
BAT) ....................................................................................................................................................... 66
Table 36: Status of Energy Efficiency Measures Implementation ........................................................ 67