benchmarking - teesside university - home of science and... · presentation outline •benchmarking...
TRANSCRIPT

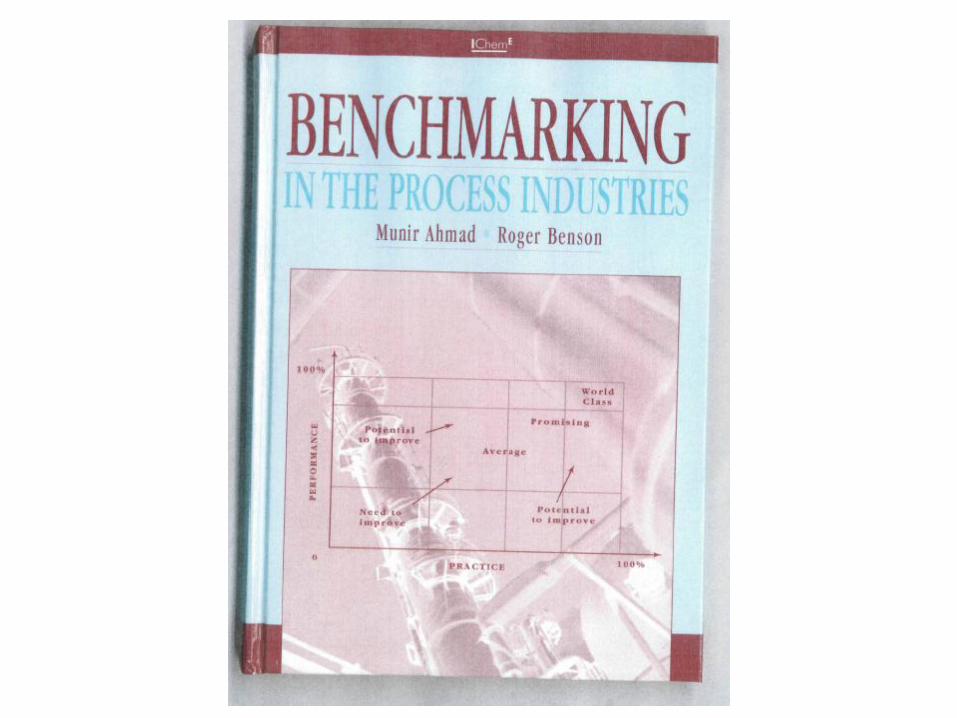
Benchmarking
Professor Munir Ahmad
School of Science and Engineering
University of Teesside
S2B HubPresentation

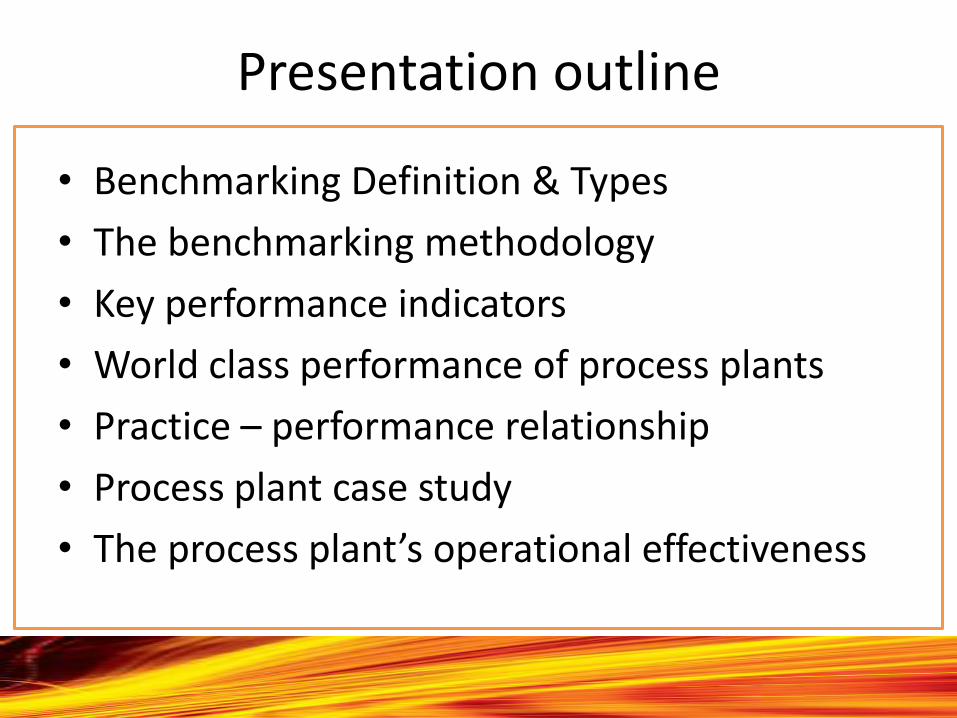
Presentation outline
• Benchmarking Definition & Types
• The benchmarking methodology
• Key performance indicators
• World class performance of process plants
• Practice – performance relationship
• Process plant case study
• The process plant’s operational effectiveness
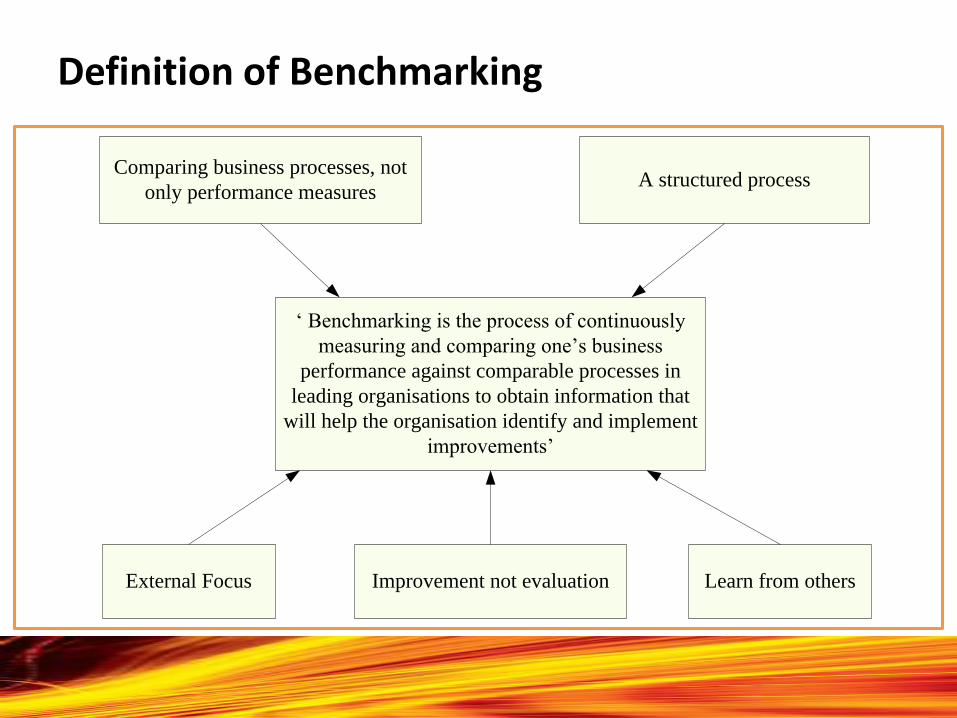
Definition of Benchmarking
‘ Benchmarking is the process of continuously
measuring and comparing one’s business
performance against comparable processes in
leading organisations to obtain information that
will help the organisation identify and implement
improvements’
Comparing business processes, not
only performance measuresA structured process
Learn from othersImprovement not evaluationExternal Focus
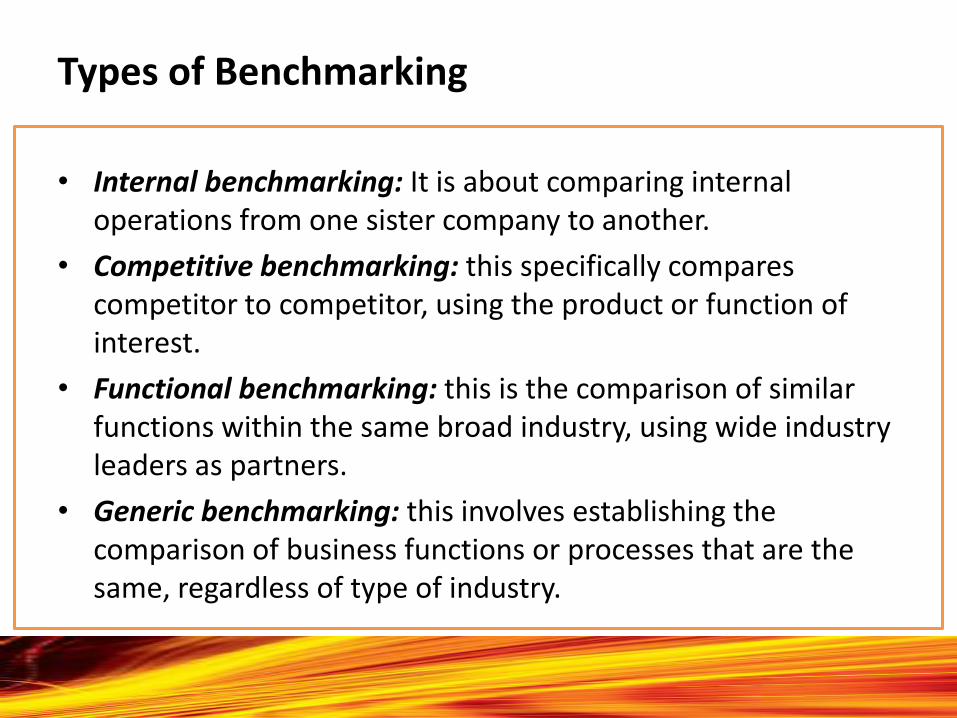
Types of Benchmarking
• Internal benchmarking: It is about comparing internal operations from one sister company to another.
• Competitive benchmarking: this specifically compares competitor to competitor, using the product or function of interest.
• Functional benchmarking: this is the comparison of similar functions within the same broad industry, using wide industry leaders as partners.
• Generic benchmarking: this involves establishing the comparison of business functions or processes that are the same, regardless of type of industry.
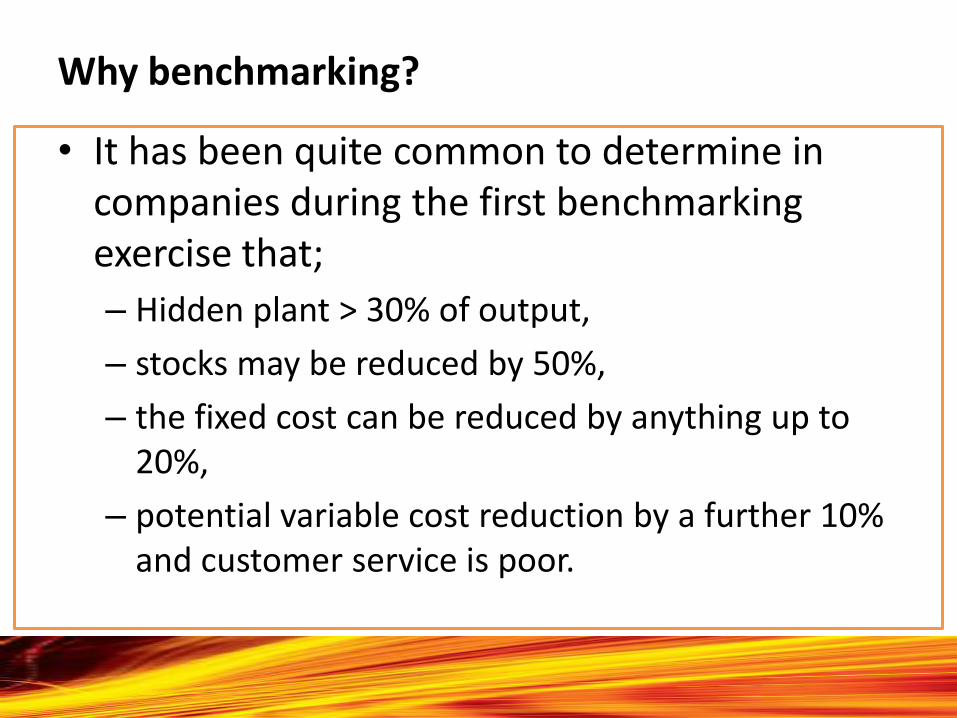
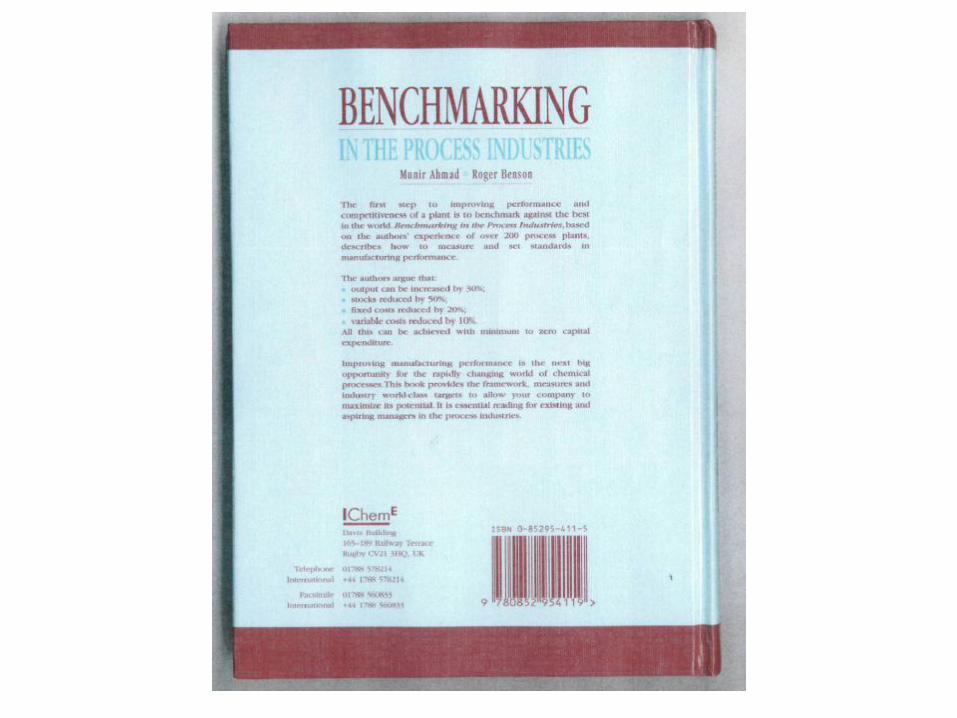
Why benchmarking?
• It has been quite common to determine in companies during the first benchmarking exercise that;
– Hidden plant > 30% of output,
– stocks may be reduced by 50%,
– the fixed cost can be reduced by anything up to 20%,
– potential variable cost reduction by a further 10% and customer service is poor.
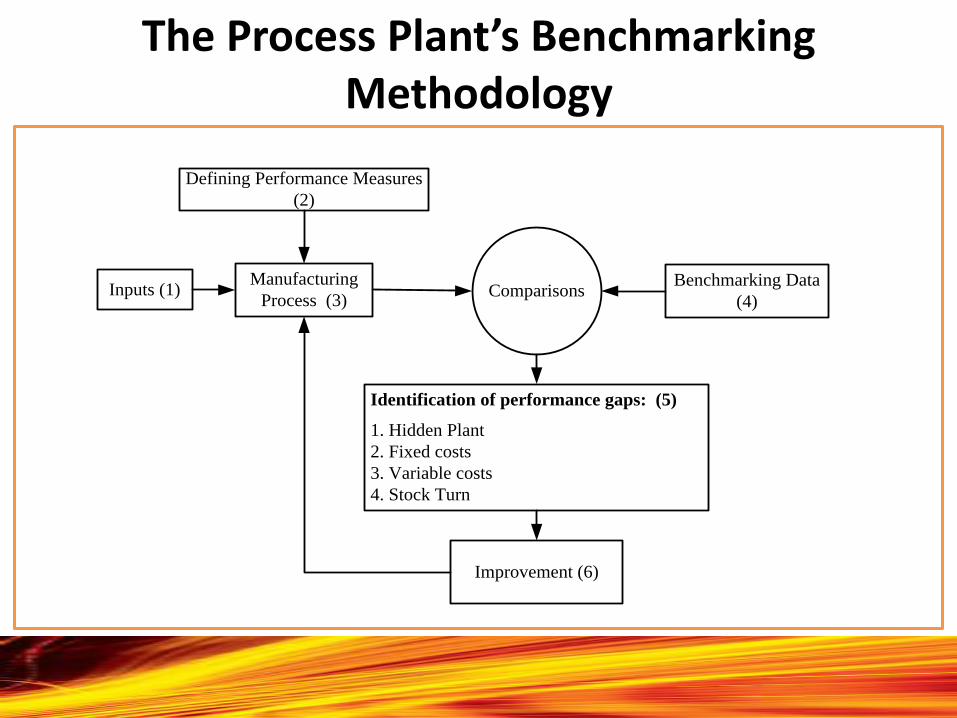
The Process Plant’s Benchmarking Methodology
Benchmarking Data
(4)Comparisons
Identification of performance gaps: (5)
1. Hidden Plant
2. Fixed costs
3. Variable costs
4. Stock Turn
Improvement (6)
Manufacturing
Process (3)Inputs (1)
Defining Performance Measures
(2)
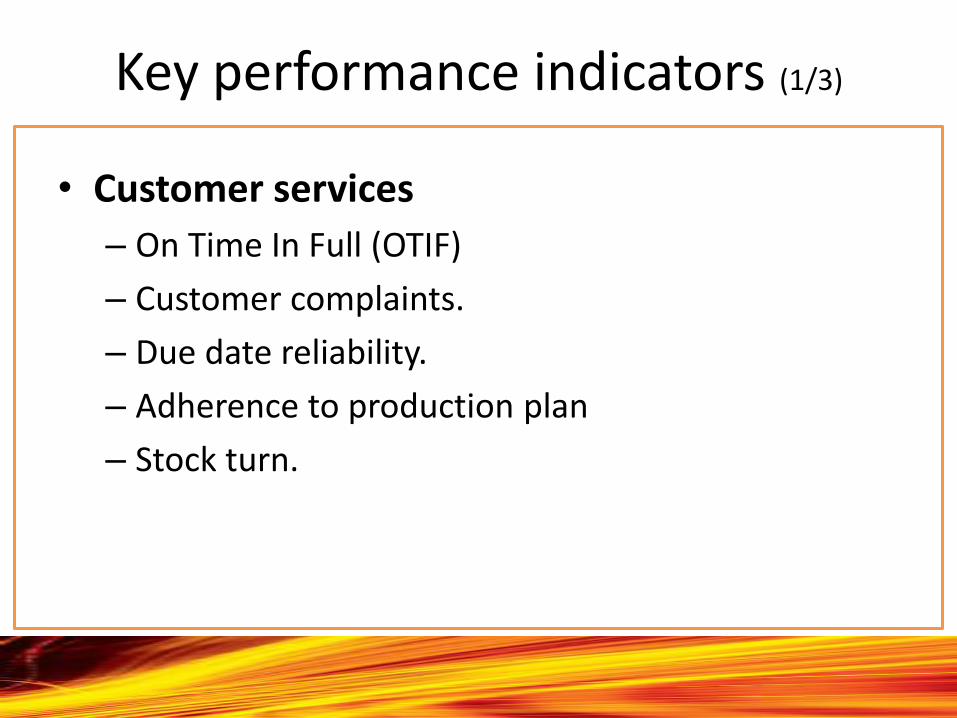
Key performance indicators (1/3)
• Customer services
– On Time In Full (OTIF)
– Customer complaints.
– Due date reliability.
– Adherence to production plan
– Stock turn.
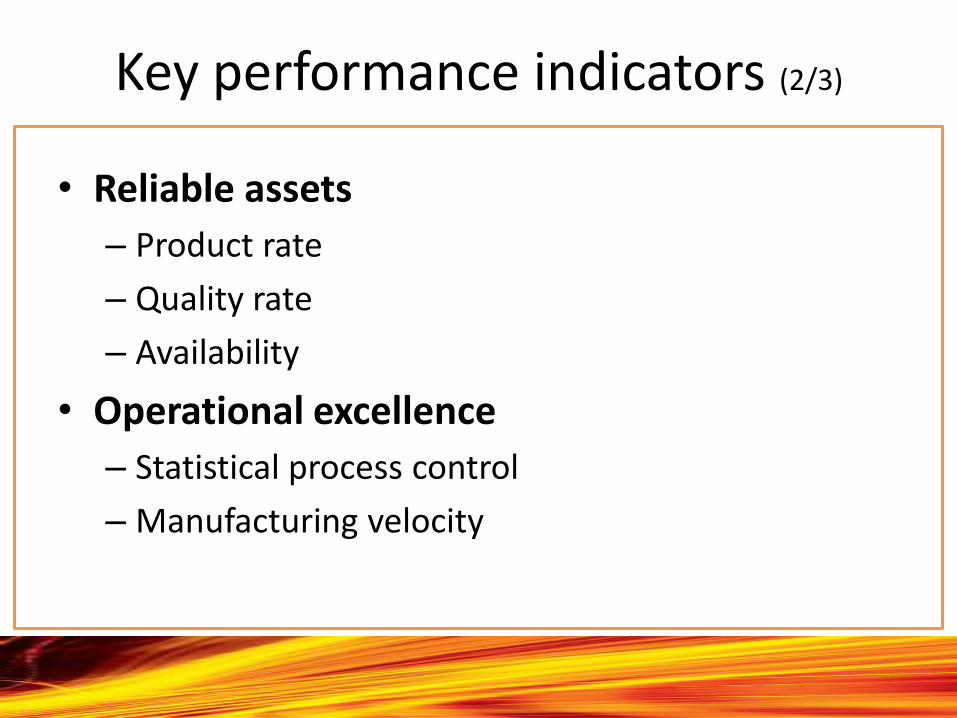
Key performance indicators (2/3)
• Reliable assets
– Product rate
– Quality rate
– Availability
• Operational excellence
– Statistical process control
– Manufacturing velocity
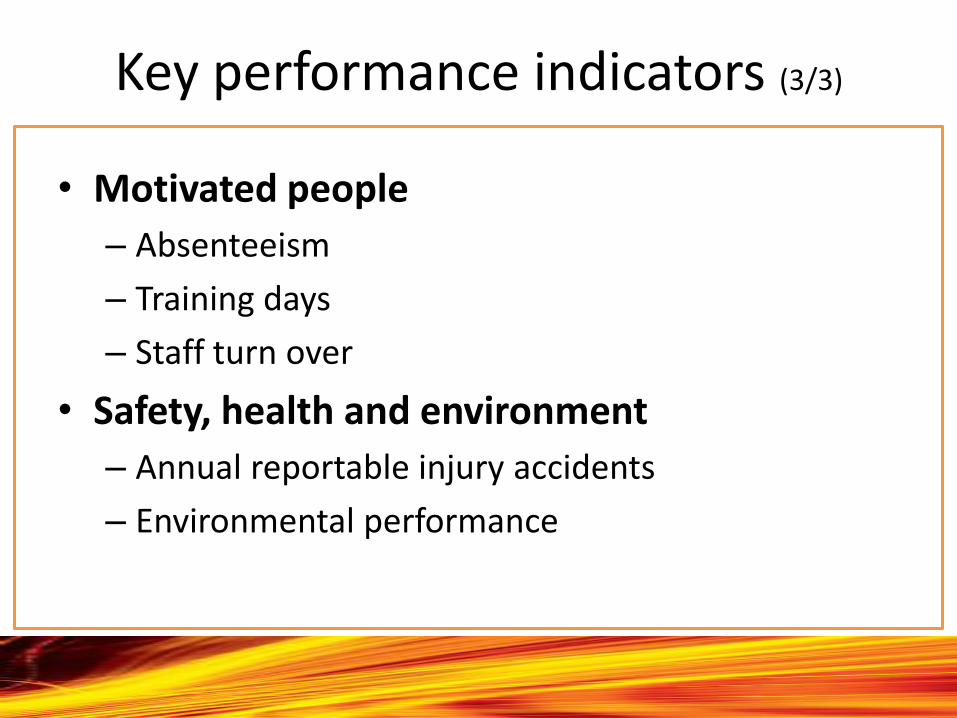
Key performance indicators (3/3)
• Motivated people
– Absenteeism
– Training days
– Staff turn over
• Safety, health and environment
– Annual reportable injury accidents
– Environmental performance
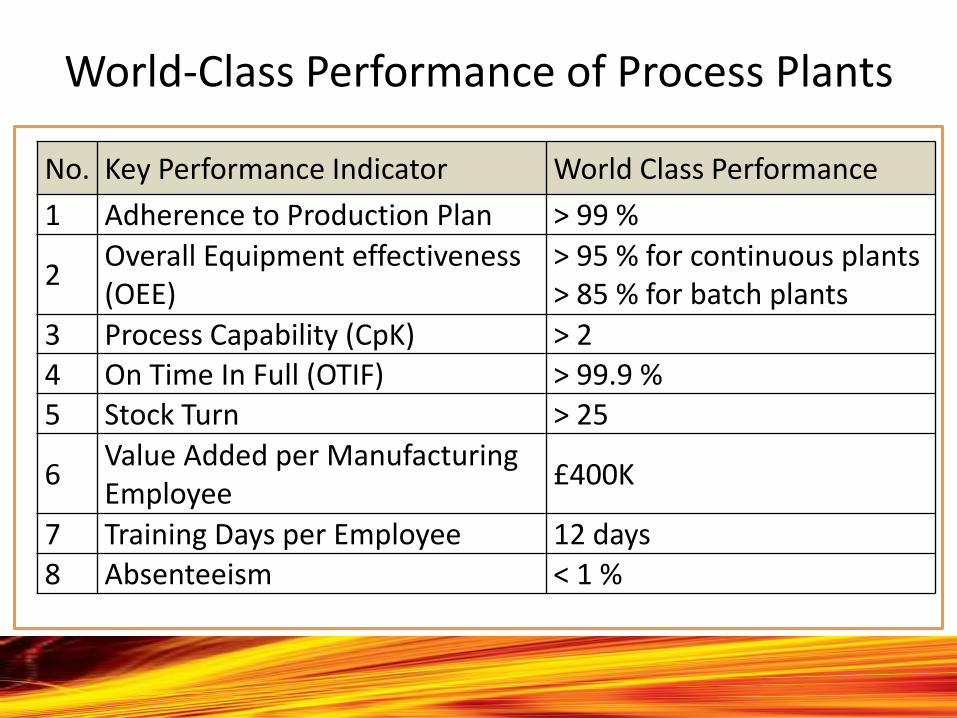
World-Class Performance of Process Plants
No. Key Performance Indicator World Class Performance
1 Adherence to Production Plan > 99 %
2Overall Equipment effectiveness (OEE)
> 95 % for continuous plants > 85 % for batch plants
3 Process Capability (CpK) > 24 On Time In Full (OTIF) > 99.9 %5 Stock Turn > 25
6Value Added per Manufacturing Employee
£400K
7 Training Days per Employee 12 days
8 Absenteeism < 1 %
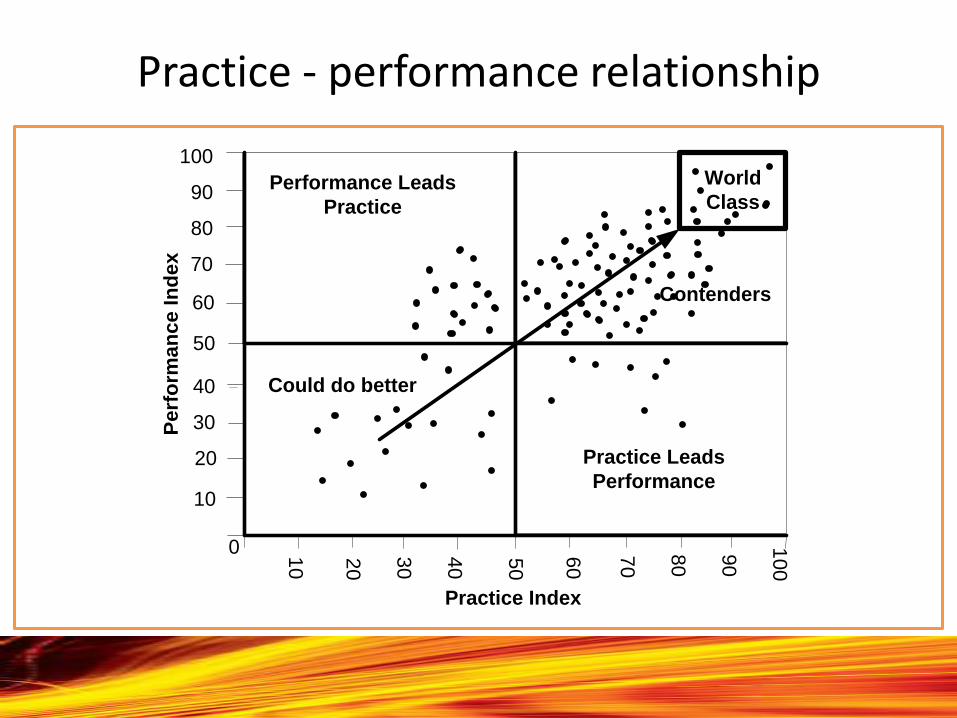
Practice - performance relationship
World
ClassPerformance Leads
Practice
Contenders
Could do better
Practice Leads
Performance
Pe
rfo
rma
nc
e In
de
x
Practice Index
0
10
20
30
40
50
60
70
80
90
100
10
20
30
40
50
60
70
80
90
10
0
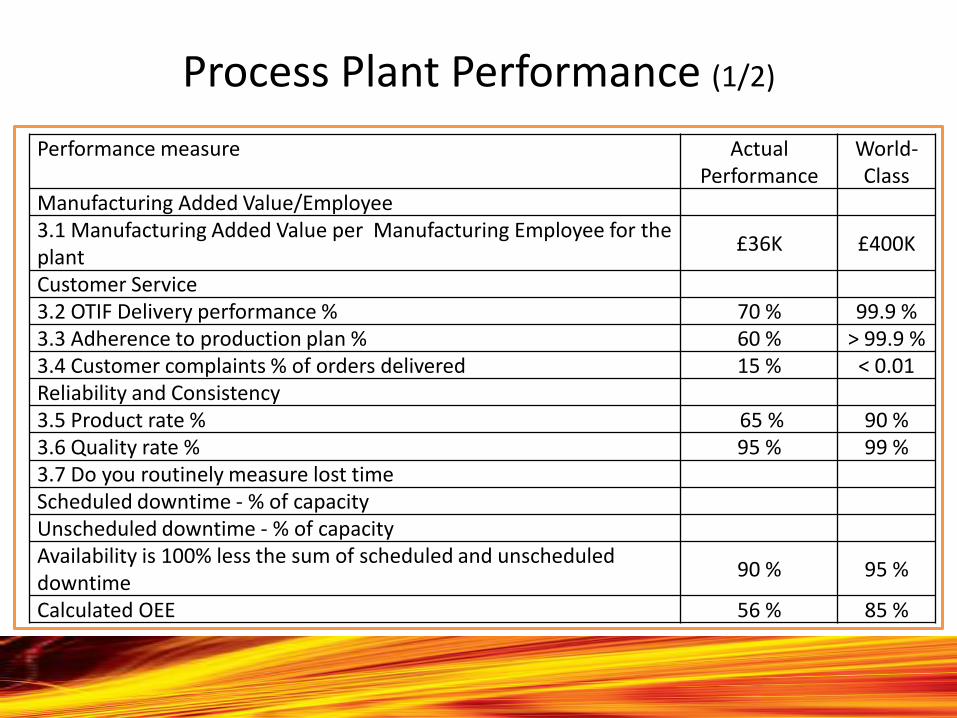
Process Plant Performance (1/2)
Performance measure Actual Performance
World-Class
Manufacturing Added Value/Employee3.1 Manufacturing Added Value per Manufacturing Employee for the plant
£36K £400K
Customer Service3.2 OTIF Delivery performance % 70 % 99.9 %3.3 Adherence to production plan % 60 % > 99.9 %3.4 Customer complaints % of orders delivered 15 % < 0.01Reliability and Consistency3.5 Product rate % 65 % 90 %3.6 Quality rate % 95 % 99 %3.7 Do you routinely measure lost timeScheduled downtime - % of capacityUnscheduled downtime - % of capacityAvailability is 100% less the sum of scheduled and unscheduled downtime
90 % 95 %
Calculated OEE 56 % 85 %
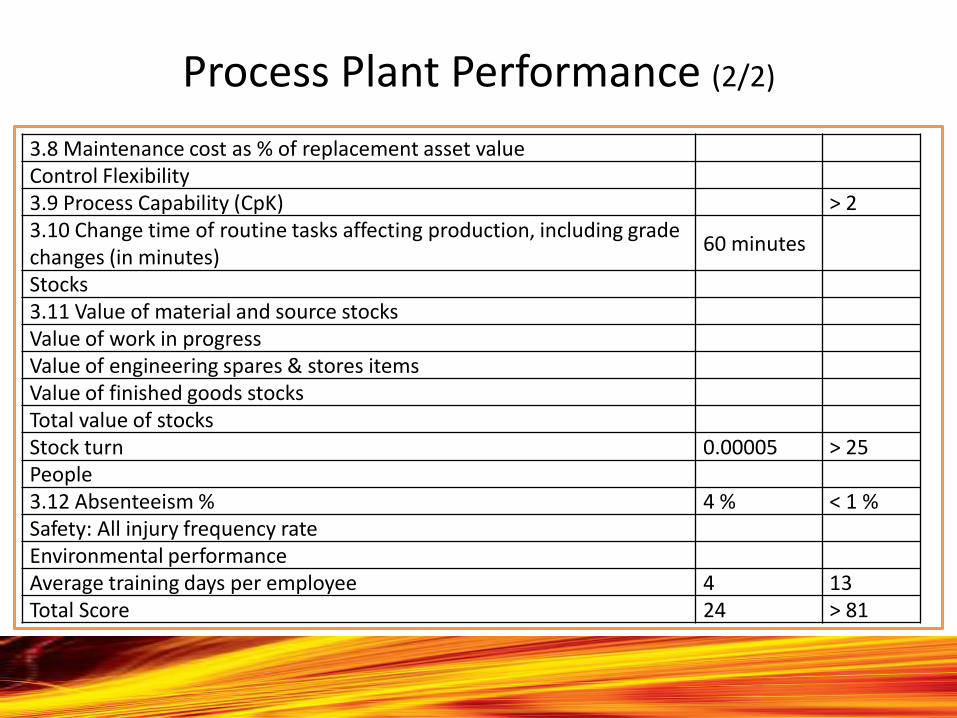
Process Plant Performance (2/2)
3.8 Maintenance cost as % of replacement asset valueControl Flexibility3.9 Process Capability (CpK) > 23.10 Change time of routine tasks affecting production, including grade changes (in minutes)
60 minutes
Stocks3.11 Value of material and source stocksValue of work in progressValue of engineering spares & stores itemsValue of finished goods stocksTotal value of stocksStock turn 0.00005 > 25People3.12 Absenteeism % 4 % < 1 %Safety: All injury frequency rateEnvironmental performanceAverage training days per employee 4 13Total Score 24 > 81
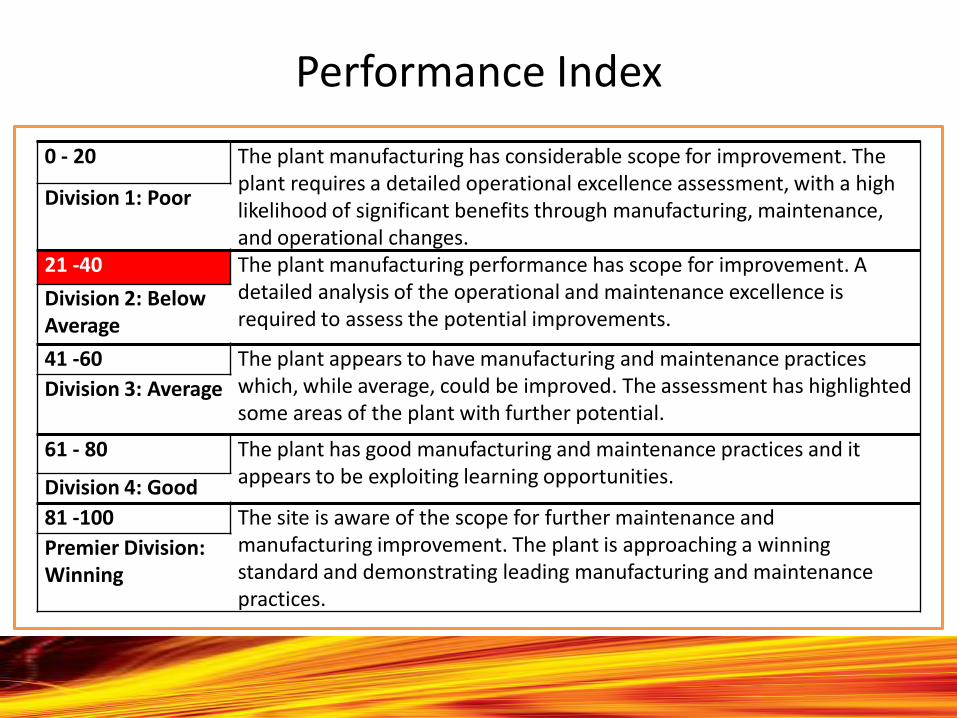
Performance Index
0 - 20 The plant manufacturing has considerable scope for improvement. The plant requires a detailed operational excellence assessment, with a high likelihood of significant benefits through manufacturing, maintenance, and operational changes.
Division 1: Poor
21 -40 The plant manufacturing performance has scope for improvement. A detailed analysis of the operational and maintenance excellence is required to assess the potential improvements.
Division 2: Below Average
41 -60 The plant appears to have manufacturing and maintenance practices which, while average, could be improved. The assessment has highlighted some areas of the plant with further potential.
Division 3: Average
61 - 80 The plant has good manufacturing and maintenance practices and it appears to be exploiting learning opportunities.Division 4: Good
81 -100 The site is aware of the scope for further maintenance and manufacturing improvement. The plant is approaching a winning standard and demonstrating leading manufacturing and maintenance practices.
Premier Division: Winning
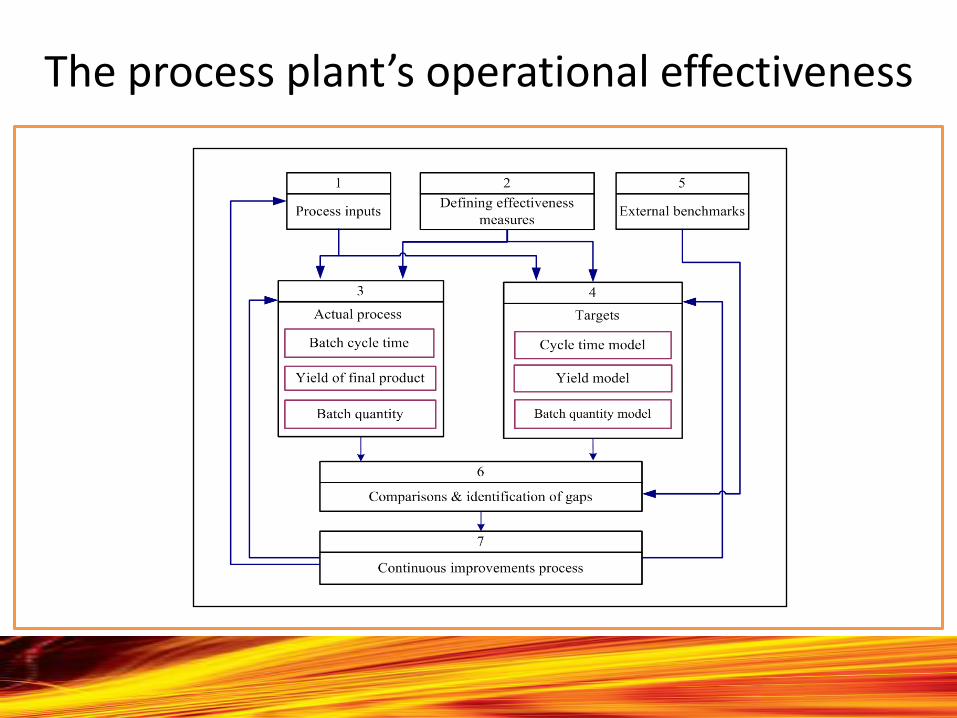
The process plant’s operational effectiveness
Conclusion (1/2)
• The methodology used in this presentation suggested that there will be a significant opportunity to improve the performance of the majority of the existing assets.
• Through benchmarking, gaps are identified and an outline of a procedure to quantify existing gaps was provided.
• All the tools provided by the methodology of benchmarking within the process plants focus on quantifying a financial gap; this sets out the priorities and justifies the case for continuous improvement. After identifying the gaps, guidelines were given for companies on how to introduce process improvements which are realistic and achievable.
Conclusion (2/2)
• The presentation has also investigated the techniques that used to define performance targets to assist manufacturing plants in attaining their goals. No one target setting method is enough in itself as the competition may have deployed better equipment, technologies or innovations to generate high performance results. Therefore, it is advisable to use the different target-setting methods in conjunction, as none of these methods are adequate, individually, for determining performance targets.
• The results of application at the selected case study plant revealed that there are significant losses on time and money. The improvement in the time of the process will lead to an increase in the value of the product, thus creating financial savings.

Thank You