benchmarking the cloud
TRANSCRIPT

Images by Connie Zhou
PerfKitBenchmarking the Cloud
Ivan Santa Maria FilhoSenior Staff EngineerGoogle Cloud Performance

Big Data
“Big data is high volume, high velocity, and/or high variety information assets that require new forms of processing to enable enhanced decision making, insight discovery and process optimization” - Gartner
“Big data uses inductive statistics and concepts from nonlinear system identification to infer laws (regressions, nonlinear relationships, and causal effects) from large sets of data with low information density to reveal relationships, dependencies and perform predictions of outcomes and behaviors.” - Pierre Delort

Best Price/Performance, Efficient, Highest Throughput - Lowest Latency, Predictable, Scalable, Easy to Analyze
Deliver the Best Performing Cloud Platform
Provide expert benchmarking
Support sales on competitive deals
Capture a competitive view of our products to
support business decisions
Drive end-to-end performance
improvements with internal teams
Develop a vibrant community of
benchmarkers and partners for cloud
performance
Guide our customers to better performance
through talks, papers and tools

Open Source Tools Blog Posts Training Conferences
Competitive Analysis Analytics Product Improvements
Cloud Platform Performance Team

IaaSInfrastructure-as-a-Service
PaaSPlatform-as-a-Service
SaaSSoftware-as-a-Service
ApplicationsDataRuntimeMiddlewareO/SVirtualizationServersStorageNetworking
ApplicationsDataRuntimeMiddlewareO/SVirtualizationServersStorageNetworking
ApplicationsDataRuntimeMiddlewareO/SVirtualizationServersStorageNetworking
PackagedSoftware
ApplicationsDataRuntimeMiddlewareO/SVirtualizationServersStorageNetworking
You Manage
Vendor Managed
Cloud Computing

Management
Mobile
Developer ToolsCompute
Networking
Big Data
Services
Storage

The Challenge - Competitive Analysis
Incredible product complexity
Custom virtualization
software
“Devices” that aren’t devices
Data centers that are unlike anything else
Geo distribution product design
and SLAs

Instruction counts
ips, kips, mips, mops, flops
Approach One - Benchmarking
Synthetic workload simulation
(72) Whetstone, LINPACK (84) Dhrystone (85) GUI primitives
Benchmarking assumes the existence of a model that approximates your application
http://en.wikipedia.org/wiki/Instructions_per_second http://www.top500.org/lists/

SPEC Score Changes With Utilization
SPEC @ 100% Utilization
Relative SPEC score depends on utilization
Y A
xis
Red
acte
d

Hidden variables
Confidence intervals
Sampling distribution
Compensating for complexity
Platform obfuscation
Approach Two - Capture and Playback
Customers and data sources spread
across telecom providers and cities
Backbone Backbone
RegionalNetwork
LargeBusiness
ISP
POP POP
POP POP
IXP
POP
Cloud Provider

Approach Three - Monitoring Production
Circadian Rhythm of the Internet
Provider Specific Fluctuations

A Bit Different
Step 1: Setup
Step 2: Warm up
Step 3: Pre-execute
Step 4: Execute
Step 5: Post-Execute
Step 6: Cleanup
Step 7: Publish results
Cloud is elastic, so we track deployment
times Traditional benchmarking

Our Approach - All of The Above
Sliding window containing 10 billion benchmark results, each representing tens of thousands of
data points, in close enough to real-time
Control for known variables- Geography and topology- Time of day- Noisy neighbours
Proper sampling- Define our target confidence interval- Adjust by using the appropriate distribution tables
http://en.wikipedia.org/wiki/Student%27s_t-distribution
http://en.wikipedia.org/wiki/Empirical_distribution_function
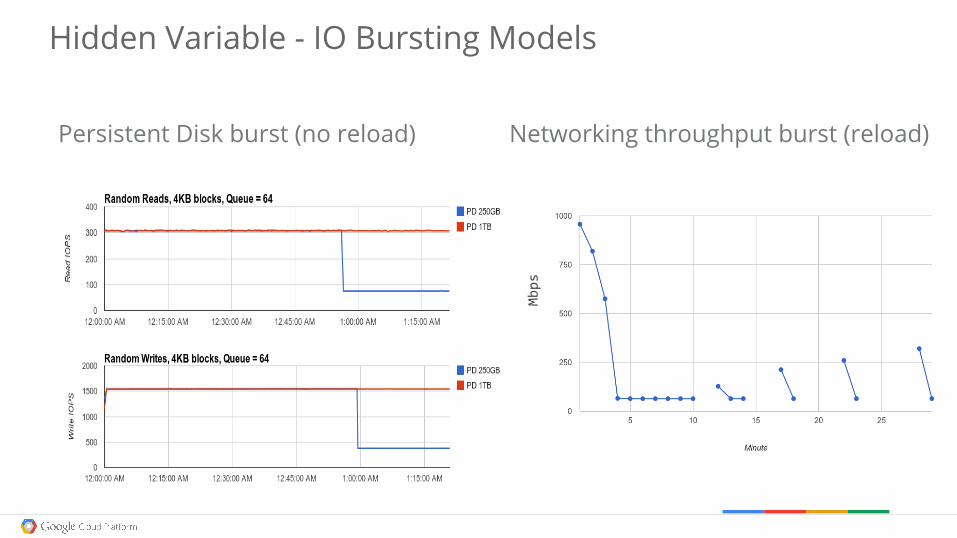
Hidden Variable - IO Bursting Models
Networking throughput burst (reload)Persistent Disk burst (no reload)
Mbps
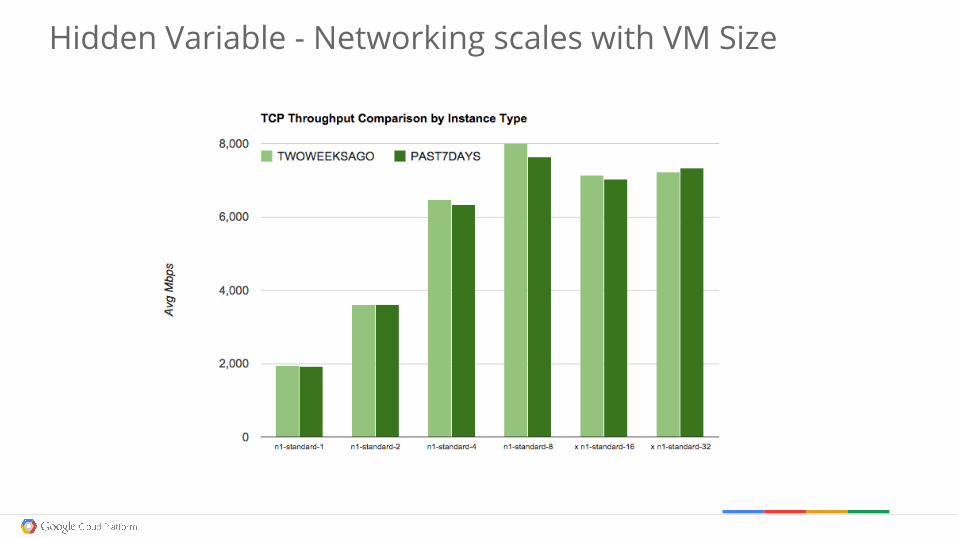
Hidden Variable - Networking scales with VM Size

Hidden Variable - Image choice has a *BIG* Impact
Settings only!

Hidden Variable - Guest IO Scheduler
PD and guest scheduler have strange interactions

Hidden Variable - Choice of Zone Matters!
US-CENTRAL1-[A|B] and EUROPE-WEST1-[B]SandyBridge
ASIA-WEST1-[A|B|C] and US-CENTRAL1-F and EUROPE-WEST1-CIvyBridge - Can get 15% better computation for some workloads. Has AVX and SSE4
US-CENTRAL1-C and EUROPE-WEST1-DHaswell - Has AVX2

Hidden Variable - Zone Throughput can be Asymmetrical
Internal IPs are much
faster!

PerfKit Benchmarker and Explorer
The Explorer for dashboarding and analysis
The Benchmarker for running benchmarks

Open Source Measurement Tools
PerfKitBenchmarker: The framework for running benchmarks
publish
scoringexecution
prepareruncleanup
provisioning
vm spec
parse & store
topology
installer
provisioning
workflow
analysis & scoring
reporting
upload
Workloads
- Aerospike
- Cassandra
- Hadoop
- HPCC
- MongoDB
- Oldisim
- Redis
CPU
- Coremark
- Spec CPU 2006
Disk
- Bonnie++
- Copy
- Fio
- Synthetic Storage
Varied
- Cluster Boot
- Object Storage
- Sysbench OLTP
- Unixbench
Network
- Iperf
- Mesh
- Network
- Netperf
- Ping

PerfKit Benchmarker: Example Runs
Example: Measuring boot time ./pkb.py --project=google.com:voellm --cloud=GCP --benchmarks='cluster boot'
Example: Measuring VM to VM performance cross zone./pkb.py --project=google.com:voellm --cloud=GCP --zones=us-central1-a,us-central1-b --benchmarks='iperf'
Example: Running in stagesFlags for stages: [--run_stage=prepare|run|publish|cleanup --run_uri=<id>]

Dashboards are interactive. Click to edit.
Save As to create your own copy
Click the X to delete a Widget
Container is a row. Widget is an element. Use to control placement.
PerfKit Explorer: Analytics Dashboards

Controls for the Widget Data and Transform
Query Editor for the power user!
Controls for the Dashboard and Widget Display
PerfKit Explorer: Analytics Dashboards

Embracing of Gustafson’s Law
PerfKit Explorer: How It’s Built

2002 2004 2006 2008 2010 2012 2013 2014
Colossus
Spanner
Dremel
Dataflow
Kubernetes
2003 2005 2007 2009 2011
Efficient Server Power
GFS
MapReduce
On-Board UPS
Warehouse Scale Datacenter
Carbon Neutral
Bigtable
Containerized Datacenter
First Public PUE Reporting
Containers Software Defined Networking
Flume
Megastore

BigQuery
Unlimited storage
Fully managed
Massively parallel query processing
Unstructured, semi-structure, and a structured data
Rich support of analysis functions like ABS, COS, …, CUME_DIST, NTILE,
PERCENT_RANK, …

Example BigQuery Select
SELECT USEC_TO_TIMESTAMP(UTC_USEC_TO_DAY(INTEGER(timestamp * 1000000))) as sorttime, MIN(value) as MIN_VALUE, AVG(value) as AVG_VALUE, MAX(value) as MAX_VALUEFROM
samples_mart.results, samples_mart.results_archiveWHERE
timestamp > TIMESTAMP_TO_SEC(DATE_ADD(CURRENT_TIMESTAMP(), -180, "DAY")) ANDproduct_name = "Artemis" ANDtest = "iperf" ANDmetric contains "Throughput" AND
labels contains "ip_type:internal" AND labels contains "n1-standard-8" AND ((REGEXP_EXTRACT(labels, r'\|client_zone:(.*?)\|') = REGEXP_EXTRACT(labels, r'\|server_zone:(.*?)\|')) OR (REGEXP_EXTRACT(labels, r'\|sending_zone:(.*?)\|') = REGEXP_EXTRACT(labels, r'\|receiving_zone:(.*?)\|'))) AND
owner = "jenkins"GROUP BY sorttimeORDER BY sorttime asc

Largest query by rows….
Largest query by bytes.........
Largest storage customer........
Streaming Ingest at peak..........
10.5 Trillion
2.1 PB
38 PB
2.4 Million rows per second
Stats For A Complex 100B Row QueryExecution Time… 11 SecondsData Scanned… 4 TBRegexes Executed… 100 Billion Data Shuffled… 278 GB
Backend Resources 3600 HDD (@ 100 MBps) 8800 vCPUs (@ 1 μsec each) 200 Gbps
BigQuery Fun Stats

BigQuery Column IO Storage
Record Oriented Storage Column Oriented Storage
Read query column data, not records (row based storage)Data Sharding and Replication
Performance Durability Better CompressionReducing Tail latency (hedge and tie)
BigQuery Peeking Under the Hood

BigQuery Peeking Under the Hood
Mixer 0
Mixer 1 Mixer 1
Leaf Leaf Leaf Leaf
Columnar Storage
Long lived shared serving tree
Partial ReductionDiskless data flow
Distributed Storage
BigQuery Under the Hood: Key Concepts

Google Cloud Storage
Benchmarker Data
Google BigQuery
Metadata Cubes
(AppEngine)
Spreadsheets
Coworkers
Explorer(AppEngine)
Streaming API - 100k rows/sec
PerfKit End to End

cloud.google.comImages by Connie
Zhou
Q & AIvan Santa Maria FilhoSenior Staff EngineerGoogle Cloud Performance