benchmarks for predicting and forecasting...
TRANSCRIPT

Benchmarks for Predicting and Forecasting
Construction Waste - Annex 3
February 2009
Understanding and Predicting Construction Waste
• The main objective is to understand and be able to predict construction, demolition and refurbishment waste more effectively
• The ability to predict the amount and type of waste likely to arise across all construction sectors helps with:
- minimising waste (e.g. through having waste targets in contracts), and
- maximising resource use (e.g. through matching supply of ‘waste’ with reprocessing capabilities in a region).
• Funded by Defra

Project Aims
• Develop and define basic reporting requirements for
construction, demolition and refurbishment waste.
• Collect benchmarking data on construction, demolition and
refurbishment waste in terms of quantity and composition
of waste.
• Convert this data into key performance indicators (KPIs)
for construction type and sector.
• Use the performance indicators to model and predict
waste arisings on a site, local, regional and national scale.

Basic reporting requirements
• Mandatory information– Project type e.g. residential, commercial office etc
– Gross internal floor area (m2) of project
– Location
– Project cost
– Length of project (start and anticipated end date)
– Number of employees
– If the project is construction, refurbishment and/or demolition
– Amount of waste produced (tonnes or volumes)
– Types of waste (based on EWC codes or BRE’s SMARTWaste
categories)

Key Performance Indicators (KPIs)
A number of KPIs have been produced:
Waste arisings
– Volume of waste (m3)/ 100m2 of floor area
– Tonnes of waste / 100m2 of floor area
– Volume of waste (m3)/ £100,000 of project value
– Tonnes of waste /£100,000 of project value
• % and amount (volume/tonnes) segregated – this gives an
indication of how much material is available for recovery
Data collection
• Data was collected from the Benchmarking website and the BRE
SMARTStart system.
• The Benchmarking website was set up as part of this project and is
available at www.smartwaste.co.uk/wastebenchmarking/
• The website allows users to enter project data in either tonnes or
volume whereas SMARTStart data is generally entered by volume.
• The features of the website are now incorporated into SMARTWaste
Plan (BRE’s free Site Waste Management Plan tool).
• The data collected is now being used to help companies estimate and
forecast waste as part of SMARTWaste Plan
Data analysis for completed projects (1)
• Data for all completed projects is subject to a number of
logical and statistical tests to produce two types of
performance indicator:
• For m3/100m2:– The floor area must be greater than 10 m2.
– The waste volume must be more than 10 m3 or the data is excluded.
– The volume of waste in m3 per 100 m2 floor area should be between 5 and
75.

Data analysis for completed projects (2)
• For m3/£100K:
– The project value must be greater than £100.
– The waste volume must be more than 10 m3 or the data is excluded.
– The volume of waste in m3 per £100K of project value should be between
5 and 75
• The same criteria for the tonnage data applies
Data analysis for completed projects (3)
• Data from completed projects is analysed every two
months to produce m3/100m2 and m3/£100K KPIs
• The KPIs are currently produced for 9 different project
types.
• The number of projects of each type passing the logical
tests is reported.
• The KPIs presented here are for new build projects
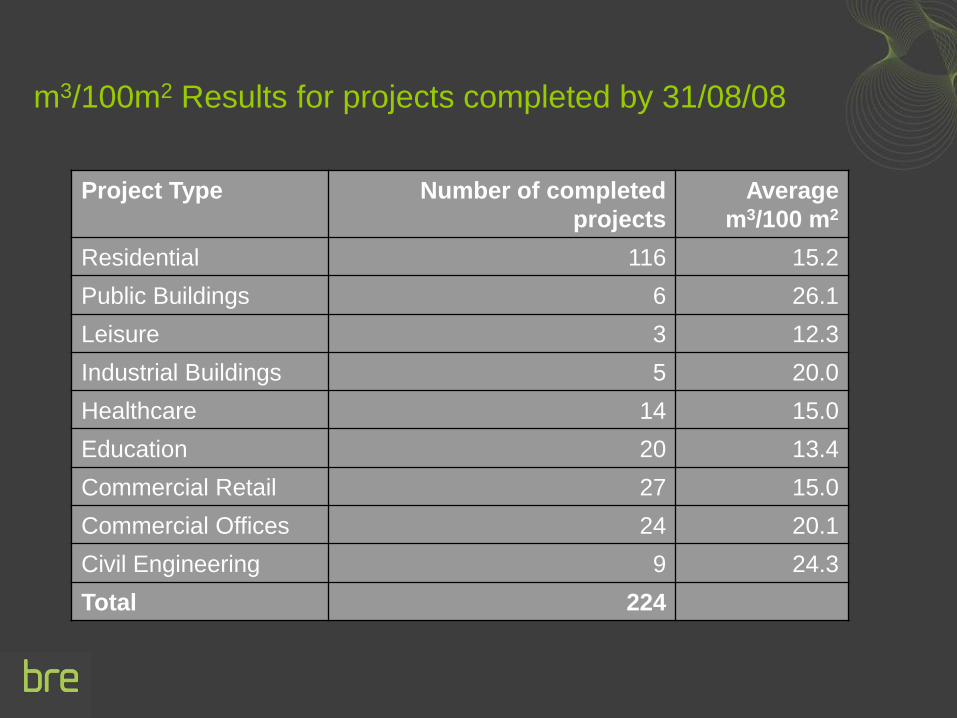
m3/100m2 Results for projects completed by 31/08/08
Project Type Number of completed
projects
Average
m3/100 m2
Residential 116 15.2
Public Buildings 6 26.1
Leisure 3 12.3
Industrial Buildings 5 20.0
Healthcare 14 15.0
Education 20 13.4
Commercial Retail 27 15.0
Commercial Offices 24 20.1
Civil Engineering 9 24.3
Total 224

m3/£100K Results for projects completed by 31/08/08
Project Type Number of completed
projects
Average
m3/£100K
Residential 112 18.3
Public Buildings 8 22.2
Leisure 5 20.6
Industrial Buildings 5 11.3
Healthcare 12 13.4
Education 21 17.3
Commercial Retail 24 10.4
Commercial Offices 22 14.9
Civil Engineering 6 20.3
Total 215
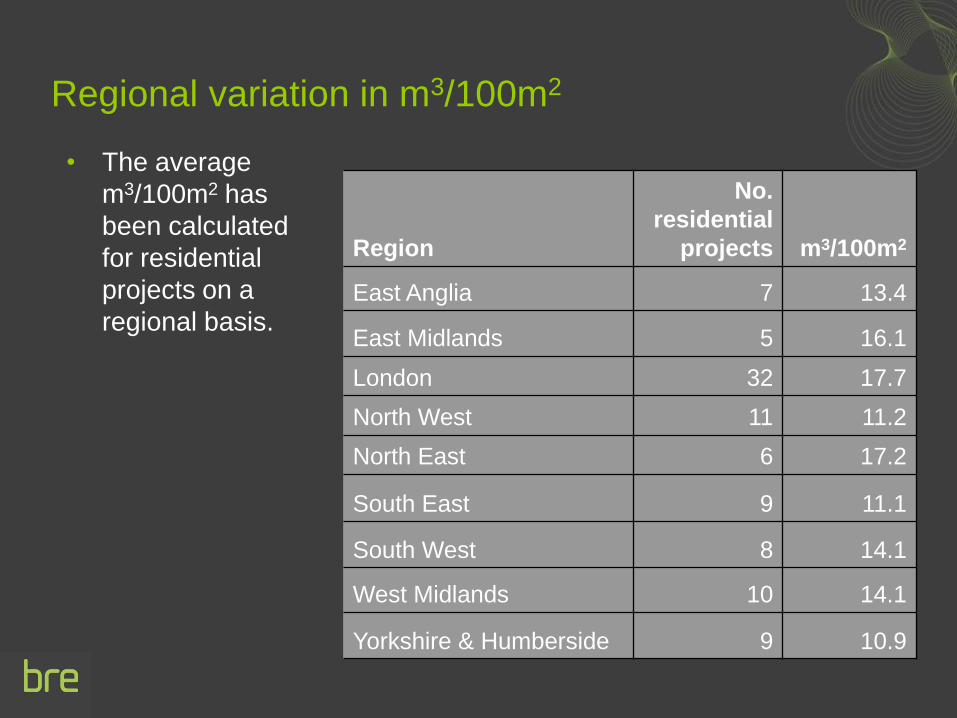
Regional variation in m3/100m2
• The average
m3/100m2 has
been calculated
for residential
projects on a
regional basis.
Region
No.
residential
projects m3/100m2
East Anglia 7 13.4
East Midlands 5 16.1
London 32 17.7
North West 11 11.2
North East 6 17.2
South East 9 11.1
South West 8 14.1
West Midlands 10 14.1
Yorkshire & Humberside 9 10.9
Performance indicators by waste products
• Performance indicators (KPIs) have been calculated for
waste products for each project type.
• Information by waste type provides the data for forecasting
types and amounts of waste that are likely to be generated
based on the floor size or cost of a particular development.
• Detailed results for residential developments are shown.
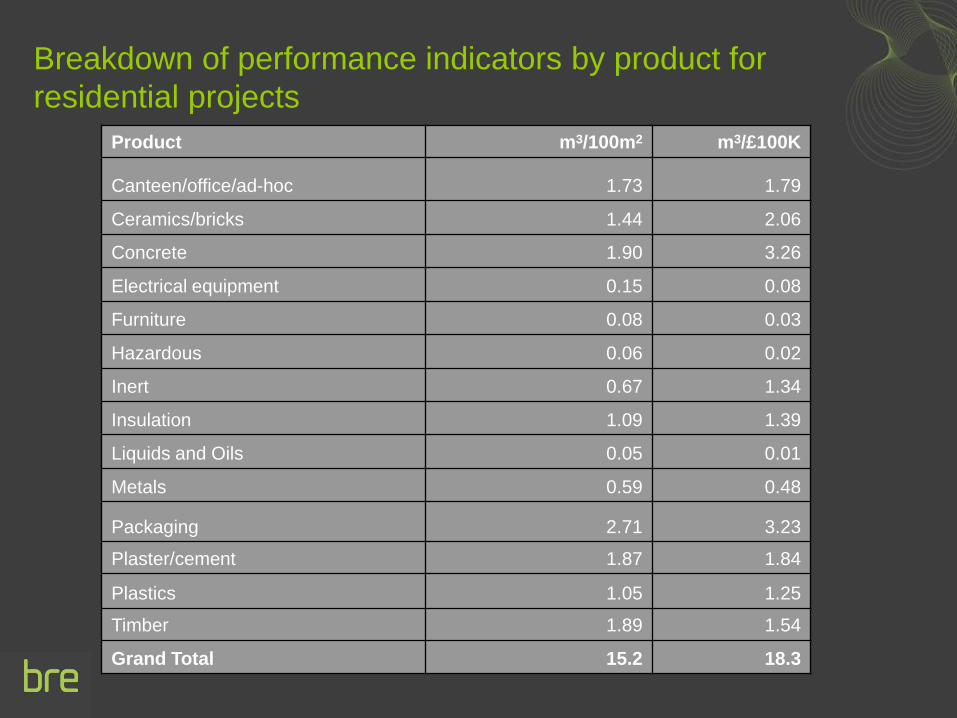
Breakdown of performance indicators by product for
residential projects
Product m3/100m2 m3/£100K
Canteen/office/ad-hoc 1.73 1.79
Ceramics/bricks 1.44 2.06
Concrete 1.90 3.26
Electrical equipment 0.15 0.08
Furniture 0.08 0.03
Hazardous 0.06 0.02
Inert 0.67 1.34
Insulation 1.09 1.39
Liquids and Oils 0.05 0.01
Metals 0.59 0.48
Packaging 2.71 3.23
Plaster/cement 1.87 1.84
Plastics 1.05 1.25
Timber 1.89 1.54
Grand Total 15.2 18.3

Performance indicators by waste product for residential
projects
m3/100m
2 for waste group by project
0.00
5.00
10.00
15.00
20.00
25.00
30.00
Civil Eng
inee
ring
Com
mer
cial R
etail
Com
mer
cial O
ffice
Educa
tion
Hea
lthca
re
Indu
stria
l Buildings
Leisur
e
Public
Buildings
Res
iden
tial
Project type
m3/1
00
m2
Timber
Plastics
Plaster/cement
Packaging
Metals
Liquids and Oils
Insulation
Inert
Hazardous
Furniture
Electrical equipment
Concrete
Ceramics/bricks
Canteen/office/adhoc
Range of performance indicators
• The range of KPIs has been reviewed for the different
project types
• The lower quartile has been assigned ‘best practice’, next
quartile assigned ‘good practice’ and top two quartiles
assigned ‘standard practice’.
• This has been done for residential, education, commercial
retail and offices where the dataset is larger than 10.
• These can provide benchmarks for the industry to start
improving their performance and moving from standard to
best practice.

Range of m3/100m2 for residential projects
Range of m3/100m2 for residential projects
0
10
20
30
40
50
60
70
80
m3/1
00m
2

Range of m3/100m2 for education projects
Range of m3/100m2 for education projects
0
5
10
15
20
25
30
35
m3/1
00m
2

Range of m3/100m2 for commercial retail projects
Range of m3/100m2 for commercial retail projects
0
10
20
30
40
50
60
70
m3/1
00m
2

Range of m3/100m2 for commercial office projects
Range of m3/100m2 for commercial office projects
0
10
20
30
40
50
60
70
80
m3/1
00m
2

Benchmarks of m3/100m2 for standard, good and best
practice
Best
practice
Good
practice
Standard
practice
Residential <9.0 9.0-12.9 >12.9
Commercial Retail <6.2 6.2-12.1 >12.1
Commercial Offices <8.3 8.3-14.0 >14.0
Education <9.3 9.3-12.1 >12.1

Benchmarks of m3/£100K for standard, good and best
practice
Best
practice
Good
practice
Standard
practice
Residential <7.7 7.7-13.1 >13.1
Commercial Retail <6.5 6.5-8.8 >8.8
Commercial Offices <6.3 6.3-9.0 >9.0
Education <7.8 7.8-10.0 >10.0
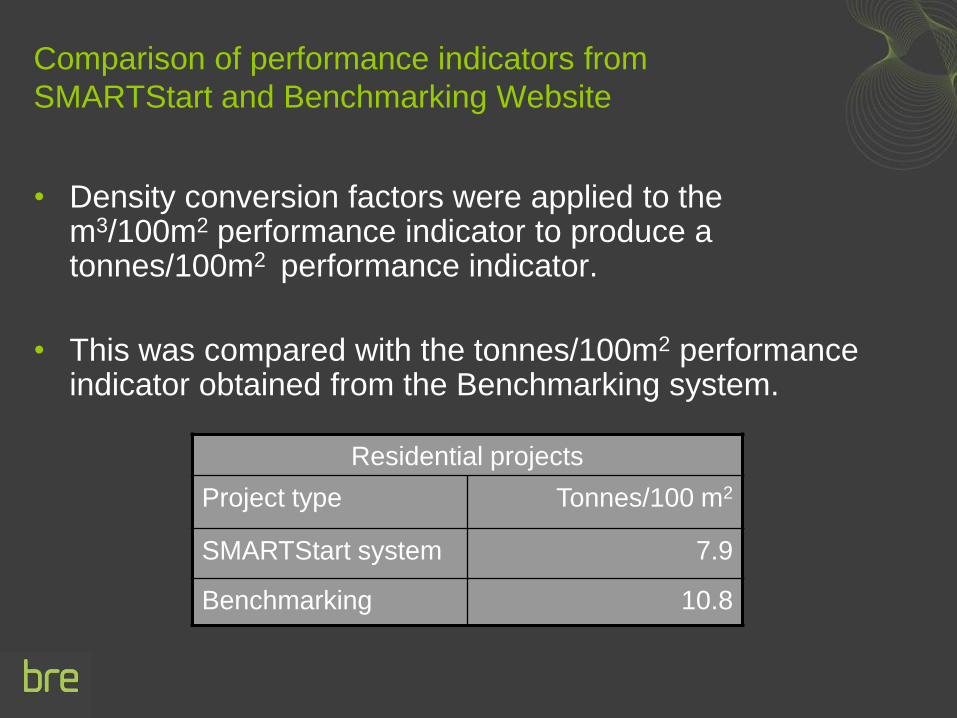
Comparison of performance indicators from
SMARTStart and Benchmarking Website
• Density conversion factors were applied to the m3/100m2 performance indicator to produce a tonnes/100m2 performance indicator.
• This was compared with the tonnes/100m2 performance indicator obtained from the Benchmarking system.
Residential projects
Project type Tonnes/100 m2
SMARTStart system 7.9
Benchmarking 10.8
Summary of performance indicators over time
• The performance indicators for m3/100m2 and m3/£100K
have been evaluated every 2 months from May 2007 to
August 2008.
• We would anticipate the variations will reduce as more
projects are included particularly following the
implementation of SWMPs.

Variation in m3/100m2 over time
Range of m 3/100m 2 from May 2007 to August 2008
0.0
5.0
10.0
15.0
20.0
25.0
30.0
31/0
5/200
7
20/0
6/200
7
03/0
9/200
7
10/1
0/200
7
05/1
2/200
7
14/0
2/200
8
23/0
4/200
8
30/0
6/200
8
31/0
8/200
8
Avera
ge m
3/1
00m
2
Residential
Public Buildings
Leisure
Industrial Buildings
Healthcare
Education
Commercial Offices
Commercial Retail
Civil Engineering

Variation in m3/£100K over time
m3/£100K for projects between May 2007 and August 2008
0.0
5.0
10.0
15.0
20.0
25.0
30.0
31/05/
2007
20/06/
2007
03/09/
2007
10/10/
2007
05/12/
2007
14/02/
2008
23/04/
2008
30/06/
2008
31/08/
2008
Date
m3/£
100K
Residential
Public Buildings
Leisure
Industrial Buildings
Healthcare
Education
Commercial Offices
Commercial Retail
Civil Engineering

Segregation rates
• Data has been collected on the volume of waste
segregated on site - used to calculate % segregation.
• Analysis of the data has been carried out and no strong
correlation was found between:
– floor area and % segregated
– project value and % segregated
• Average and median % segregation for different project
types have been calculated.

Average % segregation for different project types
% segregated Average Median
Residential 18.3 5.3
Public Buildings 59.0 63.5
Leisure 20.4 1.6
Industrial Buildings 43.0 47.6
Healthcare 26.7 24.3
Education 29.3 10.9
Commercial Retail 37.5 22.5
Commercial Offices 38.0 28.2
Civil Engineering 55.7 62.6
Use of benchmarks to model waste arisings
• The benchmarks calculated have been used to model
waste arisings.
• The overall and waste specific benchmarks for residential
projects have been applied to the planned residential
developments in Hertfordshire.
• The predicted waste arising has been calculated for the
various districts over a 20 year period.
• The total waste arising for different waste products have
been calculated for the whole of Hertfordshire over the
same 20 year period.
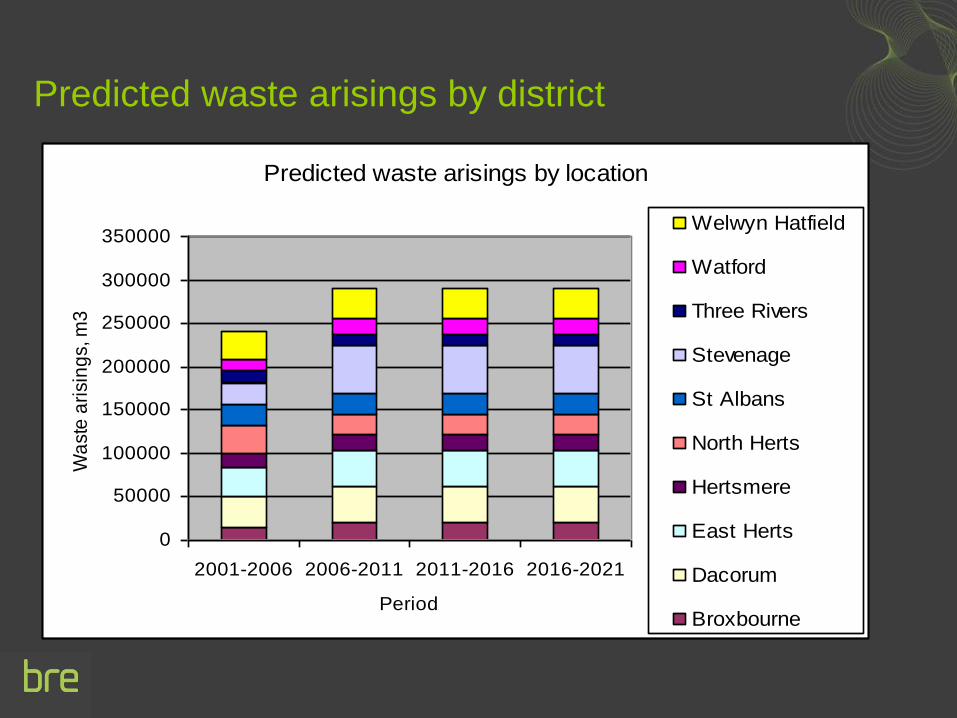
Predicted waste arisings by district
Predicted waste arisings by location
0
50000
100000
150000
200000
250000
300000
350000
2001-2006 2006-2011 2011-2016 2016-2021
Period
Wa
ste
ari
sin
gs, m
3
Welwyn Hatfield
Watford
Three Rivers
Stevenage
St Albans
North Herts
Hertsmere
East Herts
Dacorum
Broxbourne
Predicted waste
arising, m3
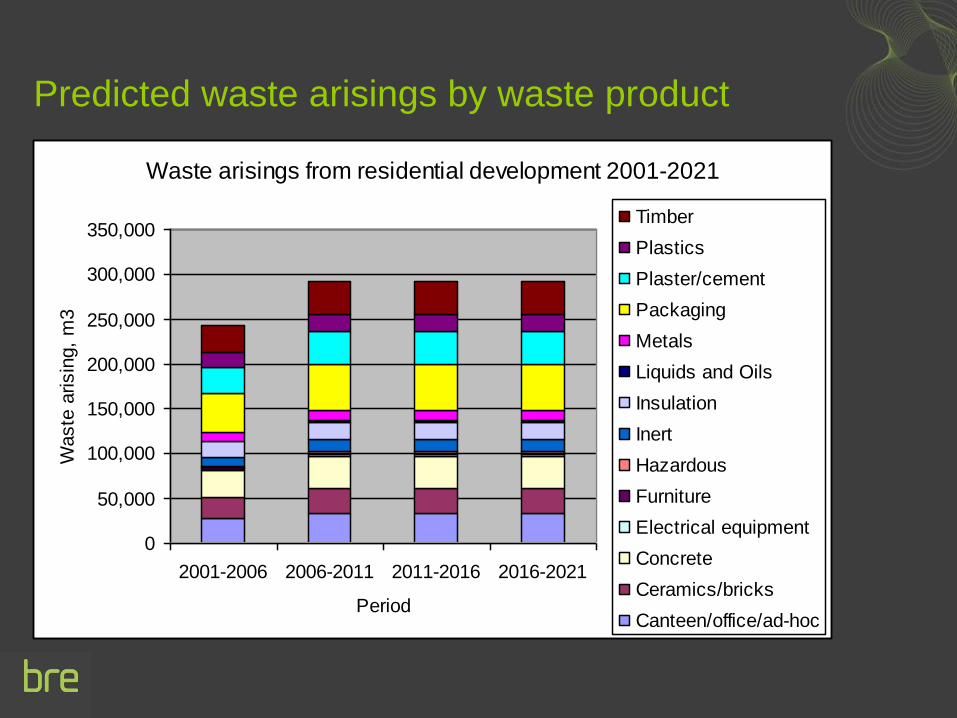
Predicted waste arisings by waste product
Waste arisings from residential development 2001-2021
0
50,000
100,000
150,000
200,000
250,000
300,000
350,000
2001-2006 2006-2011 2011-2016 2016-2021
Period
Waste
arisin
g,
m3
Timber
Plastics
Plaster/cement
Packaging
Metals
Liquids and Oils
Insulation
Inert
Hazardous
Furniture
Electrical equipment
Concrete
Ceramics/bricks
Canteen/office/ad-hoc

How can policymakers use the performance indicators?
• Provide data for forecasting and planning for sustainable
waste management at a construction project level
• Help to prioritise actions and policies related to
construction waste management
• Provide a benchmark for measuring and evaluating
performance of policies e.g. Site Waste Management Plan
Regulations
• Model possible future scenarios and capacities required
for recovery of construction waste.

How can the industry use these benchmarks?
• Provide a means for estimating and forecasting waste
• Setting targets for waste reduction and waste recovery
• Provide information for key waste streams
• Develop appropriate actions for better management of
waste and waste reduction
• Benchmark performance against other projects
• Benchmark performance against industry averages

Dissemination
• Short guides on how to use the data have been produced for:– Policymakers
– Planners
– Clients/designers
– Contractors
• Final report has been written for Defra (SID 5); this was updated in February 2009.
• Annexes on key recommendations for waste reduction and data analysis
The future
• KPIs continue to be updated bimonthly and are available
from SMARTWaste
• BRE’s free SMARTWaste Plan (a Site Waste
Management Plan tool) will collect more data including
waste management routes and waste data
• A free local resource planning tool has also be developed
for planners and can be found at www.smartwaste.co.uk
• SMARTStart and benchmarking website have been
incorporated into SMARTWaste Plan

For further information:
W: www.smartwaste.co.uk
T: 01923 664200