bending mechanical behavior analysis of glass-fiber
TRANSCRIPT

Journal of Marine Science and Technology, Vol. 26, No. 4, pp. 575-586 (2018 ) 575 DOI: 10.6119/JMST.201808_26(4).0010
BENDING MECHANICAL BEHAVIOR ANALYSIS OF GLASS-FIBER REINFORCED
THERMOPLASTIC PIPE BASED ON A NONLINEAR SOLID ELEMENT MODEL
ShuQing Wang, Lu Yao, and XiangJian Meng
Key words: reinforced thermoplastic pipe, material nonlinearity, bend- ing performance, initial ovality, volume ratio of glass fiber, diameter-to-thickness ratio, ply angle.
ABSTRACT
In this paper, a comprehensive investigation on the bending mechanical behavior of glass-fiber reinforced thermoplastic pipe (RTP) is implemented by using a three-dimensional (3D) solid finite-element (FE) model. A major contribution of this paper is to present a UMAT based equivalence procedure for solid ele- ments, which is capable of considering the material anisotropic nonlinearity of thermoplastic composite pipe (TCP) laminate. First, the linearity and nonlinearity of RTP’s material are incor- porated into the numerical analysis and their effects on the bend- ing performance are compared. Then, based on the material nonlinearities, the influences of initial ovality, volume ratio of glass fiber, diameter-to-thickness (D/t) ratio and ply angle of fila- ment winding on the bending performance of RTP are further investigated. Analytical results indicate that the material non- linearity has a significant effect on the bending performance of RTPs. In addition, suitable geometrical parameters can improve the bending performance of RTPs and reduce the economic costs due to the smaller minimum allowable bending radius (MABR).
I. INTRODUCTION
The resource of offshore oil and gas constitutes a large pro- portion of the worldʼs energy (BP Company, 2012). As the me- dium of oil and gas transportation, the submarine pipeline plays an important role in the process of exploration. Compared with the poor corrosion resistance and heavy weight of traditional steel pipe, reinforced thermoplastic pipes (RTPs) are now being
outer cover
TCP laminate
inner liner
Fig. 1. Typical configuration of RTP’s structure.
widely considered as possible alternatives due to their excellent performance. The advantages of RTP include high flexibility, lower weight, better corrosion resistance, high internal pressure rating, etc. Because of the easy transportation and installation, more than 500 km of RTPs have been laid in the desert area such as Middle East and Australia (Morland and Weller, 2014). RTPs are typically available with working pressure ratings from 2.1 MPa to 10.3 MPa and internal diameters from 50 mm to 125 mm (Lesage et al., 2010). In recent years, the use of RTPs for offshore applications is growing frequently. It is mainly applied in marine riser, water injection pipe, oil and gas transportation pipe (Dalmolen et al., 2009).
The typical pipe body of RTPs consists of three main compo- nents: an internal thermoplastic liner, helical wrapped continuous high-strength fiber reinforced layers and an external thermoplastic cover (DNV, 2015). The inner liner and outer cover are both bonded or fused to the TCP laminate. The schematic of a ty- pical pipe body is shown in Fig. 1.
The inner thermoplastic liner serves mainly as a barrier to- wards the inner fluid. The outer thermoplastic cover is a pro- tective layer from outside conditions. Both of the liner and the cover protect the middle reinforced thermoplastic layers from pressure and corrosive damage that come from the internal trans-
Paper submitted 02/06/18; revised 04/18/18; accepted 06/22/18. Author for correspondence: ShuQing Wang (e-mail: [email protected]). Shandong Provincial Key Laboratory of Ocean Engineering, Ocean University of China, Qingdao, P.R. China.

576 Journal of Marine Science and Technology, Vol. 26, No. 4 (2018 )
ported fluid and external environment. The basic thermoplastic materials of inner liner and outer cover include polyethylene (PE), polypropylene (PP), polystyrene (PS) and polycarbonate (PC). The aim of middle reinforced layer is to resist possible failure load. It is a thermoplastic matrix reinforced by fibers which typically made by tape winding and filament winding. The basic materials of fiber include glass, carbon, metallic, aramid. The reinforced layers are the main structure elements of the RTP, wrapped around the inner pipe with several layers in al- ternating directions, and absorbed the stress caused by internal and external pressure. The reinforced layers usually made from several angle-ply layers with winding angles of 54.7 (Chapman et al., 2010).
Researchers have done a lot of theoretical and experimental research about the steel submarine pipeline (Kyriakides et al., 1989; Kyriakides and Corona, 2007). Researches showed that it is necessary to consider about the material nonlinearity in the process of analysis. Besides that, the initial ovality of the pipe, the diameter to thickness (D/t) ratio of the cross section and the loading path play very important roles in the mechanical behavior of submarine pipeline. And the MABR is closely related to the transportation and storage of pipeline. Therefore, in order to re- search the performance of RTP, the influence factors mentioned above should be considered systematically.
The research and application of RTP started relatively late. In recent years, the research of RTPs has been rapidly executed and made some achievements. Charlesworth et al. (2014) re- viewed the different combinations of thermoplastic matrix and fiber that can be selected for dynamic riser applications. It can be seen that the key material performance criteria include strength, fatigue, high temperature resistance and chemical compatibility. The flexibility combined with glass and carbon fibers resistance to very high temperatures and the chemical compatibility make them ideal choices for riser applications. Gibson et al. (2000) es- tablished a laminate theory model, modified the laminate theory and took account of the nonlinearity of the PE matrix. The results showed good agreement with most of the experimental pressure-strain data. Kruijer et al. (2006) analyzed the time de- pendent behavior of a steel reinforced thermoplastic pipe (s-RTP) which contains a HDPE liner pipe and took the nonlinearity of HDPE into account. However, all of them ignored the non- linearity of the reinforced layer. De Kanter and Leijten (2009) developed a dedicated pipe analysis tool that considered material nonlinearity of thermoplastic matrix and geometric variations, such as fiber volume fraction, tape thickness and ovality of the pipe. However, similar to Kruijer’s research, the nonlinearity pro- perty of fiber reinforced layer is also neglected. Ashraf et al. (2014) also established a shell element model and investigated the composite reinforced pipe about different diameter-to-thickness ratios and ply angles of filament winding under flexure load. Yu et al. (2015) established a shell element model, then researched the mechanical behavior under pure bending load and combined external pressure and bending, respectively. It was shown that the improvement of spool ability of RTPs can also be achieved by employing two angle-ply reinforcing layer systems. However,
the influence of the radial stress of RTP is ignored in their nu- merical analyses.
In previous research, it was well proved that the RTPs have excellent performance as submarine pipelines. However, some issues for RTPs need further research. On one hand, most of the researches are based on shell element models, lacking of con- sideration of radial stress due to the greater radial deformation in the bending moment. On the other hand, linear constitutive re- lationship was used to simulate the material property of rein-forced layer in most studies. However, the material anisotropy property of TCP laminate is nonlinear because of the nonlin-earity of HDPE. Therefore, the influence of material anisotropy nonlinearity of TCP laminate to the mechanical behavior cannot be ignored.
The objective of this paper is to study the bending mechanical behavior of RTPs by considering the material nonlinearities. To achieve this objective, a UMAT based equivalence procedure is developed and used to simulate the material anisotropy non- linearity of TCP laminate based on a 3D solid FE-model. The ef- fects of the material nonlinearities of HDPE and TCP laminate are considered, respectively. In addition, the influences of ini- tial ovality, the volume ratio of glass fiber, the D/t ratio of cross- section and ply angle of the filament winding are also investigated and analyzed in details.
NUMERICAL SIMULATION
1. Finite Element Model
This paper mainly studies the bending mechanical behavior of the glass-fiber reinforced thermoplastic pipe (RTP) with the method of numerical simulation. A suitable FE-model of RTP is very important to numerical analysis. In the present paper, the FE-model is a cylindrical 3D solid element model that consists of three parts, including inner liner, middle reinforced thermo- plastic composite pipe laminate (TCP laminate) and outer cover.
In the model of RTP, one end of the pipe is kept fixed while the other end is free to rotate in the direction of rotation. At the free end, kinematic coupling is used to link the degrees of free- dom of the nodes at the cross-section to a reference point located at the neutral axis. The bending load imposed on the model is completed by setting the rotation ‘’ at the reference point, as shown in Fig. 2. The finite elements of RTP adopt 8 nodes ele- ments (C3D8R) for considering the effect of the thickness of RTP’s structure. The length of the pipe model (L), the inner dia- meter (D) and the thickness of the cross section (t) are 2000 mm, 100 mm, 7.2 mm, respectively. 40 elements along the axial di- rection and 20 elements along the hoop direction are enough to ensure the convergence and accuracy of numerical results. In the radial direction, the number of elements is 8. Moreover, the enhanced strain is adopted to control the hourglass mode for middle TCP laminate elements. The thicknesses of inner liner and outer cover are both 3 mm. The thickness of TCP laminate is 1.2 mm, and it is composed of 4 equal thickness layers with winding angles of 54.7, as shown in Fig. 3. The function of composite layup can be used to establish the TCP laminate

S. Q. Wang et al.: Bending Mechanical of Nonlinear RTP Model 577
Table 1. Linear anisotropic elastic constants of the TCP laminate.
E1 (MPa) E2 (MPa) E3 (MPa) 12 13 23 G12 (MPa) G13 (MPa) G23 (MPa)
44360 2761 6834 0.305 0.242 0.125 975 3554 905
fixed end
θ
free end androtation load
Fig. 2. FE-model and boundary conditions.
Angle = 54.7
Angle = 54.7
Angle = 54.7
Angle = 54.7
Ply-1
Ply-2
Ply-3
Ply-4
Fig. 3. TCP laminate.
structure (ABAQUS, 2009).
2. Material Properties of the HDPE and TCP Laminate
It is necessary to confirm the material properties of RTP firstly. As we know, the materials of RTP are composed of HDPE and TCP laminate, which exhibits different material character-istics. The linear and the nonlinear properties of HDPE and TCP laminate are described in this section, respectively.
The linear material properties of HDPE consist of elastic mo- dulus and poisson’s ratio. The values of elastic modulus and poisson’s ratio are 1200MPa and 0.42, respectively. The isotropic function can be applied to input the material property of the HDPE. The linear anisotropic elastic constants of the TCP lami- nate are presented in Table 1. They are the elastic moduli, poisson’s ratios, and shear moduli, respectively. The material en- gineering constants function can be used to define these elastic constants.
The nonlinear property of HDPE is actually the nonlinear stress-strain relationship. The nonlinearity property of HDPE can be obtained from the tensile experiment. A typical nonlinear stress-strain curve of HDPE from tensile test is shown in Fig. 4. The material isotropic function can be used to define the non- linear relationship.
As for TCP laminate (HDPE reinforced with glass fibers), it is more difficult to consider the material nonlinearity directly due to its material anisotropy. Because of the different glass crystal- lographic orientations, the TCP laminate shows obvious material anisotropy. The anisotropic elastic constants of TCP laminate have E1, E2, E3, 12, 13, 23 and G12, G13, G23, which are
25
0 0.05 0.1 0.15 0.2 0.25 0.3
Stre
ss (M
Pa)
Strain
20
15
10
5
0
Fig. 4. Constitutive relation of the HDPE.
governed by a series of parameters (the material properties of glass fiber and HDPE, the volume fraction of glass fiber and HDPE, etc.). With the change of elastic modulus of matrix HDPE, the anisotropic elastic constants of TCP laminate can be calcu- lated using micromechanics Eq. (1) as follows (Zheng et al., 2006):
1 1 1(1 )f f m fE E V V E V V (1a)
1
21
f m m f
mm f pe
E E E V VE E
E V E V
(1b)
1
31 2
f m m f
mm f
E E E V VE E
E V E V
(1c)
2 2 1 1
12
1 2 2
f pe m pe pe pe pe f f f
pe f f m
V E V V V V V V E
V V V E V V E
(1d)
1 1
13 2
f f f pe m pe
pe
f f m pe
E V V E V VV
E V E V
(1e)
32
2 1
pe f f pe pe
f f pe pe pe
V V
V V V V
(1f)
112 2
f mm
m f f pe
G G VG G V
G V G V
(1g)
131 2 2
m f f m pe
m f f m pe
G G V G VG
G V G V V G V V
(1h)
578 Journal of Marine Science and Technology, Vol. 26, No. 4 (2018 )
3
2
2
θ
I
II
HDPE
glass fiberglass fiber
x
y
11
Fig. 5. Cross section of reinforced layer of TCP laminate.
23
1 11
f m
m f f f
G GG
G V V G V V
(1i)
2 1
ff
f
EG
(1j)
2 1
mm
pe
EG
(1k)
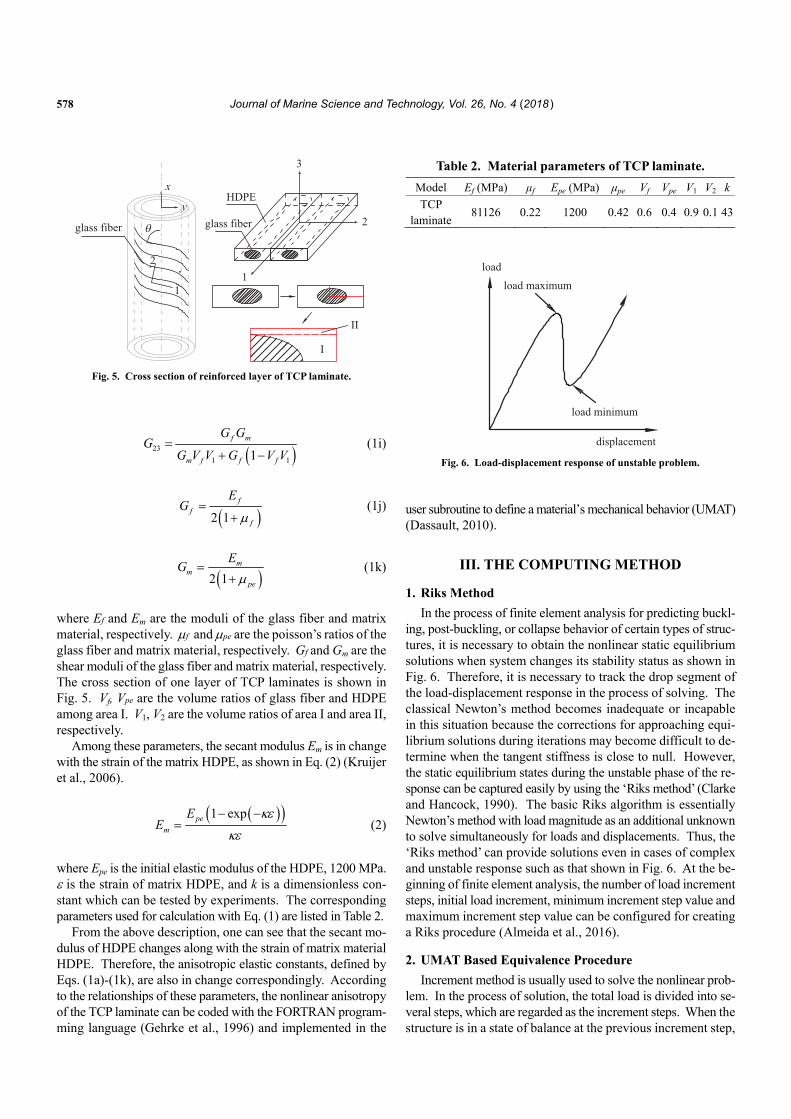
where Ef and Em are the moduli of the glass fiber and matrix material, respectively. f and pe are the poisson’s ratios of the glass fiber and matrix material, respectively. Gf and Gm are the shear moduli of the glass fiber and matrix material, respectively. The cross section of one layer of TCP laminates is shown in Fig. 5. Vf, Vpe are the volume ratios of glass fiber and HDPE among area I. V1, V2 are the volume ratios of area I and area II, respectively.
Among these parameters, the secant modulus Em is in change with the strain of the matrix HDPE, as shown in Eq. (2) (Kruijer et al., 2006).
1 exppe
m
EE
(2)
where Epe is the initial elastic modulus of the HDPE, 1200 MPa. is the strain of matrix HDPE, and k is a dimensionless con-stant which can be tested by experiments. The corresponding parameters used for calculation with Eq. (1) are listed in Table 2.
From the above description, one can see that the secant mo- dulus of HDPE changes along with the strain of matrix material HDPE. Therefore, the anisotropic elastic constants, defined by Eqs. (1a)-(1k), are also in change correspondingly. According to the relationships of these parameters, the nonlinear anisotropy of the TCP laminate can be coded with the FORTRAN program- ming language (Gehrke et al., 1996) and implemented in the
Table 2. Material parameters of TCP laminate.
Model Ef (MPa) μf Epe (MPa) μpe Vf Vpe V1 V2 k
TCP laminate
81126 0.22 1200 0.42 0.6 0.4 0.9 0.1 43
load maximum
load minimum
displacement
load
Fig. 6. Load-displacement response of unstable problem.
user subroutine to define a materialʼs mechanical behavior (UMAT) (Dassault, 2010).
III. THE COMPUTING METHOD
1. Riks Method
In the process of finite element analysis for predicting buckl- ing, post-buckling, or collapse behavior of certain types of struc- tures, it is necessary to obtain the nonlinear static equilibrium solutions when system changes its stability status as shown in Fig. 6. Therefore, it is necessary to track the drop segment of the load-displacement response in the process of solving. The classical Newton’s method becomes inadequate or incapable in this situation because the corrections for approaching equi-librium solutions during iterations may become difficult to de- termine when the tangent stiffness is close to null. However, the static equilibrium states during the unstable phase of the re- sponse can be captured easily by using the ‘Riks method’ (Clarke and Hancock, 1990). The basic Riks algorithm is essentially Newton’s method with load magnitude as an additional unknown to solve simultaneously for loads and displacements. Thus, the ‘Riks method’ can provide solutions even in cases of complex and unstable response such as that shown in Fig. 6. At the be- ginning of finite element analysis, the number of load increment steps, initial load increment, minimum increment step value and maximum increment step value can be configured for creating a Riks procedure (Almeida et al., 2016).
2. UMAT Based Equivalence Procedure
Increment method is usually used to solve the nonlinear prob- lem. In the process of solution, the total load is divided into se- veral steps, which are regarded as the increment steps. When the structure is in a state of balance at the previous increment step,

S. Q. Wang et al.: Bending Mechanical of Nonlinear RTP Model 579
the main procedure (ABAQUS) continues to increase the load and solve the nonlinear static equilibrium equations based on the Riks iterative method. Because the anisotropy nonlinearity of TCP laminate cannot be simulated directly, a UMAT based equivalence procedure is proposed to update the anisotropy ma- terial constants in each iterative step. At every iterative step, main procedure calls the UMAT to calculate the anisotropy ma- terial constants, assemble the Jacobian matrix (the rate of change of stress increment to strain increment), solve the stress incre- ment and update the values of stresses. After that, the UMAT transmits the Jacobian matrix to the main procedure for assem-bling the total stiffness matrix. The main procedure solves the displacement increment based on the load increment and has the convergence test of the nonlinear static equilibrium equa-tions. If the equilibrium equations are not convergent, the whole process is repeated in the next iterative step. On the contrary, the next increment step will be solved based on the current equi- librium state. The particular computation process of UMAT be- tween the contiguous increment steps can be summarized as the following steps (The subscript i represents the iterative step number):
(1) Read the stress (i), the strain (i) and the strain increment
(di) from the main procedure at iterative step i; (2) Calculate elastic modulus of HDPE according to the strain
(i) in Eq. (2), and then substitute it into Eq. (1) to deter-mine the values of the anisotropy elastic constants of TCP laminate at iterative step i;
(3) Assemble the new stress-strain relationship (Si) in Eq. (3) according to the anisotropy elastic constants from step (2), then solve the stress increment (di) in Eq. (4), and finally update the stress and strain for FE-model from Eq. (5) at iterative step i;
(4) Transmit the stress (i1), strain (i1) and Jacobian matrix to main procedure, and then have the convergence test;
(5) If the nonlinear equilibrium equations are convergent, go on the next increment step. Otherwise, repeat steps (1) to (4) for the next iterative step i+1 according to the new strain increment (di1).
3121
1 2 3
3221
2 2 3
31 32
3 3 3
23
31
12
10 0 0
10 0 0
10 0 0
10 0 0 0 0
10 0 0 0 0
10 0 0 0 0
i
E E E
E E E
E E ES
G
G
G
(3)
UMAT
ABAQUS
YES
NO
Start
Analysis step
New increment step
Iterative step
Convergenceset
Over
Calculate the anisotropymaterial constants
Assemble the Jacobian matrix
Solve the stress increment
Update the values of stress
Fig. 7. Flow chat of the usage process of UMAT.
2
1.5
Mom
ent (
N*m
m)
Rotation (rad)
Yu’ model (nonlinear)Solid FE-model (nonlinear)
1
0 0.5 1 1.5 2 2.5 3
0.5
0
× 106
Fig. 8. Comparison of the rotation-moment response.
1i id S d (4)
1 1;i i i i i id d (5)
The calculation process of UMAT between two contiguous increment steps can be illustrated in Fig. 7.
3. Verification of the User Subroutine (UMAT)
With the three-dimensional (3D) RTP model, the UMAT based equivalence procedure is used to consider the anisotropy nonlinearity of TCP laminate. The numerical results under pure bending load are compared with the results from Yu’s paper (Yu et al., 2015). In Yu’s paper, shell elements are selected to model the pipe structure. Different from Yu’s model, solid ele- ments are adopted in this paper. Both the current FE-model and Yu’s FE-model have the same material properties, boundary con- dition and load case. The software ABAQUS is used to conduct the numerical simulation analysis.
Fig. 8 shows the bending moment-rotation relationship of the current FE-model and Yu’s model. Both of the results are convergent and the sudden drop in the curves indicates the oc- currence of the local instability. It can be seen that the result of the proposed model agrees well with that of Yu’s model. Little

580 Journal of Marine Science and Technology, Vol. 26, No. 4 (2018 )
difference is that the critical angle of solid element model is less than Yu’s model. In other words, UMAT based equivalence procedure is reliable and relatively conservative to consider the material nonlinearity of TCP laminate in 3D solid FE-model.
Based on the more precise and conservative result, it makes sense to have a further research with 3D solid FE-model on the bending performance. In addition, the UMAT based equivalence procedure can be used to consider the anisotropy nonlinearity of TCP laminate for the solid FE-model analysis.
IV. NUMERICAL SIMULATION ANALYSIS
After being verified in Section 3.3, the 3D solid FE-model and the UMAT based equivalence procedure can be applied to in- vestigate bending mechanical behavior of RTP under bending load. In this section, for ensuring the validity and reliability of research results, the influences of material nonlinearities of ma- trix HDPE and TCP laminate are investigated systematically with four different FE-models. Subsequently, the effects of initial ovality, volume ratio of glass fiber, D/t ratio and ply angle are re- searched, respectively. Meanwhile, the MABRs are calculated and compared under different load cases.
1. Effects of Material Nonlinearity on Bending Performance of RTP
This part mainly investigates the effect of the material non- linearity on bending performance of RTP. To reach the objective, four FE-models with different material properties are established and analyzed.
Model A: Linear properties are assumed for both the HDPE
and TCP laminate, in other words, the constitutive re- lation is simplified into a linear relationship. The ela- stic modulus and poisson’s ratio of HDPE are 1200 MPa and 0.42. The linear anisotropic material con- stants of TCP laminate are shown in Table 1.
Model B: Linear property is only assumed for the matrix HDPE. The nonlinear property of TCP laminate is consi- dered. That is to say, the anisotropic elastic constants of TCP laminate change with the deformation of RTP structure.
Model C: Linear property is only assumed for the TCP laminate, the elastic constants of TCP laminate are shown in Table 1. The nonlinear property of HDPE is taken into account in numerical simulation. The nonlinear re- lationship of stress and strain of HDPE is shown in Fig. 4.
Model D: Both of the HDPE and the TCP laminate consider material nonlinearity in numerical simulation. This represents that the constitutive relations of HDPE and TCP laminate are both nonlinear relationships.
The method of defining the material nonlinearity has been
described in Section 2.2. Four solid element models are esta- blished according to the dimensions defined in Section 2.1. In
4
3
2
1
00 0.5 1
model A: HDPE lin; TCP lin model B: HDPE lin; TCP nonmodel C: HDPE non; TCP lin model D: HDPE non; TCP non
1.5 2 2.5 3
Mom
ent (
N*m
m)
Rotation (rad)
× 106
Fig. 9. Moment-rotation curves of different models (lin = linear; non =
nonlinear).
these models, one end of the RTPs is kept fixed while the other end is applied rotation ‘’ at the reference point.
1) Buckling Analysis
First, the buckling analysis is executed based on the models A-D with linear and nonlinear material properties. Then, the load-displacement curves of different models can be obtained. Fig. 9 shows the moment-rotation relationships of models A-D. During the buckling analysis, all models are convergent as buckling occurs.
From Fig. 9, it can be found that as the rotation angle increases, the bending moment of RTP increases correspondingly. When the bending moment finally reaches the critical value, indicated by a sudden drop at the end of the curve, the RTP loses its bend- ing load-bearing capacity. It is also the indication that the RTP has buckled, and the corresponding moment and angle are called the critical moment and the critical angle.
More specifically, when model A is compared with model B, it can be found that the tendency of two curves is extremely similar before the rotation angle of 2.5 rad, but the critical ro- tation angle of model B is slightly smaller than that of model A, with the critical moments of these two models almost close to each other. The same situation can be seen from the compari- son of model C and D. It can be concluded that the nonlinearity of TCP laminate mainly affects the critical angle of RTP. On the other hand, comparing model A with model C, one can see that the bending performance of model A is better than model C because model A has a greater critical angle and critical mo- ment. The same conclusion can be obtained from model B and model D. It is obvious that the nonlinearity of matrix HDPE plays a significant role in the bending performance of RTPs.
Based on the comprehensive analysis as mentioned above, the material nonlinearities of HDPE and TCP laminate both have some influence on the bending performance. In the current model, the nonlinearity of matrix HDPE has a greater impact on the result. This is mainly because that the elastic modulus of HDPE is much smaller than TCP laminate, and the volume ratio of HDPE in RTP structure is greater than TCP laminate. Besides that, the nonlinear material property of HDPE is much more obvious than TCP laminate.

S. Q. Wang et al.: Bending Mechanical of Nonlinear RTP Model 581
Buckling Buckling
(a) Model A (a) Model D Fig. 10. Deformation figures of RTP at the beginning of buckling.
500
max allowable stress/2
model A: HDPE lin; TCP lin model B: HDPE lin; TCP non model C: HDPE non; TCP lin model D: HDPE non; TCP non
400
300
200
100
00 0.5 1 1.5 2 2.5 3 3.5
Stre
ss (M
Pa)
Rotation (rad) Fig. 11. Stresses of models A-D in fiber direction.
When buckling started, the deformation pictures of model
A and model D are illustrated in Fig. 10. The ovality of RTP’s cross section increases with the grow of the applied rotation angle. When the pipe’s rotation angle reaches the critical angle, the cross section is squashed. Finally, the buckling occurs at the critical rotation angle.
From Fig. 10, it also can be seen that the critical angle of mo- del A is obviously larger than model D. Based on these results we can conclude that the critical moment and the critical angle of RTP can be overestimated if only the linear characteristics of the material are considered.
2) Strength Analysis
The MABR of RTP is also an important bending parameter for pipeline design. Before determining the MABR, the strength analysis should be accomplished. The strength criterion will be checked in the fiber direction, transverse direction of rein- forced layer, radial direction of reinforced layer and shear di- rection, respectively. Stresses in the TCP laminate are calculated and compared with its maximum allowable stresses to identify the laminate failure, as shown in Figs. 11-14. The failure of inner liner and outer cover are determined by the maximum al- lowable strain of the matrix HDPE, as shown in Fig. 15. Also shown in these figures are the maximum allowable stresses along the fiber direction, transverse direction and shear direction of TCP laminates, which are 800MPa, 40 MPa and 35 MPa, respectively.
model A: HDPE lin; TCP lin model B: HDPE lin; TCP non model C: HDPE non; TCP lin model D: HDPE non; TCP non
max allowable stress
100
80
60
40
20
00 0.5 1 1.5 2 2.5 3 3.5
Stre
ss (M
Pa)
Rotation (rad) Fig. 12. Stresses of models A-D in transverse direction.
model A: HDPE lin; TCP lin model B: HDPE lin; TCP non model C: HDPE non; TCP lin model D: HDPE non; TCP non max allowable stress/4
15
10
5
00 0.5 1 1.5 2 2.5 3 3.5
Stre
ss (M
Pa)
Rotation (rad) Fig. 13. Stresses of models A-D in radial direction.
model A: HDPE lin; TCP lin model B: HDPE lin; TCP non model C: HDPE non; TCP lin model D: HDPE non; TCP non
100
80
60
40
20
00 0.5 1 1.5 2 2.5 3 3.5
Stre
ss (M
Pa)
Rotation (rad)
max allowable stress
Fig. 14. Stresses of models A-D in shear direction.

582 Journal of Marine Science and Technology, Vol. 26, No. 4 (2018 )
Table 3. MABRs of different models.
Model A Model B Model C Model D
Critical Angle (rad) 1.90 2.38 1.84 2.15 MABR (mm) 1053 840 1086 930
model A: HDPE lin; TCP lin model B: HDPE lin; TCP non model C: HDPE non; TCP lin model D: HDPE non; TCP non
12%
10%
8%
6%
4%
2%
0%
Stre
ss (M
Pa)
0 0.5 1 1.5 2 2.5 3 3.5Rotation (rad)
max allowable strain
Fig. 15. Strains of HDPE in models A-D.
In addition, the ultimate strength in the radial direction is consi- dered the same as the transverse direction. The maximum allow- able strain of the HDPE is taken as 10% (Hartmann et al., 1986).
For model A, the critical rotation angle reaches 2.68 rad when the buckling occurs, as illustrated in Fig. 9. However, from Figs. 12 and 14, it can be found that the strength failure of TCP laminate has occurred in transverse direction and shear direction when the rotation angle arrives at 1.90 rad and 1.92 rad, re-spectively. Obviously, the RTP has failed before the buckling occurs. Therefore, the final critical rotation angle of model A is 1.90 rad. The strength of model C is very similar to model A. It is because that model C only considers the material nonlinearity of HDPE. However, the TCP laminate of RTP is the main load- bearing component. Therefore, the material nonlinearity of HDPE almost has no effect on the structure stress. In Fig. 9, the criti- cal angle of model C is 2.43 rad. Like model A, the TCP la- minate failure also occurs before buckling of RTP in Figs. 12 and 14. The final critical rotation angle of model C is 1.84 rad under pure bending load.
Due to the effects of material nonlinearities, the matrix ma- terial has better ductility, and the TCP laminates can avoid the brittle fracture easily during the loading process. All of the strength parameters of model B and model D in different directions meet the maximum allowable values, and their final critical ro- tation angles are 2.38 rad and 2.15 rad when the buckling occurs. Both of them are obviously greater than the critical angles of model A and D.
After the strength analysis and the buckling analysis, the final critical angles of the models A-D can be determined. Then the MABR can be computed by L/, where L is the length of RTP and ‘’ is the final critical angle. Table 3 shows MABRs of mo- dels A, B, C and D. The MABRs predicted by models A and C are 13.7% and 17.3% higher than model D, respectively. It is obvious that the important influence of the material nonlinearity of HDPE on the bending performance. The critical angle of
Dmax
Dmin
Fig. 16. Sketch map of cross-section with initial ovality.
model B is 9.67% less than model D, but its critical moment is much larger than model D, as shown in Fig. 9. Therefore, if the nonlinearities of HDPE and TCP laminate are not considered in model, the critical angle and critical moment will be under- estimated. It is obvious that the importance of the material non- linearities of HDPE and TCP laminate cannot be ignored. Es- pecially, the bending performance of RTP can be substantially improved by considering the material nonlinearity, and the cost in the process of transportation and installation can be signi- ficantly reduced.
2. Effects of Initial Ovality on the Bending Performance
In the manufacturing process, it is very difficult to keep the cross section of RTP in a perfect circular shape. The initial ovality shall be quantified for the RTP and taken into account in the buckling analysis. Especially, the effects of different initial ovalities shall be intensively studied during the reeling (Bai et al., 2016). The initial ovality can be defined by the inner diameter of RTP from the following equation:
max min
max min
D Do
D D
(6)
where Dmax and Dmin are the maximum diameter and the mini- mum diameter of the oval cross-section, respectively. The di- rection of bending moment is down the direction of Dmin. The sketch map of cross section of RTP is illustrated in Fig. 16.
In order to investigate the impact of the initial ovalities of RTPs, models with different initial ovalities are established, and these initial ovalities (o) are set to be 0, 0.005, 0.01, 0.02 and 0.05, respectively. Both the material nonlinearities of HDPE and TCP laminate are considered in these FE-models. Conducting similar analysis as mentioned above, the moment-rotation relationships could be obtained, as illustrated in Fig. 17.
From Fig. 17, one can see that the critical moments of RTP become smaller with the increasing initial ovalities. When the initial ovality is below 0.02, the critical moment and the cri- tical angle have negligible changes. When o arrives at 0.05, the critical angle has a little change, but the critical moment is significantly reduced. The critical moment decreases from 2650 KN*mm to 2420 KN*mm, reduced by 8.7%. In order to ensure
S. Q. Wang et al.: Bending Mechanical of Nonlinear RTP Model 583
3
2.5Δo = 0Δo = 0.005Δo = 0.01Δo = 0.02Δo = 0.05
1.5
2
2.6
2.42.51
0.5
00 0.5 1 1.5
2.12 2.14 2.16
local figure
2.18
2 2.5
Mom
ent (
N*m
m)
Rotation (rad)
× 106
× 106
Fig. 17. Moment-rotation curves with different initial ovalities.
2.4
2.3
2.2
2.1
2
1.9
2.4strengthfailure
strengthfailure
strengthfailure
strengthfailure
2.2
0.2 0.4 0.6 0.8 0.2 0.4Vf Vf
0.6 0.8
2
1.8
1.4Mom
ent (
N*m
m)
Rot
atio
n (r
ad)
1.6
1.2
1
× 106× 106
Fig. 18. Critical values of moment and rotation at different volume ratios of glass fiber.
the bending performance of RTP, it is necessary to keep the initial ovality within 0.02 in the process of manufacture.
3. Effects of Volume Ratio of Glass Fiber on the Bending Pperformance
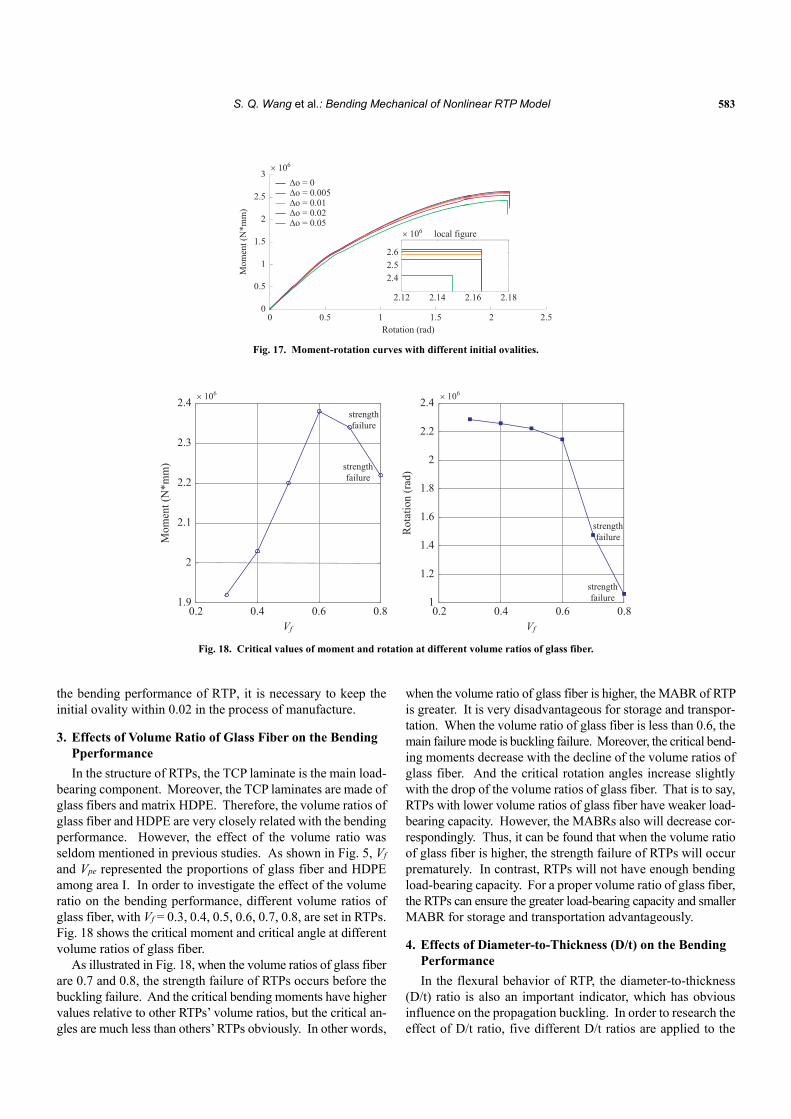
In the structure of RTPs, the TCP laminate is the main load- bearing component. Moreover, the TCP laminates are made of glass fibers and matrix HDPE. Therefore, the volume ratios of glass fiber and HDPE are very closely related with the bending performance. However, the effect of the volume ratio was seldom mentioned in previous studies. As shown in Fig. 5, Vf and Vpe represented the proportions of glass fiber and HDPE among area I. In order to investigate the effect of the volume ratio on the bending performance, different volume ratios of glass fiber, with Vf = 0.3, 0.4, 0.5, 0.6, 0.7, 0.8, are set in RTPs. Fig. 18 shows the critical moment and critical angle at different volume ratios of glass fiber.
As illustrated in Fig. 18, when the volume ratios of glass fiber are 0.7 and 0.8, the strength failure of RTPs occurs before the buckling failure. And the critical bending moments have higher values relative to other RTPs’ volume ratios, but the critical an- gles are much less than others’ RTPs obviously. In other words,
when the volume ratio of glass fiber is higher, the MABR of RTP is greater. It is very disadvantageous for storage and transpor- tation. When the volume ratio of glass fiber is less than 0.6, the main failure mode is buckling failure. Moreover, the critical bend- ing moments decrease with the decline of the volume ratios of glass fiber. And the critical rotation angles increase slightly with the drop of the volume ratios of glass fiber. That is to say, RTPs with lower volume ratios of glass fiber have weaker load- bearing capacity. However, the MABRs also will decrease cor- respondingly. Thus, it can be found that when the volume ratio of glass fiber is higher, the strength failure of RTPs will occur prematurely. In contrast, RTPs will not have enough bending load-bearing capacity. For a proper volume ratio of glass fiber, the RTPs can ensure the greater load-bearing capacity and smaller MABR for storage and transportation advantageously.
4. Effects of Diameter-to-Thickness (D/t) on the Bending Performance
In the flexural behavior of RTP, the diameter-to-thickness (D/t) ratio is also an important indicator, which has obvious influence on the propagation buckling. In order to research the effect of D/t ratio, five different D/t ratios are applied to the

584 Journal of Marine Science and Technology, Vol. 26, No. 4 (2018 )
6 D/t = 10D/t = 15D/t = 20D/t = 25D/t = 30
Structure failure
5
4
3
2
1
00 0.5 1 1.5 2 2.5
Mom
ent (
N*m
m)
Rotation (rad)
× 106
Fig. 19. Moment-rotation curves with different D/t ratios.
5000
4000
3000
2000
1000
010
D/tMABR (mm)
Simulating calculation
Empirical formula
50.80%47.19% 61.55%
68.85%
74.44%
15 20 25 30
Fig. 20. Comparison of MABRs from numerical simulation and empirical
equation.
models which are 10, 15, 20, 25 and 30, respectively. The thick- ness of RTP remains unchanged at 7.2 mm while the diameters of RTPs change correspondingly. Besides that, the nonlinearities of HDPE and TCP laminate are both considered in these mo- dels. Fig. 19 shows the relationship between moment and ro- tation angle under different D/t ratios.
When the D/t ratio is 10, it leads the structure of RTP to fail- ure in the shear direction before buckling occurs. It is because that a smaller D/t ratio would result in a serious squeeze defor-mation on the cross section of RTP. On the contrary, RTPs with other D/t ratios (15-30) buckle first. With the increase of the ra- tio, the curve's slope increases gradually. Meanwhile, the cri- tical moment grows and the critical angles decreases obviously.
In engineering practice, empirical equation is usually adopted to predict the MABRs. For comparing the differences of the re- sults between empirical equations and numerical simulation under different D/t ratios, the MABRs associated with five different D/t ratios (D/t =10, 15, 20, 25, 30) are computed and investi-gated. The results are illustrated in Fig. 20. The empirical Eq. (7) is used to predict the MABRs. From the empirical equation (Chapman et al., 2010), it can be found that the MABR has closely connected with the maximum allowable strain.
MABR2
Do
e (7)
5
4
3
2
1
00 0.5 1 1.5
angle 35angle 40angle 45angle 50
angle 55angle 60angle 65angle 70
2 22.5
Mom
ent (
N*m
m)
Rotation (rad)
× 106
Fig. 21. Moment-rotation curves with different angles.
where Do is the diameter of the outer cover of RTP and ‘e’ is the maximum allowable strain of matrix HDPE.
From Fig. 20, one can see the MABR of RTP increases with the growth of the D/t ratio. However, it is obvious that the de- viations between the values from empirical equation and nu-merical simulation increase gradually with greater D/t ratios. This demonstrates that as the diameter of the RTP increases, the buckling of the pipe occurs more easily. In addition, as the critical angles decrease rapidly, the MABRs from numerical models grow correspondingly. When the D/t ratio varies from 15 to 30, the value of deviation increases by 27.25% from 47.19% to 74.44%. It can be concluded that it is obviously inaccurate to evaluate the MABR with the empirical formula. The com- putation results of empirical formula are more dangerous than simulating results, especially for larger D/t ratios. It should adopt a more conservative formula to assess the MABR in engineer- ing practice.
5. Effects of Ply Angles of Filament Winding on the bending Performance
In the structure of RTP, the TCP laminate is the main load- bearing component, and it is made of filament winding. The TCP laminates often have different material properties with dif- ferent winding angles. It is necessary to have an investigation about the winding angle for better performance of RTP.
As mentioned above, the TCP laminate consists of 4 equal thickness layers stacking altogether with certain angles. In this section, the inner diameter and the thickness of the RTP are as- sumed to be 100 mm and 7.2 mm. In the models, the ply angles are set to be 35, 40, 45, 50, 55, 60, 65 and 70, respectively. The nonlinearities of HDPE and TCP laminate are taken into account in these models. Conducting the buckling analysis, the moment-rotation relationships are obtained and illustrated in Fig. 21. All RTPs have buckled before the structural failure occurs.
From Fig. 21, on one hand, with the increase of the winding angle, the deviations between different angles get decrease and the tendencies become more and more flat. On the other hand, as the winding angle increases, the difference between the cri- tical moments is extremely small. The greater winding angles strengthen the hoop stiffness and weaken the bending load-
S. Q. Wang et al.: Bending Mechanical of Nonlinear RTP Model 585
1200
1000
800
600
400
200
035 40 45 50 55
θPly Angle ( )
MA
BR
(mm
)
60 65 70
Fig. 22. MABRs with different ply angles.
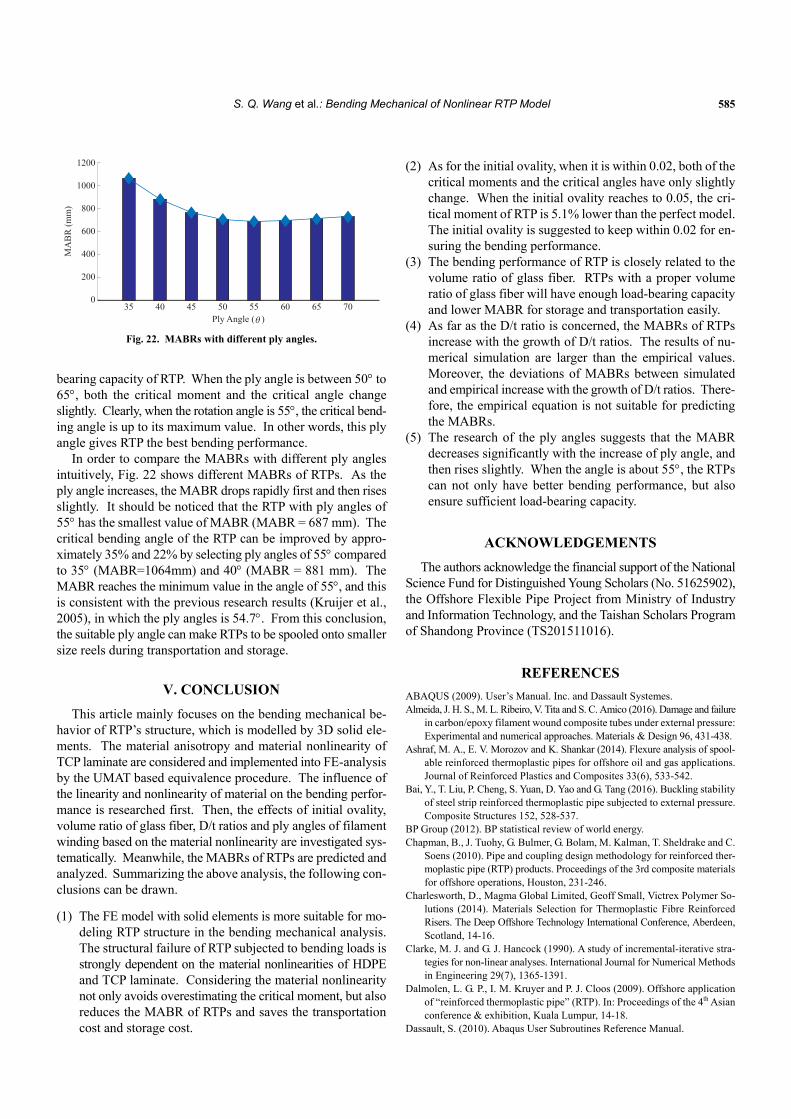
bearing capacity of RTP. When the ply angle is between 50 to 65, both the critical moment and the critical angle change slightly. Clearly, when the rotation angle is 55, the critical bend- ing angle is up to its maximum value. In other words, this ply angle gives RTP the best bending performance.
In order to compare the MABRs with different ply angles intuitively, Fig. 22 shows different MABRs of RTPs. As the ply angle increases, the MABR drops rapidly first and then rises slightly. It should be noticed that the RTP with ply angles of 55 has the smallest value of MABR (MABR = 687 mm). The critical bending angle of the RTP can be improved by appro- ximately 35% and 22% by selecting ply angles of 55 compared to 35 (MABR=1064mm) and 40 (MABR = 881 mm). The MABR reaches the minimum value in the angle of 55, and this is consistent with the previous research results (Kruijer et al., 2005), in which the ply angles is 54.7. From this conclusion, the suitable ply angle can make RTPs to be spooled onto smaller size reels during transportation and storage.
V. CONCLUSION
This article mainly focuses on the bending mechanical be- havior of RTP’s structure, which is modelled by 3D solid ele- ments. The material anisotropy and material nonlinearity of TCP laminate are considered and implemented into FE-analysis by the UMAT based equivalence procedure. The influence of the linearity and nonlinearity of material on the bending perfor- mance is researched first. Then, the effects of initial ovality, volume ratio of glass fiber, D/t ratios and ply angles of filament winding based on the material nonlinearity are investigated sys- tematically. Meanwhile, the MABRs of RTPs are predicted and analyzed. Summarizing the above analysis, the following con- clusions can be drawn.
(1) The FE model with solid elements is more suitable for mo-
deling RTP structure in the bending mechanical analysis. The structural failure of RTP subjected to bending loads is strongly dependent on the material nonlinearities of HDPE and TCP laminate. Considering the material nonlinearity not only avoids overestimating the critical moment, but also reduces the MABR of RTPs and saves the transportation cost and storage cost.
(2) As for the initial ovality, when it is within 0.02, both of the critical moments and the critical angles have only slightly change. When the initial ovality reaches to 0.05, the cri- tical moment of RTP is 5.1% lower than the perfect model. The initial ovality is suggested to keep within 0.02 for en- suring the bending performance.
(3) The bending performance of RTP is closely related to the volume ratio of glass fiber. RTPs with a proper volume ratio of glass fiber will have enough load-bearing capacity and lower MABR for storage and transportation easily.
(4) As far as the D/t ratio is concerned, the MABRs of RTPs increase with the growth of D/t ratios. The results of nu- merical simulation are larger than the empirical values. Moreover, the deviations of MABRs between simulated and empirical increase with the growth of D/t ratios. There- fore, the empirical equation is not suitable for predicting the MABRs.
(5) The research of the ply angles suggests that the MABR decreases significantly with the increase of ply angle, and then rises slightly. When the angle is about 55, the RTPs can not only have better bending performance, but also ensure sufficient load-bearing capacity.
ACKNOWLEDGEMENTS
The authors acknowledge the financial support of the National Science Fund for Distinguished Young Scholars (No. 51625902), the Offshore Flexible Pipe Project from Ministry of Industry and Information Technology, and the Taishan Scholars Program of Shandong Province (TS201511016).
REFERENCES
ABAQUS (2009). User’s Manual. Inc. and Dassault Systemes. Almeida, J. H. S., M. L. Ribeiro, V. Tita and S. C. Amico (2016). Damage and failure
in carbon/epoxy filament wound composite tubes under external pressure: Experimental and numerical approaches. Materials & Design 96, 431-438.
Ashraf, M. A., E. V. Morozov and K. Shankar (2014). Flexure analysis of spool- able reinforced thermoplastic pipes for offshore oil and gas applications. Journal of Reinforced Plastics and Composites 33(6), 533-542.
Bai, Y., T. Liu, P. Cheng, S. Yuan, D. Yao and G. Tang (2016). Buckling stability of steel strip reinforced thermoplastic pipe subjected to external pressure. Composite Structures 152, 528-537.
BP Group (2012). BP statistical review of world energy. Chapman, B., J. Tuohy, G. Bulmer, G. Bolam, M. Kalman, T. Sheldrake and C.
Soens (2010). Pipe and coupling design methodology for reinforced ther- moplastic pipe (RTP) products. Proceedings of the 3rd composite materials for offshore operations, Houston, 231-246.
Charlesworth, D., Magma Global Limited, Geoff Small, Victrex Polymer So- lutions (2014). Materials Selection for Thermoplastic Fibre Reinforced Risers. The Deep Offshore Technology International Conference, Aberdeen, Scotland, 14-16.
Clarke, M. J. and G. J. Hancock (1990). A study of incremental-iterative stra- tegies for non-linear analyses. International Journal for Numerical Methods in Engineering 29(7), 1365-1391.
Dalmolen, L. G. P., I. M. Kruyer and P. J. Cloos (2009). Offshore application of “reinforced thermoplastic pipe” (RTP). In: Proceedings of the 4th Asian conference & exhibition, Kuala Lumpur, 14-18.
Dassault, S. (2010). Abaqus User Subroutines Reference Manual.

586 Journal of Marine Science and Technology, Vol. 26, No. 4 (2018 )
De Kanter, J. L. C. G., J. Leijten and A. C. Tubulars (2009). Thermoplastic com- posite pipe: analysis and testing of a novel pipe system for oil & gas. Pro- ceedings of the 17th ICCM, 1-10.
Gehrke, W., A. Garcia, S. McKay and W. Christian (1996). Fortran 90 language guide. Computers in Physics 10(2), 135-136.
Gibson, A. G., C. Hicks, P. N. H. Wright and A. Fahrer (2000). Development of glass fibre reinforced polyethylene pipes for pressure applications. Plastics, rubber and composites 29(10), 509-519.
Hartmann, B., G. F. Lee and R. F. Cole (1986). Tensile yield in polyethylene. Polymer Engineering & Science 26(8), 554-559.
Kruijer, M. P., L. L. Warnet and R. Akkerman (2005). Analysis of the mecha- nical properties of a reinforced thermoplastic pipe (RTP). Composites Part A: Applied Science and Manufacturing 36(2), 291-300.
Kruijer, M. P., L. L. Warnet and R. Akkerman (2006). Modelling of the viscoe- lastic behaviour of steel reinforced thermoplastic pipes. Composites Part A: Applied Science and Manufacturing 37(2), 356-367.
Kyriakides, S., E. Corona, R. Madhavan and C. D. Babcock (1989). Pipe col- lapse under combined pressure, bending, and tension loads. Offshore Tech-
nology Conference, Houston. Kyriakides, S. and E. Corona (2007). Mechanics of offshore pipelines: volume 1
buckling and collapse (Vol. 1), Elsevier. Lesage, N., B. Weller and A. Sakr (2010). Using Reinforced Thermoplastic Pipe
(RTP) In Natural Gas Distribution Applications. Plastic Pipes XV Confer-ence, Vancouver, Canada.
Morland, K. and B. Weller (2014). The Use of Reinforced Thermoplastic Pipe (RTP) in Liquid Hydrocarbon Transfer: An Australian Case Study. The 15th Annual Middle East Corrosion Conference and Exhibition, Bahrain, Paper No. 14213.
Veritas, D. N. (2015). Thermoplastic composite pipes. Recommended Practice DNVGL-RP-F119.
Yu, K., E. V. Morozov, M. A. Ashraf and K. Shankar (2015). Analysis of flexural behaviour of reinforced thermoplastic pipes considering material nonlin-earity. Composite Structures 119, 385–393.
Zheng, J. Y., X. F. Lin and Y. B. Lu (2006). Stress analysis of plastic pipe re- inforced by cross helically wound steel wires. In Proceedings of Pressure Vessels and Piping Division Conference, Vancouver, Canada, 23-27.