beneficial use analysis of alum sludge from drinking-water
TRANSCRIPT

Page 1 of 31
Beneficial Use Analysis of Alum Sludge from Drinking-water Treatment Plants for
Portland Cement Manufacturing in Holly Hill, South Carolina
By
Adam Mims
April 25, 2017
Proposal Approved By:
____________________________________________
Prof. Dalia Patino Echeverri
Nicholas School of the Environment and Earth Sciences

Page 2 of 31
Disclaimer:
This 2018 student paper was prepared in partial completion of the graduation
requirements for the Master in Environmental Management at the Nicholas School of
the Environment at Duke University. The research, analysis, and recommendations
contained in this paper are the work of the student who authored the document, and
do not represent the official or unofficial views of the Nicholas School of the
Environment or of Duke University. The author may have relied in many instances on
data provided by different unpublished sources and cannot guarantee its accuracy.

Page 3 of 31
Table of Contents
Section 1 – Introduction 4
1. Trends and prospects in the production and utilization of CCRs and the need for exploring
alternative sources of needed materials for the cement industry. 6
2. Obtaining CCR-like materials from water-treatment plants 11
Section 2 – Alum Sludge Characteristics 13
1. Disposal Alternatives 14
2. Beneficial Use of Portland Cement 14
3. Other Uses of Waste in Portland Cement 16
Section 3 - Case study: Assessing the technical, economic feasibility of using aluminium sludge from
a water-treatment plant in SC in a local cement production facility 17
1. SC Water Treatment Plant 18
2. Alum Sludge Process from RWS and CWS 18
Section 4 - Case study: Assessing the environmental implications of using aluminium sludge from a
water-treatment plant in SC in a local cement production facility 19
1. Cost Benefit Analysis of Alum Sludge Disposal and Beneficial Use 21
2. Environmental Impacts 25
Section 5 – Lessons from Case Study 27
Section 6 - Final discussion on the viability of the use of alum sludge for Portland cement – general
insights from case study to the U.S. landscape and needs for future research 28
References 30

Page 4 of 31
1 Introduction
One way to reduce the negative environmental impacts of coal-fired electric power plants is
through beneficial use programs that support re-utilization of its solid waste streams, also known as coal
combustion residuals (CCRs). CCRs are captured and reprocessed for alternative utilizations such as
Portland Cement manufacturing or wallboard manufacturing. However, environmental and energy
regulations, natural gas prices, declining costs for renewables, tax incentives, and market developments
have resulted in retirements of coal-fired power generation capacity and in the associated reduction on the
production and capture of CCRs. These reductions in CCR availability come at the same time demand for
it is increasing. As developing countries industrialize and become more urban, overall demand for
construction materials such as cement and concrete increase. Reduction in CCRs for cement production
will continue as the electric power sectors transition to increased use of cleaner energy sources in an
effort to reduce carbon emissions to mitigate climate change impacts. As the sub-products of coal
combustion become more limited, the opportunity to explore the feasibility of using alternative materials
to support the cement industry’s needs appears.
This project explores the feasibility of using CCR-equivalent materials necessary to meet the
cement industry’s needs, from the waste generated at local water treatment facilities. It provides an
overview of the current and future needs for CCR-like materials and the availability of alum sludge from
water-treatment plants in the U.S. and, it assesses the technical and economic feasibility of this
alternative. In doing so it evaluates the potential of using alum-sludge for cement production both as a
source of a raw material whose supply is declining, and also as an alternative use of a by-product whose
disposal currently imposes economic costs to water-treatment plants.
This document is organized as follows: section 1 discusses the declining production of CCRs and
increasing need for cement raw materials; section 2 explores the availability of CCR-like materials in the
sludge of water treatment plants across the U.S.; section 3 describes a case study of a water –treatment
plant in S.C. and analyses in detail the technical and logistical challenges of using alum-sludge from the
RWS water treatment plant in Santee as a cement input to the Lafarge/Holcim facility; section 4 looks in

Page 5 of 31
detail at the economic implications; section 5 provides information that can later be used for estimating
the life cycle environmental impacts of beneficial use. This analysis takes a gate to grave approach,
looking at the energy, water and material requirements, and associated emissions to soil, water and air,
from the moment alum sludge is produced as a by-product of water treatment, to the moment it ends in a
landfill, or in a building. Section 6 provides recommendations for the companies involved and for public
decision makers in charge of environmental protection.
The work will follow these steps:
1. Portland Cement data collection and analysis: This data will be used to determine the
feasibility of using alum sludge as a raw material for Portland Cement manufacturing. This
will include listing and analysing all regulated metrics that Holcim must comply with under
ASTM (American Society for Testing and Materials) and DOT (Department of
Transportation) standards for concrete use. Information from testing from Holcim analytical
labs will be evaluated and compared to existing products for benefits and impacts.
2. Cost Benefit Analysis (CBA): The CBA will assess the costs and benefits of beneficial use of
alum sludge at RWS and Holcim. The costs will be based on a mean price derived from steps
one and two, converted into present value terms using an appropriate discount rate. The
benefits will factor into monetary terms in savings from foregoing landfill disposal tipping
fees and raw material procurement costs. The CBA will be carried out however long as each
facility is available and a sensitivity analysis will be applied to determine the relative impact
of increases in energy costs (fuel costs for transportation and furnace operation). The CBA
will show whether beneficial use can be cost effective for the RWS and Holcim. If the CBA
does not show any benefits, it will be necessary to consider other beneficial use options.

Page 6 of 31
1. Trends and prospects in the production and utilization of CCRs and the need for
exploring alternative sources of needed materials for the cement industry.
The United States Energy Information Administration (USEIA) provides outlooks on annual
energy production and consumption. It evaluates critical drivers and identifies uncertainties when making
projections1. Their evaluations of the energy markets include assumptions of macroeconomic growth,
world oil prices, technological progress, and energy policies1. It is important to note that these are
projections that are modelled of what may happen, not predictions of what will happen1. Its model for
energy consumption projects an increase by 5% between 2016 and 2040 as shown in Figure 11 from the
USEIA 2017 Annual Energy Outlook.
Figure 1 – Energy Consumption Varies Minimally Across All Annual Energy Outlook Cases1
When reviewing energy consumption by fuel mix, it shows a future of increased natural gas and
renewable energies and a decline in coal generation1. Figure 2 of USEIA’s 2017 Annual Energy Outlook
shows how coal is losing market share to natural gas and renewable energy generation, mainly in the
electric power sector1.

Page 7 of 31
Figure 2 – Fuel Mix of Energy Consumption1
The USEIA projects continued decline of coal generation in part caused by local, state and even
federal regulations (such as the Clean Power Plant CPP) limiting carbon emissions from electricity
producers1. As energy consumption increases, and coal-fired power plants are retired, alternative energy
sources such as natural gas and renewables may slowly displace coal and become the major resource for
the power generation fleet.
Given the USEIA projections for the future of coal-fired power generation, a key question
remains: how will this impact CCR generation and beneficial use markets such as cement manufacturing?
The American Coal Ash Association (ACCA) surveys CCR producers and marketers every year and
releases an annual report with information on production and utilization rates of each CCR2. The 15 year
production and use graph released by ACCA projects a reduction in fly ash but an increase in its
utilization as shown in Figure 32.

Page 8 of 31
Figure 3 – Fly Ash Production and proportion of Use 2
Since 2010, fly ash production has been decreasing steadily. Until year 2015, the proportion of
fly ash used for beneficial purposes stayed at less than 50% of that produced, but this proportion has
exhibited a growing trend, which if continued, would result in a deficit of this material. Indeed the
increases in proportional use of fly ash coincide with those reported by the USEIA at times when coal use
for electric power generation was replaced by natural gas and renewables.
A report by Caltrans Rock Products, focusing on concrete, dives deeper into the future of CCR
production and its availability. Responding to a fly ash shortage in the winter and spring of 2016,
Caltrans organized a committee to investigate fly ash shortages3. They noted in their executive summary
that the reason behind the shortfalls were the following: lower electric power demand due to
unseasonably warmer weather, seasonal shutdowns for large maintenance projects at coal-fired power
plants, economic shutdowns of coal-fired power plants due to lower electricity prices from natural gas
burning power plants, shutdowns of coal-fired power plants from environmental regulations, and large
snow volumes leading to an increased availability of hydro power3. The USEIA also noted the increase in
natural gas consumption and the decline in coal generation due to environmental regulations. The
Caltrans noted variability in scheduling and climate has reduced the need for coal fired generation due to

Page 9 of 31
lower cost alternatives for electricity generation, warmer winters that reduce residential electricity
demand, and an abundance of snowmelt that increases availability if low-cost, clean electricity from
hydroelectric dams 3. These factors continue to drive the current trend of reductions in coal use and CCR
production. The report also noted that due to the uncertainty in the timing and stringency of climate-
related regulations it is difficult to predict impacts of CO2 emissions rules on coal use and CCR
production. Existing rules such as the United States Environmental Protection Agency’s Mercury Air
Toxic Standards Rule (USEPA MATS) have already caused massive closures of coal-fired power plants3.
Also, having been issued before the CPP was stayed by the United States Supreme Court for judicial
review3, the Caltrans report looked at the effects of this rule and estimated a reduction of 400 million tons
on coal use during the period 2022-2030. Figure 4 provides an interesting energy outlook reviewing coal
supplies with and without the CPP that would greatly reduce the availability of CCRs.
Figure 4 – Coal Supply Region changes with CPP Implementation3

Page 10 of 31
According to the Caltrans’ analysis, CCRs that are not utilized for beneficial use are most likely
to be landfilled or sluiced to CCR impoundments for waste storage, and hence, reclaiming this waste for
posterior beneficial use requires additional handling, repurposing, and drying costs that can be high3.
Also, if the CCRs are not separated during disposal, this may make them unusable for particular
beneficial uses such as cement3. This also raises the alarm to prepare for future shortages and alternatives
to CCRs for cement manufacturing.
The United States Geological Survey (USGS) provides a mineral commodities summary for the
United States and global uses of a variety of minerals annually4. The section on cement in their 2017
outlook report shows an increase from 2012 to 2016 an 11 million metric ton increase as shown in Table
14.
Table 1 – USGS Cement Commodity Summary 2017 Report4
Salient Statistics - United States:a
2012 2013 2014 2015 2016
e
Production:
Portland and masonry cement
b
74,151 76,804 82,600 e83,700 85,400
Clinker
67,173 69,420 74,372 e76,000 77,000
Shipments to final customers, includes exports 79,951 83,187 90,070 93,340 96,300
Imports of hydraulic cement for consumption 6,107 6,289 7,584 10,376 12,000
Imports of clinker for consumption
786 806 720 942 1,700
Exports of hydraulic cement and clinker
1,749 1,670 1,397 1,294 1,100
Consumption, apparentc
77,900 81,800 89,200 e93,300 96,200
Price, average mill value, dollars per ton
89.50 95.00 100.50 e105.50 111.00
Stocks, cement, yearend
6,900 6,570 6,140 e5,600 5,700
Employment, mine and mill, numbere
10,500 10,300 10,000 10,000 9,500
Net import relianced as a percentage of apparent
consumption 7 7 8 11 13
eEstimated.
aPortland plus masonry cement unless otherwise noted; excludes Puerto Rico
bIncludes cement made from imported clinker
cProduction of cement (including from imported clinker) + imports (excluding clinker) - exports + adjustments for stock changes.
dDefined as imports (cement and clinker) - exports

Page 11 of 31
Reviewing Figure 4’s information, cement production is trending up. Notably, imports for
clinker are also increasing which coincides with the decrease in CCR production and availability as noted
by Caltrans’ report and the USEIA. CCRs such as fly ash are a substitute raw material for clinker
production. Imports can be expensive and can be limited on storage, transportation, and global politics.
Finding domestic alternatives to fly ash to supply the necessary raw materials to clinker cement, would
benefit the cement manufacturers, and would be a win-win for the economy and the environment.
2. Obtaining CCR-like materials from water-treatment plants
Water treatment plants that utilize aluminum sulfate may provide a source for coal ash
replacement. Their alum sludge waste can provide chemical substitutes to the fly ash found in CCRs.
The 2011 USEPA’s technical report on the management of drinking water treatment residuals listed a
number of water treatment plants and characteristics providing useful information for identifying potential
markets, determining logistical challenges, and assessing the economic viability of using their sludge as
an alternative to CCRs5. Figure 6 displays Table 7-1 from USEPA’s technical report provides sludge
volumes available based on water plant treatment flows.
Figure 6 – Typical Chemical Coagulation Sludge Volumes5
Page 12 of 31
Depending on the location, sludge may be available and a likely substitute for fly ash
replacement. According to Caltrans, the California market alone demands between 800,000 and 1.3
million tons of fly ash per year3. Hence, for this state, sludge may not be the sole provider of a viable
substitute, but it may mitigate shortages. However in South Carolina’s (SC) market, cement plants can
use a much smaller quantity; between 100,000 and 250,000 tons per year. The 10 largest water treatment
plants in South Carolina are producing about 565 million gallons per day (GPD) according to the South
Carolina Department of Natural Resources (SCDNR)6. Their production values for 2005 state an average
production rate of 310 million gallons per day (MGD) for the 10 largest water treatment plants which
would equate to an average sludge production between 231,000 and 473,000 gpd according to the
USEPA’s Typical Chemical Coagulation Sludge Volumes in Figure 66,7
. Depending on how cement
plants can utilize the water sludge waste in comparison to ash utilization, it may be possible for water
sludge waste to compensate 5% to 20% of its share. Assuming the gpd of the sludge generated contains
2% to 5% solids, the alum sludge available for cement use would be between 4,620 tons and 23,650 tons
annually if we were to extrapolate the % solids from the sludge production range for 310 MGD
produced.. More importantly, the SCDNR provides a map of the largest water treatment plants in South
Carolina which provides valuable information for exploring the availability and logistics of sludge
utilization 6. Figure 7 provided by SCDNR’s report displays the locations of South Carolina’s largest
public water supply systems.
Figure 7 – Public Water Supply Systems6

Page 13 of 31
2 Alum Sludge Characteristics
Alum sludge is classified as an industrial waste and is typically disposed at municipal landfills5.
The cost to dewater and transport the material is relatively low but the disposal fees are high7. Other
alternatives for alum sludge are agriculture land applications, land reclamation, sanitary land filling, and
incineration8. Land applications cause environmental concerns due to the large volumes of metals that
can leach out7. Also, extensive use may allow metals to impact groundwater tables
7. Incineration of

Page 14 of 31
sludge only removes the organic material and hence, the remaining inorganic materials must be captured
and handled8. Typically the inorganic material is captured and hauled to a landfill for disposal
8.
Historically, alum sludge disposal has been an important challenge to water-treatment facilities 5.
Besides its high handling and dewatering costs, it poses the risks of environmental violations and
corresponding fines 8. If not handled properly, it can violate storm water runoff permits which constitutes
a NPDES (National Pollution Discharge Elimination System) violation5.
According to the EPA, 1.48 million pounds of aluminum are discharged to water systems
primarily from coagulation/filtration plants5. Aluminum discharges can be toxic to the aquatic
environment impacting fresh water fish, invertebrates, bacteria, and algae at pH conditions less than 65.
Finding alternative disposal options such as beneficial use can alleviate the environmental
impacts caused by alum sludge.
1. Disposal Alternatives
Current disposal options allow for alum sludge to be disposed by incineration, landfilling, land
application, and aluminum extraction5. Each disposal alternative imposes handling requirements for the
water treatment plant and associated costs. Storing and handling the alum sludge can cause additional
costs and create unintended environmental consequences5, 8
. Landfilling the waste incurs transportation,
dewatering, chemical treatment, and tipping (landfill fees) costs5. Land application requires extensive
permitting, monitoring, and testing costs5. Incineration methods create environmental issues that need to
be handled with additional pollution prevention equipment along with additional handling and
transportation costs8. Extraction methods for aluminum require expensive retrofitting to existing
equipment and additional chemicals.
Identifying alternatives to alum sludge disposal can provide potential cost reductions and
benefits to water treatment plants.
2. Beneficial Use for Portland Cement
The manufacturing of Portland Cement utilizes several chemicals, with the primary components
being calcium, silicon, aluminum, and iron9. Table 2 from Northwestern University’s monograph offers a

Page 15 of 31
list of sources for each component. Table 3 from Northwestern University’s monograph provides a list of
weighted proportions for each component.
Table 2 - Examples of raw materials for Portland cement manufacture9
Calcium Silicon Aluminum Iron Limestone Clay Clay Clay
Marl Marl Shale Iron ore
Calcite Sand Fly ash Mill scale
Aragonite Shale Aluminum ore refuse Shale
Shale Fly ash Blast furnace dust
Sea Shells Rice hull ash
Cement kiln dust Slag
Table3 - Oxide Composition of Portland Cement9
Oxide Range (wt%) Cement #135 (wt%)
CaO 60.2 – 66.3 63.81
SiO2 18.6 – 23.4 21.45
Al2O3 2.4 – 6.3 4.45
Fe2O3 1.3 – 6.1 3.07
MgO 0.6 – 4.8 2.42
P2O5 -- 0.11
TiO2 -- 0.22
Na2O 0.05 – 1.20
(Na2O equiv)
0.20
K2O 0.83
SO3 1.7 – 4.6 2.46
Loss on Ignition -- 0.81
Insoluble residue -- 0.16
Free CaO -- 0.64
The Portland Cement manufacturing process blends these chemicals into a composited raw feed10
.
Depending on the source, the material is ground and conveyed into the furnace10
. The furnace burns off
moisture and other elements to form a new substance called clinker10
. The clinker is then released to be

Page 16 of 31
cooled and grounded further10
. Additional chemicals are added at the final stage to produce a fine
material for concrete use10
.
Alum sludge has the ability to provide multiple chemicals to the cement process. It is composed of
primarily aluminium, silicon, and iron as listed5. Table 4 highlights an x-ray diffraction analysis of the
alum sludge in question and their highest % results.
Table 4 – XRD of Alum Sludge Provided by Regional Water System
Element *Concentration (%)
Aluminum 39.35
Silicon 31.26
Iron 24.35
Sulfur 1.385
Titanium 0.8168
Phosphorus 0.6058
*Additional elements below 0.5% were not listed
3. Other Uses of Waste in Cement Plants
The International Finance Corporation (IFC), a part of the World Bank Group, has a report
focusing on increasing the use of alternative fuels at cement plants and provides a best practice with case
study examples11
. The IFC discusses the need for cement in current and emerging development
throughout the world as well as the emission challenges associated with its production11
. Part of their
recommendations focus solely on utilizing alternative fuels that can reduce the need for current fossil fuel
choices such as coal and oil11
. Alternative fuel recommendations include municipal waste, biomass, non-
hazardous industrial and commercial waste, and other unclassified alternative fuels11
. Lafarge/Holcim
currently utilizes alternative fuels in these areas to reduce emissions and maximize their operational
benefits. Figure 8 from the IFC report provides an example of what Lafarge/Holcim and other cement
plants have been utilizing.

Page 17 of 31
Figure 8 – Alternative Fuels Utilized by Large Cement Plant18
Cement plants globally have been utilizing alternative methods to fuel and feed their
manufacturing processes to compete efficiently and economically. Evaluating a similar opportunity in
South Carolina will provide additional information to support the need to continue to be flexible and
forward thinking in Portland cement manufacturing.
3 Case study: Assessing the technical, economic feasibility of using aluminium sludge
from a water-treatment plant in SC in a local cement production facility
The trending reduction in coal generation and CCR’s, the increase in demand for fly ash in
cement production, and the growing need for substitutes opens the opportunity for a potential substitute
through water treatment plants. Evaluating the sludge characteristics, location, logistics, technical
viability, and long term economics will provide useful information to propose a solution for a growing
market with a diminishing supply source. We will review these dynamics in the context of a case study in
SC where we evaluate the feasibility of using alum sludge from a water plant in Berkeley S.C in a local
cement plant in Dorchester/Orangeburg S.C. This analysis seeks to shed light on the following questions:
Is utilizing alum sludge at the local cement production facility, Lafarge/Holcim, technically viable? Can

Page 18 of 31
this waste be used as a component in their cement in a way that allows Lafarge/Holcim to continue
meeting concrete standards, and manage increased furnace operations and raw material management? Can
the local water-treatment plant RWS provide alum sludge with consistent chemical characteristics as
required by Lafarge/Holcim?
1. SC Water treatment plant
The Regional Water System (RWS) located in Moncks Corner, South Carolina (Moultrie Plant)
and Santee, South Carolina (Marion Plant) provides over 40 million gallons per day of clean drinking
water to over 160,000 customers12
. As each gallon of water is treated with aluminium sulfate, alum
sludge is produced. Properly disposing of this sludge requires a multi-step process that generates
economic costs for the RWS and also for the neighbouring Charleston Water System (CWS). The CWS
produces almost three times as much aluminium sludge as RWS and it operates to supply 114 million
gallons of drinking water13
to its customers. As stated in the introduction, this Masters Project analyses an
alternative to both lower the disposal costs of aluminium sludge and its impacts to the environment from
RWS and CWS: utilizing the resulting alum waste into the production of Portland Cement.
2. Alum Sludge Process from RWS and CWS
At the RWS, the alum sludge is mechanically transported to a thickener where it is stored and
prepared for dewatering. After the water is physically removed, the remaining solid waste is conveyed
outside to a concrete pad where it stays until ready for transport. The material is then loaded into an 18
wheel truck and trailer for disposal at a class 3 landfill located in Cross, South Carolina. Each step in
handling the waste increases the cost of the RWS overall operations.
A few miles down the road the Charleston Water System also utilizes aluminum sulfate. Instead
of using an internal landfill, the alum sludge waste is transported to the Berkeley County Municipal Solid
Waste Landfill. The Charleston Water Systems pays for the waste dewatering and handling,
transportation, and tipping fees for each ton produced. The tipping fees alone are $65 per ton14
. For a

Page 19 of 31
production of 15,000 tons of alum sludge annually, there is a total of $975,000 just in tipping fees. This
does not include dewatering and handling costs or the transportation costs.
Lafarge/Holcim Cement located in Holly Hill, SC has agreed to test the alum sludge as another
source for its raw feed material needs15
. They currently utilize various sources of waste for both raw feed
materials and alternative fuels15
.
Because alum sludge is a new source for Holcim a rigorous process of testing and trials is
necessary to ensure the sludge moisture, odour and other characteristic are compatible with the cement
production process. It is known that the sludge’s large moisture content will impact the efficiency of the
furnaces. Also, the sludge has an odour that may or may not be transferred to the final product and has
other biological characteristics that may impact handling methods and employee health. Finally, to
ensure efficiency and quality of the cement manufacturing process, the chemical composition of sludge
needs to stay consistent to avoid affecting raw feed blends and ensuring compliance with the regulated
standards for cement in concrete utilization.
4 Case study: Assessing the environmental implications of using aluminium sludge from a
water-treatment plant in SC in a local cement production facility
This section presents estimates of the potential environmental benefits, costs and risks of utilizing
the alum sludge at Holcim, taking into account that transportation costs and associated emissions from
RWS will increase if sludge is hauled to Holcim instead of taken to the landfill located in Cross, SC.
The Lafarge/Holcim’s cement plant in Holly Hill, SC which includes a 12-foot diameter wet kiln
and two small finish mills16
was constructed in 1966. In 2003, the old plant was demolished and a new
plant was constructed consisting of a new preheater/pre-calciner kiln and associated crushing, storage,
and grinding equipment16
. After the new equipment and plant construction upgrades the plant is capable
of producing 2.2 million metric tons a year 16
. The plant recycles alternative raw materials and fuels such
as hazardous liquid waste and can recycle more than 400,000 tons of material per year16
. It incorporates

Page 20 of 31
fuel blending and storage systems and maintains capacity for loading and unloading tankers and railcars16
.
Additionally it utilizes ancillary processing equipment such as grinders and pumps to handle the
alternative raw materials and fuels16
. The plant is a suitable partner in evaluating the aluminium sludge
waste material from the RWS in assessing its characteristics for Portland Cement production. The plant
currently utilizes fly ash wastes recovered from ash impoundments, mill scale from steel producers, and
recycled used oil from local collection centers. Their expertise would provide additional benefits in
handling and evaluating the waste as a possible alternative raw material.
The plant at maximum output can utilize 400 tons of raw material feed per hour. Typically, the
plant replaces about 40% of the raw material with an alternative material such as fly ash and mill scale
depending on their chemical needs. This equates to about 160 tons per hour of the raw feed containing
alternative materials, or 1.4 million tons per year assuming 24 hours of operations, 7 days a week. As it
will be discussed below, this implies that the plant has a processing capacity of alternative materials that
exceeds by more than 300 times the quantity of alum sludge being generated at the RWS.
The alum sludge generated in 2017 was stored and prepared for loading to be disposed of as
normal operations in a class 3 landfill. Approximately 2,500 tons were disposed and 107 tons were
utilized for the trial by Lafarge/Holcim. Two trials were executed on July 24, 2017 and November 6,
2017. The first trial utilized 19.09 tons and the second trial utilized 88.54 tons total. The trials were
documented by Lafarge/Holcim personnel, who provided the information contained in this analysis.
The first trial utilized only 5% of total alternative material raw feed. It was blended in with other
alternative materials such as fly ash and fed into the kiln for clinker formation. During the trial, no
negative impacts were observed during handling and kiln feeding. The end product also showed no signs
of negative or positive impacts to structural and chemical characteristics.
The 2nd
trial utilized over 20% of the alternative raw material feed which caused severe
difficulties. The alum sludge was wet and did not blend well with the other alternative materials. It was
also difficult to handle with blending equipment and employees complained of an unpleasant odour. The
material once blended also impacted kiln feed processes, affected intermediate production outputs and

Page 21 of 31
furnace effectiveness for clinker formation. However, despite the difficulties handling and processing
resulting from adding sludge, the final product was not impacted negatively or positively by the increased
blend. Table 5 highlights the impacts of the alum sludge material during the two trials.
Table 5 – Alum Sludge Impacts during Trial
Raw Feed Blend 5% 20%
Handling No impact Negative impact – high moisture
Kiln Feed No impact Negative impact – feed rate slowed, heat rate
reduced (required additional energy)
Odour No observation Observed – nauseating
Feed Blending No impact Negative Impact – increased activity
A third trial is scheduled for May, 2018 after the plants’ scheduled maintenance outage and after
an evaluation of the initial results of the prior alum sludge feed blending experiments. However, the trial
was postponed until May due to recent rainfall events delaying dry use of the alum sludge. A raw feed
blend between 5% and 20% will be targeted to reduce handling, kiln feed, and feed blending impacts as
well as physiological impacts from the odour. Also, special attention will be paid to the effects of rainfall
and inclement weather on the alum sludge material given that the RWS does not currently cover this
material once dewatered. It is expected that increased moisture from any rainfall will increase the
difficulty of incorporating the alum sludge in the process. Prior to the second trial, a rainfall event prior
to delivery of material to Lafarge/Holcim added additional moisture that may have led to the observed
negative impacts.
1. Cost Benefit Analysis of Alum Sludge Disposal and Beneficial Use
After review of the trials from a handling and operational perspective, information regarding
costs for disposal, transportation, beneficiation fees, loading, and budgets were compiled to evaluate the
costs/benefits of the potential use of alum sludge as an alternative material for Portland Cement
manufacturing. All information in regards to this analysis was provided by both Lafarge/Holcim and the

Page 22 of 31
RWS. Currently, the RWS disposes of all alum sludge waste at a class 3 landfill located in Pineville, SC.
The RWS will also pay costs associated with loading and hauling that vary based on fuel costs and
equipment used which are outlined in Table 6.
Table 6 – Cost of disposal of Alum Sludge
Activity Cost $/ton
Loading $1.00 - $1.50
Transportation – Open Trailer Freight Truck –
Diesel Fuel
$4.00 - $5.00
Disposal Fee (includes placement, handling, and
construction)
$14.00
Total $19.00 - $20.50
The RWS disposed over 2,500 tons of alum sludge in 2017. Based on the costs listed in Table 5,
the total cost for disposal is over $47,500. In 2016, over 3,600 tons were disposed at a cost over $68,400.
Depending on the RWS sludge production volumes; they can plan to expect disposal costs between
$47,000 and $68,000 annually. The current forecast for water sales is listed in the Table 7 for the next 3
years.
Table 7 – RWS Observed and Forecasted Annual Water Sales in millions of gallons (MG)
Year 2016 2017 2018 2019 2020
Moultrie 6,856 6,807 7,289 7,625 7,953
Marion 299 321 310 683 883
Total 7,155 7,128 7,599 8,307. 8,837
The RWS thickens and dewaters the sludge to produce the alum sludge with lower moisture
levels and higher solids concentrations. The proportion of solids in the RWS alum sludge is on average ~
4E-07
%. Hence, based on the RWS 2016 and 2017 production data, it is possible to estimate the volume
of sludge that will be generated in future years. Based on the 2016 and 2017 sludge production volumes,
we estimated the sludge production per gallon of water sold which was 3E-07
% in 2016 and 5E-07
% in
2017. These values was then used in combination with the forecast of water sales to estimate expected

Page 23 of 31
sludge volumes as a range from lowest and highest production volumes. The forecasted sales are
increasing each year and so will the sludge production. Table 8 displays the estimates of sludge volumes
and associated disposal costs for each year. Disposal costs were set at $19 - $20.50 per ton.
Table 8 –Observed and Forecasted Sludge Production Volumes and Annual Disposal Costs 2016 -
2020
Year 2016(1)
2017(1)
2018(2)
2019(2)
2020(2)
Sludge
Produced
(ton)
3,681 2,611 2,784 – 3,910 3,043 – 4,275 3,064 – 4,305
Disposal Cost
$19
$69,951 $49,618 $52,895 -
$74,297
$57,824 -
$81,220
$$58,235 -
$81,798
Disposal Cost
$20.50
$75,473 $53,535 $57,071 -
$80,163
$62,389 -
$87,632
$62,832 –
$88,255
(1) Volumes and costs for 2016 and 2017 are as reported by the RWS5 (ref)
(2) Projections of volume and costs for years 2018-2020 are obtained based on the forecasted water volumes produced by the RWS in those years and the assumption
that the sludge production rate per gallon of water observed in 2016 and 2017 will remain unchanged
The net present value of the cost range for the 3 years of the forecast assuming a 5% discount rate
is $153,129 - $215,088 at $19/ton and $165,219 - $232,068 at $20.50 per ton.
If Lafarge/Holcim were to utilize 100% of the alum sludge produced annually (not replacing 40%
of the raw feed material at one time but instead using lower proportions throughout the year), the RWS
would avoid the cost of disposal of this material in a landfill. Instead, the RWS would incur the costs
associated with beneficial use of alum sludge for Portland Cement which includes loading, transportation,
and a beneficial use fees presented in Table 9.
Table 9 – Beneficial Use Cost per Activity for Portland Cement Manufacturing
Activity Cost $/ton
Loading $1.00 - $1.50
Transportation – Open Trailer Freight Truck -
Diesel Fuel
$6.15 - $7.15
Beneficial Use Fee $2.60

Page 24 of 31
Total $9.75 - $11.10
The beneficial use option removes the landfilling disposal cost of $14 and replaces it with a
beneficial use fee of $2.60, resulting in savings of $11.40 per ton for the RWS. Because the
transportation costs associated to beneficial use are $2.15/ton - $3.15 higher than the transportation costs
to the landfill the net savings for the RWS are $9.25 - $10.25 per ton. Table 10 presents the total RWS
sludge disposal costs associated to beneficial use. Assuming a discount rate of 5%, the costs for the three
year period 2018-2020 is estimated to be $78,580 - $110,374 at $9.75 per ton and $89,460 - $125,657 at
$11.10/ton.
Table 10 – Estimated Annual cost of Beneficial Use of all Alum Sludge produced 2016 – 2020
Year 2016 2017 2018 2019 2020
Beneficial Use
Cost $9.75
$35,896 $25,462 $27,143-
$38,126
$29,673 -
$41,679
$29,884 -
$41,975
Beneficial Use
Cost $11.10
$40,498 $28,726 $30,902 -
$43,405
$33,781 -
$47,450
$34,021 -
$47,787
The difference in annual costs between the two alum sludge disposal options is presented on
Table 11
Table 11 – Estimated Total Annual Savings from Beneficial Use 2016-2020
Year 2016 2017 2018 2019 2020
Disposal
$19.20
$69,951 $49,618 $52,895 -
$74,297
$57,824 -
$81,220
$$58,235 -
$81,798
Disposal
$20.50
$75,473 $53,535 $57,071 -
$80,163
$62,389 -
$87,632
$62,832 –
$88,255
Beneficial Use $35,896 $25,462 $27,143- $29,673 - $29,884 -
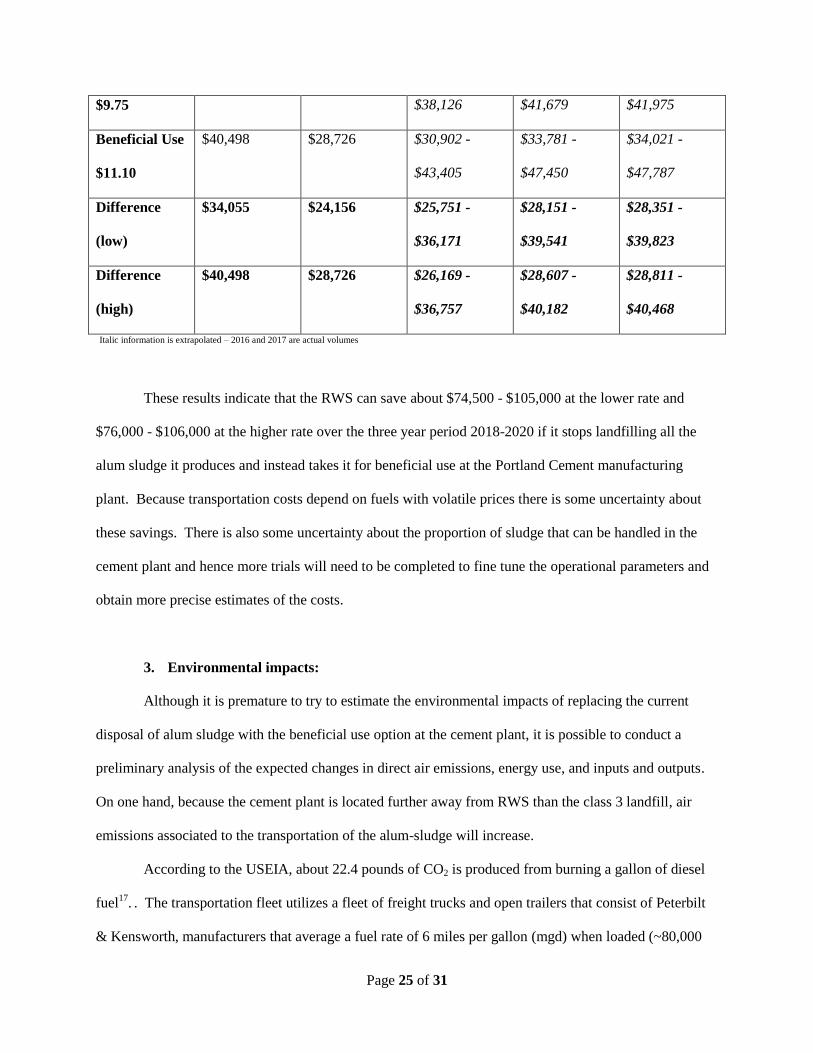
Page 25 of 31
$9.75 $38,126 $41,679 $41,975
Beneficial Use
$11.10
$40,498 $28,726 $30,902 -
$43,405
$33,781 -
$47,450
$34,021 -
$47,787
Difference
(low)
$34,055 $24,156 $25,751 -
$36,171
$28,151 -
$39,541
$28,351 -
$39,823
Difference
(high)
$40,498 $28,726 $26,169 -
$36,757
$28,607 -
$40,182
$28,811 -
$40,468
Italic information is extrapolated – 2016 and 2017 are actual volumes
These results indicate that the RWS can save about $74,500 - $105,000 at the lower rate and
$76,000 - $106,000 at the higher rate over the three year period 2018-2020 if it stops landfilling all the
alum sludge it produces and instead takes it for beneficial use at the Portland Cement manufacturing
plant. Because transportation costs depend on fuels with volatile prices there is some uncertainty about
these savings. There is also some uncertainty about the proportion of sludge that can be handled in the
cement plant and hence more trials will need to be completed to fine tune the operational parameters and
obtain more precise estimates of the costs.
3. Environmental impacts:
Although it is premature to try to estimate the environmental impacts of replacing the current
disposal of alum sludge with the beneficial use option at the cement plant, it is possible to conduct a
preliminary analysis of the expected changes in direct air emissions, energy use, and inputs and outputs.
On one hand, because the cement plant is located further away from RWS than the class 3 landfill, air
emissions associated to the transportation of the alum-sludge will increase.
According to the USEIA, about 22.4 pounds of CO2 is produced from burning a gallon of diesel
fuel17
. . The transportation fleet utilizes a fleet of freight trucks and open trailers that consist of Peterbilt
& Kensworth, manufacturers that average a fuel rate of 6 miles per gallon (mgd) when loaded (~80,000

Page 26 of 31
pounds) and 7.5 miles per gallon(mgd) when empty (~30,000 pounds) according to the RWS haulers. The
distance to the cement plant is 34.2 miles and to the landfill is 25.2 miles. With the loaded freight, the
trip to the landfill will consume 4.2 gallons of diesel and the trip to the cement plant will consume 5.7
gallons of diesel. With each gallon of diesel consumed, the trip to the landfill will produce 94.08 pounds
of CO2 and the trip to the cement plant will produce 126.93 pounds of CO2. The load to the cement plant
will emit 0.063 tons of CO2 and the load to the landfill will emit 0.047 tons of CO2. However the
additional mileage in hauling is minimal and hence the increase in air emission are estimated as 0.016
tons or 32.85 pounds per loaded delivery. Similarly, energy use at the cement manufacturing plant may
increase if alum sludge is particularly moist, but this cannot be estimated without more trials.
On the other hand, depending on the volume of alternative materials that alum sludge will
displace, there may be a net reduction in environmental impacts (due to reduced need for mining raw
materials for cement). Currently, the materials used are clay, marl, sand, shale, fly ash, aluminium ore
refuse, iron ore, mill scale, bauxite, and blast furnace dust. If alum sludge displaced any of these
materials, environmental emissions associated with its excavation, mining, milling, processing, screening,
dewatering, grinding, drying, production, and transportation would be eliminated or reduced. For
example, according to the International Aluminum Institute, bauxite mining on average emits 100 kg of
CO2 per ton of bauxite ore18
. If the bauxite is mined 50 miles away and a 23 ton load is shipped to the
cement plant, it would emit 2.54 tons of CO2 for the mining activities and an additional 0.093 tons in
transportation for a total of 2.633 tons. However, utilizing alum sludge would only emit 0.063 tons of
CO2 and reduce or remove the bauxite emissions impact per 23 ton load shipped.
Also, the beneficial use option also eliminates the need for disposal of alum sludge in the class 3
landfill and hence may result in the potential reduction of methane and other emissions, but this depends
on the conditions at the cement kiln, which are not known without further trials. A full environmental
lifecycle assessment can be conducted once the trials at the Lafarge/Holcim plant determine the changes
in the operating conditions for different blending rates of alum sludge. Table 12 summarizes the pros
and cons of beneficial use.

Page 27 of 31
Table 12 – Alum Sludge Beneficial Use Pros and Cons
Activity Beneficial Use Landfill Disposal Comments
Reduces Water
Treatment Costs
X
Reduces Cement Mining
Operations and
Environmental Impacts
X Additional trials to verify how
much raw material is replaced to
calculate additional
environmental savings
Eliminates Environmental
Impacts to Water from
runoff
X X
Reduces Costs of
Cement’s production
process
X Additional trials needed to verify
net reduction in costs
Increases CO2 Emissions
from Cement’s
production process
X Possibly if moisture is too high
and forces plant to use more fossil
fuel
.
5 Lessons from case study.
The case study provided significant information for operational and cost/benefit analysis for the
cement plant and the RWS. The cement plant is still investigating the possibility of using alum sludge as
a component of the alternative raw material. Before committing to this transition it will conduct further
trials to ensure chemical consistency and to secure the required volumes to fulfil their production needs.
Once the cement plant has identified their alternative raw material feed blend, further investigations into
cost and benefits as well as emissions can be considered.
Based on the results obtained so far, I recommend conducting further trials to replicate initial
results trying to isolate the effects of variables such as increased moisture from rain fall. This is a
variable that can be controlled by the water-treatment plant, by covering the sludge, as it will be
recommended below. Additionally, I suggest evaluating the possibility of using material from other water
treatment plants such as the CWS. Testing the use of larger volumes of material may provide new
information than that provided by the small volume trials we have reviewed. Finally, I recommend
exploring the possibility of disposing of the aqueous waste –resulting from sludge dewatering in the same

Page 28 of 31
ways highlighted in the IFC report mentioned in section 2 above. According to the IFC, the material in
water form can be injected into the kiln through mixer injectors to help lower the thermal nitrogen oxides
produced11
.
The RWS stands to benefit economically from the beneficial use option of alum sludge. The cost
difference between the two options (disposing and beneficial use) is significant and an incentive for
supporting any necessary additional trials for success. Removing almost half the disposal cost provides
additional funds for the RWS to utilize elsewhere. I would recommend the RWS to continue to support
the trials and provide all alum sludge production to the cement plant for continued testing and
observations. I would also recommend the RWS to assess alternatives to cover dewatered alum sludge to
prevent increased moisture from rainfall and the associated increase in handling and processing costs.
This may reduce additional drying gains during warm weather with direct contact from sunlight but will
facilitate handling and blending operations in the cement plant and increase the chances of adoption of the
beneficial use alternative.
Importantly, for both participants, completing an environmental life cycle assessment will
provide vital information for understanding the impacts of each operation and disposal practices. This
will put both companies in a better position to face new and more stringent environmental regulations that
could be enacted in the near future for cement production and disposal practices.
6 Final discussion on the viability of the use of alum sludge for Portland cement – general
insights from case study to the U.S. landscape and needs for future research
The viability of the use of alum sludge for Portland cement is promising as demonstrated by the
case study discussed in this document and by the interest expressed by other countries that have been
reviewing multiple options for alternative fuels and raw material feeds, as documented in the IFC report.

Page 29 of 31
Lafarge Canada has recently partnered with Metro Vancouver to accept water filtration residuals
to be used as alternative materials for cement manufacturing19
. This deal was reported in August 2017 the
plant has committed to utilize 10,000 tons of the residuals which are avoiding the mining of 2,100 tons of
virgin materials19
. Lafarge run trials during May 2017 to evaluate the handling and blending
opportunities19
. The plant plans to produce residual added concrete which will help Lafarge/Holcim meet
its Global 2030 Sustainability Plan19
.
The most important aspect will be creating partnerships with water treatment utilities that are in
need of solutions for their disposal activities. The need for clean drinking water will continue to grow as
the population grows and parts of the world continue to develop. Cement is going to play a vital role in
supporting that development and water is necessary to maintain life and health. The partnership between
these two processes will be vital as humanity continues to deal with emissions impacting the planet’s
climate and environment. As we move to cleaner energy sources, cement’s raw material supply will
diminish and the water treatment sector has an opportunity to replace a good portion of their demand.

Page 30 of 31
References
1U.S. Energy Information Administration. (2017). “Annual Energy Outlook 2017 with projections to
2050.” EIA. Retrieved from https://www.eia.gov/outlooks/aeo/pdf/0383%282017%29.pdf
2American Coal Ash Association. (2015). “2015 Survey Results.” ACAA. Retrieved from
https://www.acaa-usa.org/Portals/9/Files/PDFs/2015-Survey_Results_Charts.pdf
3California Department of Transportation. (2017). “Fly Ash Current and Future Supply: A Joint Effort
Between Concrete Task Group of the Caltrans Rock Products Committee and Industry.” Office of
Structural Minerals. Retrieved from
http://www.dot.ca.gov/hq/esc/Translab/OSM/rpc_concrete_task_group/documents/Fly_Ash_Curr
ent_and_Future_Supply_Report_2016.pdf
4United States Geological Survey. (2017). “Mineral Commodity Summaries 2017.” USGS. Retrieved
from https://minerals.usgs.gov/minerals/pubs/mcs/2017/mcs2017.pdf
5EPA. (2011). Drinking Water Treatment Plant Residuals Management Technical Report. EPA.
Retrieved from https://www.epa.gov/sites/production/files/2015-11/documents/dw-treatment-
residuals-mgmt-tech-report-sept-2011.pdf
6State of South Carolina Department of Natural Resources. (2005). “The 100 Largest Public Water
Supplies in South Carolina – 2005.” SCDNR. Retrieved from
http://www.dnr.sc.gov/water/admin/pubs/pdfs/Report37Largestusers.pdf
7Townsend, T. G., Jang, Y.-C., Jain, P., & Tolaymat, T. (2001). Characterization of Drinking Water
Sludges for Beneficial Reuse and Disposal. Gainesville: Florida Center for Solid and Hazardous
Waste Management. Retrieved from
http://www.dep.state.fl.us/waste/quick_topics/publications/shw/solid_waste/DrinkingWaterSludg
eCharacterization.pdf
8Schroeder, W. H., & Cohen, D. B. (1975). Sludge Inciniration and Precipitant Recovery. Ontario:
Queen's Printer. Retrieved from https://archive.org/details/sludgeincinerati03schr

Page 31 of 31
9Northwestern University. “Cement.” Retrieved March 6, 2017, from
http://iti.northwestern.edu/cement/monograph/Monograph3_3.html
10Portland Cement Association. “Cement Concrete Basics.” Retrieved March 6, 2017, from
http://www.cement.org/cement-concrete-basics/how-cement-is-made
11International Finance Corporation. “Increasing the Use of Alternative Fuels at Cement Plants:
International Best Practice.” Retrieved February 8, 2018, from
https://www.ifc.org/wps/wcm/connect/bb652356-1d43-4421-b7eb-
e0034d8d6b8f/Alternative+Fuels_06+27.pdf?MOD=AJPERES
12Santee Cooper. “Committed to South Carolina.” Retrieved October 22, 2016, from
https://www.santeecooper.com/committed-to-south-carolina/regional-water-system.aspx
13Charleston Water. “What We Do.” Retrieved October 30, 2016, from
http://www.charlestonwater.com/139/What-We-Do
14Berkeley County Waste and Sanitation Authority. “Solid Waste Fees.” Retrieved October 30, 2016,
from http://www.bcwsa.com/solid-waste-fees
15Holcim. “Sustainable Development.” Retrieved March 6, 2017, from http://www.holcim.us/sustainable-
development/alternative-fuels-raw-materials.html
16LafargeHolcim. “Holcim (US) Holly Hill Cement Plant Fact Sheet.” Retreived February 8, 2018, from
https://www.lafargeholcim.us/sites/us/files/atoms/files/holly_hill_fact_sheet_final.pdf
17United States Energy Information Administration. “How much carbon dioxide is produced from
burning gasoline and diesel fuel?.” Retrieved April 9, 2018, from
https://www.eia.gov/tools/faqs/faq.php?id=307&t=11
18The International Aluminum Institute. “Responsible Sourcing.” Retrieved March 11, 2018, from
http://bauxite.world-aluminium.org/mining/responsible-sourcing.html
19Durability and Design. “Canadian Companies to Use Waste in Cement.” Retrieved February 8, 2018
from http://www.durabilityanddesign.com/news/?fuseaction=view&id=17178