beneficiaries of market downcycle -...
TRANSCRIPT

Market Insight
Wednesday, 9 August, 2017
Azim Faris Ab Rahim
[email protected] PP16795/03/2013(031743) 03-26131734 www.bisonline.com
www.bimbsec.com.my 1
Oil and Gas
Beneficiaries of Market Downcycle
We initiate coverage on the small cap upstream producers namely Hibiscus Petroleum (BUY, TP:
RM0.65) and DNeX (HOLD, TP: RM0.60). These companies have common exposures to the Anasuria
oilfield cluster in the North Sea.
We prefer Hibiscus Petroleum over DNeX as the former is a full-fledged exploration and production
(E&P) company with cash-generating assets. While most oil and gas services companies struggle to
retain and secure new jobs Hibiscus Petroleum has opted to grow within the upstream segment
which is less dependent on the capex spending of oil majors.
The headwinds in oil and gas market had opened the doors for Hibiscus to acquire assets at bargain
prices. Hibiscus has capitalised the low oil price environment well to acquire two late-life oilfields
namely the Anasuria cluster and the North Sabah Enhance Oil Recovery (EOR) Production Sharing
Contracts (PSC) while DNeX has acquired a 15% stake in Anasuria cluster via Ping Petroleum.
Benefitting from market down cycle
In May 2017, we attended Asia Oil & Gas Conference (AOGC) to gain insights from the industry players.
We gathered from the conference that capital expenditure for global conventional exploration and
production (E&P) and oil development projects dropped tremendously since 2014. In light of the weak
crude prices, many major oil producers have re-evaluated their business model and rationalised assets,
especially late-life fields, which are no longer economically-viable at its current cost structure. In a recent
report issued by Wood Mackenzie, a renowned research outfit specialising in the O&G sector, capex
spending in the upstream segment amongst oil majors have started to improve in FY17 although capex
intensity (measured by capex per barrel) remains low at only US$7/bbl vs US$17/bbl in FY14 prior to the
crash in crude oil prices. Since then, we note that establish small upstream producers such as EnQuest
has benefited from the divestment of late-life oilfields by oil majors. These companies are able to contend
with the existing output of these oilfields due to its leaner cost structure and strong balance sheet.
The Anasuria cluster
In need of raising funds to pare down the debt, Royal Dutch Shell and Exxon Mobil has divested the
Anasuria cluster. For Shell, this is part of its divestment program initiated in 2014 worth some USD30bn
following the acquisition of BG Group. The Anasuria cluster, a geographically focused package of four
producing fields in the Central North Sea was jointly sold to Hibiscus and Ping Petroleum (DNeX holds
30% stake in Ping) for US$105m. With the current average production of 6,500 bpd at low opex of
c.USD20/bbl, Anasuria has provided free cash flow boost to both Hibiscus and DNeX.
Hibiscus is our top pick; DNeX has more to be done
Our subsector top pick is Hibiscus (BUY, TP: RM0.65) as we like the company for its focussed business
model as an E&P player. It also provides potential structural earnings growth following the recent
announcement to acquire Shell’s North Sabah EOR PSC for US$25m. While we are positive on DNeX’s
earnings outlook, our call (HOLD, TP: RM0.60) is due to its strong share price performance which we
believe has well reflected its earnings potential. Furthermore, DNeX’s diversified business may limit its
potential benefit from the Anasuria cluster due to potential earnings drag from its oil services units. We
also note that its NSW business (under the IT unit) is expected to see reduced income should the setting
up of uCustoms system comes online post Sep-2018.

9 August 2017 Oil and gas
www.bimbsec.com.my 2
Unearthing opportunities during down cycle The global oil and gas services industry is under pressure as major oil companies cut capex heavily
following the plummet in crude oil price. During the 19th Asian Oil and Gas Conference (AOGC2017)
that we attended last May, we learned that only 4.7bn barrels of oil development projects were
sanctioned in 2016 – a 30% drop compared to 2015 and by far the lowest figure recorded in 40 years.
The amount of exploration and production (E&P) CAPEX scaled back was estimated to be over US$1tr.
While these two developments paint a gloomy outlook for the oil and gas industry, we believe there
are increasing signs that the industry is in a recovery mode especially with crude oil prices stabilising at
US$40-55/bbl since the start of the year. Wood Mackenzie, a renowned research and consultancy group
specialising in the O&G sector, noted (reported by Petroleum Economist) that 2017 could be the
inflexion point in the investment cycle. It expects projects achieving final investment decision (FID) in
2017 to increase to 20-25 from 9 in 2016 although this is still below the average of 40 projects achieving
FIDs annually over 2007-2014 (Chart 1).
Chart 1: Number of FIDs per year (More than 50 MMboe)
Source: BIMB Securities, Wood Mackenzie
In 1H17, there are already 15 projects sanctioned in 1H17, worth 8 billion boe of reserves; of these, 11
are reported to be brownfield projects due to less risk and lower CAPEX intensity. It also pointed out
that project costs for deep-water oil have on average shrunk by a fifth since the collapse in crude oil
prices in 2014.
Despite the advent of rising CAPEX spending, we understand that cost rationalisation and capital
reallocation continues to underpin FIDs made by national (NOCs) and international oil companies
(IOCs). During the AOGC2017, NOCs like Petronas indicated that it has successfully reduced production
unit cost to US$7.3/bbl from US$10/bbl and expects to achieve US$5/bbl by end 2017. Meanwhile Total,
one of France’s IOCs, have lowered production unit cost to US$5/bbl and aims to achieve below
US$5/bbl in 5 years’ time. Essentially, we believe the “fit at US$50/bbl” theme amongst the oil majors
remains in the near to medium term.
One of the key assets that major oil companies have been divesting are late-life oilfields as outputs of
these fields are no longer economically-feasible vis-à-vis their legacy cost structures. These fields are
typically sold to small upstream companies – some of the prominent players highlighted during the
AOGC 2017 was UK-based EnQuest which currently operates the Tanjong Baram oilfield together with
a local player, Uzma Energy Bhd under the Risk Service Contract (RSC) structure.
0
5
10
15
20
25
30
35
40
45
2007-2014 2015 2016 2017F
FID
s p
er
year
(>5
0 M
Mb
oe
)

9 August 2017 Oil and gas
www.bimbsec.com.my 3
In the case of Anasuria, the field was formerly owned by Royal Dutch Shell (Shell) and Esso Exploration
(Esso) and was jointly-acquired by Ping Petroleum and Hibiscus Petroleum for US$105m which then
formed Anasuria Operating Company UK Ltd (AOC) to be the operator of Anasuria cluster. For Shell, the
divestment of Anasuria is part of its US$30bn asset divestment initiative as the oil major looked to pare
down debt and boost asset quality after the mega acquisition of the BG Group for US$53bn. Since
setting out its divestment initiative in 2014, Shell have sold some US$20bn worth of assets.
The Anasuria Cluster The Anasuria Cluster is located in the North Sea, approximately 175km east of Aberdeen, Scotland. The
Anasuria cluster commenced production in 1996 starting with Guillemot A Field, Teal Field and Teal
South Field (P013 production licence) followed by Cook Field (P185 production licence) in 2000. These
four producing wells have all been developed with subsea infrastructure tie-backs to a purpose-built
Anasuria FPSO (Floating Production Storage and Offloading) (Chart 2).
Chart 2: Anasuria’s Schematic of Field Layout and Infrastructure
Source: BIMB Securities, Company
RPS Energy, an independent research outfit that evaluated the field during the acquisition noted (as at
1 Mar 2016) that the 2P proven reserves (2 – base case; 1 – conservative and 3 – aggressive/blue sky
scenario) in Anasuria amounts to 40.5 million stock barrel (MMstb). The bulk of the reserves are located
in Guillemot A and Cook fields (Table 1).
Table 1: Anasuria cluster proven reserves
Full field reserves Net reserves*
Reserves (MMstb) 1P 2P 3P 1P 2P 3P
Guillemot A 18.9 26.6 35.7 18.9 26.6 35.7
Cook 13.1 16.8 20.9 5.1 6.5 8.1
Teal 2.7 3.9 5.5 2.7 3.9 5.5
Teal South 1.8 3.4 5.3 1.8 3.4 5.3
Total 36.5 50.8 67.4 28.4 40.5 54.6 *AOC holds 38.65% interest in Cook Field
Source: BIMB Securities, RPS Energy, Company
A quality asset under oil major Prior to the joint acquisition, the cluster was equally owned by a consortium of Shell and Esso which
invested over GBP120m over 2012-2014 to boost production to 4,700 bpd in 2014 from an average of
2,300 bpd in 2012 (Table 2). Capitalising on in-house expertise, various projects have been outlined to
raise production further and we understand that this would be resumed by new owners.
Infrastructure
The asset infrastructure is laid over a distance of approximately 25km from Cook Field in north to Guillemot A Field in south and includes the Anasuria FPSO
Kite Discovery

9 August 2017 Oil and gas
www.bimbsec.com.my 4
Table 2: Historical Anasuria cluster production data 2012 2013 2014
Total oil production (bbl) 849,986 1,568,331 1,723,264
Implied average daily production (bpd) 2,322 4,285 4,708
Capex (GBP ‘000) 35,069 44,181 58,051
Opex (GBP ‘000) 47,450 48,429 58,256
Opex (USD/bbl) 88.5 48.3 55.8
Assumed USD/GBP 1.585 1.564 1.652 Source: BIMB Securities, Company
Recap on payment structure We believe the acquisition of the Anasuria cluster was done at the right timing. The initial valuation of
the field, based on the 2P Developed reserve, was at US$51m (based on RPS Energy report dated 1 Jan
2015) before it was revised to US$199m based on the prevailing crude oil price at 1 Mar 2016 ahead of
the SPA completion on 10 Mar 2016 (Table 3).
Table 3: Anasuria reserves valuation; ‘premium’ was based on Jan 2015 report
Valuation (US$ m) 1P 2P 3P
@ Jan 2015 @ Mar 2016 @ Jan 2015 @ Mar 2016 @ Jan 2015 @ Mar 2016
Developed -98.4 72.0 51.0 199.0 198.4 370.0
Developed + Undeveloped 35.5 163.0 226.5 416.0 488.0 752.0
Source: BIMB Securities, Company
The consideration to be settled by the purchaser was divided into two: (i) the initial consideration worth
US$60m (US$8m paid during SPA signing and a further US$52m upon SPA completion) and (ii) deferred
consideration worth US$45m satisfied in three equal tranches within 18 months from SPA signing date
(ie. by 10 Sep 2017). We also understand that there is a contingent consideration to be paid should
average selling price exceeds US$75/bbl (only 15% of excess value) over 2018 to 2021.
Table 4: Anasuria payment structure
Companies Initial Consideration (US$ m) Deferred Consideration
(US$ m) Total
(US$ m) SPA signing SPA completion Sub-total
Hibiscus UK 4.0 26.0 30.0 22.5 52.5
Ping UK 4.0 26.0 30.0 22.5 52.5
Total 8.0 52.0 60.0 45.0 105.0
Source: BIMB Securities, Company
Given its limited source of funding, Ping secured DNeX which subscribed to 30% of its enlarged shares
worth US$10m. This financed Ping’s portion of the Anasuria purchase and effectively gave DNeX an
indirect 15% stake in the oilfield (Chart 3).
Chart 3: DNeX 15% effective interest in Anasuria
Source: BIMB Securities, Company
30%
15%
Anasuria Cluster
100%
50% 50%

9 August 2017 Oil and gas
www.bimbsec.com.my 5
Despite the SPA completion date was on 10 Mar 2016, the economic benefits accruing to the buyer was
effective from 1 Jan 2015. This allowed Hibiscus and Ping to use cash flow generated from the asset to
partially finance the payment and thus lowering the capital outlay to only US$1.2m each.
More hydrocarbon potentially to be exploited Hibiscus’ management views the RPS Energy valuation was conservative as it does not consider the
potential 2C contingent reserves which could be recovered. The 2C contingent reserves includes
discovered oil reserves in the Kite field and hydrocarbon in existing fields which could be extracted with
additional investments (Table 5). The 2C reserves would be classified as 2P reserves as soon as further
developments on the field are undertaken.
Table 5: Anasuria cluster contingent reserves
Reserves Contingent oil resources Contingent gas resources
(MMstb/Bscf) 1C 2C 3C 1C 2C 3C
Kite Discovery 0.4 1.4 3.0 0.3 1.2 2.5
Cook Field infill* 0.1 0.5 2.9 0.1 0.5 2.9
Teal South Field infill 0.8 1.5 3.0 0.4 0.7 1.4
Guillemot A Field South infill 2.0 4.0 6.0 0.4 0.8 1.2
Guillemot A Field North (Sk) infill 0.8 1.5 3.0 0.4 0.8 1.6
Guillemot A Field Central (Sk) infill 0.8 1.5 3.0 0.4 0.8 1.6
Total 4.8 10.4 20.9 2.0 4.8 11.2
*AOC holds 38.65% interest in Cook Field Source: BIMB Securities, RPS Energy, Company
Our take on the uncertain crude oil prices For crude oil price outlook, we have noted that consensus view is for a price recovery to happen in the
medium term to long term, despite at different magnitude of change (Chart 4). For instance, OPEC has
assumed a price recovery of US$5/bbl annual increment as the reference case in its World Oil Outlook
published in October 2016. With that, they are expecting crude oil price to be averaged at US$65/bbl
by 2021 and more gradual increment henceforth to reach $92 (in real terms) by 2040.
On other hand, EIA has more aggressive views on the price outlook under its reference case as it
assumed the price to reach US$78.10/bbl by 2021. Thus, our crude oil projection follows OPEC’s
projection for 2017-2021 and World Bank’s projection for 2021 onwards, as we take a conservative
stance in our assumptions.
Chart 4: Crude oil prices assumptions by World Bank, OPEC and EIA
Source: BIMB Securities, OPEC, World Bank, EIA
40.0
50.0
60.0
70.0
80.0
90.0
2017 2018 2019 2020 2021 2022 2023 2024 2025 2026
USD/bbl
OPEC World Bank EIA

9 August 2017 Oil and gas
www.bimbsec.com.my 6
Comparing small upstream producers We prefer Hibiscus (BUY, TP: RM0.65) over DNeX (HOLD, TP: RM0.60) for the best proxy to upstream
production. As mentioned, its direct exposure to the E&P business enables the company to provide
direct exposure to play the recovery crude oil price theme. Furthermore, its lean cost structure also
positions the company to benefit from further divestment of late-life oilfields by the oil majors. This
was evident with the company benefiting from the recent exit by Shell in the North Sabah field.
In valuation terms, we also note that expectations on Hibiscus is still low compared to DNeX despite,
what we believe, is its stronger earnings prospect following the structural earnings growth that would
be derived from the ongoing Anasuria field as well as the soon-to-be-acquired North Sabah field.
While we are Neutral on DNeX, we still view the stock as a quality asset given its diversified business
model which provides investors with the earnings stability of its IT business. Nevertheless, we note that
its strong share price run up, 170% in the past 12 months, has reflected most of its earnings growth
potential. We recommend revisiting the stock on dips.
Table 6: Peer Comparisons
Company Market Cap PER (x) PEG (x) PB (x) ROE (%) ROE-PB (x) EBITDA margin (%)
(US$ m) FY17 FY18 FY16-18 FY17 FY18 FY17 FY18 FY17 FY18 FY17 FY18
Hibiscus 136.7 20.7 17.0 nm 1.0 0.8 4.6 4.8 4.8 5.9 49.1 46.2
DNeX 229.3 14.2 12.0 0.2 2.1 1.8 14.6 14.7 7.0 8.3 32.6 32.8
Sector 183.0 17.5 14.5 0.1 1.5 1.3 9.6 9.8 5.9 7.1 40.8 40.0
Source: BIMB Securities, Bloomberg

9 August 2017 Oil and gas
www.bimbsec.com.my 7
COMPANY SECTION
Market Insight
Wednesday, 9 August, 2017
Azim Faris Ab Rahim
[email protected] PP16795/03/2013(031743) 03-26131734 www.bisonline.com
www.bimbsec.com.my 8
Coverage Initiation Hibiscus Petroleum BUY
Price: RM0.41 Target Price: (+54%) RM0.65 Set for turnaround
We are positive on Hibiscus’s earnings prospect due to the stable
cash flow expected from the Anasuria cluster and the potential
structural earnings growth from its maiden PSC role in Malaysia
following the 50% stake secured in the North Sabah EOR PSC.
We expect earnings to grow by multi-fold over FY18-20F and hit
a new records in coming years. This is backed by the new PSC role
in North Sabah which granted production rights until year 2040.
Initiate with a BUY call and DCF-derived TP of RM0.65 which
assumes a WACC of 9.0% and 0% terminal growth rate. Our strong
conviction on Hibiscus is due to its upstream business model
which has low reliance on capex spending by oil majors.
E&P business model
While outlook for the oil and gas sector remains bleak, Hibiscus has
grabbed our attention after it successfully took over producing
oilfields such as the Anasuria cluster and potentially the North Sabah
EOR PSC. Leveraging on its lean cost structure, we believe Hibiscus is
poise to benefit from the capital reallocation and rationalisation of oil
majors in light of the low crude price environment. Being in the
upstream segment, Hibiscus also has low reliance on capex spending
of oil majors, and provides a direct proxy for investors to benefit from
the potential recovery in crude oil prices.
On road to take over North Sabah EOR PSC
With Petronas Carigali S/B waiving its pre-emptive right to acquire
Shell’s stake in the North Sabah EOR PSC, this has paved the way for
Hibiscus to acquire its first home asset. The field’s 2P and 2C reserves
amounts to 62 MMstb and 72 MMstb respectively (as of 1st March
2016), with production rights spanning upto year 2040. This provides
structural growth for Hibiscus once it assumes ownership of the asset.
Set for turnaround
Hibiscus is poised to return to the black in FY17 with contribution from
the Anasuria field. We expect earnings to grow by multi-fold over
FY18-20F underpinned by higher production from Anasuria cluster as
and structural earnings growth from the North Sabah EOR PSC which
is expected to contribute from 2HFY18 onwards.
Initiate with a BUY call, TP: RM0.65
We initiate with a BUY call with a DCF-derived TP of RM0.65 which
implies 29.5x FY18F PER. Our DCF assumes a WACC of 9.0% and 0%
terminal growth rate.
Stock Data
Bloomberg Ticker HIBI MK
Equity
Altman Z-score 6.2 Market Cap 584.8 YTD price chg 36.6% Issued shares 1,443.8 YTD KLCI chg 7.4% 52-week range (H/L) 0.56 / 0.18 Beta 0.9 3-mth avg daily volume 16,549,690 Major Shareholders
Free Float 72.2% Hibiscus Upstream 11.7%
Shariah Compliant Y Polo Inv 9.6%
Financial Derivatives N Mohd Zulkifli 6.5%
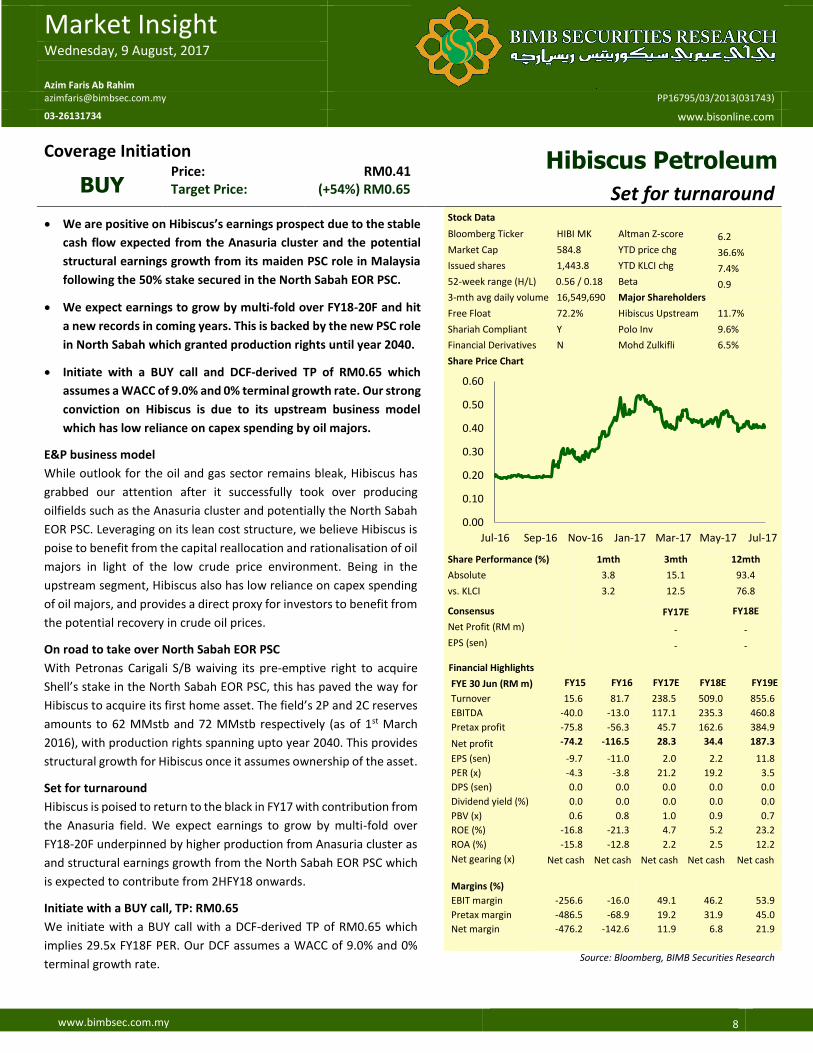
Share Price Chart
Share Performance (%) 1mth 3mth 12mth
Absolute 3.8 15.1 93.4
vs. KLCI 3.2 12.5 76.8
Consensus FY17E FY18E
Net Profit (RM m) - - EPS (sen) - -
Financial Highlights
FYE 30 Jun (RM m) FY15 FY16 FY17E FY18E FY19E
Turnover 15.6 81.7 238.5 509.0 855.6
EBITDA -40.0 -13.0 117.1 235.3 460.8
Pretax profit -75.8 -56.3 45.7 162.6 384.9
Net profit -74.2 -116.5 28.3 34.4 187.3
EPS (sen) -9.7 -11.0 2.0 2.2 11.8
PER (x) -4.3 -3.8 21.2 19.2 3.5
DPS (sen) 0.0 0.0 0.0 0.0 0.0
Dividend yield (%) 0.0 0.0 0.0 0.0 0.0
PBV (x) 0.6 0.8 1.0 0.9 0.7
ROE (%) -16.8 -21.3 4.7 5.2 23.2
ROA (%) -15.8 -12.8 2.2 2.5 12.2
Net gearing (x) Net cash Net cash Net cash Net cash Net cash
Margins (%)
EBIT margin -256.6 -16.0 49.1 46.2 53.9
Pretax margin -486.5 -68.9 19.2 31.9 45.0
Net margin -476.2 -142.6 11.9 6.8 21.9
Source: Bloomberg, BIMB Securities Research
0.00
0.10
0.20
0.30
0.40
0.50
0.60
Jul-16 Sep-16 Nov-16 Jan-17 Mar-17 May-17 Jul-17

9 August 2017 Oil and gas
www.bimbsec.com.my 9
A full-fledged E&P company Hibiscus Petroleum Bhd (Hibiscus) was first listed as a Special Purpose Acquisition Company (SPAC) on
25 Jul 2011. Upon acquiring 35% stake in Lime Petroleum Plc (Lime) in Apr 2012, it became the first
independent oil and gas E&P to be listed on Bursa Malaysia. Lime provided Hibiscus with exploration
acreage concessions in Oman, the UAE and Norway but the venture ended in early 2016 after it went
into liquidation. Nevertheless, thanks to the 50%-stake acquired in the Anasuria cluster by mid-2016,
earnings recovered swiftly.
Hibiscus strike another deal with Shell for a 50% stake in the 2011 North Sabah Enhanced Oil Recovery
(EOR) Production Sharing Contract (PSC) for US$25mil. The acquisition is expected to be completed by
end 2017 with Petronas Carigali waiving its pre-emption rights under the joint operating agreement
entered with Shell. Hibiscus also has exploration and production licence in the Bass of Strait of Australia,
however operation is temporarily ceased due to unfavourable prices. The company will look to restart
the operation once crude price stabilise above US$60/bbl.
Shariah compliance We reviewed Hibiscus’s Shariah Status in accordance with the screening methodology and processes
adopted by the Shariah Advisory Council of Securities Commissions Malaysia (SACSC) (Table 1).
Table 1: Hibiscus’s Shariah Status review as of FY16
Business Activity Benchmark Hibiscus SACSC Benchmark
NPI/TO (%) 0.2% 5% Below the allowable limit set by SACSC
Financial Ratios Benchmark Hibiscus SACSC Benchmark
C/TA (%) 2.3% 33% Below the allowable limit set by SACSC
D/TA (%) 0.0% 33% Below the allowable limit set by SACSC
Source: BIMB Securities
Focusing on cash-generating asset We like Hibiscus as it offers direct exposure to crude oil price movements. This contrasts against the
bulk of the oil services companies listed in Bursa Malaysia which are dependent on the capex spending
of oil majors. Our positive view on Hibiscus is further affirmed as follow:
More fields to come. We believe Hibiscus’ string of acquisitions in recent years lend much to its
lean cost structure which enables the company to capitalise on the divestments of late-life fields by
oil majors. Despite signs of CAPEX spending by oil majors picking up, intensity remains low to
average at only US$7/bbl compared to US$17/bbl in 2014, according to an industry outlook report
by Wood Mackenzie. As such, we believe there are more late-life fields to be divested, providing a
potential structural earnings growth for Hibiscus.
Free cash flow boost from Anasuria. Management has guided that AOC’s current opex is kept low
at c.USD20/bbl (Table 2). With average crude oil price realised at over USD40/bbl, this asset is
currently cash flow positive and the company expects to utilise these CFs to further develop the
fields and to increase its 2P reserves.
Table 2: Anasuria operational performance Items Units Q2CY16 Q3CY16 Q4CY16 Q1CY17
Average daily oil production bbl/day 5,942 6,064 7,868 5,234
Total oil sold bbl 460,000^ 271,576 298,909 273,419
Average realised oil price USD/bbl 40.1 45.2 41.7 52.9
Average OPEX USD/boe 23.1 18.4 13.0 15.1
Source: BIMB Securities, Company
Development opportunities in Bass Strait, Australia. Hibiscus currently owns VIC/P57 exploration
licence and VIC/L31 production licence through its wholly-owned subsidiary Carnarvon Hibiscus Pty
Ltd (Carnarvon). At the West Seahorse Field, there is 8 MMbbls of 2P/2C reserves potentially to be

9 August 2017 Oil and gas
www.bimbsec.com.my 10
recovered. The company has deferred this development project until crude prices stabilise above
$60/bbl.
Structural growth from North Sabah. As a production sharing contractor (PSC), Hibiscus will lead
another partner, Petronas Carigali S/B to manage oil production from the cluster. With daily average
production of 15,000 bpd and huge proven reserves, this field would provide structural earnings
growth for Hibiscus.
The 2011 North Sabah EOR PSC Hibiscus is in the process of acquiring a 50% interest in the 2011 North Sabah EOR PSC from Shell. The
PSC comprises of four producing fields located in the South China Sea, namely South Furious, South
Furious 30, St. Joseph, and Barton. Additionally, Hibiscus will assume the role of operatorship of PSC
which also include the pipeline structure, the Labuan Crude Oil Terminal (LCOT) and all equipment and
assets relating to the PSC.
Chart 1: North Sabah oil fields [take out border]
Source: BIMB Securities, Google
According to data from RISC Operation Pty Ltd as of 1 Jan 2016 (Table 3), Hibiscus will get immediate
access to 2P reserves contained in the fields amounting to 62 MMstb with production rights up to 2040.
Not only that, its 2C reserve is slightly larger at 79 MMstb. As PCSB have declined to exercise its exclusive
right to buy Shell’s stake, Hibiscus’ management expect the acquisition could be completed by end of
2017.
Table 3: North Sabah PSC Units 2015
Average daily production bpd 18,000
Remaining reserves (2P) MMstb 62
Contingent reserves (2C) MMstb 79
Platforms/Structures 19
Wells 135
Opex RM/bbl 55.1
Source: BIMB Securities, Company, RISC, Shell

9 August 2017 Oil and gas
www.bimbsec.com.my 11
Latest financial quarter: Turnaround on track Hibiscus has done well to return to the black since 1QFY17 and we expect profitability to remain intact
for the full year. Its 9MFY17 core net profit rebounded to RM23.5m from a core loss of RM101m a year
ago (Table 4).
Table 4: Hibiscus’s 9MFY17 performance
FYE Jun (RM m) 3QFY16 4QFY16 1QFY17 2QFY17 3QFY17 QoQ Chg YoY Chg 9MFY16 9MFY17 YTD Chg
Revenue 31.7 50.9 54.7 62.8 69.2 10.2% 117.9% 83.6 186.8 124%
EBITDA -17.3 7.5 24.6 35.1 33.8 -3.7% >100% -12.0 93.5 nm
EBIT -23.1 -10.5 7.5 13.6 18.1 33.0% >100% -42.9 39.1 nm
Pretax Profit 79.8 23.2 7.5 10.0 16.8 67.4% >100% -56.3 34.3 nm
Taxation 0.7 -4.3 72.8 0.6 -10.3 >100% nm -3.6 63.1 nm
Net profit 80.5 19.0 80.3 10.7 6.5 -39.3% -91.9% -60.0 97.4 nm
Core Net Profit -26.1 -15.4 1.9 14.2 7.5 -47.3% nm -116.5 23.5 nm
EPS (sen) -2.4 -1.3 0.1 1.0 0.5 -47.3% nm -11.4 1.7 nm
EBITDA margin (%) -54.4 14.9 45.0 55.8 48.8 -14.3 50.0
PBT margin (%) 251.2 45.9 13.7 16..0 24.2 -67.4 18.4
Core profit mrgn (%) -82.3 -30.5 3.4 22.6 10.8 -139.4 12.6
Effective tax rate (%) -0.8 18.4 -973.2 6.4 61.4 6.5 -184.1
Source: BIMB Securities, Company
The 9-month core profit was driven by Anasuria’s contribution following a smooth transition of field
operatorship to AOC. On Qoq basis, its core net profit fell 47% to RM7.5m due to an unplanned facility
shutdown. Management clarified that the shutdown was a precautionary measure. With gas-oil ratio
readings at one of the main producing wells increased, it could result in unnecessary loss of reservoir
pressure and possibly lower oil recovery in the long run. Full production was restored towards the end
of the quarter.
Higher production level to drive earnings We expect Hibiscus’s earnings to grow by multi-fold over FY18-20F underpinned by higher production
level from Anasuria cluster and structural earnings growth from the North Sabah PSC (Table 5).
Table 5: Earnings outlook
FYE Jun (RM m) FY16 FY17F FY18F FY19F FY20F
Revenue 81.7 238.5 509.0 855.6 990.6
EBITDA (13.0) 117.1 235.3 460.8 561.5
EBITDA margin (%) -16.0 49.1 46.2 53.9 56.7
EBIT (43.9) 45.5 162.4 384.8 482.1
Pretax profit (56.3) 45.7 162.6 384.9 482.4
Net profit (60.0) 28.3 34.4 187.3 230.0
Core profit (116.5) 28.3 34.4 187.3 230.0
Core profit growth (%) 56.9% >100% 21.5% >100% 22.8%
Average crude oil price (USD/bbl) 45 50 55 60
GBP/MYR 5.5 5.4 5.3 5.2
USD/MYR 4.4 4.2 4.0 3.8
Source: BIMB Securities, Company
At Anasuria, several well workover projects are in the pipeline to raise production level to 10,000 bpd
in the next 3-4 years (Table 6).
Table 6: Anasuria Cluster Key Assumptions
FYE June FY17F FY18F FY19F FY20F Comments
Average crude oil production* (kbpd) 3,300 3,795 4,364 5,019 Driven by capex projects
Annual opex (GBP m/year) 15 15.8 16.5 17.4
Annual capex (GBP m/year) 1.8 1.8 10.0 5.0 Well workover and infill drilling
*Figures are net to Hibiscus Source: BIMB Securities, Company

9 August 2017 Oil and gas
www.bimbsec.com.my 12
Meanwhile at North Sabah, Hibiscus aims to raise output to c.21,000 bpd from the current 15,000 bpd
in the next 4-5 years. This requires Hibiscus to spend another c.USD100m throughout the period,
financed by FCF from existing production.
Table 7: North Sabah EOR PSC Key Assumptions
FYE June FY17F FY18F FY19F FY20F Comments
Average crude oil production* (kbpd) 8,000 9,000 10,000 Driven by capex projects
Average crude oil price (USD/bbl) 50 55 60
Annual opex (USD m/year) 40.9 49.3 58.4
Annual capex (USD m/year) 7.5 10.0 12.5
*Figures are net to Hibiscus Source: BIMB Securities, Company
A pure E&P oil and gas play We initiate coverage on Hibiscus with a BUY recommendation and a DCF-derived TP of RM0.65. This
implies 29.5x FY18F EPS. Our DCF assumes a WACC of 9.0% and 0% terminal growth rate (Table 8).
Table 8: DCF breakdown
Items RM m Remarks
WACC (%) 9.0% Risk-free 4%, risk premium 5%
Terminal growth rate (%) 0%
NPV of forecast 379.3
NPV of terminal value 513.8
Total Enterprise value 893.1
Less: net (debt) / cash 28.7
Total Equity value 921.8
No. of shares (m) 1,443.8
Equity value per share (RM) 0.64 Implies FY18F PE of 29.5x
Source: BIMBSecurities
Key catalyst
Better average selling price. We assumed crude oil price scenario of USD45-USD60/bbl over FY17-
20F. A higher crude oil price scenario would provide earnings surprise to the company as Hibiscus
may restart its operation in the Australian basin.
More new wells acquired. We believe more acquisitions of earnings accretive late-life fields bodes
well for Hibiscus’ earnings going forward.
Key risk
Lower for longer crude oil price scenario. We might undermine the potential production from US
shale plays. A better-than expected US shale production might suppress crude oil prices as well as
Hibiscus’s earnings.
Longer-than-expected facilities uptime. Unexpected accident and problem arises during well
workover program as well infill drillings could reduce facilities uptime during production phases.

9 August 2017 Oil and gas
www.bimbsec.com.my 13
Income Statement
FYE 30 Jun (RM m) 2015 2016 2017F 2018F 2019F
Revenue 15.6 81.7 238.5 509.0 855.6
EBITDA (40.0) (13.0) 117.1 235.3 460.8
Depreciation & Amortisation (8.8) (30.9) (71.6) (72.9) (75.9)
EBIT (48.8) (43.9) 45.5 162.4 384.8
PBT (75.8) (56.3) 45.7 162.6 384.9
Taxation 1.6 (3.6) (17.4) (128.2) (197.7)
Net Profit (74.2) (60.0) 28.3 34.4 187.3
Core Net Profit (74.2) (116.5) 28.3 34.4 187.3
Core EPS (sen) (9.7) (11.0) 2.0 2.2 11.8
Dividend / Share (sen) 0.0 0.0 0.0 0.0 0.0
Source: Company, BIMB Securities
Balance Sheet
FYE 30 Jun (RM m) 2015 2016 2017F 2018F 2019F
Non-Current Assets
PPE 55.5 211.5 215.7 238.9 309.5
Investment in associate 5.0 1.9 1.9 1.9 1.9
Investment in JV 259.3 - - - -
Intangible asset 144.8 997.1 1,012.9 994.2 945.7
Current Assets
Trade and other receivables - 2.0 3.3 7.0 11.7
Other receivables 67.5 21.5 21.5 21.5 21.5
Tax recoverable - - - - -
Inventories - 5.5 5.7 11.7 19.5
Amount owing by JV 12.1 0.1 0.1 0.1 0.1
Amount owing by assoc 1.0 0.7 0.7 0.7 0.7
Cash and cash equivalents 5.9 28.7 49.6 19.3 47.5
Escrow account - - - 131.1 273.3
Total Assets 551.0 1,269.2 1,311.5 1,426.6 1,631.5
Equity
Share capital 9.3 13.1 13.1 13.1 13.1
Other reserve 574.4 703.0 703.0 768.0 768.0
Accumulated (loss)/gain (71.9) (131.9) (103.6) (69.2) 118.0
Non-Current Liabilities
Deferred consideration - 26.5 26.5 26.5 26.5
Contingent consideration - 1.5 1.5 1.5 1.5
Deferred tax liabilities - 390.9 390.9 390.9 390.9
Provision for decommissioning costs - 115.4 129.2 144.7 162.1
Current Liabilities
Trade payables - 0.1 0.2 0.5 0.8
Other payables 27.0 88.8 88.8 88.8 88.8
Deferred consideration - 55.8 55.8 55.8 55.8
Amount owing to JV 0.2 0.3 0.3 0.3 0.3
Amount owing to association 11.8 5.4 5.4 5.4 5.4
Redeemable Convertible Preference Shares 0.2 0.2 0.2 0.2 0.2
Total Equity and Liabilities 551.0 1,269.2 1,311.5 1,426.6 1,631.5
Source: Company, BIMB Securities

9 August 2017 Oil and gas
www.bimbsec.com.my 14
Cash Flow
FYE 30 Jun (RM m) 2015 2016 2017F 2018F 2019F
Operating Cash flow
PBT (75.8) (56.3) 45.7 162.6 384.9
D&A 8.8 30.9 71.6 72.9 75.9
Unwinding of decommission cost - - 13.8 15.5 17.4
Interest income (1.1) (0.1) (0.1) (0.2) (0.1)
Unrealised (gain)/loss on FX (6.7) (0.9) - - -
Finance cost 0.0 8.2 - - -
(Reversal)/Impairment of associate 6.1 (0.7) - - -
(Reversal)/Impairment of JV - 229.0 - - -
(Reversal)/Impairment of intangible asset - 17.5 - - -
(Reversal)/Impairment of receivables 0.2 2.2 - - -
Result of associate 1.4 4.1 - - -
Result of JV 26.7 63.4 - - -
Negative goodwill - (364.1) - - -
Write-off business development - 30.9 - - -
Changes in WC
Receivables - (2.0) (1.3) (3.7) (4.7)
Payable - 0.1 0.2 0.2 0.3
Inventories - (5.5) (0.1) (6.1) (7.8)
Total working capital - (7.5) (1.2) (9.5) (12.2)
Income tax paid 2.8 (0.0) (17.4) (128.2) (197.7)
CFO (32.2) 62.5 112.4 113.0 268.2
Investing Cash Flow
Capex (33.4) (0.0) (25.6) (46.0) (98.0)
Acquisition of intangible asset (84.0) (104.4) (66.0) (31.5) -
Interest received 1.1 0.1 0.1 0.2 0.1
CFI (209.6) (131.8) (91.5) (77.2) (97.9)
Financing Cash Flow
Proceeds of issuance of new shares 186.1 92.6 - 65.0 -
Cash advance from directors - 3.2 - - -
Repayment of cash advances from directors - (0.5) - - -
Deposit (refunded to)/received from RCPS placee (5.5) - - - -
Escrow account - - - (131.1) (142.2)
CFF 180.6 95.2 - (66.2) (142.2)
Net change (61.2) 25.9 20.9 (30.3) 28.1
Beginning cash 62.4 5.9 28.7 55.6 33.9
Net forex difference 4.7 (3.1) - - -
Ending cash 5.9 28.7 49.6 19.3 47.5
Source: Company, BIMB Securities

9 August 2017 Oil and gas
www.bimbsec.com.my 15
DEFINITION OF RATINGS
BIMB Securities uses the following rating system:
STOCK RECOMMENDATION
BUY Total return (price appreciation plus dividend yield) is expected to exceed 10% in the next 12 months.
TRADING BUY Share price may exceed 15% over the next 3 months, however longer-term outlook remains uncertain.
HOLD Share price may fall within the range of +/- 10% over the next 12 months
TAKE PROFIT Target price has been attained. Fundamentals remain intact. Look to accumulate at lower levels.
TRADING SELL Share price may fall by more than 15% in the next 3 months.
SELL Share price may fall by more than 10% over the next 12 months.
NOT RATED Stock is not within regular research coverage.
SECTOR RECOMMENDATION
OVERWEIGHT The Industry as defined by the analyst’s coverage universe, is expected to outperform the relevant primary market index over the
next 12 months
NEUTRAL The Industry as defined by the analyst’s coverage universe, is expected to perform in line with the relevant primary market index
over the next 12 months
UNDERWEIGHT The Industry as defined by the analyst’s coverage universe, is expected to underperform the relevant primary market index over
the next 12 months
Applicability of ratings
The respective analyst maintains a coverage universe of stocks, the list of which may be adjusted according to needs. Investment ratings are only
applicable to the stocks which form part of the coverage universe. Reports on companies which are not part of the coverage do not carry investment
ratings as we do not actively follow developments in these companies.
Disclaimer
The investments discussed or recommended in this report may not be suitable for all investors. This report has been prepared for information purposes
only and is not an offer to sell or a solicitation to buy any securities. The directors and employees of BIMB Securities Sdn Bhd may from time to time
have a position in or either the securities mentioned herein. Members of the BIMB Group and their affiliates may provide services to any company and
affiliates of such companies whose securities are mentioned herein. The information herein was obtained or derived from sources that we believe are
reliable, but while all reasonable care has been taken to ensure that stated facts are accurate and opinions fair and reasonable, we do not represent
that it is accurate or complete and it should not be relied upon as such. No liability can be accepted for any loss that may arise from the use of this
report. All opinions and estimates included in this report constitute our judgements as of this date and are subject to change without notice. BIMB
Securities Sdn Bhd accepts no liability for any direct, indirect or consequential loss arising from use of this report.
Printed and published by
BIMB SECURITIES SB (290163-X) A Participating Organisation of Bursa Malaysia Securities Berhad Level 32, Menara Multi-Purpose, Capital Square,
No. 8 Jalan Munshi Abdullah,
50100 Kuala Lumpur
Tel: 03-2613 1600 Fax: 03-2613 1799 Azharuddin Nordin
http://www.bimbsec.com.my Head of Research