benefit-cost analysis of residential fire sprinkler systems · table 4-2 cost estimate summary...
TRANSCRIPT

U.S. Department of Commerce Office of Applied Economics National Institute of Standards and Technology Building and Fire Research Laboratory
Gaithersburg, Maryland 20899
Benefit-Cost Analysis of Residential Fire Sprinkler Systems
David T. Butry M. Hayden Brown Sieglinde K. Fuller
NISTIR 7451

Cover photos, (clockwise from upper left), courtesy of the United States Fire Administration (USFA), Purdue University, Kellie Beall of the National Institute of Standards and Technology, and the City of Sausalito Fire Department.

U.S. Department of Commerce Office of Applied Economics National Institute of Standards and Technology Building and Fire Research Laboratory
Gaithersburg, Maryland 20899
Benefit-Cost Analysis of Residential Fire Sprinkler Systems David T. Butry M. Hayden Brown Sieglinde K. Fuller
Funded by: United States Fire Administration (USFA) Emmitsburg, MD 21727 September 2007
NISTIR 7451
Department of Homeland Security Michael Chertoff, Secretary Federal Emergency Management Agency R. David Paulison, Administrator U.S. Fire Administration Gregory B. Cade, Assistant Administrator
U.S. Department of Commerce Carlos M. Gutierrez, Secretary
National Institute of Standards and Technology Dr. James M. Turner, Acting Director


iii
Abstract This report documents a benefit-cost analysis performed to measure the expected present value of net benefits resulting from the installation of a multipurpose network fire sprinkler system in a newly-constructed, single-family house. The benefits and costs associated with the installation and use of a fire sprinkler system are compared across three prototypical single-family housing types: colonial, townhouse, and ranch. The installation costs differ by housing types, with the colonial being the most expensive and the ranch the least. The benefits experienced by residents of single-family dwellings with sprinkler systems, as measured in this report, include reductions in the following: the risk of civilian fatalities and injuries, homeowner insurance premiums, uninsured direct property losses, and uninsured indirect costs. The primary costs examined are for initial purchase and installation of the sprinkler system. Maintenance and repair costs are not examined because they are negligible. Results of the benefit-cost analysis show that multipurpose network sprinkler systems are economical. The expected present value of net benefits (PVNB) in 2005 dollars is estimated as $2919 for the colonial-style house, $3099 for the townhouse, and $4166 for the ranch-style house. A sensitivity analysis is performed to measure the variability of the results to changes in the modeling assumptions. The sensitivity analysis confirms the robustness of the baseline analysis. The PVNB range from $704 to $4801 for the colonial-style house, from $884 to $4981 for the townhouse, and from $1950 to $6048 for the ranch-style house. Multipurpose network systems are the lowest life-cycle cost systems because homeowners can perform their own regular inspections and maintenance, and thereby save on costs they would incur with other systems. Given that they provide a similar level of performance, in terms of fire-risk mitigation, multipurpose network systems then achieve greater cost-effectiveness over alternate systems. Key Words: building economics, benefit-cost analysis, cost-effective decision, economic analysis, fire sprinkler, life-cycle cost


v
Preface
This benefit-cost analysis is conducted for the United States Fire Administration (USFA) by the Office of Applied Economics (OAE) in the Building and Fire Research Laboratory at the National Institute of Standards and Technology. A benefit-cost model is designed and estimated, expanding on the prior cost analysis developed by OAE in NISTIR 7277, Economic Analysis of Residential Fire Sprinkler Systems (Brown 2005). This analysis provides a current estimation of the cost-effectiveness of installing residential fire sprinkler systems, updating a prior National Bureau of Standards (NBS) study, A Benefit-Cost Model of Residential Fire Sprinkler Systems (Ruegg and Fuller 1984). Brown (2005) documented the design and installation cost of four fire sprinkler systems—three variants of a stand-alone system and a multipurpose network system—in three housing types. When compared to a typical stand-alone fire sprinkler system that included a backflow preventer requiring professional maintenance, the multipurpose network system was generally the least costly in life-cycle costs across all three housing types. The multipurpose network system was therefore selected as the fire sprinkler system to be used in this benefit-cost analysis. Disclaimer: Certain trade names or company products are mentioned in the text to specify adequately the experimental procedure and equipment used. In no case does such identification imply recommendation or endorsement by the National Institute of Standards and Technology or the United States Fire Administration, nor does it imply that the equipment is the best available for the purpose. Disclaimer Regarding Non-Metric Units: The policy of the National Institute of Standards and Technology is to use metric units in all its published materials. All of the sprinkler system design data such as room dimensions and pipe lengths were obtained in U.S. customary units. Because this report is intended for U.S. builders and contractors who use U.S. customary units, it is more practical and less confusing to use U.S. customary rather than metric units. Measurement values in this report are therefore stated in U.S. customary units first, followed by the corresponding values in metric units within parentheses.


vii
Acknowledgements
Thanks are due to Dan Madrzykowski of the Fire Research Division of the Building and Fire Research Laboratory. Dan Madrzykowski initiated this project and facilitated the collection of cost data. Thanks are also given to Harold Marshall, Robert Chapman, and Douglas Thomas of the Office of Applied Economics for their many helpful comments and suggestions on the benefit-cost model and comparative analysis. Special appreciation is extended to OAE staff members Julie Wean for her research, and Tessa Beavers for her editing work. Special thanks are given to Mr. Larry Maruskin of the U.S. Fire Administration for supporting this project. The help of Dr. John R. Hall, Jr., of the National Fire Protection Association, in analyzing fire data was invaluable; without it, this report could not have been written.


ix
Table of Contents
Abstract ................................................................................................................................................iii Preface................................................................................................................................................... v Acknowledgements.............................................................................................................................vii List of Tables .......................................................................................................................................xi List of Figures .....................................................................................................................................xii Executive Summary .......................................................................................................................ES-1 1. Introduction...................................................................................................................................... 1 1.1. Background .............................................................................................................................. 1 1.2. Purpose and Scope of Approach .............................................................................................. 1 2. Benefit-Cost Framework.................................................................................................................. 3 2.1. Introduction to Benefit-Cost Analysis ..................................................................................... 3 2.2. The Benefit-Cost Model........................................................................................................... 3 3. Data and Assumptions ..................................................................................................................... 5 3.1. Introduction.............................................................................................................................. 5 3.2. Data Sources ............................................................................................................................ 5 3.2.1. National Fire Incident Reporting System 5.0................................................................ 6 3.2.2. National Fire Protection Association ............................................................................ 9 3.2.2.1. Calibration and Scaling Ratios.......................................................................... 9 3.3. National Fire Statistics........................................................................................................... 11 3.3.1. Statistics ...................................................................................................................... 11 3.4. Value of Fatality and Injury Averted ..................................................................................... 14 3.4.1. Value of a Statistical Life............................................................................................ 14 3.4.2. Value of Injury Averted .............................................................................................. 14 3.5. Costs of a Residential Multipurpose Network Sprinkler System .......................................... 15 4. Baseline Benefit-Cost Analysis of Multipurpose Network Sprinkler Systems in Residential Dwellings ....................................................................................................................................... 21 4.1. Introduction............................................................................................................................ 21 4.2. Estimated Benefits of Multipurpose Network Sprinkler Systems in Residential Dwellings.21 4.2.1. Fatalities Averted ......................................................................................................... 21 4.2.2. Injuries Averted ........................................................................................................... 24 4.2.3. Directed Uninsured Property Loss Averted ................................................................. 24 4.2.4. Indirect Uninsured Costs Averted................................................................................ 24 4.2.5. Insurance Premium Credit ........................................................................................... 24 4.3. Estimated Costs of Multipurpose Network Sprinkler Systems in Residential Dwellings ..... 25 4.3.1. Installation Cost Comparison....................................................................................... 25 4.4. Benefit-Cost Comparison....................................................................................................... 26

x
4.4.1. Benefit-Cost Analysis of a Multipurpose Network Residential Sprinkler System Installed in the Colonial ............................................................................................... 26 4.4.2. Benefit-Cost Analysis of a Multipurpose Network Residential Sprinkler System Installed in the Townhouse .......................................................................................... 27 4.4.3. Benefit-Cost Analysis of a Multipurpose Network Residential Sprinkler System Installed in the Ranch................................................................................................... 27 5. Sensitivity Analysis of the Baseline Benefit-Cost Analysis of Multipurpose Network Sprinkler Systems in Residential Dwellings.................................................................................................. 29 5.1. Introduction............................................................................................................................ 29 5.2. Simulated Distributions.......................................................................................................... 29 5.3. Results of Sensitivity Analysis .............................................................................................. 31 5.3.1. Sensitivity Analysis Varying Only One Assumption .................................................. 36 6. Summary and Recommendations for Future Research................................................................. 39 6.1. Summary ................................................................................................................................ 39 6.2. Conclusions............................................................................................................................ 39 6.3. Recommendations for Future Research ................................................................................. 40 References........................................................................................................................................... 41 Appendix A: Benefit and Cost Calculation Equations....................................................................... 43 A.1. Benefits ................................................................................................................................. 43 A.1.1. Reduced Risk of Death and Injury ............................................................................. 43 A.1.2. Reduced Risk of Direct Losses .................................................................................. 44 A.1.3. Reduced Risk of Indirect Costs.................................................................................. 44 A.1.4. Reduced Insurance Premiums.................................................................................... 45 A.1.5. Other Sprinkler Benefits ............................................................................................ 45 A.2. Cost Variables ....................................................................................................................... 45 Appendix B: Discussion of Non-Quantified Benefits and Costs....................................................... 47 B.1. Mortgage Interest Tax Deduction.......................................................................................... 47 B.2. Increased Present Value of Resale Proceeds......................................................................... 47 B.3. Local Tax Savings................................................................................................................. 47 B.4. Accidental Activation............................................................................................................ 47

xi
List of Tables Table 3-1 Comparison of One-and Two-Family Dwelling Fire Incidents Reported to NFIRS 5.0 with One-and-Two-Family Dwelling Fire Incidents Estimated by NFPA From 2002 to 2005 ........................................................................................................................ 6 Table 3-2 NFIRS 5.0 Classification of Fire Incident Attributes Used in Analysis.............................. 8 Table 3-3 NFIRS 5.0 Classification of Types of Fire Systems Analyzed ........................................... 9 Table 3-4 Scaling Ratios Used to Project Attributes of the 2002 to 2005 NFIRS 5.0 One-and-Two-Family Dwelling Fire Incidents into National Estimates ........................... 10 Table 3-5 National Estimates of Fires and Probability of Ignition Occurrence in One-and Two- Family Dwellings............................................................................................................... 13 Table 3-6 National Estimates of One-and Two Family Dwelling Fires, Civilian Fatality and Injury Rate for 2002 to 2005, Using NFIRS 5.0/NFPA Adjusted Data, for Dwellings With Different Fire Technology (No Smoke Alarms [none], Only Smoke Alarms [smoke], and Smoke Alarm and a Wet-Pipe Sprinkler System [sprinkler])............................................ 13 Table 3-7 National Direct Property Loss Estimates Resulting From One-and Two-Family Dwelling Fires for 2002 to 2005, Using NFIRS 5.0/NFPA Adjusted Data, for Dwellings With Different Fire Technology (No Smoke Alarms [none], Only Smoke Alarms [smoke], and Smoke Alarms and a Wet-Pipe Sprinkler System [sprinkler]) .......................................... 13 Table 3-8 Cost Summary: Multipurpose Network System Using PEX for a New 3338 ft2 (310 m2) Single Family Colonial House............................................................................ 17 Table 3-9 Cost Summary: Multipurpose Network System Using PEX for a New 2257 ft2 (210 m2) Single Family Townhouse .................................................................................. 18 Table 3-10 Cost Summary: Multipurpose Network System Using PEX for a New 1171 ft2 (109 m2) Single Family Ranch House .............................................................................. 19 Table 4-1 Calculation of Present Value Benefits of Wet-Pipe Sprinkler Systems ............................ 23 Table 4-2 Cost Estimate Summary Table .......................................................................................... 25 Table 4-3 1982 Fire Sprinkler System Purchase and Installation Cost (2005 $) ............................... 25 Table 4-4 Summary of Baseline Benefit-Cost Analysis of a Multipurpose Network Residential Sprinkler System................................................................................................................ 26 Table 5-1 Description of the Simulated Distributions used in the Sensitivity Analysis .................... 30 Table 5-2 Summary Statistics of the Sensitivity Analysis ................................................................. 31

xii
Table 5-3 Contribution to Variance and Rank Correlation of the Assumptions to the Net Present Value Calculation............................................................................................................... 35 Table 5-4 Summary Statistics of the Sensitivity Analysis When Varying One Assumption at a Time ................................................................................................................................... 36

xiii
List of Figures Figure 5-1 The Cumulative Distribution Function Resulting From Latin Hypercube Sampling of Inputs in the Present Value of Net Benefits Calculation for the Colonial House .33 Figure 5-2 The Cumulative Distribution Function Resulting From Latin Hypercube Sampling of Inputs in the Present Value of Net Benefits Calculation for the Townhouse........33 Figure 5-3 The Cumulative Distribution Function Resulting from Latin Hypercube Sampling of Inputs in the Present Value of Net Benefits Calculation for the Ranch House .....34

xiv

ES-1
Executive Summary The objective of this study is to measure the expected economic performance of a fire sprinkler system installed in a newly constructed, single-family dwelling in the U.S. The benefit-cost analysis in this report is consistent with ASTM E 1074-06: Practice for Measuring Net Benefits for Investments in Buildings and Building Systems, and it is meant to provide a current benefit-cost analysis of residential fire sprinkler systems, updating NBS Technical Note 1203: A Benefit-Cost Model of Residential Fire Sprinkler Systems, published in 1984. In 1984, evidence suggested that sprinkler systems were not cost-effective, perhaps explaining the relatively small number of houses equipped with fire sprinklers today, even while fire professionals maintain that such systems protect lives and property from fire. Over the past two decades, advancement in the performance and cost-structure of fire sprinkler technologies have occurred, altering the cost-effectiveness of fire sprinkler systems. This report revisits the topic using the most complete fire incident data available today. The benefits experienced by residents of single-family dwellings with sprinkler systems, as measured in this report, include reductions in the following: the risk of civilian fatalities and injuries, homeowner insurance premiums, uninsured direct property losses, and uninsured indirect costs. The primary costs examined are for initial purchase and installation of the sprinkler system. The measure of benefit-cost performance, the present value net benefits, compares differently timed benefit and cost cash flows, accruing to a homeowner, by discounting them to a reference point in time. All dollars presented in this report are in 2005 adjusted dollars. The present value net benefits are calculated by subtracting present value costs from the present value benefits. The quantified benefits of a fire sprinkler system used in a single-family dwelling are based on reported fire incident data contained within the U.S. Fire Administration’s National Fire Incident Reporting System 5.0 (NFIRS 5.0), and calibrated with reported data based on the National Fire Protection Association’s annual survey of fire departments, over the period of 2002 to 2005. This study period was selected due to the relative completeness of fire incident records nationwide, thus ensuring that the nationwide trends and patterns used in this analysis are representative of U.S. fire risks. Over the 2002 to 2005 study period, houses equipped with smoke alarms and a fire sprinkler system experienced 100 % fewer civilian fatalities, 57 % fewer civilian injuries, and 32 % less direct property losses and indirect costs resulting from fire than houses equipped only with smoke alarms. In addition, homeowners of dwellings with fire sprinkler systems received an added bonus of an 8 % reduction in their homeowner insurance premium per year, according ISO. This report finds the monetized value of a residential fire sprinkler system, over a 30-year analysis period, to yield homeowners $4994 in present value benefits (see Table ES-1). The quantified costs of a fire sprinkler system are based on the findings of NISTIR 7277: Economic Analysis of Residential Fire Sprinkler Systems. NISTIR 7277 documented the design and installation costs of four different fire sprinkler systems within the three prototypical house types used in this study. Of the alternative sprinkler systems examined in NISTIR 7277, the multipurpose network system was generally the least costly (life-cycle cost) across the three house types because it did not require a backflow preventer, which requires regular professional

ES-2
maintenance. The multipurpose network system was therefore selected as the fire sprinkler system analyzed in this study. The costs associated with installation of a multipurpose network sprinkler system are based on the minimum standard required by NFPA 13D: Standard for the Installation of Sprinkler Systems in One- and Two-Family Dwellings and Manufactured Homes. The three prototypical house types considered are: a 3338 ft2 (310 m2) two-story colonial with basement, but not including the garage; a 2257 ft2 (210 m2) three-story townhouse; and an 1171 ft2 (109 m2) single-story ranch. The present value costs of installation of a multipurpose network sprinkler system are estimated to be $2075 for the colonial, $1895 for the townhouse, and $829 for the ranch. Results of the benefit-cost analysis show that multipurpose network sprinkler systems are economical. The expected present value of net benefits (PVNB) is estimated to be $2919 for the colonial-style house, $3099 for the townhouse, and $4166 for the ranch-style house (see Table ES-1). These baseline (“best-guess”) estimates indicate that over the past two decades increases in fire sprinkler performance, coupled with the low life-cycle cost of a multipurpose network system, have made fire sprinklers cost-effective technologies for residential dwellings. With respect to multipurpose network systems, failing to install sprinkler systems in residential dwellings is no longer supported on economic grounds, at least from a homeowners’ perspective. Table ES-1. Summary of Baseline Benefit-Cost Analysis of a Multipurpose Network Residential Sprinkler System for the Colonial, Townhouse, and Ranch House.
Colonial Townhouse Ranch Benefits Fatalities Averted $3725.57 $3725.57 $3725.57 Injuries Averted 224.74 224.74 224.74 Direct Uninsured Property Losses Averted 79.64 79.64 79.64 Indirect Costs Averted 15.93 15.93 15.93 Insurance Credit 948.41 948.41 948.41 Benefit Subtotal 4994.29 4994.29 4994.29 Costs Installation (50 % Markup) 2075.08 1895.17 828.66 Costs Subtotal 2075.08 1895.17 828.66 Net Present Value $2919.20 $3099.11 $4165.62
Although the baseline analysis finds strong evidence of cost-effectiveness of residential fire sprinkler systems, a sensitivity analysis is performed to measure the variability of the results to changes in the modeling assumptions and to assess the robustness of the baseline findings. The analysis relies on a number of assumptions generated from NFIRS 5.0, and these assumptions contain a degree of uncertainty. For instance, over the 2002 to 2005 study period of the dwellings examined, wet-pipe sprinkler systems were present in only 0.2 % of all structure fires. Conducting a sensitivity analysis is important because the statistics used to summarize the characteristics of dwellings with sprinklers are drawn from a small segment of the population, and may be influenced by a few outlying, and unrepresentative, fire incidents. The key
ES-3
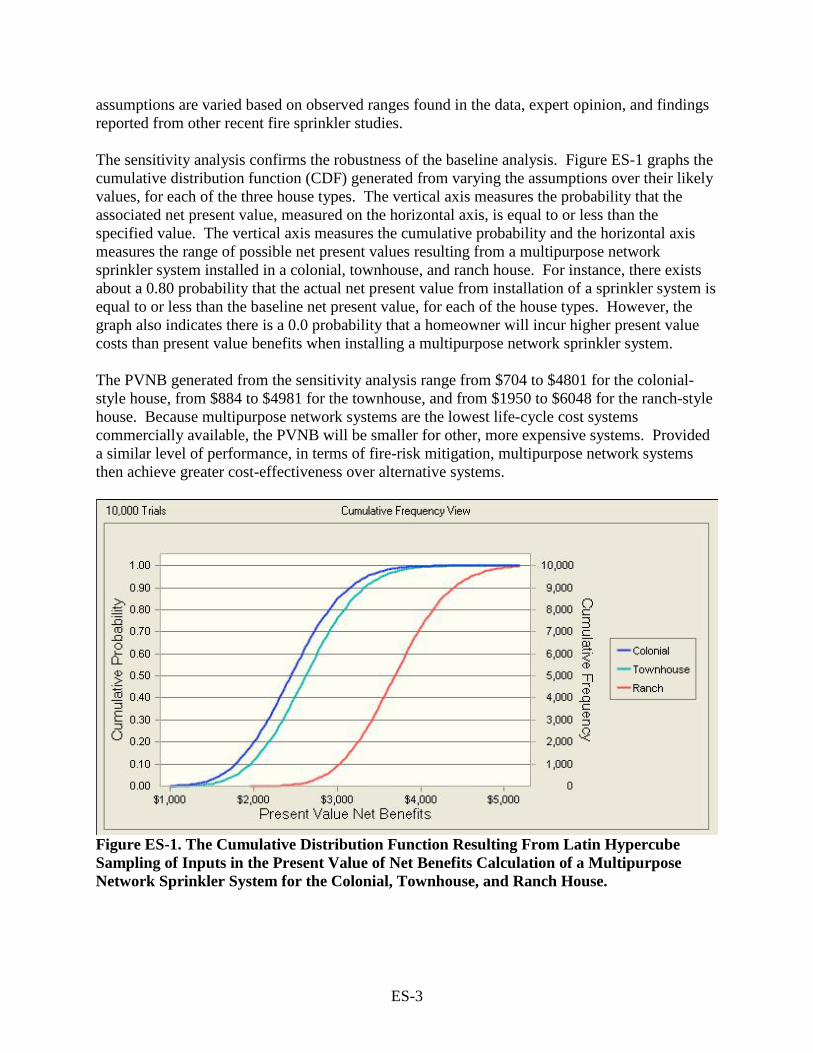
assumptions are varied based on observed ranges found in the data, expert opinion, and findings reported from other recent fire sprinkler studies. The sensitivity analysis confirms the robustness of the baseline analysis. Figure ES-1 graphs the cumulative distribution function (CDF) generated from varying the assumptions over their likely values, for each of the three house types. The vertical axis measures the probability that the associated net present value, measured on the horizontal axis, is equal to or less than the specified value. The vertical axis measures the cumulative probability and the horizontal axis measures the range of possible net present values resulting from a multipurpose network sprinkler system installed in a colonial, townhouse, and ranch house. For instance, there exists about a 0.80 probability that the actual net present value from installation of a sprinkler system is equal to or less than the baseline net present value, for each of the house types. However, the graph also indicates there is a 0.0 probability that a homeowner will incur higher present value costs than present value benefits when installing a multipurpose network sprinkler system. The PVNB generated from the sensitivity analysis range from $704 to $4801 for the colonial-style house, from $884 to $4981 for the townhouse, and from $1950 to $6048 for the ranch-style house. Because multipurpose network systems are the lowest life-cycle cost systems commercially available, the PVNB will be smaller for other, more expensive systems. Provided a similar level of performance, in terms of fire-risk mitigation, multipurpose network systems then achieve greater cost-effectiveness over alternative systems.
Figure ES-1. The Cumulative Distribution Function Resulting From Latin Hypercube Sampling of Inputs in the Present Value of Net Benefits Calculation of a Multipurpose Network Sprinkler System for the Colonial, Townhouse, and Ranch House.

ES-4

1
1. Introduction 1.1. Background According to the National Fire Protection Association (NFPA 2006), between 2002 and 2005, on average, there were 296 500 residential fires (one- and two-family dwellings), causing 10 188 civilian injuries and 2566 civilian deaths each year. These fires were responsible for $5.3 billion (in 2005 dollars) in direct residential property losses on average each year. Since the introduction of the residential sprinkler standard, NFPA 13D (Standard for the Installation of Sprinkler Systems in One- and Two- Family Dwellings and Manufactured Homes), in 1975, residential sprinkler systems have proven themselves as life-safety systems. According to the National Fire Sprinkler Association (NFPA), over 200 communities in the United States now have regulations requiring residential sprinkler systems. In studies of Scottsdale, Arizona1 and of Prince George’s County, Maryland (Siarnicki 2001), it was shown that residences with sprinkler systems suffered fewer deaths, injuries, and property damages than those without. In fact, no civilian fatalities were reported in residences with sprinkler systems in either study. But, while there is growing recognition of the ability of residential sprinkler systems to protect life and property from fires, less than 1 % of all existing one- and two-family dwellings involved in a structure fire in 2005 had a sprinkler system. Although residential sprinkler systems protect lives and property from fire, earlier research suggested that sprinkler systems were not cost-effective (Ruegg and Fuller 1984; Juas and Mattsson 1994). This might partly explain the dearth of fire sprinkler systems in residential dwellings. However, advancements in newer fire sprinkler technologies, of lower cost and improved performance, might be significant enough to improve the cost-effectiveness of these systems. 1.2. Purpose and Scope of Approach This report designs a benefit-cost analysis and applies it to a multipurpose network fire sprinkler system in new housing construction. The multipurpose network design connects to the house’s regular water supply and piping. This system, using cross-linked polyethylene (PEX) tubing, is evaluated because it yielded the minimum life-cycle cost alternative among the sprinkler systems currently available (Brown 2005). This benefit-cost analysis adds a benefits dimension to the economic analysis developed in Brown (2005). While the earlier study described and estimated life-cycle costs of installing fire sprinkler systems in residential housing, the current study conducts a benefit-cost analysis of residential sprinklers, using the expected benefits and costs, in present value dollars, associated with the installation of a multipurpose network fire sprinkler system in new construction. Both reports provide a current analysis of the cost-effectiveness of installing residential fire sprinkler
1 As reported by the Home Fire Sprinkler Coalition (2007).

2
systems, updating a prior National Bureau of Standards (NBS) publication, A Benefit-Cost Model of Residential Fire Sprinkler Systems (Ruegg and Fuller 1984). Section 2 briefly introduces benefit-cost analysis and presents the benefit-cost model framework; Section 3 documents and describes the data used to estimate the benefits and costs; Section 4 presents the results of the baseline (“best-guess”) benefit-cost analysis; Section 5 illustrates the sensitivity of the baseline results using a simulation of many of the parameters used to generate the baseline values; Section 6 summarizes the benefit-cost analysis results and makes recommendations for further research; Appendix A develops the benefit and cost equations needed to perform the benefit-costs analysis; Appendix B discusses the omitted benefits and costs associated with sprinkler installation and use that were not quantified.

3
2. Benefit-Cost Framework 2.1. Introduction to Benefit-Cost Analysis The benefit-cost analysis in this report is consistent with ASTM E 1074-06 Practice for Measuring Net Benefits for Investments in Buildings and Building Systems. The economic impacts to an individual homeowner from installing a fire sprinkler system in each of three prototypical single-family homes are organized and presented as benefits and costs. Benefits and costs that occur (or recur) at different times are not directly comparable. Therefore, these differently timed cash flows are made time equivalent by discounting them to a common point in time, usually to present values at the analysis date or the beginning of the relevant study period. The interest rate used for discounting, the discount rate, represents a minimum acceptable rate of return on investment. This report describes the benefits and costs in present value terms. The discount formulas for calculating the appropriate discount factors for the 30-year study period used here are consistent with those described in the Discount Factor Tables of the Adjunct to ASTM Practice E 917 of the ASTM Standards on Building Economics, 6th edition. 2.2. The Benefit-Cost Model This section describes benefit and cost variables. The generalized present value of net benefits equation (PVNB), adapted from ASTM, for comparing benefits and costs attributed to the addition of a sprinkler system to a house with only smoke alarms, is given by:
T
tttt
d
CBPVNB
0 1 (2-1)
where Bt is the dollar value of benefits in period t, Ct is the dollar value of costs in period t, T is the number of discounting time periods in the study period, d is the discount rate per time period. A positive PVNB implies the present value benefits outweigh the present value costs. The benefit and cost terms from Equation (2-1) can be decomposed into individual components. Present value benefits (PVB) can be expressed as:

4
PVOBPVIPPVILPVPLPVDI
d
OBIPILPLDI
d
B T
tt
tttttT
tt
t
00 11
where DI is the value of death and injury averted due to sprinkler use, PL is the value of reduced uninsured direct and non-reimbursable property loss due to
sprinkler use, IL is the value of reduced uninsured indirect and non-reimbursable costs due to sprinkler
use, IP is the value of reduced homeowner insurance premiums due to sprinkler use, OB is the expected value of other sprinkler benefits, such as savings from reduced local taxes
due to municipal cost reductions, and lower construction costs due to lower requirements for fire-resistant construction,
PV denotes present value. The present value costs (PVC) can be expressed as:
PVOCPVMPVOPPVPI
d
OCMOPPI
d
C T
tt
ttttT
tt
t
00 11
where PI is the purchase and installation cost of a sprinkler system, OP is the operating cost of a sprinkler system, M is the maintenance, repair, and replacement costs of a sprinkler system, OC is the other cost associated with sprinkler use. Appendix A presents the benefit and cost equations used to perform the benefit-costs analysis based on the data described in Section 3.

5
3. Data and Assumptions 3.1. Introduction This section presents the data sources and the manner in which the national fire statistics (e.g., probability of fire, number of deaths per fire in a residence with only smoke alarms, average direct damages resulting from a fire in a house with only smoke alarms) are used to generate data for analysis in this report. Section 3.2. presents an overview of the datasets used in the benefit-cost analysis. Sections 3.2.1 describes the U.S. Fire Administration’s National Fire Incident Reporting System 5.0 (NFIRS 5.0) dataset, which is the primary source of data driving the results. Section 3.2.2 describes the statistics reported by the National Fire Protection Association, that in conjunction with the NFIRS 5.0 data, we use to create the national statistics needed in this analysis. Section 3.2.2.1 details the data calibration process used to generate the national statistics and Section 3.3 summarizes the fire statistics. Section 3.4 provides an explanation of how we derived the values of a statistical life and injury averted due to fire sprinkler use, which are two of the major benefits of fire sprinkler systems. Section 3.5 details the costs associated with the installation of a multipurpose network sprinkler system in the colonial, townhouse, and ranch house. The data presented throughout this section provide the required inputs to the baseline (“best-guess”) benefit-cost analysis, shown in Section 4, and for the sensitivity analysis found in Section 5. 3.2. Data Sources This section presents the data sources and the manner in which the national fire statistics (e.g., probability of fire, number of deaths per fire in a residence with only smoke alarms, average direct damages resulting from a fire in a house with only smoke alarms) are used to generate data for analysis in this report (Section 4 presents the findings). The two main sources of data used are the U.S. Fire Administration’s National Fire Incident Reporting System 5.0 (NFIRS 5.0) for the years 2002 through 2005, and statistics derived from the National Fire Protection Association’s annual nationwide survey of fire departments. Other data used include the U.S. Census Bureau’s American Housing Survey (AHS) and information from ISO and the Insurance Information Institute regarding insurance premium data. The AHS estimates the number of single-family houses in the U.S. for the years 1997, 1999, 2001, 2003, and 2005. Sprinkler system cost data rely on the estimates developed in Brown (2005). All dollars presented in this report are in 2005 adjusted dollars.2 The NFIRS 5.0 data contain incident information of fires occurring within one- and two-family dwellings. We use this data to generate a number of statistics (e.g., civilian fatality rate for houses with only smoke alarms and civilian fatality rate for houses with smoke alarms and a sprinkler system) required for the benefit-cost analysis. Nationwide fire statistics reported by NFPA, based on their annual survey of fire departments, are used to calibrate the NFIRS 5.0 statistics, making the NFIRS 5.0 generated statistics more representative of nationwide patterns
2 Using Bureau of Labor Statistics (BLS) Consumer Price Index (CPI) data, available at bls.gov.

6
(see 3.1.2.1). We use the number of single-family houses in the U.S., as reported in the AHS, with the yearly NFPA fire incident estimates to estimate the annual probability of fire incident in single-family dwellings. 3.2.1. National Fire Incident Reporting System 5.0 Since 1977, the U.S. Fire Administration has been collecting emergency response incident data from fire departments. Participating local fire departments submit incident data to their State reporting authority, which reports to the U.S. Fire Administration’s National Fire Data Center. While reporting is voluntary, it has grown over time. In 2005, NFIRS 5.0 contained 89 % of all single-family fire incidents in the U.S. NFIRS 5.0 is the most complete nationwide fire incident dataset known. The data contained within NFIRS 5.0 is quite detailed and provides a rich accounting of fire incidents in the U.S., including information regarding the ignition and structure ignited, reported casualties, and property losses. NFIRS 5.0 data also contain information regarding the presence of smoke alarms and sprinkler systems within the structures involved in a fire. Fire incident statistics, needed in the estimation of the benefits, are compiled over the years 2002 to 2005 (see Table 3-1). The years 2002 to 2005 are chosen given the relative completeness of nationwide reporting to NFIRS 5.0 during that period. Table 3-1. Comparison of One- and Two- Family Dwelling Fire Incidents Reported to NFIRS 5.0 with One- and Two-Family Dwelling Fire Incidents Estimated by NFPA from 2002 to 2005.
Year NFPA Estimate* NFIRS 5.0 Reported Percent Reporting 2002 300 500 165 816 55 % 2003 297 000 207 039 70 % 2004 301 500 224 076 74 % 2005 287 000 254 555 89 %
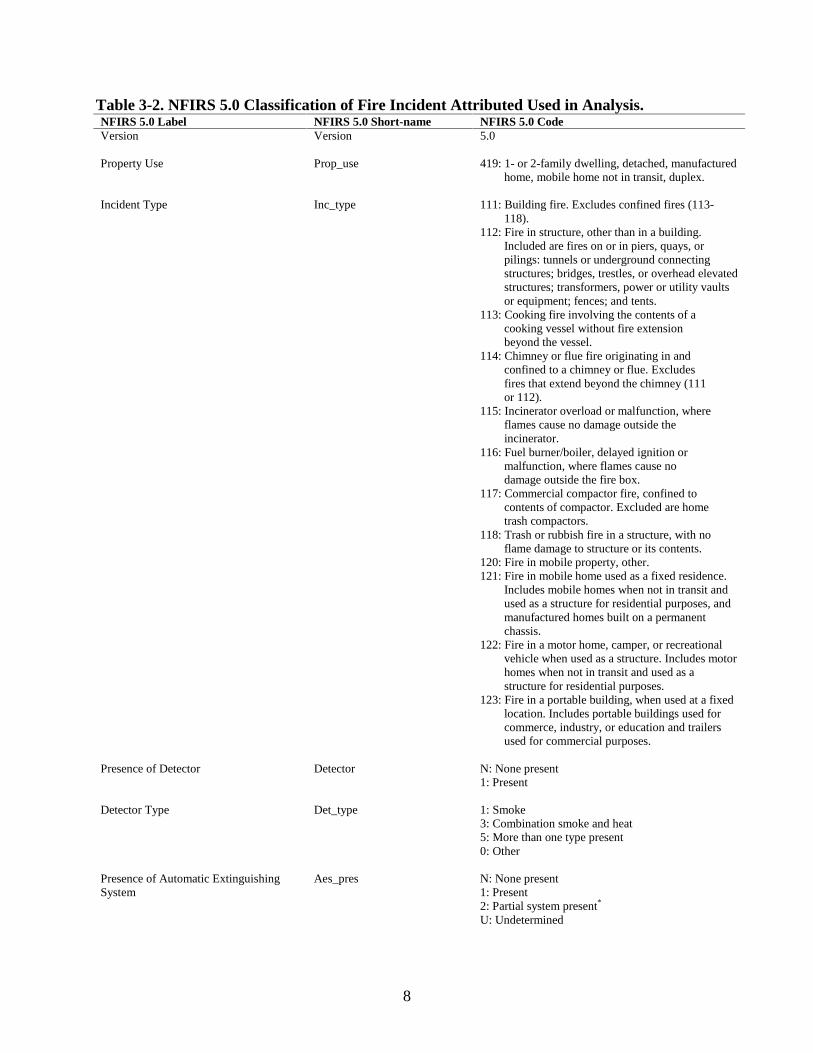
*The U.S. Fire Problem: One- and Two-Family Dwellings Fires (NFPA 2006) NFIRS 5.0 fire incidents are filtered to analyze structure fires occurring in one- and two-family dwellings (including mobile and manufactured houses), and those not under construction (see Table 3-2 for corresponding NFIRS 5.0 classification of incident characteristics used in this analysis). Further, dwellings with unknown information regarding the fire detector and detector type are excluded. Dwellings with either heat or sprinkler water flow detectors are also excluded (as suggested by Hall 2007)—in this analysis, we are interested in comparing the relative safety performance between houses equipped only with smoke alarms (the most common fire detection device) with houses with both smoke alarms and a fire sprinkler system. Three types of one- and two-family dwellings are examined—those with no smoke alarms, those with only smoke alarms, and those with smoke alarms and a wet-pipe sprinkler system (see Table 3-3 for corresponding NFIRS 5.0 classification). The multipurpose network sprinkler, the focus of this benefit-cost analysis, is a wet-pipe system. Because NFIRS 5.0 does not

7
differentiate between wet-pipe systems (i.e., multipurpose network system versus a stand alone system), we assume that all wet-pipe systems perform similarly.
8
Table 3-2. NFIRS 5.0 Classification of Fire Incident Attributed Used in Analysis. NFIRS 5.0 Label NFIRS 5.0 Short-name NFIRS 5.0 Code Version
Version 5.0
Property Use Prop_use 419: 1- or 2-family dwelling, detached, manufactured home, mobile home not in transit, duplex.
Incident Type Inc_type 111: Building fire. Excludes confined fires (113- 118). 112: Fire in structure, other than in a building. Included are fires on or in piers, quays, or pilings: tunnels or underground connecting structures; bridges, trestles, or overhead elevated structures; transformers, power or utility vaults or equipment; fences; and tents. 113: Cooking fire involving the contents of a cooking vessel without fire extension beyond the vessel. 114: Chimney or flue fire originating in and confined to a chimney or flue. Excludes fires that extend beyond the chimney (111 or 112). 115: Incinerator overload or malfunction, where flames cause no damage outside the incinerator. 116: Fuel burner/boiler, delayed ignition or malfunction, where flames cause no damage outside the fire box. 117: Commercial compactor fire, confined to contents of compactor. Excluded are home trash compactors. 118: Trash or rubbish fire in a structure, with no flame damage to structure or its contents. 120: Fire in mobile property, other. 121: Fire in mobile home used as a fixed residence. Includes mobile homes when not in transit and used as a structure for residential purposes, and manufactured homes built on a permanent chassis. 122: Fire in a motor home, camper, or recreational vehicle when used as a structure. Includes motor homes when not in transit and used as a structure for residential purposes. 123: Fire in a portable building, when used at a fixed location. Includes portable buildings used for commerce, industry, or education and trailers used for commercial purposes.
Presence of Detector Detector N: None present 1: Present
Detector Type Det_type 1: Smoke 3: Combination smoke and heat 5: More than one type present 0: Other
Presence of Automatic Extinguishing System
Aes_pres N: None present 1: Present 2: Partial system present*
U: Undetermined

9
Type of Automatic Extinguishing System
Aes_type 1: Wet-pipe sprinkler
Building Status Struc_stat 2: Occupied and operating 3: Idle, not routinely used 4: Under major renovation 5: Vacant and secured 6: Vacant and unsecured 7: Being demolished 0: Other
*This option is only available for 2005. Table 3-3. NFIRS 5.0 Classification of Types of Fire Systems Analyzed. Fire System NFIRS 5.0 Codes None Detector Type (Det_type) = N (none present)
Only Smoke Alarm Detector Type (Det_type) = 1 (present)
Presence of Automatic Extinguishing System (Aes_pres) = N (none present)
Smoke Alarm and Wet-Pipe Sprinkler System
Detector Type (Det_type) = 1 (present) Type of Automatic Extinguishing System (Aes_type) = 1 (wet-pipe sprinkler)
3.2.2. National Fire Protection Association Using the NFIRS 5.0 incident data to generalize statistics for the U.S. may introduce some degree of systematic bias because reporting is voluntary, rather than collected randomly using statistical design. Thus, to create national estimates of fire incident statistics using the NFIRS 5.0 data, we use data collected as part of NFPA’s annual survey of fire departments across the country to supplement the NFIRS 5.0 data. The NFPA survey uses a statistical design to randomly sample 3000 fire departments each year (Ahrens 2007), thus ensuring accurate nationwide statistics. From the survey, NFPA provides national estimates of the number of incidents, the number of civilian deaths and injuries, and direct property losses. We use these national estimates to calibrate other statistics derived from NFIRS 5.0 (e.g., statistics on sprinkler use and effectiveness), so to ensure that these statistics are also more representative of national trends and patterns. 3.2.2.1. Calibration and Scaling Ratios Calibration techniques, as developed in Hall and Harwood (1989), and used by NFPA and USFA, adjust the statistics generated from NFIRS 5.0 through the use of scaling ratios. Scaling ratios are calculated for fire incidents, civilian fatalities, civilian injuries, and direct property losses for years 2002 through 2005 (see Table 3-4). These scaling ratios allow calibration of the NFIRS 5.0 data to produce more accurate estimates of sprinkler use and effectiveness for the U.S.
10
Table 3-4. Scaling Ratios Used to Project Attributes of the 2002 to 2005 NFIRS 5.0 One- and Two-Family Dwelling Fire Incidents into National Estimates.
Year Fire Incident Scaling Ratio
Civilian Fatality Scaling Ratio
Civilian Injury Scaling Ratio
Property Loss Scaling Ratio
2002 8.46 (12.10) 6.48 5.40 8.39 2003 6.07 (8.47) 6.05 3.97 6.28 2004 5.33 (7.34) 4.86 3.98 4.87 2005 4.33 (5.74) 4.78 3.54 4.34
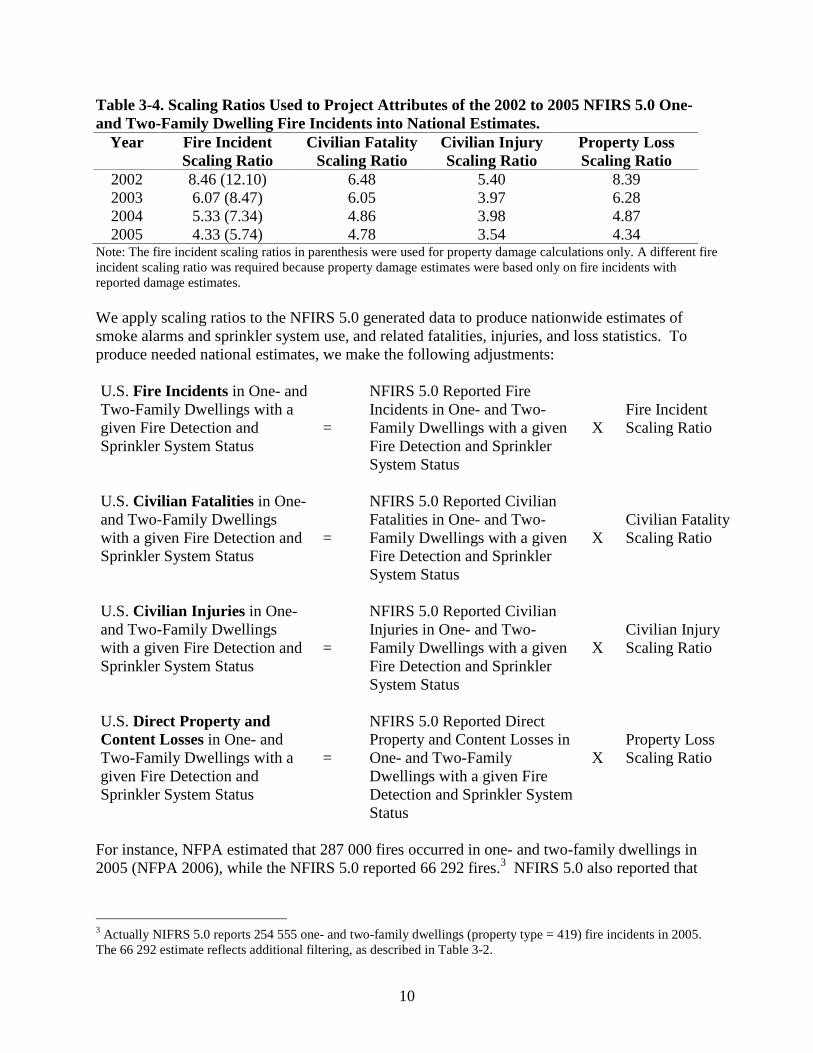
Note: The fire incident scaling ratios in parenthesis were used for property damage calculations only. A different fire incident scaling ratio was required because property damage estimates were based only on fire incidents with reported damage estimates. We apply scaling ratios to the NFIRS 5.0 generated data to produce nationwide estimates of smoke alarms and sprinkler system use, and related fatalities, injuries, and loss statistics. To produce needed national estimates, we make the following adjustments: U.S. Fire Incidents in One- and Two-Family Dwellings with a given Fire Detection and Sprinkler System Status
=
NFIRS 5.0 Reported Fire Incidents in One- and Two-Family Dwellings with a given Fire Detection and Sprinkler System Status
X
Fire Incident Scaling Ratio
U.S. Civilian Fatalities in One- and Two-Family Dwellings with a given Fire Detection and Sprinkler System Status
=
NFIRS 5.0 Reported Civilian Fatalities in One- and Two-Family Dwellings with a given Fire Detection and Sprinkler System Status
X
Civilian Fatality Scaling Ratio
U.S. Civilian Injuries in One- and Two-Family Dwellings with a given Fire Detection and Sprinkler System Status
=
NFIRS 5.0 Reported Civilian Injuries in One- and Two-Family Dwellings with a given Fire Detection and Sprinkler System Status
X
Civilian Injury Scaling Ratio
U.S. Direct Property and Content Losses in One- and Two-Family Dwellings with a given Fire Detection and Sprinkler System Status
=
NFIRS 5.0 Reported Direct Property and Content Losses in One- and Two-Family Dwellings with a given Fire Detection and Sprinkler System Status
X
Property Loss Scaling Ratio
For instance, NFPA estimated that 287 000 fires occurred in one- and two-family dwellings in 2005 (NFPA 2006), while the NFIRS 5.0 reported 66 292 fires.3 NFIRS 5.0 also reported that
3 Actually NIFRS 5.0 reports 254 555 one- and two-family dwellings (property type = 419) fire incidents in 2005. The 66 292 estimate reflects additional filtering, as described in Table 3-2.

11
36 223 houses contained only smoke alarms (no sprinkler system) and that 143 houses contained smoke alarms and a wet-pipe sprinkler system. To project, into national estimates, the number of houses with only smoke alarms, and those with smoke alarms and a sprinkler system, we multiply the NFIRS 5.0 generated numbers by the scaling ratios. The fire incident scaling ratio (shown in Table 3-4) is calculated by dividing the NFPA estimated number of fire incidents by the NFIRS 5.0 generated estimate (287 000/66 292 = 4.33). Multiplying the fire incident scaling ratio (4.33) by the number of NFIRS 5.0 house fires in houses with only smoke alarms (36 223) produces a national estimate of house fires in houses with only smoke alarms present of 156 846.4 Likewise, multiplying the fire incident scaling ratio (4.33) by the number of NFIRS 5.0 house fires in houses with smoke alarms and a wet-pipe sprinkler system (143) produces a national estimate of 619 house fires in houses with smoke alarms and a wet-pipe sprinkler system. 3.3. National Fire Statistics Sprinkler systems have been designed to reduce the numbers of fatalities, injuries, and property damage resulting from structure fires. Thus residents of single-family dwellings (the focus of this study) benefit from the risk reduction of fire induced civilian fatalities, civilian injuries, and property damages (structure and content loss). To determine the expected benefits of sprinkler use, measures of risk reduction must be quantified. We summarize some of the fire statistics required for the analysis below. 3.3.1. Statistics On average, over the 2002 to 2005 study period, 36 out of 10 000 single-family houses caught fire each year in the U.S. (Table 3-5). This translates into 296 500 house fires each year, resulting in 2566 civilian fatalities and 10 188 civilian injuries (NFPA 2006). Direct property loss, due to property and content destruction, averaged $5346 million each year, which amounted to $18 052 per fire. So for every 10 000 single-family house fires that occurred, 87 civilians died, another 344 were injured, and $180.5 million in property losses was sustained. See Tables 3-5 and 3-6. Dwellings without smoke alarms experienced 125 171 fires per year, which amounted to 42 % of the total, on average. Civilian fatalities and injuries occurred at an average rate of 95 and 273 people per 10 000 fires, respectively. Per fire direct property loss amounted to another $13 344 in fire-related damages. See Tables 3-5 and 3-6. Dwellings with only smoke alarms suffered more fires, a higher rate of civilian injuries, and greater property loss, on average, than dwellings without smoke alarms. These differences likely had less to do with smoke alarms, per se, than in underlying differences between dwellings with smoke alarms and those without. On the other hand, dwellings with smoke alarms had a lower average civilian fatality rate than those without (82 fatalities per 10 000 fires compared to 95). See Tables 3-5 and 3-6. 4 Due to rounding, this number differs from the more precise estimate shown in Table 3-6.

12
Dwellings with smoke alarms and a wet-pipe sprinkler system had on average lower civilian fatality and injury rates, and property damage per fire than dwellings with only smoke alarms. Over the study period, 2002 to 2005, there were no reported civilian fatalities in one- and two-family dwellings (a 100 % reduction in fatalities from houses without a wet-pipe sprinkler system). The average rate of civilian injuries was also lower in dwellings with smoke alarms and wet-pipe sprinklers: 174 injuries per 10 000 fires compared to 403 injuries (a 57 % reduction). Direct property damages averaged $15 028 per fire, a 32 % reduction over dwellings with only smoke alarms. However, caution should be made before assuming that reductions in the rate of civilian fatalities and injuries, and direct property damage are fully attributed to the presence of a wet-pipe sprinkler system, just as in the case of comparing dwellings without smoke alarms to dwellings with smoke alarms. Causation can be inferred only if dwellings with only smoke alarms were similar in other attributes to dwellings with smoke alarms and a wet-pipe sprinkler system (other than the presence of a wet-pipe sprinkler system). Such a determination is difficult given the data available, and beyond the scope of this analysis. The reader is only made aware of this issue, so as to interpret the results appropriately.

13
Table 3-5. National Estimates of Fires and Probability of Ignition Occurrence in One- and Two-Family Dwellings. Fires1 Houses2 Ignition Probability
2002 300 500 81 660 500 0.0037 2003 297 000 82 143 000 0.0036 2004 301 500 83 446 000 0.0036 2005 287 000 84 749 000 0.0034 Mean 296 500 82 999 625 0.0036
1As reported by NFPA (NFPA 2006), for one- and two-family dwellings. 2As reported by U.S. Census Bureau, American Housing Survey (U.S. Census 2007), for single-family structures. Years 2002 and 2004 were linearly interpolated using 2001 and 2003, and 2003 and 2005 data, respectively. Table 3-6. National Estimates of One- and Two-Family Dwelling Fires, Civilian Fatality and Injury Rate for 2002 to 2005, Using NFIRS 5.0/NFPA Adjusted Data, for Dwellings with Different Fire Technology (No Smoke Alarms [none], Only Smoke Alarms [smoke], and Smoke Alarms and a Wet-Pipe Sprinkler System [sprinkler]).
Fires Civilian Fatality Rate Civilian Injury Rate All1 None Smoke Sprinkler All None Smoke Sprinkler All None Smoke Sprinkler
2002 300 500 125 770 171 913 381 0.0076 0.0089 0.0067 0.0000 0.0331 0.0284 0.0367 0.0284 2003 297 000 126 029 166 492 546 0.0092 0.0106 0.0084 0.0000 0.0337 0.0262 0.0397 0.0146 2004 301 500 125 423 166 754 415 0.0089 0.0090 0.0090 0.0000 0.0348 0.0270 0.0414 0.0096 2005 287 000 123 460 156 821 619 0.0090 0.0095 0.0087 0.0000 0.0359 0.0276 0.0434 0.0172 Mean 296 500 125 171 165 495 490 0.0087 0.0095 0.0082 0.0000 0.0344 0.0273 0.0403 0.0174
1As reported by NFPA (NFPA 2006). Table 3-7. National Direct Property Loss Estimates Resulting From One- and Two-Family Dwelling Fires for 2002 to 2005, Using NFIRS 5.0/NFPA Adjusted Data, for Dwellings with Different Fire Technology (No Smoke Alarms [none], Only Smoke Alarms [smoke], and Smoke Alarms and a Wet-Pipe Sprinkler System [sprinkler]).
Total Direct Property Loss1 Direct Property Loss Per Fire ($) ($ million) All None Smoke Sprinkler
2002 5455 18 155 14 241 20 939 25 716 2003 5051 17 007 12 716 22 044 1672 2004 5096 16 904 11 491 20 774 17 304 2005 5781 20 143 14 928 24 202 15 419 Mean 5346 18 052 13 344 21 990 15 028
1Reported by NFPA (NFPA 2006) and adjusted to 2005 $.

14
3.4. Value of Fatality and Injury Averted Assigning a dollar value to a statistical life or injury averted has become a generally accepted part of economic methodology. The magnitude of the values are often a critical input to economic analysis because a reduction of the risk of death or injury may be a substantial benefit component. However, empirical estimates of the value of life continue to be subject to controversy and inconsistency. For example, basing the value of a life on the present value of earnings potential—a measure that is sometimes used—tends to result in comparatively low values for the young and the old and, in our present economy, for women and non-Caucasians. Using court-assigned values for death, pain, and injury inflicted—another approach—results in widely variable amounts. The value of saving lives and reducing pain and injury implicitly assigned by other government programs also vary widely among programs and projects.5 3.4.1. Value of a Statistical Life One approach that is considered to be consistent with economic theory, and which was used in a 1984 sprinkler study performed by NBS (Ruegg and Fuller 1984), is based on the willingness-to-pay concept. Willingness-to-pay values are computed according to how much decision makers are willing to invest to reduce their risk of death or injury by a certain fraction. Using evidence on labor and product market choices that involve implicit tradeoffs between risk and wage or between risk and price, economists have developed estimates of the value of a statistical life (VSL) typically ranging from $4 million to $9 million with a median value of about $7 million (in 2000 dollars) (Viscusi and Aldy 2003). The inflation adjusted median value of a statistical life, $7.94 million (in 2005 dollars), is used in this report.6 3.4.2. Value of Injury Averted The same willingness-to-pay approach that is used to estimate the value of a statistical life saved can be used to estimate the value of an injury averted. In a survey of 31 studies from the U.S. labor market and eight studies of labor markets outside the United States, Viscusi and Aldy (2003) found estimates ranging up to $191 000 with most of the estimates between $20 000 and $70 000 (in 2000 dollars). The U.S. estimates are mostly based on job-related injury rates and lost workday rates from the Bureau of Labor Statistics and not specifically on fire-related injuries. The U.S. Consumer Product Safety Commission (CPSC) recently conducted two studies of residential fire injuries associated with mattresses and upholstered furniture. These two studies found estimates of $150 000 (in 2005 dollars) per injury from fires involving mattresses and $187 000 (in 2004 dollars) per injury from fires involving upholstered furniture (Zamula 2005). CPSC therefore recommended the amounts of $150 000 and $187 000 as reasonable and reliable
5 For a discussion of approaches to measuring the value of deaths and injuries averted, and deficiencies in these approaches, see E. J. Mishan, “Evaluation of Life and Limb: A Theoretical Approach,” Journal of Political Economy, July-August 1971, pp. 687-705; or M. W. Jones-Lee, The Value of Life: An Economic Analysis (Chicago, IL: University of Chicago Press, 1976). 6 This report provides background on recent research on the value of life, without suggesting that it is the only, or most appropriate value.

15
estimates of the value of a fire-related injury averted (Zamula 2004; Zamula 2005; Ray et al. 1993). As the value of an injury averted, the inflation adjusted middle value between CPSC studies on mattresses and upholstered furniture is used in this report, $171 620. 3.5. Costs of a Residential Multipurpose Network Sprinkler System The cost information draws on material developed in a previous NIST report by Brown (2005), Economic Analysis of Residential Fire Sprinkler Systems, NISTIR 7277. Brown (2005) focused on the estimated costs to the homeowner of installing a sprinkler system. The system selected for this study is multipurpose network into the existing cold-water plumbing system. It is chosen because of its lowest life-cycle cost compared to other systems. The cost estimations in this section are based largely on Brown’s (2005) analysis, where designs and costs were provided by experts in sprinkler system design and installation. Each expert itemized the components necessary for his or her installation and provided bare material costs. Design costs were estimated in either dollar terms or in hours. The installation cost was estimated from the labor hours necessary to install the sprinkler systems. The experts who provided these tables were asked to identify all items that should be included in a system that meets NFPA 13D. Costs specifically excluded were: service entrance materials from the water main to the distribution manifold, domestic hot and cold water plumbing system piping and material, final connections to plumbing fixtures, and hose bibs. Certain situations require additional costs. For example a small number of jurisdictions might require a separate water system to the curb, perhaps even including a water meter. Rural developments might be unable to meet requirements without installing a tank, pump, and backup electric generator. While these situations could arise, they were not considered typical and therefore costs related to these scenarios were not estimated. The level of protection was based on the minimum standard required by NFPA 13D. Some bathrooms and closets, for example, are not required to be covered. Experts used different types of pipe layouts and sprinkler heads to achieve the NFPA standard. Therefore, there was variation over the scenarios in the number of sprinkler heads and the length and type of pipe required. To the extent that extraneous costs—costs for items not required by NFPA 13D—were identified, they were removed from analysis. For example, this report removes the cost of extra sprinkler heads and cabinet exceeding the minimum requirements of NFPA 13D from the original estimates made by Brown (2005). Brown (2005) researched the expected life of each sprinkler systems’ components. Replacement costs would only be incurred when major system components wear out. The entire system will generally last the life of the plumbing system, estimated to be in excess of 30 years, the length of the study period for this analysis. Therefore, no system replacement costs are included.

16
The following tables (3-8, 3-9, 3-10) present the required materials, labor, and costs of the multipurpose network system when installed in three house scenarios: a 3338 ft2 (310 m2) two-story colonial with basement, a 2257 ft2 (210 m2) three-story townhouse, and a 1171 ft2 (109 m2) single-story ranch.7 Each table itemizes the material and labor costs for a single cost estimation. The Material category includes the subcategories of Fire Sprinklers, Pipe and Fittings, and Accessories. Labor includes Design and Installation Labor. The total Material and Labor cost estimate is shown at the bottom right of the table. Tables 3-8, 3-9, and 3-10 detail the estimated cost of installing the multipurpose network system using crosslinked polyethylene (PEX) in a colonial house, townhouse and ranch house. This system was designed using a 65 lbf/in2 (448 kPa) static water supply, but is valid to as low as 45 lbf/in2 (310 kPa). The multipurpose network layout is installed as a system and includes the cold-water piping for the houses. Therefore, a correction has been applied to remove the costs related to the domestic cold water system. Without a backflow preventer, all major maintenance and inspection requirements can be performed by a homeowner. Because the candidate least-costly system, as identified by Brown (2005) had no backflow preventer, we regarded this a reasonable assumption. Because inspection can be accomplished by the homeowner, it is not included in the cost estimate.
7 The colonial square footage does not include the garage.

17
Table 3-8. Cost Summary: Multipurpose Network System Using PEX for a New 3338 ft2 (310 m2) Single Family Colonial House.
Sprinkler System Cost Component Quantity Units
Bare material Cost Per Unit
Total Bare Material Cost Labor Cost
Combined Material & Labor Cost
Material Fire Sprinklers F1/Res 49 (155 °F) (68.3 °C) Recessed Pendent Assembly, White
24 each $25.03 $600.60
Pipe and Fittings ½ in (12.7 mm) PEX - white, 1000 ft (304.8 m) coil 1 1000 ft. 270.00 270.00 ½ in ( 12.7 mm) PEX - white, 300 ft ( 91.44 m) coil 1 300 ft. 81.00 81.00 1 in (25.4 mm) Copper Branch Manifold, 10 outlets 1 each 26.63 26.63 PEX Ring ½ in (12.7 mm) (blue print) 150 each 0.06 8.25 PEX Brass Tee, ½ in (12.7 mm) PEX x ½ in (12.7 mm) PEX
10 each 1.45 14.50
Accessories Hangers (½ in [12.7 mm], 5/8 in [15.875 mm], ¾ in [19.05 mm] PEX)
4 each 5.95 23.80
Total Bare Material Cost 1024.78
Labor Design Cost (4 h at $40.00/h) $160.00 Labor Cost (13 h at $50.31/h) 654.03 Total Labor Cost 814.03
Totals Total Material and Labor Cost $1838.81 Total Material and Labor Cost without cold water system ( 117.00 ) ( 100.62 ) 1621.19 Where possible, generic product descriptions have been substituted for product trade names. Material prices do not include any markup to cover overhead and profit. Labor cost is based on manufacturer’s estimation that it would take a 2 person crew 13 h total to install the system. The sprinkler fitter and plumber trades are estimated at $50.31/h (2007 National Construction Estimator, accessed at www.get-a-quote.net). Design cost of $40/h is provided by manufacturer. Extra sprinkler heads and cabinet exceeding the minimum requirements of NFPA 13D were removed from original estimate. For the estimate without the cold water system, one-third of the combined pipe and 2 h of installation labor are subtracted. Source: This table is based on NISTIR 7277, Economic Analysis of Residential Fire Sprinkler Systems (Brown 2005, page 11); however, the labor cost has been changed to $50.31.

18
Table 3-9. Cost Summary: Multipurpose Network System Using PEX for a New 2257 ft2 (210 m2) Single Family Townhouse. Sprinkler System Cost Component Quantity Units
Bare Material Cost Per Unit
Total Bare Material Cost Labor Cost
Combined Material & Labor Cost
Material Fire Sprinklers F1/Res 49 (155 °F) (68.3 °C) Recessed Pendent Assembly, White
22 each $25.03 $550.55
Pipe and Fittings ½ in (12.7 mm) PEX - white, 1000 ft (304.8 m) coil 1 1000 ft. 270.00 270.00 ½ in (12.7 mm) PEX - white, 100 ft (30.48 m ) coil 1 100 ft. 27.00 27.00 1 in (25.4 mm) Copper Branch Manifold, 12 outlets 1 each 32.23 32.23 PEX Ring ½ in (12.7 mm) (blue print) 150 each 0.06 8.25 PEX Brass Tees, ½ in (12.7 mm) PEX x ½ in (12.7 mm) PEX
10 each 1.45 14.50
Accessories Hangers (½ in [12.7 mm], 5/8 in [15.875 mm], ¾ in [19.05 mm] PEX)
3 each 5.95 17.85
Total Bare Material Cost 920.38
Labor Design Cost (4 h at $40.00/h) $160.00 Labor Cost (12 h at $50.31/h) 603.72 Total Labor Cost 763.72
Totals Total Material and Labor Cost $1684.10 Total Material and Labor Cost without cold water system ( 99.00 ) ( 100.62 ) 1484.48 Where possible, generic product descriptions have been substituted for product trade names. Material prices do not include any markup to cover overhead and profit. Labor cost is based on manufacturer’s estimation that it would take a 2 person crew 12 h total to install the system. The sprinkler fitter and plumber trades are estimated at $50.31/h (2007 National Construction Estimator, accessed at www.get-a-quote.net). Design cost of $40/h is provided by manufacturer. Extra sprinkler heads and cabinet exceeding the minimum requirements of NFPA 13D were removed from original estimate. For the estimates without the cold water system, one-third of the combined pipe and 2 h of installation labor are subtracted. Source: This table is based on NISTIR 7277, Economic Analysis of Residential Fire Sprinkler Systems (Brown 2005, page 12); however, the labor cost has been changed to $50.31.

19
Table 3-10. Cost Summary: Multipurpose Network System Using PEX for a New 1171 ft2 (109 m2) Single Family Ranch House.
Sprinkler System Cost Component Quantity Units
Bare Material Cost Per Unit
Total Bare Material Cost
Labor Cost
Combined Material & Labor Cost
Material Fire Sprinklers F1/Res 49 (155 °F) (68.3 °C) Recessed Pendent Assembly, White
9 each $25.03 $225.23
Pipe and Fittings ½ in (12.7 mm) PEX plus - white, 300 ft (91.44 m) coil 1 300 ft. 81.00 81.00 ½ in (12.7 mm) PEX plus - white, 100 ft (3.048 m) coil 1 100 ft. 27.00 27.00 1 in (25.4 mm) Copper Branch Manifold, 8 outlets 1 each 21.98 21.98 PEX Ring ½ in (12.7 mm) (blue print) 100 each 0.06 5.50 PEX Brass Tees, ½ in (12.7 mm) PEX x ½ in (12.7 mm) PEX
10 each 1.45 14.50
Accessories Hangers (½ in [12.7 mm], 5/8 in [15.875 mm], ¾ in [19.05 mm] PEX)
1 each 5.95 5.95
Total Bare Material Cost 381.16
Labor Design Cost (4 h at $40.00/h) $160.00 Labor Cost (5 h at $50.31/h) 251.55 Total Labor Cost 411.55
Totals Total Material and Labor Cost $792.71 Total Material and Labor Cost w/o cold water system ( 36.00 ) (100.62 ) 656.09 Where possible, generic product descriptions have been substituted for product trade names. Material prices do not include any markup to cover overhead and profit. Labor cost is based on manufacturer’s estimation that it would take a 2 person crew 12 h total to install the system. The sprinkler fitter and plumber trades are estimated at $50.31/h (2007 National Construction Estimator, accessed at www.get-a-quote.net). Design cost of $40/h is provided by manufacturer. Extra sprinkler heads and cabinet exceeding the minimum requirements of NFPA 13D were removed from original estimate. For the estimates without the cold water system, one-third of the combined pipe and 2 h of installation labor are subtracted. Source: This table is based on NISTIR 7277, Economic Analysis of Residential Fire Sprinkler Systems (Brown 2005, page 13); however, the labor cost has been changed to $50.31.

20

21
4. Baseline Benefit-Cost Analysis of Multipurpose Network Sprinkler Systems in Residential Dwellings 4.1. Introduction This section applies the data reported in Section 3, using the benefit-cost framework discussed in Section 2, to estimate the present value of net benefits of installation of a multipurpose network sprinkler system in a residential dwelling. The benefits estimated in this analysis include: (1) reduced risk of civilian fatalities; (2) reduced risk of civilian injuries; (3) reduced expectation of uninsured direct property loss; (4) reduced expectation of uninsured indirect costs; and (5) reduced homeowner insurance premiums. The costs used in this analysis include the installation cost of the multipurpose network sprinkler system and are based on Brown’s (2005) estimates. Results are presented as the present value of net benefits (PVNB) of installing residential fire sprinkler systems and are summarized in Table 4-4. The uniform present worth factor of 15.729 (see Appendix A for formula) for annually recurring amounts is based on a 30-year study period and a real discount rate of 4.8 %, which reflects the real, after-tax annual rate of return on large-cap stocks over the period 1925 to 2005 (Ibbotson 2005). In the cases for fatalities, injuries, and property losses, no difference in benefits is estimated for the occupant and the owner of a rental unit. This is because it is assumed that the owner of a rental unit will receive benefits equivalent in amount to those of the occupant through a rent premium that reflects the tenant’s benefit of reduced risk of indirect costs. 4.2. Estimated Benefits of Multipurpose Network Sprinkler Systems in Residential Dwellings Table 4-1 summarizes the data used to calculate the present value benefits for the five classes of benefits described in Sections 4.2.1 through 4.2.5. It includes benefits from fatalities averted, injuries averted, direct property losses averted, indirect costs averted, and an insurance credit due to sprinkler use within residential properties. Appendix A discusses how the calculations are made and are based on the statistics reported in Section 3. Installation of a sprinkler system is expected to yield a present value benefit of $4994, over the 30-year study period. Each benefit component is detailed below. 4.2.1. Fatalities Averted One- and two-family dwellings with a wet-pipe sprinkler system were found to have zero reported fatalities over the study period 2002 to 2005. However, field tests indicate sprinklers fail to activate 3 % of the time (Hall 2007), so a 100 % reduction in fatalities, over dwellings with only smoke alarms, may be too optimistic. Section 5 deals with this uncertainty and its effects on the results. As discussed in the previous section, the value of a fatality averted is

22
estimated at $7.94 million. Thus, a 100 % reduction in fatality rate results in an expected present value benefit of $3726 per dwelling fire.

23
Table 4-1. Calculation of Present Value Benefits of Wet-Pipe Sprinkler Systems. Input Parameters Calculated Outputs
Probability of Fire Occurrence
Reduction in Annual Probability of Fatality, Given Fire, Between Dwelling with Only Smoke Alarms and Dwelling with Smoke Alarms and a Sprinkler System
Expected Number of Fatalities, Per Fire, in Dwellings with Only Smoke Alarms
Value of Statistical Life ( $ million)
Annual Benefit ($)
Present Value Benefit ($)
Fatalities Averted 0.0036 1.0000 0.0082 7.94 236.86 3725.57
Probability of Fire
Occurrence Reduction in Annual Probability of Injury, Given Fire, Between Dwelling with Only Smoke Alarms and Dwelling with Smoke Alarms and a Sprinkler System
Expected Number of Injuries, Per Fire, in Dwellings with Only Smoke Alarms
Value of Statistical Injury ($)
Annual Benefit ($) Present Value Benefit ($)
Injuries Averted 0.0036 0.5679 0.0403 171 620 14.29 224.74
Probability of Fire
Occurrence Reduction in Annual Probability of Direct Uninsured Property Loss, Given Fire, Between Dwelling with Only Smoke Alarms and Dwelling with Smoke Alarms and a Sprinkler System
Expected Direct Uninsured Property Loss, Per Fire, in Dwellings with Only Smoke Alarms
Annual Benefit ($) Present Value Benefit ($)
Direct Property Losses Averted
0.0036 0.3166 4397.96 5.06 79.64
Probability of Fire
Occurrence Reduction in Annual Probability of Indirect Cost, Given Fire, Between Dwelling with Only Smoke Alarms and Dwelling with Smoke Alarms and a Sprinkler System
Expected Indirect Cost, Per Fire, in Dwellings with Only Smoke Alarms
Annual Benefit ($) Present Value Benefit ($)
Indirect Costs Averted 0.0036 0.3166 879.59 1.01 15.93
Annual Homeowner
Insurance Premium ($) Reduction in Annual Homeowner Insurance Premium for Sprinkler System
Annual Benefit ($) Present Value Benefit ($)
Insurance Credit 753.70 0.08 60.30 948.41
Total Present
Value $317.52 $4994.29
Note: Annual benefits are expressed in constant 2005 dollars. Present value benefits are based on a 30-year study period. Input parameters shown are rounded.

24
4.2.2. Injuries Averted One- and two-family dwellings with a wet-pipe sprinkler system were found to have a 57 % reduction in injuries over dwellings equipped with only smoke alarms. As discussed in the previous section, the value of an injury averted was estimated at $171 620. The 57 % reduction in the injury rate results in an expected present value benefit of $225. 4.2.3. Direct Uninsured Property Loss Averted One- and two-family dwellings with a wet-pipe sprinkler system were found to have a 32 % reduction in direct property damages over dwellings equipped with only smoke alarms. The average direct property loss was found to be $21 990 per fire for dwellings only equipped with smoke alarms. Because insurance is assumed to cover 80 % of any property loss (Ruegg and Fuller 1984), the uninsured direct property loss, responsible to the owner, was then $4398 per fire. Thus the reduction in uninsured direct property damages yields a present value benefit of $80 to residents in dwellings with smoke alarms and a sprinkler system. 4.2.4. Indirect Uninsured Costs Averted Indirect costs in one- and two-family dwellings refers to costs such as temporary shelter, missed work, extra food costs, legal expenses, transportation, emotional counseling, and child care. Indirect losses have been systematically analyzed for house fires in a study by Munson and Ohls (1980). A review of this study leads the NFPA to use 10 % of the direct property loss as an estimate of the indirect property loss (Hall 2004). The average direct property loss per fire was found to be $21 990, meaning the estimated indirect cost per fire is $2199 for dwellings only equipped with smoke alarms. Part of the indirect loss of fires is covered by insurance. Munson and Ohls (1980) estimated that on average 60 % of indirect costs per fire are insured. Thus, the average uninsured indirect costs per fire were estimated at $880. Given that one- and two-family dwellings with wet-pipe sprinkler system were found to have a 32 % reduction in direct property damages over the study period 2002 to 2005, a reduction in indirect costs results in a present value benefit of $16. 4.2.5. Insurance Premium Credit The U.S. average insurance premium is estimated to be $7548 and sprinklers in residential dwellings are expected to receive an 8 % reduction in the annual premium (Curry 2007). The credit results in an expected present benefit of $949.
8 The Insurance Information Institute (2007) states that the average yearly homeowner insurance premium, as estimated by the National Association of Insurance Commissioners, was $729 in 2004.

25
4.3. Estimated Costs of Multipurpose Network Sprinkler Systems in Residential Dwellings The purchase and installation cost estimates were discussed in Section 3. Table 4-2 presents the installation cost estimates with material mark-up applied, where material markup increases incrementally from 50 % to 100% (increments of 10 %). The installation cost estimates range from $2075 to $2529 for the colonial, $1895 to $2306 for the townhouse, and $829 to $1001 for the ranch. We use the 50 % markup in the benefit-cost analysis, as we contend this to be the most reasonable. Table 4-2. Cost Estimate Summary Table. Material Markup ($) 50 % 60 % 70 % 80 % 90 % 100% Colonial 2075.08 2165.86 2256.64 2347.41 2438.19 2528.97 Townhouse 1895.17 1977.31 2059.45 2141.58 2223.72 2305.86 Ranch 828.66 863.18 897.69 932.21 966.72 1001.24
Source: This table is based on data in NISTIR 7277, Economic Analysis of Residential Fire Sprinkler Systems (Brown 2005, pages 11-13). 4.3.1. Installation Cost Comparison In 1984, Ruegg and Fuller estimated the benefits and costs of installing fire sprinkler systems in residential homes. In that report, two purchase and installation costs were estimated. The low cost estimate was $0.50 / ft2 ($5.38 / m2), and the high cost estimate was $0.80 / ft2 ($8.61 / m2) in 1982 dollars.9 These two estimates translate to $1.01 / ft2 ($10.87 / m2) and $1.62 / ft2 ($17.43 / m2) in 2005 prices. Table 4-3 shows that the fire sprinkler system designed in the 1984 report costs, in 2005 prices, were substantially more than the multipurpose network sprinkler system used here, even with a 100 % material markup (the exception being the townhouse at the 100 % markup). Table 4-3. 1982 Fire Sprinkler System Purchase and Installation Cost (2005 $)
Purchase and Installation Cost Estimate ($) Low
($1.01 / ft2; $10.87 / m2) High
($1.62 / ft2; $17.43 / m2) Colonial 3371.38 5407.56 Townhouse 2279.57 3656.34 Ranch 1182.71 1897.02
9 This is purchase and installation cost only; Ruegg and Fuller (1984) also estimated additional costs attributable to operating, maintenance, repair and replacement costs. The reduction or elimination of those additional costs in a modern multipurpose network fire sprinkler system, in addition to the reduced up-front purchase and installation cost, illustrates the significant cost reductions achieved in fire sprinkler systems over the past two decades.

26
The analysis presented in this report, when compared to those in Ruegg and Fuller (1984), suggests that fire sprinkler systems have become much more affordable over the past two decades. Should this trend continue, future developments in fire sprinkler technology and installation techniques would continue to reduce the costs of fire sprinkler systems, and improve their cost-effectiveness. 4.4. Benefit-Cost Comparison The benefits and costs accruing to homeowners and residents in one- and two-family dwellings from the addition of a multipurpose network sprinkler system in new housing construction are summarized in Table 4-4.10 The results indicate that a multipurpose network sprinkler system to be quite economical (benefits outweigh the costs). The baseline analysis yields a present value of net benefits of $2919 for the colonial, $3099 for the townhouse, and $4166 for the ranch house assuming a 50 % materials markup for each house type. Table 4-4. Summary of Baseline Benefit-Cost Analysis of a Multipurpose Network Residential Sprinkler System.
Colonial Townhouse Ranch Benefits Fatalities Averted $3725.57 $3725.57 $3725.57 Injuries Averted 224.74 224.74 224.74 Direct Uninsured Property Losses Averted 79.64 79.64 79.64 Indirect Costs Averted 15.93 15.93 15.93 Insurance Credit 948.41 948.41 948.41 Benefit Subtotal 4994.29 4994.29 4994.29 Costs Installation (50 % Markup) 2075.08 1895.17 828.66 Costs Subtotal 2075.08 1895.17 828.66 Net Present Value $2919.20 $3099.11 $4165.62
4.4.1. Benefit-Cost Analysis of a Multipurpose Network Residential Sprinkler System Installed in the Colonial The baseline net present value of installing a multipurpose network sprinkler system into the colonial house is $2919 (50 % material markup), implying that present value benefits of a
10 Although NFIRS 5.0 contains fire incident data on one- and two-family dwellings (property use 419) as well as multifamily dwellings, including condos, townhouses, and apartments (property use 429), the NFIRS 5.0 statistics for townhouses are based on the one- and two-family dwelling fire incident data. It is difficult to separate townhouses from apartments in the property use 429 category, and it assumed that fire risks are different for apartments than single-family houses, which townhouses are ordinarily considered.

27
sprinkler system outweigh the installation costs. Even at a 100 % material markup, the sprinkler system still yields positive present value net benefits of $2465. 4.4.2. Benefit-Cost Analysis of a Multipurpose Network Residential Sprinkler System Installed in the Townhouse The baseline net present value of installing a multipurpose network sprinkler system into the townhouse is $3099 (50 % material markup), implying that present value benefits of a sprinkler system outweigh the installation costs. Even at a 100 % material markup, the sprinkler system still yields positive present value net benefits of $2688. 4.4.3. Benefit-Cost Analysis of a Multipurpose Network Residential Sprinkler System Installed in the Ranch The baseline net present value of installing a multipurpose network sprinkler system into the ranch house is $4166 (50 % material markup), implying that present value benefits of a sprinkler system outweigh the installation costs. Even at a 100 % material markup, the sprinkler system still yields positive present value net benefits of $3993.

28

29
5. Sensitivity Analysis of the Baseline Benefit-Cost Analysis of Multipurpose Network Sprinkler Systems in Residential Dwellings 5.1. Introduction The baseline analysis provides point estimates of the present value of net benefits of the multipurpose network sprinkler system installed within new construction in a colonial, townhouse, and ranch setting. A sensitivity analysis is performed to examine the influence assumptions and input statistics, generated from the NFIRS 5.0, have on the PVNB results. Conducting a sensitivity analysis is important because the statistics used to summarize characteristics of dwellings with wet-pipe sprinklers are drawn from a small segment of the population. Over the 2002 to 2005 study period of the one- and two-family dwellings examined, houses with wet-pipe sprinkler systems accounted for 0.2 % of all structure fires. Houses only equipped with smoke alarms accounted for 56 %. The sensitivity analysis examines the influence the assumptions have on the benefit-cost results. In the sensitivity analysis, statistics used in the analysis, such as the probability of fire occurrence, are varied randomly over a range of values, based on their assumed distribution. Random draws are conducted using Latin Hypercube sampling. The software Crystal Ball 7.3 (see Crystal Ball 2007 for details) is used to conduct the sensitivity analysis. While Monte Carlo sampling achieves more randomness, Latin Hypercube sampling achieves more precise estimates because Latin Hypercube sampling ensures that the tails of the distribution will be accurately represented (Crystal Ball 2007). 5.2. Simulated Distributions The values (assumptions) generated from the NFIRS 5.0 and NFPA data used in estimating the benefits are varied using a Latin Hypercube sampling approach. The values (assumptions) varied in the sensitivity analysis are the input parameters presented in Table 4-1, with the exception of the value of a statistical life, value of a statistical injury, and the insurance credit. Table 5-1 describes the simulated distributions used, along with the parameters of the distributions derived from NFIRS 5.0 2002-2005 fire incident records and calibrated using NFPA (2006) fire statistics (see Section 3), unless otherwise noted in Table 5-1. Some of the parameters used were suggested by fire statistics experts at NFPA (Hall 2007) that meshed with historical observations, while others were motivated by the Scottsdale, AZ sprinkler study.11
11 The Prince George’s County, MD (Siarnicki 2001) sprinkler study was also considered, although the values derived from the Scottsdale, AZ sprinkler study were relatively similar.

30
Table 5-1. Description of the Simulated Distributions Used in the Sensitivity Analysis. Assumption Distribution Parameters Notes Probability of Fire Occurrence
Normal
Mean: 0.0036
Standard Deviation: 0.0001
Reduction in Probability of Fatality, Given Fire, Between Dwellings with Only Smoke Alarms and Dwellings with Smoke Alarms and a Sprinkler System
Triangular
Minimum: 0.6700 Most Likely: 1.0000
Maximum: 1.0000
Minimum per Hall (2007).
Expected Number of Fatalities, Per Fire, in Dwellings with Only Smoke Alarms
Normal
Mean: 0.0082
Standard Deviation: 0.0010
Reduction in Probability of Injury, Given Fire, Between Dwellings with Only Smoke Alarms and Dwellings with Smoke Alarms and a Sprinkler System
Triangular
Minimum: 0.0000 Most Likely: 0.5679
Maximum: 0.5679
Minimum per Hall (2007).
Expected Number of Injuries, Per Fire, in Dwellings with Only Smoke Alarms
Normal
Mean: 0.0403
Standard Deviation: 0.0029
Reduction in Probability of Direct Uninsured Property Loss, Given Fire, Between Dwellings with Only Smoke Alarms and Dwellings with Smoke Alarms and a Sprinkler System1
Triangular
Minimum: 0.0000 Most Likely: 0.3166
Maximum: 0.9520
Minimum per authors’ judgment. Maximum based on Scottsdale, AZ study.2
Expected Direct Uninsured Property Loss, Per Fire, in Dwellings with Only Smoke Alarms
Triangular
Minimum: $0 Most Likely: $4397.96
Maximum: $9003.80
Minimum per Hall (2007). Maximum based on Scottsdale, AZ study.3
Expected Indirect Cost, Per Fire, in Dwellings with Only Smoke Alarms
Triangular
Minimum: $0 Most Likely: $879.59 Maximum: $1800.76
Minimum per Hall (2007). Maximum based on Scottsdale, AZ study.4
Parameters derived using NFIRS 5.0 2002-2005 fire incident records and calibrated using NFPA (2006) fire statistics unless otherwise noted. 1Assumed equal to reduction in probability of indirect cost, given fire, between dwellings with smoke alarms and dwellings with smoke alarms and a sprinkler system. 2The study reports a $45 019 direct property loss in houses without sprinkler systems (although the presence of smoke alarms was not specified) and $2166 for those with, implying a 95.2 % reduction in direct property loss. 3See note 2 above. Assuming insurance covers 80 % of direct property losses, $9003.80 is uninsured. 4See note 2 above. Assuming indirect costs equal 10 % of direct property loss, with insurance covering 60 %, $1800.76 is uninsured.

31
5.3. Results of Sensitivity Analysis The sensitivity analysis confirms the conclusions of the baseline analysis, namely that multipurpose network residential sprinkler systems are likely to be cost-effective in the single-family houses studied. Results of the sensitivity analysis can be seen in Table 5-2 and in Figures 5-1, 5-2, and 5-3. Table 5-2 summarizes the statistics generated from the sensitivity analysis. Figures 5-1 through 5-3 were constructed by sorting the observed simulation value from smallest to largest. Table 5-2. Summary Statistics of the Sensitivity Analysis.
Colonial Townhouse Ranch Trials 10 000 10 000 10 000 Mean $2467.96 $2647.87 $3714.38 Median 2454.96 2634.87 3701.38 Minimum 703.67 883.58 1950.08 Maximum 4801.20 4981.11 6047.62 Standard Deviation 530.03 530.03 530.03 Mean Standard Error 5.30 5.30 5.30
For the colonial house, the mean net present value is positive, at $2468, although 15 % lower than the baseline estimate of $2919. Figure 5-1 graphs the cumulative distribution function (CDF) generated from the simulation. The vertical axis measures the probability that the associated net present value, measured on the horizontal axis, is equal to or less than the specified value. The vertical axis measures the cumulative probability and the horizontal axis measures the range of possible net present values resulting from a multipurpose network sprinkler system installed in a colonial house. For instance, there exists about a 0.80 probability that the actual net present value from installation of a sprinkler system is equal to or less than the baseline net present value of $2919 (i.e., 80 % of the observed simulation values are less than or equal to $2919). Further, based on the sensitivity analysis, there is a probability of 1.0 that the actual net present value is less than or equal to the maximum, $4801. However, there is a probability of 0.0 that the present net value is less than or equal to $703, which is of course still a positive present value net benefit. Thus, in every case examined, multipurpose network sprinklers are cost-effective. For the townhouse, the mean net present value is positive, at $2648, although 15 % lower than the baseline estimate. Figure 5-2 graphs the CDF generated from the simulation. The vertical axis measures the cumulative probability and the horizontal axis measures the range of possible net present values resulting from a multipurpose network sprinkler system installed in a townhouse. Figure 5-2 shows that there exists about a 0.80 probability that the actual net present value from installation of a sprinkler system is equal to or less than the baseline net present value of $3099. Further, based on the sensitivity analysis, there is a probability of 1.0 that the actual net present value is less than or equal to the maximum, $4981. However, there is a probability of 0.0 that the present net value is less than or equal to $884.

32
For the ranch house, the mean net present value is positive, at $3714, although 11 % lower than the baseline estimate. Figure 5-3 graphs the CDF generated from the simulation. The vertical axis measures the cumulative probability and the horizontal axis measures the range of possible net present values resulting from a multipurpose network sprinkler system installed in a ranch house. Figure 5-3 shows that there exists about a 0.80 probability that the actual net present value from installation of a sprinkler system is equal to or less than the baseline net present value of $4166. Further, based on the sensitivity analysis, there is a probability of 1.0 that the actual net present value is less than or equal to the maximum, $6048. However, there is a probability of 0.0 that the present net value is less than or equal to $1950.

33
Figure 5-1. The Cumulative Distribution Function Resulting From Latin Hypercube Sampling of Inputs in the Present Value of Net Benefits Calculation for the Colonial House.
Figure 5-2. The Cumulative Distribution Function Resulting From Latin Hypercube Sampling of Inputs in the Present Value of Net Benefits Calculation for the Townhouse.

34
Figure 5-3. The Cumulative Distribution Function Resulting From Latin Hypercube Sampling of Inputs in the Present Value of Net Benefits Calculation for the Ranch House. Of the eight variables on which assumptions are made, three of those variables are clearly more influential than the other five. They are the expected number of fatalities, per fire, in dwellings with only smoke alarms; the reduction in annual probability of fatality, given fire, between dwellings with only smoke alarms and dwellings with smoke alarms and a sprinkler system; and the probability of fire occurrence. The eight variables are listed in order of importance on the net present value in Table 5-3. It also presents the contribution to variance and rank correlation of the assumptions to the net present value calculation. The larger these measures, the larger is the influence the associated assumption has on the net present calculation. Thus, changes in the expected number of fatalities, per fire, in dwellings with only smoke alarms has the greatest exhibited influence on the magnitude of the net present value of the installation of a multipurpose network residential sprinkler system (contribution to variance of 62.7 % and a rank correlation of 0.76).

35
Table 5-3. Contribution to Variance and Rank Correlation of the Assumptions to the Net Present Value Calculation. Assumption Contribution to
Variance (%) Rank
Correlation Expected Number of Fatalities, Per Fire, in Dwellings with only Smoke Alarms
62.7
0.76
Reduction in Annual Probability of Fatality, Given Fire, Between Dwellings with Smoke Alarms Only and Dwellings with Smoke Alarms and a Sprinkler System
28.9 0.52
Probability of Fire Occurrence 6.0 0.24 Reduction in Annual Probability of Property Loss, Given Fire, Between Dwelling with Smoke Alarms and a Sprinkler System
1.1 0.10
Reduction in Annual Probability of Injury, Given Fire, Between Dwellings with Smoke Alarms and a Sprinkler System
0.8 0.09
Expected Direct Loss, Per Fire, in Dwellings with only Smoke Alarms
0.5 0.07
Expected Number of Injuries, Per Fire, in Dwellings with only Smoke Alarms
0.0 0.01
Expected Indirect Cost, Per Fire, in Dwellings with only Smoke Alarms
0.0 0.00
Note: Contribution to variance is an approximated amount of variance (variability) of the simulated net present values explained by the assumption (Crystal Ball 2007). Rank correlation is the correlation coefficient derived from comparing two variables with their values sorted from low to high (Crystal Ball 2007).

36
5.3.1. Sensitivity Analysis Varying Only One Assumption Instead of allowing all variables to vary at once, the three most influential variables are varied each at a time. Thus, the Latin Hypercube sampling is re-run, but this time only one assumption varied. Table 5-4. Summary Statistics of the Sensitivity Analysis When Varying One Assumption at a Time.
Assumption Varied
Expected Number of Fatalities, Per Fire, in
Dwellings with only Smoke Alarms
Reduction in Annual Probability of Fatality, Given Fire, Between a
Dwelling with Only Smoke Alarms and a Dwelling with Smoke Alarms
and a Sprinkler System
Probability of Fire Occurrence
Colonial Trials 10 000 10 000 10 000 Mean $2919.45 $2509.41 $2919.20 Median 2919.24 2559.09 2919.18 Minimum 1408.48 1693.60 2295.52 Maximum 4976.29 2919.15 3451.25 Standard Deviation 470.45 289.76 143.09 Mean Standard Error 4.70 2.90 1.43 Townhouse Trials 10 000 10 000 10 000 Mean $3099.36 $2689.32 $3099.11 Median 3099.15 2739.00 3099.09 Minimum 1588.39 1873.51 2475.43 Maximum 5156.20 3099.06 3631.16 Standard Deviation 470.45 289.76 143.09 Mean Standard Error 4.70 2.90 1.43 Ranch Trials 10 000 10 000 10 000 Mean $4165.86 $3755.82 $4165.61 Median 4165.66 3805.51 4165.60 Minimum 2654.90 2940.02 3541.94 Maximum 6222.70 4165.57 4697.67 Standard Deviation 470.45 289.76 143.09 Mean Standard Error 4.70 2.90 1.43
Consistent with the findings above in Table 5-3, the expected number of fatalities, per fire, in dwellings with only smoke alarms has the largest effect on the variation in the estimates (largest standard deviation). Thus, variation in number of fatalities tends to have the largest effect on

37
changes in the net present value of sprinklers (i.e., standard deviation for a colonial is $470), while variation in the probability of fire occurrence tends to have the least (i.e., standard deviation for a colonial is $143). This also results in a larger certainty range when varying the number of fatalities (i.e., the minimum and maximum values for the colonial are $3568 apart) than when varying the probability of fire occurrence (i.e., the minimum and maximum values for the colonial are $1156 apart). The implication is that the uncertainty surrounding the number of fatalities has a larger effect on the certainty of the net present value estimate than does the uncertainty associated with the other assumptions. Varying the number of fatalities and the probability of fire occurrence (separately of course) produces summary statistics (i.e., mean, median, minimum, maximum) that are much larger than those produced while varying all the assumptions at once. For instance, the mean, minimum, and maximum values generated when varying the number of fatalities for the colonial house are $2919, $1408, and $4976, respectively. When varying all the assumptions, the corresponding mean, minimum, and maximum are $2468, $704, and $4801, respectively. A similar pattern holds across housing types (for the townhouse and ranch) and also when varying the probability of fire occurrence. This result is likely due to the fact that while varying these assumptions, all other assumptions are held at their baseline value; so that, the reduction in annual probability of fatality, given a fire, between a dwelling with only smoke alarms and a dwelling with smoke alarms and a sprinkler system is set to its baseline value of 1.0. When the reduction in this risk is high, the net present benefits from sprinklers is also high.

38

39
6. Summary, Conclusion, and Recommendations for Future Research 6.1. Summary This report described and calculated the present value of net expected benefits accruing to a homeowner from installing a multipurpose network fire sprinkler system in each of three prototypical single-family homes (colonial, townhouse, and ranch). Anticipated benefits were estimated for reduced risk of death and injury, reduced risk of direct property loss, reduced risk of indirect costs and reduced homeowner insurance premiums; and costs were the purchase and installation cost of a multipurpose network fire sprinkler system. Brown (2005) documented the design and installation costs of four different fire sprinkler systems in three house types. When compared to three typical variants of the stand-alone fire sprinkler system that included a backflow preventer requiring professional maintenance, the multipurpose network system was generally the least costly across the three house types (lowest life-cycle cost). The multipurpose network system was therefore selected as the fire sprinkler system to be used in the current benefit-cost analysis. This report estimated the benefits and costs to a homeowner of adding a fire sprinkler system to a new house construction design in which smoke detectors were already present. Based on the U.S. Fire Administration’s National Fire Incident Report System 5.0 (NFIRS 5.0) and national fire statistics provided by the National Fire Protection Association (NFPA), expected present value of net benefits (PVNB) were positive for the three prototypical single-family houses. When a house fire occurs, one- and two-family dwellings with a wet-pipe sprinkler system (multipurpose network fire sprinkler systems are wet-pipe sprinklers) and smoke alarms were found, on average, to have 100 % fewer civilian fatalities, 57 % fewer civilian injuries, and 32 % less direct property loss than one- and two-family dwellings equipped with only smoke alarms. These benefits coupled with homeowner insurance credits of an 8 % reduction in annual premiums, resulted in expected PVNB (in 2005 dollars) of $2919 for the colonial-style house, $3099 for the townhouse, and $4166 for the ranch-style house. 6.2. Conclusions A sensitivity analysis was performed to measure the variability of the results to changes in the assumptions made (inputs derived from the NFIRS 5.0 and NFPA data). The sensitivity analysis confirmed the robustness of the baseline analysis. In the sensitivity analysis, the PVNB ranged from $704 to $4801 for the colonial-style house, from $884 to $4981 for the townhouse, and from $1950 to $6048 for the ranch-style house. Multipurpose network sprinkler systems appear to be highly cost-effective. Brown (2005) presented the life-cycle costs of three other residential sprinkler systems. Two of the three allowed for a backflow preventer to be installed, which requires annual professional maintenance. The annual cost was estimated at $100 to $200 per year. Installing the sprinkler system “D” (the most expensive) and adding the present value expense of an annually occurring maintenance charge of $200 would have increased the present value costs to $6446 for the
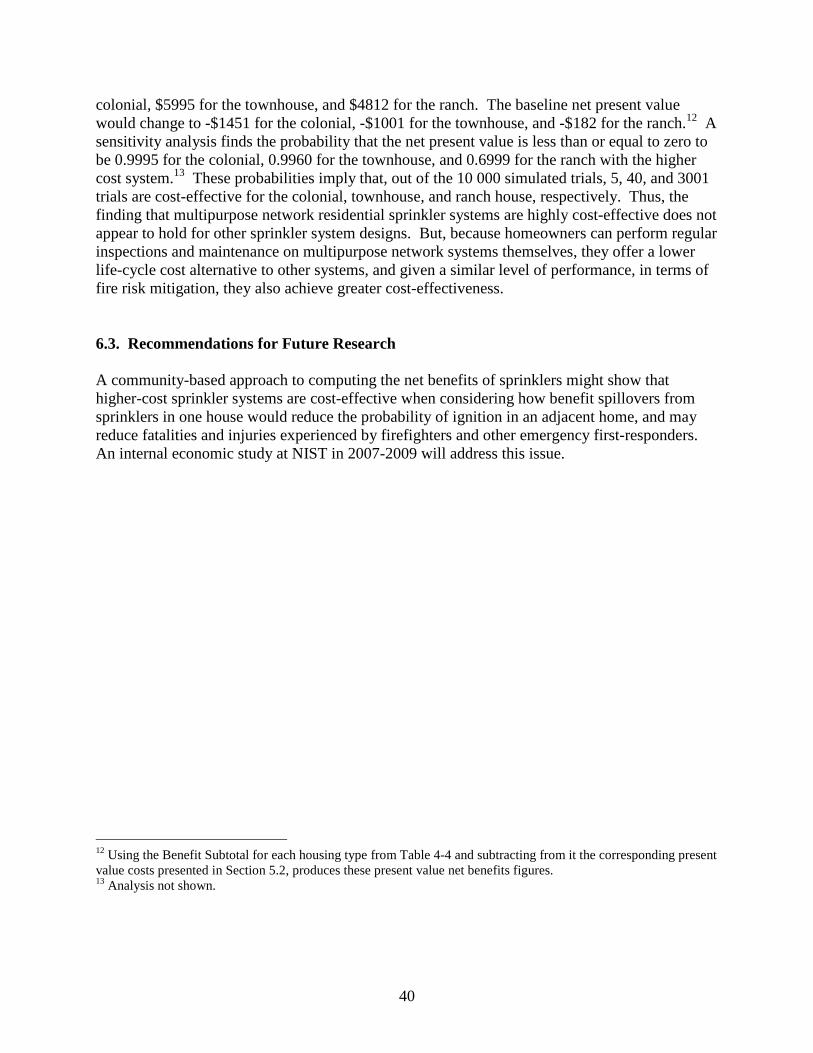
40
colonial, $5995 for the townhouse, and $4812 for the ranch. The baseline net present value would change to -$1451 for the colonial, -$1001 for the townhouse, and -$182 for the ranch.12 A sensitivity analysis finds the probability that the net present value is less than or equal to zero to be 0.9995 for the colonial, 0.9960 for the townhouse, and 0.6999 for the ranch with the higher cost system.13 These probabilities imply that, out of the 10 000 simulated trials, 5, 40, and 3001 trials are cost-effective for the colonial, townhouse, and ranch house, respectively. Thus, the finding that multipurpose network residential sprinkler systems are highly cost-effective does not appear to hold for other sprinkler system designs. But, because homeowners can perform regular inspections and maintenance on multipurpose network systems themselves, they offer a lower life-cycle cost alternative to other systems, and given a similar level of performance, in terms of fire risk mitigation, they also achieve greater cost-effectiveness. 6.3. Recommendations for Future Research A community-based approach to computing the net benefits of sprinklers might show that higher-cost sprinkler systems are cost-effective when considering how benefit spillovers from sprinklers in one house would reduce the probability of ignition in an adjacent home, and may reduce fatalities and injuries experienced by firefighters and other emergency first-responders. An internal economic study at NIST in 2007-2009 will address this issue.
12 Using the Benefit Subtotal for each housing type from Table 4-4 and subtracting from it the corresponding present value costs presented in Section 5.2, produces these present value net benefits figures. 13 Analysis not shown.

41
References Ahrens, M. 2007. U.S. Experience with Smoke Alarms and Other Fire Detection/Alarm
Equipment, National Fire Protection Association. ASTM International. 2007. Practice for Measuring Net Benefits for Investments in Buildings
and Building Systems. E 1074-06. West Conshohoken, PA: ASTM International. ASTM International. 2007. Practice for Measuring Life-Cycle Costs of Buildings and Building
Systems. E 917-05. West Conshohoken, PA: ASTM International. Brown, M.H. 2005. Economic Analysis of Residential Fire Sprinkler Systems. NISTIR 7277.
Gaithersburg, MD: National Institute of Standards and Technology. Crystal Ball. 2007. Crystal Ball 7.3 User Manual. Denver, CO: Decisioneering, Inc. Curry, R. 2007. Personal Communication. Assistant Vice President and Actuary, Personal
Property Actuarial Division, ISO. Hall, J.R. 2007. Personal Communication. Assistant Vice President, Fire Analysis and
Research, National Fire Protection Association. Hall, J.R. 2004. The Total Cost of Fire in the United States. National Fire Protection
Association. Hall, J.R., and B. Harwood. 1989. “The National Estimates Approach to U.S. Fire Statistics,”
Fire Technology, pp. 99-113. Home Fire Sprinkler Coalition. 2007. Automatic Sprinklers, A 15-Year Study, Scottsdale,
Arizona, available at: http://www.homefiresprinkler.org/FS/Scottsdale15.html. Ibbotson Associates. 2005. “Stocks, Bonds, and Bills after Taxes and Inflation: Year-end 1925-
2004,” PM006. Insurance Information Institute, “Homeowner Insurance,” available at:
http://www.iii.org/media/facts/statsbyissue/homeowners/, 2007. Jones-Lee, M. W. 1976. The Value of Life: An Economic Analysis. Chicago, IL: University of
Chicago Press. Judas, B., and B. Mattson. 1994. “Economics of Fire Technology,” Fire Technology, pp. 468-
477. Mishan, E. J. 1971. “Evaluation of Life and Limb: A Theoretical Approach,” Journal of
Political Economy, pp. 687-705.

42
Munson, M.J. and J. C. Ohls. 1980. Indirect Costs of Residential Fires. Washington, DC: FEMA, U.S. Government Printing Office, 0319-251/207.
National Fire Protection Association. 2006. “The U.S. Fire Problem: One- and Two-Family
Dwelling Fires,” available at: http://www.nfpa.org/itemDetail.asp?categoryID=953&itemID=23858&URL=Research%20&%20Reports/Fire%20statistics/The%20U.S.%20fire%20problem. Last downloaded by authors on 08/09/2007.
National Fire Protection Association. 2002. “Standard for the Installation of Sprinkler Systems
in One and Two Family Dwellings and Manufactured Homes 2002 Edition,” NFPA 13D, National Fire Protection Association.
Ray, Dale R., W.W. Zamula, T.R. Miller, P.A. Brigham, M.A. Cohen, J.B. Douglass, M.S.
Galbraith, D.C. Lestina, V.S. Nelkin, N.M. Pindus, and P. Smith-Regojo. 1993. Societal Costs of Cigarette Fires. U.S. Consumer Product Safety Commission Report 6, Washington, DC.
Ruegg, R.T., and S.K. Fuller. 1984. A Benefit-Cost Model of Residential Fire Sprinkler
Systems, NBS Technical Note 1203. Gaithersburg, MD: National Bureau of Standards. Siarnicki, R.J. 2001. Residential Sprinklers: One Community's Experience Twelve Years After
Mandatory Implementation. Prince George’s County, MD: Prince George’s County Fire/EMS Department.
United States Bureau of Labor Statistics, Consumer Price Index, Available at:
http://www.bls.gov. United States Census Bureau, American Housing Survey, Online at:
http://www.census.gov/hhes/www/housing/ahs/ahs.html, last downloaded by authors on 07/30/2007.
United States Fire Administration, National Fire Incident Reporting System 5.0, National Fire
Data Center. Viscusi, W.K. and J.E. Aldy. 2003. “The Value of a Statistical Life: A Critical Review of
Market Estimates Throughout the World,” The Journal of Risk and Uncertainty, 27(1): 5-76.
Zamula, W.W. 2005. U.S. Consumer Product Safety Commission. Memorandum to Gregory B.
Rodgers, Costs for Non-Fatal Addressable Residential Civilian Injuries Associated with Mattress and Bedding Fires.
Zamula, W.W. 2004. Memorandum to Gregory B. Rogers, Costs for Non-Fatal, Addressable
Residential Civilian Injuries Associated with Upholstered Furniture Fires.

43
Appendix A. Benefit and Cost Calculation Equations
A.1. Benefits The benefits to a homeowner of acquiring a sprinkler system come primarily from reduced risk of death and injury; reduced risk of property loss; reduced risk of related indirect costs; and other benefits such as lower insurance costs and reduced housing costs. A.1.1. Reduced Risk of Death and Injury The present value benefits of reduced death and injury to the homeowner due to installation of a sprinkler system in a house with smoke alarms, PVDI, are calculated as follows:
UVSFIEVSFDEFPPVDI IIDD ],|[],|[)( 00
where
)(P denotes probability,
][E is the mathematical expectations operator,
)(FP is the annual probability of fire ignition (F) of a house,
D is the reduction in annual probability of death (D), given fire (F), of a house with only smoke alarms (S0), compared to a house with smoke alarms and a sprinkler
system (S1). Mathematically this is defined as: ),|(
),|(),|(
0
10
SFDP
SFDPSFDP ,
),|( 0SFDP is the annual probability of death (D), given fire (F), in a house with only smoke
alarms (S0) ,
),|( 1SFDP is the annual probability of death (D), given fire (F), in a house with smoke alarms and a sprinkler system (S1),
],|[ 0SFDE is the expected number of deaths (D) per fire in a house with smoke alarms only
(S0),
DV is the value of statistical life,
I is the reduction in annual probability of injury (D), given fire (F), of a house with only smoke alarms (S0), compared to a house with smoke alarms and a sprinkler
system (S1). Mathematically this is defined as: ),|(
),|(),|(
0
10
SFIP
SFIPSFIP ,

44
),|( 0SFIP is the annual probability of injury (I), given fire (F), in a house with smoke alarms
only (S0),
),|( 1SFIP is the annual probability of injury (I), given fire (F), in a house with smoke alarms and a sprinkler system (S1),
],|[ 0SFIE is the expected number of injuries (I) per fire in a house with smoke alarms only
(S0),
IV is the value of statistical injury averted, U is the uniform present worth factor that when multiplied by a value, returns its
discounted present value, over T years, at a discount rate of d. Mathematically this
is defined as:T
T
dd
d
)1(
1)1(
.
A.1.2. Reduced Risk of Direct Losses The present-value benefits or reduced risk of uninsured and non-reimbursable direct losses to the homeowner (PVPL) are calculated as:
USFLESFLEFPPVDL DD ],|[],|[)( 10
where
],|[ 0SFLE D is the expected direct uninsured and non-reimbursable fire loss (LD) per fire in
houses with smoke alarms only (S0),
],|[ 1SFLE D is the expected direct uninsured and non-reimbursable fire loss (LD) per fire in houses with smoke alarms and a sprinkler system (S1),
A.1.3. Reduced Risk of Indirect Costs The present value benefits of reduced risk of out-of-pocket indirect costs PVC, such as legal expenses, temporary shelter, and transportation, are calculated as:
USFLESFLEFPPVIL II ],|[],|[)( 10
where,

45
],|[ 0SFLE I is the expected indirect uninsured and non-reimbursable fire loss (LI) per fire in
houses with smoke alarms only (S0),
],|[ 1SFLE I is the expected indirect uninsured and non-reimbursable fire loss (LI) per fire in houses with smoke alarms and a sprinkler system (S1).
A.1.4. Reduced Insurance Premiums The present value of reduced homeowner insurance premiums is calculated as:
URIPPVIP where IP is the annually re-occurring homeowner insurance premium, R is the annually re-occurring proportional reduction in the homeowner insurance due to the
installation and use of a residential sprinkler system. A.1.5. Other Sprinkler Benefits The present value of other sprinkler benefits include mortgage tax deductions, local tax savings due to municipal cost reductions, and increased present value of resale proceeds (see Appendix B). The present value of these benefits is calculated as:
UOBPVOB where OB is the annually re-occurring other benefits to homeowners with smoke alarms and a
sprinkler system. A.2. Cost Variables The present value costs of installation of a residential sprinkler system equation are calculated as:
UOCMOPPIPVC where PI is the purchase and installation costs, OP is the annually re-occurring operating costs,

46
M is the annually re-occurring maintenance, repair, and replacement costs, OC is the annually re-occurring other costs due to sprinkler use. Only the largest and most significant cost, PI, has been estimated in this report, due to the performance characteristics of the selected multipurpose network fire sprinkler system. The multipurpose network system is integrated with the regular cold-water plumbing inside the house, and has no separable maintenance needs. The system also does not require a backflow preventer. Maintenance, repair, and replacement costs are, therefore, not estimated. Additionally, because available information indicates that fire sprinkler systems have very small rates of accidental activation, these costs are not estimated (see Appendix B).

47
Appendix B. Discussion of Non-Quantified Benefits and Costs In this report, the economic impacts to an individual homeowner from adding a fire sprinkler system to smoke detectors in each of three prototypical single-family homes are organized and presented as benefits and costs, not all of which are quantified. Appendix B describes benefits that were not quantified—the mortgage interest tax deduction, the increased present value of resale proceeds, and local tax savings—and one cost that was not quantified—accidental activation of the sprinkler system. B.1. Mortgage Interest Tax Deduction For both an owner/occupant and an owner of a rental unit, the interest payments on a loan to finance the purchase of the system are deductible from taxable income, effectively reducing the acquisition cost of the system. With a fixed rate/uniform payment loan, the interest and principal components of each loan payment change over time. Because only the interest component is tax deductible, it must be separately estimated. This can be done period-by-period by calculating interest on the remaining principal balance, subtracting the interest from the payment amount – thereby determining the contribution of that payment to reducing the principal – and then reapplying the interest rate to the new loan balance. The resulting cash flow is then multiplied by the marginal income tax rate, each value is discounted to present value, and the results summed to find the present value savings of interest expense deductions. B.2. Increased Present Value of Resale Proceeds An additional factor that could be modeled as a benefit variable is the increased present value of resale proceeds. The increased proceeds realizable from selling the house prior to the end of the sprinkler system’s useful life could be deducted from purchase and installation costs. B.3. Local Tax Savings For areas with local residential fire sprinkler system regulations, communities (municipalities) could experience savings related to firefighting and emergency rescue cost reductions (i.e., from fewer fatalities, injuries, and damage attributed to sprinkler use) that are passed back to residents in the form of tax savings. Community-scale residential sprinkler system benefits are the focus of future NIST research (see Section 6.3). B.4. Accidental Activation The Home Fire Sprinkler Coalition, citing manufacturers of residential fire sprinklers, gives the estimated odds of an accidental discharge, due to a manufacturing defect, as 1 in 16 million. In this report, additional costs due to accidental discharge were judged to be negligible. This report does not estimate the probability of accidental activation due to improper installation or user error.