benefit duration, unemployment duration and job …ftp.iza.org/dp4670.pdfarne uhlendorff. benefit...
TRANSCRIPT

DI
SC
US
SI
ON
P
AP
ER
S
ER
IE
S
Forschungsinstitut zur Zukunft der ArbeitInstitute for the Study of Labor
Benefi t Duration, Unemployment Duration and Job Match Quality: A Regression-Discontinuity Approach
IZA DP No. 4670
December 2009
Marco CaliendoKonstantinos TatsiramosArne Uhlendorff

Benefit Duration, Unemployment Duration and Job Match Quality:
A Regression-Discontinuity Approach
Marco Caliendo IZA, DIW Berlin and IAB
Konstantinos Tatsiramos
IZA
Arne Uhlendorff University of Mannheim, DIW Berlin and IZA
Discussion Paper No. 4670 December 2009
IZA
P.O. Box 7240 53072 Bonn
Germany
Phone: +49-228-3894-0 Fax: +49-228-3894-180
E-mail: [email protected]
Any opinions expressed here are those of the author(s) and not those of IZA. Research published in this series may include views on policy, but the institute itself takes no institutional policy positions. The Institute for the Study of Labor (IZA) in Bonn is a local and virtual international research center and a place of communication between science, politics and business. IZA is an independent nonprofit organization supported by Deutsche Post Foundation. The center is associated with the University of Bonn and offers a stimulating research environment through its international network, workshops and conferences, data service, project support, research visits and doctoral program. IZA engages in (i) original and internationally competitive research in all fields of labor economics, (ii) development of policy concepts, and (iii) dissemination of research results and concepts to the interested public. IZA Discussion Papers often represent preliminary work and are circulated to encourage discussion. Citation of such a paper should account for its provisional character. A revised version may be available directly from the author.

IZA Discussion Paper No. 4670 December 2009
ABSTRACT
Benefit Duration, Unemployment Duration and Job Match Quality: A Regression-Discontinuity Approach*
The generosity of the Unemployment Insurance system (UI) plays a central role for the job search behavior of unemployed individuals. Standard search theory predicts that an increase in UI benefit generosity, either in terms of benefit duration or entitlement, has a negative impact on the job search activities of the unemployed increasing their unemployment duration. Despite the disincentive effect of UI on unemployment duration, UI benefit generosity may also increase job match quality by allowing individuals to wait for better job offers. In this paper we use a sharp discontinuity in the maximum duration of unemployment benefits in Germany, which increases from 12 months to 18 months at the age of 45, to identify the effect of extended benefit duration on unemployment duration and post-unemployment outcomes. We find a spike in the re-employment hazard for the unemployed workers with 12 months benefit duration, which occurs around benefit exhaustion. This leads to lower unemployment duration compared to their counterparts with 18 months benefit duration. However, we also show that those unemployed who obtain jobs close to and after the time when benefits are exhausted are significantly more likely to exit subsequent employment and receive lower wages compared to their counterparts with extended benefit duration. JEL Classification: C41, J64 Keywords: unemployment benefits, unemployment duration, employment probability,
job match quality, regression discontinuity Corresponding author: Marco Caliendo IZA P.O. Box 7240 53072 Bonn Germany E-mail: [email protected]
* We thank Richard Blundell, David Card, Dan Hamermesh, Rafael Lalive, Gerard van den Berg, Jan van Ours, Andrea Weber, Josef Zweimüller and participants in seminars at DIW Berlin, IAB Nuremberg, IFAU, IFS, IZA, Maastricht University, RWI Essen, Tilburg University, Tinbergen Institute, University of Naples Parthenope and ZEW for valuable comments. The IAB (Nuremberg) kindly gave us permission to use the data. Marco Caliendo and Arne Uhlendorff thank the German Research Foundation (DFG) for financial support of the project CA 829/1-1.

1 Introduction
The generosity of the Unemployment Insurance system (UI) plays a central role for thejob search behavior of unemployed individuals(Hansen and Imrohoroglu, 1992; Gruber,1997). A standard result in the literature is that UI creates re-employment disincentives.An increase in UI benefit generosity has a negative impact on the job search activitiesof the unemployed increasing their unemployment duration. Moreover, the exit rate fromunemployment increases closer to benefit expiration since the marginal benefit of searchincreases and the reservation wage falls (Mortensen, 1977, Van den Berg, 1990). Manyempirical studies have investigated the effect of potential benefit duration on the exit ratefrom unemployment (e.g. Meyer, 1990; Katz and Meyer, 1990; Card and Levine, 2000,for the US, Roed and Zhang, 2003; Lalive, Van Ours, Zweimuller, 2006; Van Ours andVodopivec, 2006; Card, Chetty and Weber, 2007a and 2007b for Europe). A commonfinding is that limiting unemployment benefit duration tends to introduce a spike in theexit rate around benefit exhaustion.
The focus of most of the literature on how benefit duration affects the exit rate from un-employment does not consider the potential effect of UI on post-unemployment outcomesor job match quality. The observed spike close to benefit expiration might reduce thequality of job matches as workers might become less selective.1 The non-stationarity thatarises because of limited benefit duration implies that individuals with different lengthsof benefit entitlement should have different optimal paths of reservation wage and searcheffort over time. This difference in the optimal job search behavior could lead to differentrealized distributions of job quality. Individuals with a given length of unemployment, thesame level of benefits, but a longer period of remaining benefit entitlement may wait forjob offers which are better either in terms of re-employment wages and/or employmentstability.
In this paper we investigate the effect of extended benefit duration on the re-employmentprobabilities and on post-unemployment outcomes such as employment stability and re-employment wages. In particular, we are focusing on the job search behavior around ben-efit expiration to understand the extent to which jobs accepted closer to the time benefitselapse might be of worse quality (less stable, lower wage) because workers become less se-lective. That is, we analyze the effect of extended benefit duration on post-unemploymentoutcomes not only for the average unemployed but also for different groups of unemployed,which are defined by their unemployment duration. Our identification strategy relies ona sharp discontinuity in the maximum duration of unemployment benefits in Germany,which increases from 12 to 18 months at the age of 45. Comparing unemployed who arejust below the age threshold with individuals just above the corresponding age gives us ameasure of the effect of extended benefits. We use an inflow sample into unemploymentfor the years 2001 to 2003, which is based on administrative records with information onlabor market states of each individual being observed for 3 years. Given the large samples
1Card and Levine (2000) suggest that the spike might be related to the fact that workers become lessselective as they approach the benefit expiration. An alternative explanation of the spike is based on thestrategic timing of job starting dates. Boone and Van Ours (2009) provide supporting evidence on thisbased on Slovenian data.

available and the age of the discontinuity we also consider men and women separately.Our analysis based on a regression discontinuity design (RD) may suffer from two
potential selection issues that might invalidate our identification strategy. First, firms andworkers might delay the timing of the job separation for the worker to benefit from a longerentitlement period, leading to non-random selection around the eligibility threshold. Wetest the frequency of the inflow into unemployment and the observable characteristics ofthe unemployed around the discontinuity and we find no evidence of selection. Second,although the assignment into treatment at the beginning of the unemployment spell isbased on this sharp discontinuity, there might be selection in the resulting sample of the re-employed based on observed and unobserved characteristics (Ham and LaLonde, 1996). Weinvestigate the sensitivity of our results to the presence of dynamic selection by estimatinga bivariate discrete-time hazard model with correlated unobserved heterogeneity and wefind that our findings are robust to this form of selection. Hence, our results are not drivenby selection into treatment or dynamic selection and can be interpreted as causal effects.
We find evidence of an effect of extended benefit duration on unemployment durationbut also on the duration and wages of accepted jobs. In particular, we find a spike inthe unemployment hazard for the unemployed workers with 12 months benefit duration,which occurs close to benefit exhaustion. The unemployed who are above the age of 45and receive additional six months of benefits exhibit a significantly lower exit rate at thebenefit expiration time of the younger group at month 12. The finding of a spike at benefitexhaustion is consistent with the existing empirical evidence. In terms of the effect on post-unemployment outcomes, we find that unemployed workers with 18 months of benefits findjobs that last longer compared to the those workers who receive benefits for 12 months.In particular, we observe that the unemployed with shorter benefit duration who find jobsclose to the time benefits are exhausted and when they do not receive benefits anymore aresignificantly more likely to exit subsequent employment compared to their counterpartswith extended benefit duration. This suggests that close to the benefit expiration andafter that period the unemployed with 12 months benefit duration accept jobs they wouldotherwise reject, while those who receive additional 6 months of insurance tend to acceptjobs that are of better quality and last longer. Finally, looking at re-employment wageswe find that those who accept a job around the time their benefits expire or when do notreceive benefits anymore have significantly lower wages compared to their counterpartswho accept a job while they could still search and being insured.
Our findings extend previous studies, which have looked at the effect of benefit durationon post-unemployment outcomes but have focused on the average effect. For example,Card, Chetty, and Weber (2007a) for Austria and Van Ours and Vodopivec (2008) forSlovenia evaluate an extension of potential duration of UI benefits and find that it lowersjob-finding rates but has no effect on subsequent job match quality. The findings in thispaper suggest that due to the non-stationarity of job search there exist effects of extendedbenefit duration on job match quality, which are heterogeneous.
The paper is organized as follows: Section 2 outlines the theoretical framework andthe existing empirical evidence. Section 3 describes the institutional background. Section 4discusses the identification strategy, describes the data, and provides a descriptive analysis.
2

The results of the empirical analysis are presented in Section 5 and Section 6 concludes.
2 Theoretical Framework and Empirical Evidence
The main objective of government-provided UI is to allow for consumption smoothingin the event of a negative shock that leads to unemployment. A major concern with UIis the disincentive effect due to moral hazard that might affect the worker’s willingnessto search for jobs. There is, therefore, a trade-off between providing insurance and theincentives to search for work. Standard search theory predicts that an increase in UIbenefit generosity, either in terms of benefit duration or entitlement, has a negative impacton the job search activities of the unemployed increasing their unemployment duration.Unemployed workers exert lower search effort as the opportunity cost of search is lower andthey choose higher reservation wages. Moreover, closer to the time of benefit exhaustion,the value of unemployment drops since the marginal benefit of search increases and thereservation wage falls, leading to a higher exit rate out of unemployment (Mortensen,1977).
This non-stationarity implies that individuals with different lengths of benefit entitle-ment should have different optimal paths of reservation wage and search effort over time(van den Berg 1990). Figure 1 shows a stylized illustration of the effects of an extendedbenefit duration on the unemployment hazard rate. There are two periods of interest. Thefirst is the time until benefits are exhausted for the first group of unemployed denoted asT1. For t ≤ T1 the job finding rate θ is equal for both groups at the beginning of thespell. Due to the time-limited benefit duration, closer to the time of benefit expiration theexit rate of those with shorter benefit duration is increasing compared to their counter-parts with a longer benefit entitlement, and stays constant at a higher level than beforeexhaustion. The second period is defined by the exhaustion points of the two groups. ForT1 < t < T2, the hazard rate of the first group is likely to be higher because benefits havebeen exhausted, while the second group of workers receives benefits until T2.2
Insert Figure 1 about here
Besides the trade-off between insurance and the incentives to leave unemployment fora job, the relationship between the length of benefit entitlement and the optimal path ofjob search behavior might lead to a positive relationship between insurance and the qualityof jobs obtained. The reason is that closer to benefit expiration and after benefits haveexpired workers might become less selective and obtain jobs of lower quality. Therefore,the difference in the optimal job search behavior of individuals with different lengths ofbenefit entitlement over time could lead to different realized distributions of job quality.Individuals with a given length of unemployment, the same level of benefits, but a longerperiod of remaining benefit entitlement may wait for job offers which are better in termsof re-employment wages and employment stability. The job match quality aspect of UIhas been considered in a number of theoretical papers. Acemoglu and Shimer (1999) show
2In our empirical analysis T1 = 12, while T2 = 18.
3

that the increased utility of unemployment when receiving UI induces workers to searchfor higher wages and firms respond by creating high-wage, high-quality jobs. Marimon andZilibotti (1999) show that UI can increase job match quality by helping workers to getjobs which are compatible with their skills and therefore less likely to dissolve.
Numerous studies have investigated the effect of benefit duration and its effect on theexit rate from unemployment both in the U.S. and in Europe. Exploiting differences inpotential benefit duration across U.S. states, Meyer (1990) and Katz and Meyer (1990)find a sharp increase in the exit rate from unemployment before benefits are exhausted,while such increases are not found for the non-recipients. Card and Levine (2000) exploitan exogenous variation in benefit duration in New Jersey and also find a spike in theunemployment hazard rate around benefit expiration. In a more recent study Addisonand Portugal (2008) also find for the U.S. an increase in the exit rate from unemploymentbefore benefits are exhausted. Ham and Rea (1987) obtain similar findings for Canada.
For Europe, an early study is Hunt (1995) for Germany who makes use of institutionalchanges in the benefit entitlement schemes in the 1980s. The changes mainly consisted inan extension of the maximum duration of unemployment benefit receipt for unemployedolder than 42 years, whereby different age groups are affected differently. She appliesdifference-in-differences estimators using the German Socioeconomic Panel (SOEP) andfinds a negative impact of increased benefit entitlement on the hazard rate from unem-ployment to employment as well as out of labor force. The evidence of follow-up studies onthe effects of institutional changes in Germany in the 1980s is rather mixed.3 In a recentstudy Fitzenberger and Wilke (2010) make use of an administrative data set in order toanalyze the effects of the reforms in the 1980s on the distribution of duration in nonem-ployment. Their findings suggest that firms and older workers make use of the extendedbenefit entitlement periods as part of early retirement schemes, but they do not find anyimpact on the time spent in unemployment before finding a new job.
Carling, Edin, Harkman, and Holmlund (1996) find for Sweden an increase in the exitrate from unemployment around benefit exhaustion. Due to the availability of labor marketprograms at the end-of-benefit-period, they find a much larger increase in the exit rateto those programs. Winter-Ebmer (1998) and Lalive and Zweimuller (2004) investigatethe effect of an extended benefit period in Austria and find significant disincentive effects.Winter-Ebmer (1998) finds an effect which exists only for males and is larger for longunemployed spells. Roed and Zhang (2003) for Norway find instead that the spike aroundthe time of benefit expiration is larger for females than for males. Van Ours and Vodopivec(2006) studying benefit reduction in Slovenia find both strong effects on the exit rate outof unemployment and substantial spikes around benefit exhaustion. More recent evidencebased on an RD design is offered by Lalive (2008) using discontinuities in the potentialbenefit duration at age 50 and across regions in Austria. He finds that extended benefitduration increases unemployment duration and the effect is larger for women comparedto men.
3An example of a study based on the SOEP and finding no significant effect of the reforms on theduration of unemployment is Schneider and Hujer (1997) whereas Steiner (2001) finds a negative correlationof receiving unemployment benefits and the probability of leaving unemployment. For a detailed discussionof the literature on Germany see e.g. Fitzenberger and Wilke (2010).
4

The empirical evidence for the effect of UI on post-unemployment outcomes is morescarce and mixed. Ehrenberg and Oaxaca (1976) were the first to consider the effect of UIon post-unemployment outcomes finding a positive effect of benefits on post-unemploymentwages. Addison and Blackburn (2000) review the literature and provide results whichsuggest a weak effect of UI on re-employment wages. More recently, Centeno and Novo(2009) exploit a reform of the Portuguese UI system that increased the entitlement periodfor some age-groups, while leaving it unchanged for other age-groups. They also find thatthe extension had a small but positive effect on re-employment wages, which is strongerat the bottom of the pre-unemployment wage distribution and is concentrated at shortunemployment durations.
Because wages are not the only state variable sufficient to summarize individual well-being, another strand of the literature measures the effect of UI generosity on post-unemployment outcomes with the incidence of unemployment, or the time elapsed betweenre-employment and acceptance of a subsequent job, using job matching arguments basedon Jovanovic (1979). In a series of papers, Belzil (1992, 1995, 2001) analyzes unemploymentexperience and employment duration in the context of the Canadian UI reform findingthat the incidence of voluntary unemployment is positively correlated with the durationof the preceding spell of unemployment and benefit exhaustion, and a weak positive rela-tionship between re-employment duration and unemployment benefit generosity. Centeno(2004) studies the effect of the generosity of U.S. benefit levels and finds that larger UIbenefits lead to longer subsequent employment spells. Card, Chetty, and Weber (2007b)apply a regression discontinuity design and find for Austria that an increase in benefitentitlement length reduces job-finding rates but does not have any effect on subsequentjob match quality, measured in wage growth and job duration. Van Ours and Vodopivec(2008) investigate the effect of reducing the potential duration of unemployment benefitsin Slovenia and find that it strongly increased job finding rates but had no effect on thequality of post-unemployment jobs. Fitzenberger and Wilke (2010) also do not find evi-dence for an improved job match quality in terms of job stability or wages for the olderworker after the reform in Germany in the 80s. Tatsiramos (2009) using individual datafrom the European Community Household Panel for eight countries, finds that althoughreceiving benefits has an adverse effect by increasing unemployment duration, there isalso a positive effect associated with the increased duration of subsequent employment.His findings suggest that jobs which are accepted while being insured last longer. Thisbeneficial effect of unemployment insurance on employment stability is pronounced incountries with relatively generous benefit systems.
3 Institutional Background
Germany has undergone some major labor market reforms in the last couple of yearsincluding the Hartz reforms which consisted of, among other things, a change of theunemployment benefit and social assistance schemes.4 In our empirical analysis we are
4A detailed description of the unemployment insurance system in Germany and its changes over timeis given in Konle-Seidl, Eichhorst, and Grienberger-Zingerle (2009).
5

focussing on an inflow sample of unemployed workers between 2001 and 2003, a periodprior to the Hartz reforms.
Prior to the reforms, Germany had a system of income protection which was basedon three pillars: 1) unemployment benefits, 2) unemployment assistance and 3) socialassistance. Unemployment benefits (UB, Arbeitslosengeld) provide earnings-related incomereplacement and are based on an employment record in a reference period (see §127,Social Code III, Sozialgesetzbuch III ). The replacement rate of UB depends on familystatus, while the duration depends on age and previous employment duration. Unemployedpersons with at least one child are entitled to 67% of previous net remuneration and 60%otherwise; individual means or needs are not taken into account. The exact amount iscalculated based on the average gross daily income within the assessment frame of twelvemonths from which social security contributions, income tax and the solidarity surchargewere subtracted to get the average net daily income which is the basis for the UB claim.
Insert Table 1 about here
To generate a claim for UB workers had to be employed for at least 12 months in the lastthree years (Rahmenfrist) before entering unemployment; workers who have been employedless than 12 months within the last three years were not entitled for UB, but could receivemeans-tested social assistance. The maximum duration of unemployment benefits variedbetween 6 and 32 months (see Table 1). Depending on age and months worked in the lastseven years, there exist several discontinuities in the maximum duration of unemploymentbenefits. For the purpose of our analysis we are focusing on the discontinuity at the age of45 for which the maximum benefit duration increases by 6 months - from 12 to 18 months,given the workers have been employed for at least 36 months in the last seven years. Otherdiscontinuities also appear at age 47 and 52 which lead to an increase of the maximumbenefit duration by four months, conditional on previous employment duration of 44 and52 months, respectively. We concentrate on the discontinuity at the age of 45 because theadditional jumps from 18 to 22 and 22 to 26 occur at a very late stage in the unemploymentspell and it seems reasonable to expect that the transition rate from unemployment toemployment is quite low at this stage independent of receiving unemployment benefits orunemployment assistance. Finally, there is another discontinuity at age 57 of six monthsincrease of benefit duration from 26 to 32 months. We do not consider this discontinuityeither because it is very much related to early retirement. See Tatsiramos (2010) for ananalysis of unemployment an early retirement for older workers. The benefits are fundedthrough employer and employee contributions and administered by the Public EmploymentServices (PES).5
After the entitlement period of UB had expired unemployed individuals were eligiblefor principally unlimited and means-tested unemployment assistance (UA, Arbeitslosen-hilfe). These benefits were still earnings-related (57%/53% replacement rate with/withoutchildren). In contrast to UB, the UA was granted for an unlimited period (as long asindividuals were available for the labor market) and funded through the Federal budget,
5The discontinuities were changed within the Hartz reforms, but since these changes became effectiveonly on February 1, 2006 they are not relevant for our analysis.
6

i.e., by general taxation. Finally, the social assistance (SA, Sozialhilfe), provided basicincome protection on a means-tested and flat-rate basis for all German inhabitants. Thisassistance was independent of employment experience but conditional on not having otherresources from earned income, other social benefits or family transfers. This makes clearthat the benefits for unemployed individuals do not drop down to zero once the maximumduration for unemployment benefits is reached.
A worker who enters unemployment and is eligible for unemployment benefits keepsthe entitlement for up to four years. The entitlement expires either after this time periodor if a new entitlement emerges. To generate a new entitlement it is necessary to beemployed for at least 12 months. In case that the worker still had months left from anold UB entitlement, the new entitlement is added to the old one up to the maximumpossible entitlement according to age. Consider the following example. Assume a 44.5years old individual who enters unemployment and who can claim - based on previousemployment record - the maximum benefit duration of 12 months. Let us distinguish twocases. In the first case, the individual exits unemployment for a job after eight monthsand stays employed for less than 12 months before becoming unemployed again. In thissecond unemployment spell the remaining entitlement period will be four months and not18 months. This will be the case, even if the individual has crossed the age threshold of45, because the entitlement is not renewed, as the employment duration between the twounemployment spells was less than 12 months. In the second case, the individual exitsunemployment for a job after eight months but stays employed for at least 12 monthsbefore becoming unemployed again. In this case, the individual who will be older than 45will be entitled to the longer benefit duration of 18 months.
4 Identification and Data
4.1 Regression Discontinuity Approach
The goal of our empirical analysis is to examine the effects of extended benefit durationon unemployment duration and post unemployment outcomes. We have outlined in theprevious Section that German legislation for unemployment benefits contains sharp dis-continuities with respect to age which we will exploit as a source for identification. With aregression discontinuity approach we will be able to measure the effects of the treatmentat some threshold. Following Hahn, Todd, and Van der Klaauw (2001) let Di ∈ {0, 1} bea binary treatment variable indicating whether individuals are below (Di = 0) or above(Di = 1) the threshold. Y 0
i , Y 1i are the individual potential outcomes and Y 1
i − Y 0i is the
individual treatment effect. In the sharp regression discontinuity design, the assignmentDi is a deterministic function of one of the covariates Zi such that:
Di = 1{Zi ≥ c} (1)
The forcing variable Zi in our case is age and the threshold c we are interested in corre-sponds to 45 years. This implies that all individuals change participation status exactly atc. Institutionally this is the case, since the age at entry into unemployment is determining
7

the maximum benefit duration. But still people might wait out with their unemploymentregistration until reaching the age threshold. However, this is unlikely since unemploy-ment needs to be announced already in advance (in order to avoid sanctions) such that apostponement carries a high risk. We will test whether there is evidence for such strategicbehavior. The average causal effect δ of the treatment at the discontinuity point is thengiven by:
δ = E[Y 1i − Y 0
i | Zi = c]
= limz↓c
E[Y 1i | Zi = z]− lim
z↑cE[Y 0
i | Zi = z] (2)
= E[Yi(D = 1)− Yi(D = 0)|Zi = c]
The treatment effect is identified if the conditional mean of Y 0 is continuous at c (i.e.,E[Y d|Z = z] is continuous in z at c for d = {0, 1}). Under this assumption, the treatmenteffect δ is obtained by estimating the discontinuity in the empirical regression function.We are interested in three outcome variables: the unemployment duration, the stability orduration of the subsequent employment spell and reemployment wages.
Many of our observations are right-censored, i.e. we do not observe the end of theunemployment spell before the end of our observation window. In order to take this intoaccount, we estimate a hazard rate model for the transition rate from unemploymentto employment. Unemployment in our case includes “out of labor force” because we areinterested in the effect on the time until the next job and not on the time being officiallyregistered as unemployed. The corresponding hazard rate λue at time t can be written as:
λue(t) = λu0(t) exp(αu1Xi + µuDi + βu0Di(Agei −Age0) + βu1(1−Di)(Agei −Age0)). (3)
where λu0(t) describes the time varying baseline hazard rate and µu captures the causaleffect of the increase in the maximum benefit duration on the hazard rate from unemploy-ment to employment. The parameters βu0 and βu1 capture the effects of the assignmentvariable age below and above the threshold on the probability of leaving unemploymentfor a job. This ensures that µu does not capture a general age effect but the causal im-pact of the discontinuity in the benefit duration, see Lalive (2008) for a similar approachin the context of linear regression models. In addition to that we control for observablecharacteristics Xi.
Besides the transition process from unemployment to employment a main focus of ourstudy is on the effect of extended benefit duration on the stability of new jobs. There-fore, we additionally estimate the hazard rate model for transition from employment tounemployment, which is given by:
λeu(t) = λe0(t) exp(αe1Xei + µeDi + βe0Di(Agei −Age0) + βe1(1−Di)(Agei −Age0)). (4)
The causal effect of extended benefit duration on subsequent job stability is given by µe,λe0(t) describes the time varying baseline hazard rate and αe1 captures the impact of ob-servable characteristics Xei on the transition process from employment to unemployment.Xei includes the previous unemployment duration.
8

Although the assignment into treatment at the beginning of the unemployment isbased on a sharp discontinuity and is therewith assumed to be exogenous, there mightbe dynamic selection in the resulting sample of the re-employed based on observed andunobserved characteristics. For a similar argument in the context of experimental data ontraining see Ham and LaLonde (1996). In order to test whether dynamic selection basedon unobservable characteristics drives our results we will additionally estimate bivariatehazard rate models with potentially correlated unobservables influencing both the durationof unemployment and the duration of subsequent employment.6
For the estimation of the effect of extended benefits on wages we estimate the followinglinear regression:
log(wi) = αwXei + µwDi + βw0Di(Agei −Age0) + βw1(1−Di)(Agei −Age0) (5)
The effect of extended benefit duration on reemployment wages is given by µw, while αw
captures the impact of observable characteristics including the previous unemploymentduration on the logarithm of wages.
As we have outlined in Section 2 and Figure 1, we expect a higher exit rate outof unemployment closer to the time of benefit exhaustion. Corresponding to that, weexpect the treatment effect to vary over time spent in unemployment. For that reason weestimate for the hazard rate from unemployment to employment a specification in which weinteract the baseline hazard rate with the treatment dummy. Since we expect that workersmight become less selective the closer they are to benefit expiration and after their benefitentitlement has expired, we additionally interact the impact of being eligible for 18 monthsof benefits with the time interval in which individuals left the unemployment spell for ajob. These interaction effects will provide insights in the heterogeneity of the treatmenteffects with respect to two dimensions of job match quality, which are employment stabilityand realized wages.
4.2 Data and Sample
Our data are drawn from the IZA Evaluation Data Set which is an ongoing data collec-tion process in order to provide a new data source for labor market research. The IZAEvaluation Data Set is based on two main pillars: the first one is a random inflow sampleinto unemployment in Germany for the years 2001-2007 containing over 855,000 individu-als corresponding to 4.7% of the total population of unemployment entrants. The secondpillar is a survey of roughly 18,000 individuals who were interviewed around two monthsafter they entered unemployment between June 2007 and May 2008 (see Caliendo et al.,2009, for details). For our purpose we focus only on the administrative part and use aninflow sample into unemployment from the years 2001 to 2003. The data is based onthe ‘Integrated Labour Market Biographies’ (ILMB, Integrierte Erwerbs-Biographien) of
6The joint distribution of the unobserved characteristics is modeled via a one factor loading approach,i.e. the unobserved terms are loading on one common factor which allows for flexible correlation betweenthe two terms. For a discussion of factor loading specifications in the context of multivariate proportionalhazard rate models see van den Berg (2001).
9

the Public Employment Services, containing relevant register data from four sources: em-ployment history, unemployment support recipience, participation in active labor marketprograms, and job seeker history. This gives us access to detailed daily information onemployment subject to social security contribution, including occupational and sectoralinformation, and the receipt and level of transfer payments during periods of unemploy-ment, job search, and participation in different programs of active labor market policy.Since we observe the duration in different states like unemployment or employment on adaily basis, this would principally allow us estimation of continuous time duration models.However, as in Germany most of the employment spells start at the begin of a month (andunemployment spells last until the end of a month), we construct discrete time spell datawhere one month corresponds to one time unit. Based on that we estimate discrete timeduration models later on.
Furthermore, a large variety of socio-demographic and qualificational variables is avail-able. We can use variables such as age, marital status, number of children and nationality(German or foreigner). A second class of variables (qualification variables) refers to thehuman capital of the individual. The attributes available are school degree and job quali-fication. Furthermore, we can also draw on an extensive labor market history and careervariables. The available data in this regard is quite extensive (inter alia: nearly com-plete seven-year labor market history; including daily earnings from employment; amountof daily unemployment benefits; previous profession, etc.). The employment outcomes ofthese individuals are observed for 3 years after entering unemployment.
Insert Table 2 about here
Eligibility for unemployment benefits is based on age and previous employment expe-rience. We restrict our sample to men and women from West Germany who have beenemployed for at least 36 months in the last seven years when entering unemployment toensure that extended benefit duration only depends on age. We further restrict our samplefor men to be aged between 44 and 46 years which leaves us with 3,432 male unemployed(see Table 2). For women we choose a slightly larger age range from 43.5 to 46.5 yearswhich results in 3,784 female unemployed. This wider age range for women ensures that wehave enough observations for both males and females in order to allow for heterogeneouseffects. We also consider a second sample which consists of individuals who have beenworking for 12 months in regular employment in the year prior to entering unemployment.This ensures that all individuals in this sample are eligible for 12 and 18 months of benefitentitlement, respectively. This is related to the discussion in Section 3 on the conditionsfor generating a new entitlement to unemployment benefits. Doing so we loose around 30%of the observations leaving roughly 2,200 males and 2,700 females in the sample. We referto this as Sample B and to the former as Sample A.
Insert Table 3 about here
We only consider two labor market states in our analysis: unemployment and em-ployment. The unemployment state includes registered unemployment with or without
10

receiving benefits, participation in active labor market programs, job-seeking (if not inregular employment at the same time) and also being out-of-the labor force. Since we donot have any information about self-employment in the administrative data, the lattermight also include people who became self-employed. The employment state includes onlyindividuals who exit unemployment and who are in regular employment, i.e. those who donot fall in one of the mentioned unemployment categories. Participants in public work pro-grams or individuals receiving wage subsidies are not treated as regular employed. Basedon these definitions, Table 3 contains the number of transitions between the two states. Forboth samples and across gender we observe approximately 25%-30% of the observationsas right-censored in unemployment. That is these individuals do not leave unemploymentwithin our observation period of 36 months. Conditional on having made a transition fromunemployment to employment we also see that around 40% of the men and 50% of thewomen remain in this state until the end of our observation window.
4.3 Descriptives
One important identification assumption is that the assignment to treatment around thethreshold is random. However, firms and workers may alter the timing of layoffs leadingto non-random selection around the threshold. If there is selection around the thresholdwe would expect (i) differences in the inflow probability and (ii) differences in observablecharacteristics for individuals below and above the age 45.
Figure 2 presents the empirical density for different age groups in our samples. Thedensity is quite stable across the age range for men and women in both samples A and B,indicating no systematic selection into the treatment. However, since we observe a slightdifference between the share of men in our sample directly below and above the age 45, wewill conduct additional estimations excluding these groups in order to test the sensitivityof our results.
Insert Figure 2 about here
In addition, we examine the characteristics of job losers below and above the thresh-old. Tables A.1 and A.2 contain some selected descriptives. We find that individuals arevery similar with respect to nearly all of the variables. For men, we do observe only onesignificant difference in the share of individuals with children below the age of 10 whichcan be explained by the fact that individuals below the threshold are on average one yearyounger. For women, we find in addition some significant differences in marital status, twoeducational variables and the time spent in employment in the years 4-7 before enteringunemployment. These differences become largely insignificant once we use only womenin the age range from 44 to 46 years. Comparisons at other ‘artificial’ thresholds whichare unrelated to ours (e.g., at age 41) show similar patterns. This indicates that thesesignificant differences may be driven by age and not by selection around the threshold.Additionally, we will include these characteristics in our estimations.
The comparison of both the observable characteristics and the inflow probabilities be-low and above the threshold do not indicate that workers delay the timing of job separation
11

for the worker to benefit from a longer entitlement period. The reason for this might be thefact that the probability of benefiting from these additional 6 months of benefit durationis quite low at the beginning of the unemployment spell, because most of the individualswill find a new job within the first 12 months of unemployment. In contrast to this, we findstrong evidence for a selection for older workers, indicating that some workers delay theentry into unemployment until they are 57 years old in order to combine unemploymentwith early retirement (see Table 1 for the benefit schemes for older workers).
Figure 3 shows the observed unemployment duration for different groups by age ofentering unemployment. For both men and women the average unemployment durationfor those who enter unemployment after the age of 45 is higher compared to their youngercounterparts below the threshold. A linear regression of unemployment duration on thetreatment dummy and age similar to the specification in Equation 3 shows that receivingsix more months of benefits increases unemployment duration by about two months forboth men and women. In addition, for both men and women above the threshold weobserve a slight increase in unemployment duration as individuals get older.
Since our data set contains many censored observations and the impact of a longerbenefit entitlement may vary over time spent in unemployment it is more informativeto look at empirical hazard rates. Figure 4 shows a spike in the probability of leavingunemployment for a job around month 12, the last month of benefit receipt for the youngergroup, which is larger for women. We also observe that the spike is more pronounced forboth genders in sample B as for the control group of unemployed the potential benefitduration is exactly 12 months. However, the increase in the exit probability is rathermoderate. This might be due to the fact that transfers do not drop to zero once thereceipt of UB expires (see Section 3). Especially if the household does not have any othersources of income, the drop is relatively small compared to other countries like the US.
Insert Figures 3, 4 and 5 about here
Figure 5 presents the empirical hazard rates for the transition from employment tounemployment. In contrast to the hazard rates from unemployment to employment wedo not find a clear pattern for the differences between individuals below and above thethreshold. What is striking is the spike around month 8 to 11 for men in the case of sampleA, which occurs independent of the previous duration of benefit entitlement. This spike isreduced once we condition on being continuously employed for 12 months before enteringunemployment in sample B. This indicates that the spike in the probability of reenteringunemployment is reflecting a seasonal pattern driven by workers who experience a shortperiod of unemployment every year.7
5 Results
We estimate the unemployment and employment transitions and the wage regression de-scribed in section 4.1 for men and women separately. We present the results of two main
7This seasonal pattern can be observed for the complete inflow sample into unemployment and is notspecific to our age group.
12

specifications. In the first specification we include a dummy for being treated. By beingtreated we mean those who enter unemployment above the age of 45 and receive extendedbenefit duration of 18 months. The non-treated or the controls are those who enter unem-ployment below the age of 45 and receive benefits for 12 months. For both transitions andthe wages, this specification identifies an average effect of being treated on the exit ratesfrom unemployment and employment, respectively.
As outlined in Section 4.1, in the second specification, for the unemployment hazard weinteract the treatment dummy with elapsed unemployment duration. For the employmenthazard and the wage regression, we interact the treatment dummy with previous unem-ployment duration. In both cases we specify unemployment duration flexibly by 3-monthintervals. With this specification we can identify the effect of treatment on the exit ratefrom unemployment at different lengths of unemployment, and the effect on subsequentjob match quality.
5.1 Unemployment Hazard
Column (1) of Table 4 shows that eligibility of additional 6 months of unemploymentbenefits has a negative effect on the hazard from unemployment. This average effect issignificant at the 10 per cent level for both males and females.
In column (2) we present the results from the interaction of the treatment dummy withunemployment duration grouped in intervals. For both males and females those eligible to12 months of benefits exhibit a significantly higher exit rate from unemployment close tothe time benefits expire. The difference between treated and controls is therefore negative.This is consistent with the graphical evidence in Figure 4 where we observed a spike inthe unemployment hazard at 12 months for the group with 12 months of benefit duration.We find similar patterns for both males and females for sample B as shown in columns (3)and (4). It is worth noting that the spike is larger for sample B as it is expected, becauseboth groups receive exactly 12 or 18 months of benefits as they have generated a newentitlement.
Similarly to the spike at month 12 we observe another but much smaller spike aroundmonth 18, which is the time of benefit expiration for the unemployed above 45. Thecoefficient estimates for both men and women is positive, which indicates that the treatedgroup exhibits a higher exit rate compared to the control group. However, none of theseeffects are significantly different from zero, but illustrate a similar behavior around boththe exhaustion points of month 12 and month 18. For men, we also observe that the exitrate in months 22-24 is significantly lower for the treated group but this is not observedfor women.
In all specifications we control for a broad range of observable characteristics. Thecoefficients of model A with one treatment dummy are reported in Table A.3 in theAppendix. The coefficients show for example that for men a higher previous wage andprevious employment duration is positively correlated with the re-employment probability,while the corresponding coefficients for females are positive but not significantly differentfrom zero. For males and females we find a clear negative duration dependence, which is
13

significantly reduced once we control for unobserved heterogeneity.
Insert Table 4 about here
5.2 Employment Hazard
Table 5 presents the results for the employment hazard. For both samples and genderscolumns (1) and (3) show that the overall effect of extended benefit duration on the exitrate from subsequent employment is negative but small and not significantly different fromzero. We investigate whether there are heterogeneous effects by interacting the treatmentdummy with previous unemployment duration. As we discussed in section 2, there aretwo periods of interest. The first is the period until month 12, where both treated andcontrols receive benefits while the control group gets closer to the time benefits expire atmonth 12. The second period is the one between month 12 to month 18 in which only thetreated group above age 45 received benefits. We observe from column (2) of Table 5 thatthe non-treated who find jobs close to the time benefits are exhausted and when they donot receive benefits anymore are significantly more likely to exit subsequent employmentcompared to their counterparts with extended benefit duration.
Insert Table 5 about here
For men, this can be seen in column (2) by the negative effect of the coefficient of beingtreated with previous unemployment duration of 10-12 months. Although both treated andcontrols find a job while being benefit recipients, the control group obtains jobs that lastfor a shorter period as they accept jobs closer to the time their benefits expire. Column (4)shows that this effect is smaller for the sample B. We also observe a significantly negativeeffect on the exit rate from employment for jobs found by the treated men after 16-18months in unemployment. This suggests that jobs that are found while still receivingbenefits last longer compared to jobs found after remaining in unemployment for thesame period but with exhausted benefits. For women, we observe a similar effect for jobsfound after 13-15 months in unemployment. Finally, for both genders and both samplesthe effect of extended benefit duration on employment stability remains even after benefitshave elapsed, although this effect is smaller and in most cases not significant. For example,the interaction term of treatment with previous unemployment duration of 19-21 months(right after benefit exhaustion for the treated group) is still negative. Combining thisobservation with the evidence of a small spike in the unemployment hazard at around 19-21 for both genders suggests that the treated after receiving benefits for a longer periodmight not be less selective on the type of jobs they accept.
Similar to the transition process from unemployment to employment we control for abroad range of observable characteristics (see Table A.4 in the Appendix for coefficients ofmodel A with one treatment dummy). Once again, the previous employment experience hasan impact for men. The coefficients show that previous employment duration is negativelycorrelated with the probability of reentering unemployment, while previous wages do nothave an impact. In contrast to the unemployment duration, we find a similar pattern for
14

females. Moreover, the results indicate that jobs are significantly less stable if they arefound after 24 months of unemployment.
5.3 Re-Employment Wages
We extend our analysis considering the wages received in the sample of re-employed indi-viduals. If extended benefit duration leads to better job match quality we should observenot only longer employment duration but also higher wages. The overall effect of extendedbenefit duration on re-employment wages is between 0-5%, but for none of the samplessignificantly different from zero. We also estimate a specification for wages similar withthe one for the employment transition in which we interact the treatment dummy withprevious unemployment duration. Table 6 shows for both men and women and for bothsamples that those who receive extended benefits obtain jobs with higher wages comparedto the their counterparts with benefit duration of 12 months. The effect is significant forjobs that are found close to the benefit expiration of 12 months. This suggests that asbenefits are exhausted for the control group there is a reduction in the reservation wages,which is reflected in re-employment wages. Jobs that are obtained when benefits lapseor when not receiving benefits are not only jobs that last for a shorter period but areassociated with lower wages.
Insert Table 6 about here
The coefficients of the observable characteristics for model A with one treatmentdummy are reported in Table A.5 in the Appendix. The results indicate that the re-employment wage is positively correlated with the previous wage. Moreover, the realizedwages are decreasing the longer the workers have been unemployed. This may reflect adecreasing reservation wage the longer individuals are unemployed.
5.4 Sensitivity Analysis
We have performed additional analyses to investigate the sensitivity of our results. First,we estimated the transitions for a sample in which we excluded the unemployment spellsthat started one month before and one month after the age of 45. In Figure 2 we observeda slight difference in the inflow rate in unemployment around the threshold of 45. Allfindings are robust to the exclusion of these spells. If anything, the effect of treatmenton the unemployment hazard increases in the restricted sample. This can also be seen inFigure 3 where the jump in the unemployment duration around the threshold is largerwhen excluding the spells very close to age 45. We also relaxed the independence assump-tion across transitions and we estimated the model allowing for correlated unobservedheterogeneity. The results indicate that modeling unobserved heterogeneity significantlyimproves the model fit and that the processes of leaving unemployment for a job and thesubsequent employment stability are not independent from each other. However, the effectof extended benefit duration does not differ qualitatively between the models with andwithout unobserved heterogeneity. We still find a significant difference in the unemploy-ment exit rates around month 12 for both genders in both samples. For the employment
15
hazard, we also find that jobs obtained while still receiving benefits last longer comparedto jobs found after remaining in unemployment for the same period but with exhaustedbenefits.
We have also estimated the model considering the exit rate out of the subsequent jobinstead of employment duration. The latter includes job-to-job transitions. We have alsoconsidered a 2-years window after entering unemployment to investigate the sensitivityof our results to the extent of right censoring. We also estimated both transitions afterconsidering the transitions from unemployment to out of the labor force as right-censoredspells. We find very similar results in all cases. For the wage regressions we also estimateda censored tobit model, which did not affect the findings.
6 Conclusion
We estimate the causal effect of extended benefit duration on unemployment duration andon the job match quality using a sharp discontinuity at age 45 on the maximum durationof unemployment benefits in Germany.
We show that there is a spike in the unemployment exit rate at the point when benefitsare exhausted and that extending benefit duration reduces the job-finding rate. We alsoinvestigate the effect of extended benefit duration on subsequent employment stabilityand re-employment wages. Our analysis shows that unemployed who obtain jobs close andafter the time when benefits are exhausted are significantly more likely to exit subsequentemployment and receive lower wages compared to their counterparts with extended benefitduration.
These findings suggest that unemployment benefits do not only create disincentives butmight also improve the quality of the jobs obtained after experiencing an unemploymentspell. An important finding is that jobs that are accepted close and after benefits haveexpired are associated with worse post-unemployment outcomes. This suggests that thespikes in the unemployment hazard that have been found in a number of studies mightbe explained by the fact that workers become less selective as they get closer to benefitexhaustion. A role of policy might be to smooth the transition rate out of unemploymentto prevent workers from being forced to obtain low quality jobs. These effects are likely tobe mitigated by the possibility to receive unemployment assistance after unemploymentinsurance runs out, which is the case in Germany. Future research should shed morelight on the interaction of unemployment insurance and unemployment assistance on theunemployment exit rate and the post-unemployment outcomes. Understanding for whichsub-groups of the population the unemployment insurance job matching effect mattersmore is also another important question.
16

References
Acemoglu, D., and R. Shimer (1999): “Efficient Unemployment Insurance,” Journalof Political Economy, 107, 893–928.
Addison, J. T., and M. L. Blackburn (2000): “The Effects of Unemployment Insuranceon Postunemployment Earnings,” Labour Economics, 7, 21–53.
Addison, J. T., and P. Portugal (2008): “How Do Different Entitlements to Un-employment Benefits Affect the Transitions from Unemployment into Employment?,”Economics Letters, 101, 206–209.
Belzil, C. (1992): “On the Empirical relationship between Unemployment duration, Un-employment Insurance and Voluntary Unemployment,” Economics Letters, 39, 235–240.
(1995): “Unemployment Insurance and Unemployment Over Time: An Analysiswith Event History Data,” Review of Economics and Statistics, 77, 113–26.
(2001): “Unemployment insurance and subsequent job duration: job matchingvs. unobserved heterogeneity,” Journal of Applied Econometrics, 16, 619–633.
Boone, J., and J. C. van Ours (2009): “Why Is There a Spike in the Job Finding Rateat Benefit Exhaustion?,” IZA Discussion Paper, No.4523.
Caliendo, M., A. Falk, L. Kaiser, H. Schneider, A. Uhlendorff, G. Van denBerg, and K.F. Zimmermann (2009): “The IZA Evaluation Dataset,” Working Paper,IZA, Bonn.
Card, D., R. Chetty, and A. Weber (2007a): “Cash-On-Hand and competing Modelsof Intertemporal Behavior: New Evidence from the Labor Market,” Quarterly Journalof Economics, 122, 1511–1560.
(2007b): “The Spike at Benefit Exhaustion: Leaving the Unemployment Systemor Starting a New Job?,” American Economic Review, 97, 113–118.
Card, D., and P. B. Levine (2000): “Extended benefits and the duration of UI spells:Evidence from the New Jersey Extended Benefit Program,” Journal of Public Eco-nomics, 78, 107–138.
Carling, K., P. Edin, A. Harkman, and B. Holmlund (1996): “UnemploymentDuration, Unemployment Benefits, and Labor Market Programs in Sweden,” Journalof Public Economics, 59, 313–334.
Centeno, M. (2004): “The Match Quality Gains from Unemployment Insurance,” Jour-nal of Human Resources, 34, 839–863.
Centeno, M., and A. A. Novo (2009): “Unemployment Insurance Generosity and Post-Unemployment Wages: Quantile Treatment Effects,” mimeo.
Ehrenberg, R. G., and R. L. Oaxaca (1976): “Unemployment Insurance, Duration ofUnemployment, and Subsequent Wage Gain,” American Economic Review, 66, 754–766.
Fitzenberger, B., and R. A. Wilke (2010): “Unemployment Durations in West-Germany Before and After the Reform of the Unemployment Compensation Systemduring the 1980s,” German Economic Review, forthcoming.
17

Gruber, J. (1997): “The Consumption Smoothing Benefits of Unemployment Benefits,”American Economic Review, 87, 192–205.
Hahn, J., P. Todd, and W. Van der Klaauw (2001): “Identification and Estimationof Treatment Effects with a Regression-Discontinuity Design,” Econometrica, 69(1),201–209.
Ham, J. C., and R. LaLonde (1996): “The Effect of Sample Selection and Initial Condi-tions in Duration Models: Evidence from Experimental Data on Training,” Economet-rica, 64, 175–205.
Ham, J. C., and S. Rea (1987): “Unemployment Insurance and Male UnemploymentDuration in Canada,” Journal of Labor Economics, 5, 325–353.
Hansen, G. D., and A. Imrohoroglu (1992): “The Role of Unemployment Insurancein an Economy with Liquidity Constraints and Moral Hazard,” Journal of PoliticalEconomy, 100, 118–142.
Hunt, J. (1995): “The Effect of the Unemployment Compensation on UnemploymentDuration in Germany,” Journal of Labor Economics, 13, 88–120.
Jovanovic, B. (1979): “Job Matching and the Theory of Turnover,” Journal of PoliticalEconomy, 87, 972–990.
Katz, L. F., and B. D. Meyer (1990): “The impact of the potential duration of unem-ployment benefits on the duration of unemployment,” Journal of Public Economics, 41,45–72.
Konle-Seidl, R., W. Eichhorst, and M. Grienberger-Zingerle (2009): “Activa-tion Policies in Germany: From Status Protection to Basic Income Support,” GermanPolicy Studies, p. forthcoming.
Lalive, R. (2008): “How do extended benefits affect unemployment duration? A regres-sion discontinuity approach,” Journal of Econometrics, 142, 785–806.
Lalive, R., J. C. van Ours, and J. Zweimuller (2006): “How Changes in FinancialIncentives Affect the Duration of Unemployment,” Review of Economic Studies, 73,1009–1038.
Lalive, R., and J. Zweimuller (2004): “Benefit Entitlement and Unemployment Du-ration: The Role of Policy Endogeneity,” Journal of Public Economics, 88, 2587–2616.
Marimon, R., and F. Zilibotti (1999): “Unemployment vs. Mismatch of Talents: Re-considering Unemployment Benefits,” Economic Journal, 109, 266–291.
Meyer, B. D. (1990): “Unemployment Insurance and Unemployment Spells,” Economet-rica, 58, 757–782.
Mortensen, D. (1977): “Unemployment Insurance and Job Search Decisions,” Industrialand Labor Relations Review, 30, 505–517.
Roed, K., and T. Zhang (2003): “Does unemployment compensation affect unemploy-ment duration?,” Economic Journal, 113, 190–206.
18

Schneider, H., and R. Hujer (1997): “Wirkungen der Unterstutzungsleistungenauf die Arbeitslosigkeitsdauer in der Bundesrepublik Deutschland: Eine Analyse derQuerschnitts- und Laengsschnittdimension,” in Wirtschafts- und SozialwissenschaftlichePanel-Studien, Datenstrukturen und Analyseverfahren. Sonderhefte zum AllgemeinenStatistischen Archiv, Bd. 30, ed. by G. W. R. Hujer, U. Rendtel, pp. 71–88. Vanden-hoeck and Ruprecht, Goettingen.
Steiner, V. (2001): “Unemployment Persistence in the West German labour market:negative duration dependence or sorting?,” Oxford Bulletin of Economics and Statistics,63(1), 91–113.
Tatsiramos, K. (2009): “Unemployment Insurance in Europe: Unemployment Durationand Subsequent Employment Stability,” Journal of the European Economic Association,7(6), 1225–1260.
(2010): “Job Displacement and the Transitions to Re-Employment and EarlyRetirement for Non-Employed Older Workers,” European Economic Review, p. forth-coming.
Van den Berg, G. J. (1990): “Nonstationarity in Job Search Theory,” Review of Eco-nomic Studies, 57, 255–277.
van den Berg, G. J. (2001): “Duration Models: Specification, Identification, and Mul-tiple Durations,” in Handbook of Econometrics, Vol.5, ed. by J. J. Heckman, andE. Leamer, pp. 3381–3460. North-Holland, Amsterdam.
Van Ours, J., and M. Vodopivec (2006): “How shortening the potential duration ofunemployment benefits entitlement affects the duration of unemployment: evidence froma natural experiment,” Journal of Labor Economics, 24, 351–378.
(2008): “Does Reducing Unemployment Insurance Generosity Reduce Job MatchQuality?,” Journal of Public Economics, 92, 684–695.
Winter-Ebmer, R. (1998): “Potential Unemployment Benefit Duration and SpellLength: Lessons from a Quasi-Experiment in Austria,” Oxford Bulletin of Economicsand Statistics, 60, 33–45.
19

Tables
Table 1: Maximum Duration of Unemploy-ment Benefit
Length of Benefit Age Months workedEntitlement (in years) in last 7 years(in months)
6 - 128 - 1610 - 2012 - 2414 45 2816 45 3218 45 3620 47 4022 47 4424 52 4826 52 5228 57 5630 57 6032 57 64
Source: Social Code III (§117 et seq.)
Table 2: Number of Observations - Belowand Above the Threshold
Men WomenBelow Above Below Above
Sample A 1,768 1,664 1,974 1,810Sample B 1,147 1,094 1,442 1,334
Note: These are the number of men aged44-44.99 (below) and 45-45.99 (above) con-ditional on having been employed for 36months in the last seven years. For women theage range is 43.5-44.99 (below) and 45-46.5(above). Sample B further restricts to individ-uals having worked for exactly 12 months inregular employment in the year prior to enterunemployment.
20

Table 3: Number of Transitions - Below andAbove the Threshold
Men WomenBelow Above Below Above
Sample AObservations 1,768 1,664 1,974 1,810Transitions
From UE to E 1,318 1,198 1,512 1,321in month 1-3 623 534 531 466
4-6 181 196 223 1847-12 201 174 312 228
13-18 133 119 191 17219-24 76 67 111 12024-36 104 108 144 151
Censored 450 466 462 489From E to UE 804 742 716 620
Censored 514 456 796 701
Sample BObservations 1,147 1,094 1,442 1,334Transitions
From UE to E 857 780 1,110 977in month 1-3 392 329 374 328
4-6 108 114 145 1227-12 145 122 246 166
13-18 90 89 152 14319-24 52 48 81 10024-36 70 78 112 118
Censored 290 314 332 357From E to UE 463 431 474 411
Censored 394 349 636 566
Note: These are the number of transitions from un-employment (UE) to employment (E) and vice versafor the two samples.
21

Table 4: Unemployment Hazard Estimates by GenderMen
Sample A Sample BCoeff SE Coeff SE Coeff SE Coeff SE
Treated −0.149∗ 0.086 −0.184∗ 0.104Treated * t(1-3) −0.192∗ 0.100 −0.244∗∗ 0.122Treated * t(4-6) 0.032 0.130 −0.022 0.164Treated * t(7-9) 0.052 0.160 0.044 0.196Treated * t(10-12) −0.510∗∗∗ 0.179 −0.614∗∗∗ 0.209Treated * t(13-15) −0.313∗ 0.189 −0.190 0.223Treated * t(16-18) −0.079 0.206 −0.122 0.248Treated * t(19-21) 0.195 0.255 0.191 0.309Treated * t(22-24) −0.640∗∗ 0.258 −0.633∗∗ 0.305Treated * t(25-28) −0.059 0.199 0.093 0.240Treated * t(29-36) −0.070 0.222 −0.191 0.268
WomenSample A Sample B
Coeff SE Coeff SE Coeff SE Coeff SETreated −0.149∗ 0.080 −0.158∗ 0.093Treated * t(1-3) −0.090 0.097 −0.096 0.115Treated * t(4-6) −0.168 0.123 −0.150 0.150Treated * t(7-9) 0.024 0.142 −0.098 0.165Treated * t(10-12) −0.674∗∗∗ 0.148 −0.734∗∗∗ 0.170Treated * t(13-15) −0.379∗∗ 0.168 −0.318∗ 0.186Treated * t(16-18) −0.013 0.168 −0.033 0.190Treated * t(19-21) −0.183 0.193 −0.070 0.219Treated * t(22-24) 0.176 0.215 0.291 0.247Treated * t(25-28) −0.118 0.172 −0.158 0.194Treated * t(29-36) 0.044 0.193 0.076 0.223
Note: ***/**/* indicate significance at the 1%/5%/10% levels. Full estimation results are available in Table A.3 in the Appendix.
22

Table 5: Employment Hazard Estimates by GenderMen
Sample A Sample BCoeff SE Coeff SE Coeff SE Coeff SE
Treated −0.067 0.107 −0.048 0.139Treated * (PUD 1-3) 0.029 0.118 0.112 0.157Treated * (PUD 4-6) 0.044 0.160 0.110 0.222Treated * (PUD 7-9) −0.206 0.203 −0.077 0.252Treated * (PUD 10-12) −0.433∗ 0.258 −0.338 0.294Treated * (PUD 13-15) 0.047 0.254 −0.035 0.313Treated * (PUD 16-18) −0.449 0.286 −0.737∗∗ 0.345Treated * (PUD 19-21) −0.264 0.385 −0.592 0.473Treated * (PUD 22-24) −0.038 0.389 −0.065 0.443Treated * (PUD 25-28) −0.436 0.329 −0.398 0.373Treated * (PUD 29-36) −0.220 0.526 −0.321 0.611Previous Unemployment Duration (in months)(PUD 4-6) 0.103 0.075 0.088 0.114 0.073 0.106 0.061 0.161(PUD 7-9) 0.165∗ 0.100 0.284∗∗ 0.143 0.281∗∗ 0.124 0.371∗∗ 0.183(PUD 10-12) −0.123 0.121 0.059 0.151 −0.009 0.141 0.171 0.182(PUD 13-15) −0.164 0.125 −0.172 0.171 −0.003 0.155 0.063 0.219(PUD 16-18) 0.044 0.143 0.272 0.190 0.088 0.176 0.490∗∗ 0.217(PUD 19-21) 0.102 0.181 0.263 0.324 0.191 0.229 0.584 0.380(PUD 22-24) 0.172 0.189 0.206 0.242 0.527∗∗ 0.211 0.606∗∗ 0.266PUD 25-28) 0.390∗∗ 0.164 0.616∗∗∗ 0.227 0.679∗∗∗ 0.187 0.952∗∗∗ 0.272(PUD 28-36) 0.741∗∗∗ 0.264 0.879∗∗ 0.399 1.045∗∗∗ 0.304 1.278∗∗∗ 0.477
WomenSample A Sample B
Coeff SE Coeff SE Coeff SE Coeff SETreated −0.047 0.114 −0.136 0.140Treated * (PUD 1-3) 0.056 0.135 −0.014 0.173Treated * (PUD 4-6) −0.139 0.170 −0.118 0.214Treated * (PUD 7-9) 0.180 0.203 0.028 0.243Treated * (PUD 10-12) −0.066 0.217 −0.133 0.254Treated * (PUD 13-15) −0.460∗ 0.236 −0.634∗∗ 0.274Treated * (PUD 16-18) −0.047 0.274 −0.210 0.311Treated * (PUD 19-21) −0.335 0.278 −0.258 0.317Treated * (PUD 22-24) 0.240 0.372 0.240 0.408Treated * (PUD 25-28) −0.349 0.302 −0.514 0.345Treated * (PUD 29-36) 0.288 0.492 0.035 0.560Previous Unemployment Duration (in months)PUD (4-6) 0.272∗∗∗ 0.082 0.362∗∗∗ 0.112 0.318∗∗∗ 0.106 0.367∗∗ 0.148PUD (7-9) 0.188∗ 0.099 0.120 0.149 0.341∗∗∗ 0.122 0.320∗ 0.178PUD (10-12) 0.038 0.104 0.093 0.129 0.295∗∗ 0.124 0.350∗∗ 0.153PUD (13-15) 0.151 0.117 0.372∗∗ 0.154 0.238∗ 0.137 0.514∗∗∗ 0.182PUD (16-18) −0.012 0.137 0.036 0.203 0.272∗ 0.158 0.369 0.227PUD (19-21) 0.431∗∗∗ 0.139 0.617∗∗∗ 0.184 0.533∗∗∗ 0.162 0.654∗∗∗ 0.221PUD (22-24) 0.159 0.182 0.046 0.280 0.508∗∗ 0.199 0.341 0.318PUD (25-28) 0.318∗∗ 0.152 0.507∗∗ 0.193 0.487∗∗∗ 0.174 0.714∗∗∗ 0.221PUD (29-36) 0.535∗∗ 0.245 0.396 0.372 0.712∗∗ 0.280 0.671 0.418
Note: ***/**/* indicate significance at the 1%/5%/10% levels. Full estimation results are available in Table A.4 in the Appendix.
23

Table 6: Re-Employment Wage (in logs) Estimates by GenderMen
Sample A Sample BCoeff SE Coeff SE Coeff SE Coeff SE
Treated 0.025 0.024 0.049 0.030Treated * (PUD 1-3) −0.001 0.026 0.001 0.033Treated * (PUD 4-6) 0.044 0.037 0.071 0.045Treated * (PUD 7-9) 0.096∗ 0.050 0.115∗∗ 0.054Treated * (PUD 10-12) 0.095∗ 0.054 0.148∗∗ 0.067Treated * (PUD 13-15) 0.074 0.060 0.169∗∗ 0.076Treated * (PUD 16-18) −0.069 0.076 −0.079 0.096Treated * (PUD 19-21) 0.061 0.091 0.167 0.126Treated * (PUD 22-24) −0.036 0.103 −0.092 0.131Treated * (PUD 25-28) 0.063 0.075 0.087 0.089Treated * (PUD 29-36) 0.015 0.120 0.154 0.167Previous Unemployment Duration (in months)(PUD 4-6) −0.070∗∗∗ 0.017 −0.091∗∗∗ 0.022 −0.055∗∗∗ 0.021 −0.089∗∗∗ 0.026(PUD 7-9) −0.065∗∗∗ 0.024 −0.116∗∗∗ 0.038 −0.057∗∗ 0.026 −0.117∗∗∗ 0.039(PUD 10-12) −0.109∗∗∗ 0.027 −0.150∗∗∗ 0.038 −0.148∗∗∗ 0.035 −0.208∗∗∗ 0.049(PUD 13-15) −0.120∗∗∗ 0.029 −0.154∗∗∗ 0.041 −0.121∗∗∗ 0.037 −0.200∗∗∗ 0.058(PUD 16-18) −0.140∗∗∗ 0.037 −0.103∗∗ 0.050 −0.219∗∗∗ 0.048 −0.175∗∗∗ 0.065(PUD 19-21) −0.170∗∗∗ 0.046 −0.204∗∗∗ 0.062 −0.251∗∗∗ 0.060 −0.344∗∗∗ 0.103(PUD 22-24) −0.088∗∗ 0.045 −0.078∗ 0.047 −0.153∗∗ 0.058 −0.120∗∗ 0.059PUD 25-28) −0.225∗∗∗ 0.038 −0.258∗∗∗ 0.059 −0.308∗∗∗ 0.043 −0.353∗∗∗ 0.075(PUD 28-36) −0.292∗∗∗ 0.059 −0.299∗∗∗ 0.094 −0.271∗∗∗ 0.078 −0.358∗∗ 0.141
WomenSample A Sample B
Coeff SE Coeff SE Coeff SE Coeff SETreated −0.008 0.042 0.032 0.049Treated * (PUD 1-3) −0.053 0.044 −0.006 0.053Treated * (PUD 4-6) −0.031 0.061 −0.035 0.073Treated * (PUD 7-9) 0.063 0.071 0.067 0.085Treated * (PUD 10-12) 0.150∗ 0.085 0.262∗∗ 0.093Treated * (PUD 13-15) 0.074 0.098 0.168 0.109Treated * (PUD 16-18) −0.091 0.109 −0.032 0.126Treated * (PUD 19-21) −0.001 0.128 0.061 0.144Treated * (PUD 22-24) −0.077 0.161 −0.184 0.182Treated * (PUD 25-28) −0.072 0.114 −0.070 0.133Treated * (PUD 29-36) 0.071 0.141 0.029 0.161Previous Unemployment Duration (in months)PUD (4-6) −0.115∗∗∗ 0.027 −0.125∗∗∗ 0.034 −0.079∗∗ 0.033 −0.066 0.042PUD (7-9) −0.137∗∗∗ 0.033 −0.195∗∗∗ 0.048 −0.142∗∗∗ 0.039 −0.177∗∗∗ 0.056PUD (10-12) −0.410∗∗∗ 0.041 −0.488∗∗∗ 0.054 −0.401∗∗∗ 0.046 −0.502∗∗∗ 0.062PUD (13-15) −0.241∗∗∗ 0.047 −0.298∗∗∗ 0.071 −0.270∗∗∗ 0.052 −0.351∗∗∗ 0.080PUD (16-18) −0.538∗∗∗ 0.053 −0.514∗∗∗ 0.078 −0.574∗∗∗ 0.061 −0.557∗∗∗ 0.089PUD (19-21) −0.463∗∗∗ 0.063 −0.486∗∗∗ 0.086 −0.505∗∗∗ 0.071 −0.536∗∗∗ 0.102PUD (22-24) −0.569∗∗∗ 0.077 −0.550∗∗∗ 0.120 −0.530∗∗∗ 0.088 −0.416∗∗∗ 0.136PUD (25-28) −0.565∗∗∗ 0.055 −0.554∗∗∗ 0.076 −0.566∗∗∗ 0.064 −0.533∗∗∗ 0.091PUD (29-36) −0.529∗∗∗ 0.070 −0.591∗∗∗ 0.095 −0.571∗∗∗ 0.080 −0.586∗∗∗ 0.101
Note: ***/**/* indicate significance at the 1%/5%/10% levels. Full estimation results are available in Table A.5 in the Appendix.
24

Figures
Figure 1: Stylized Expected Treatment Effect
Note: In our empirical analysis T1 = 12, while T2 = 18.
25

Figure 2: Density of the Forcing Variable (Inflows by Age)
Men - Sample A Men - Sample B
Women - Sample A Women - Sample B
Source: IZA Evaluation Data Set, own calculations.
26

Figure 3: Duration of First Unemployment Spell
Men - Sample A Men - Sample B
Women - Sample A Women - Sample B
Source: IZA Evaluation Data Set, own calculations.
27
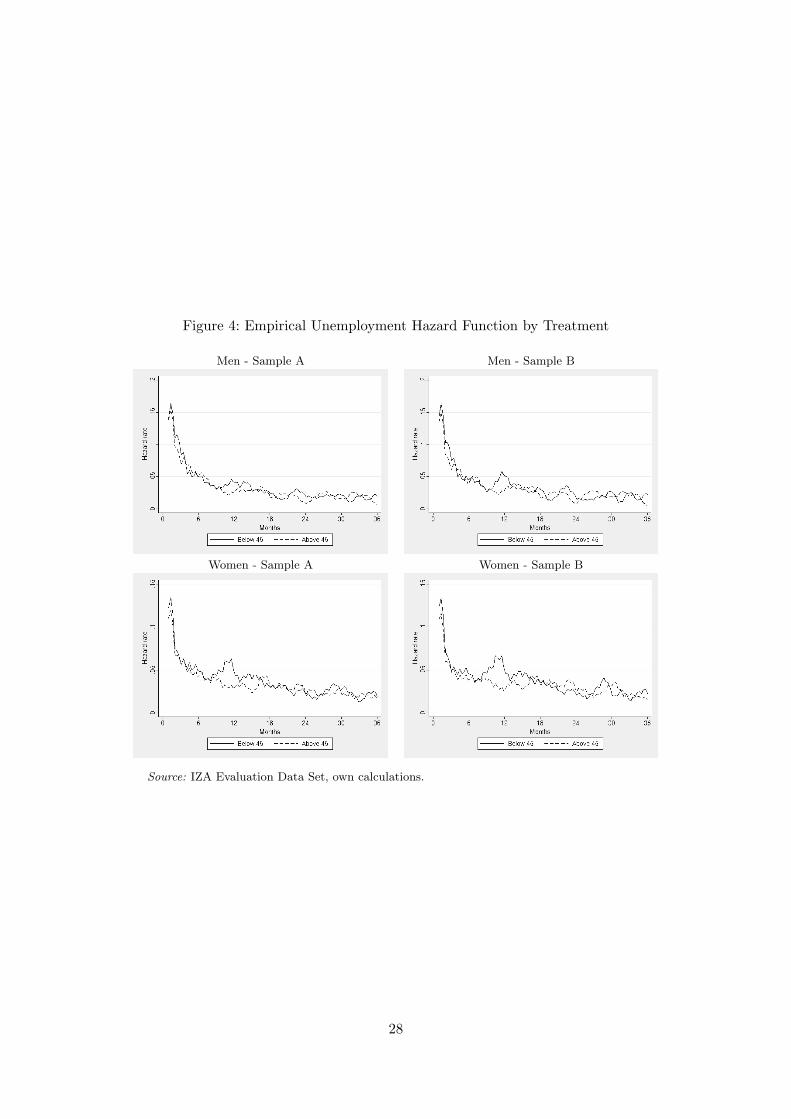
Figure 4: Empirical Unemployment Hazard Function by Treatment
Men - Sample A Men - Sample B
Women - Sample A Women - Sample B
Source: IZA Evaluation Data Set, own calculations.
28
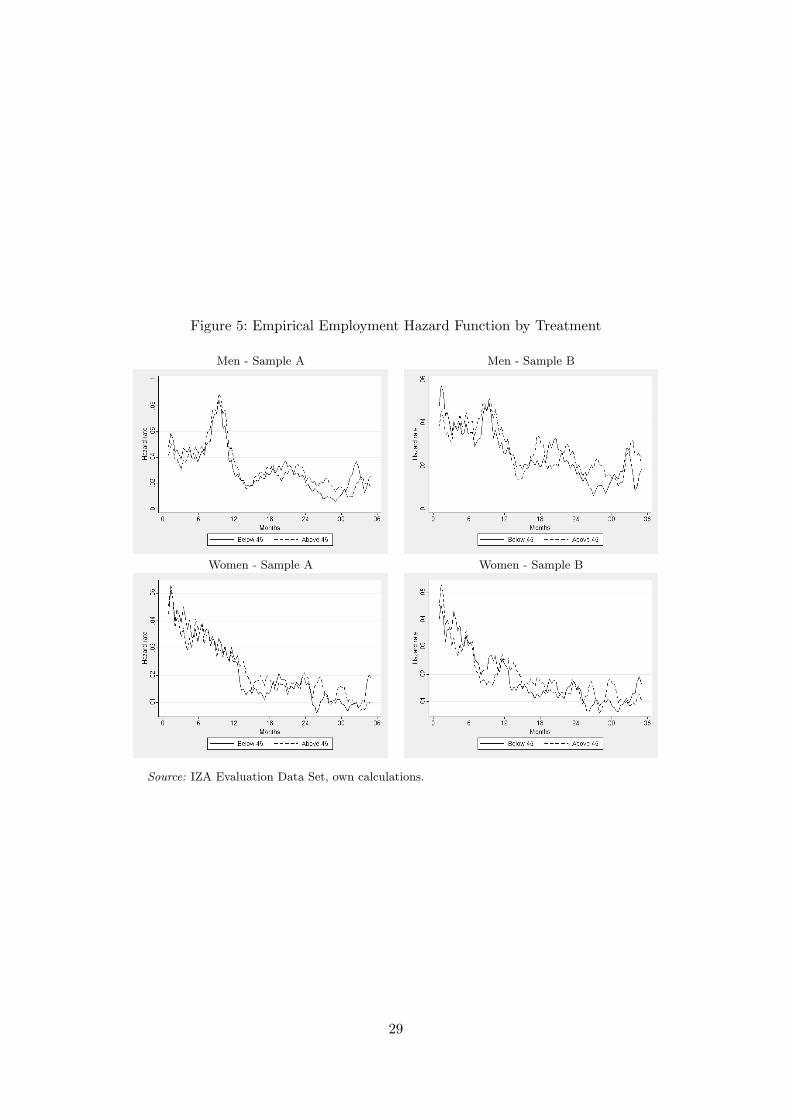
Figure 5: Empirical Employment Hazard Function by Treatment
Men - Sample A Men - Sample B
Women - Sample A Women - Sample B
Source: IZA Evaluation Data Set, own calculations.
29

A Supplementary Tables
Table A.1: Selected Descriptives and t-Test of Mean Equality for the Two Samples -Men
Age Group Sample A Sample BBelow Above p-value Below Above p-value
N 1768 1664 1147 1094Age (in years) 44.49 45.50 0.00 44.49 45.50 0.00Marital status
Married 0.63 0.64 0.52 0.63 0.64 0.70Nationality
Non-German 0.10 0.10 0.77 0.09 0.09 0.71Migration background 0.04 0.03 0.14 0.04 0.03 0.72Children ≤ 10 years 0.17 0.14 0.01 0.18 0.15 0.12School Degree
No degree 0.08 0.09 0.39 0.08 0.09 0.47Low 0.60 0.60 0.97 0.56 0.54 0.53Medium 0.16 0.14 0.12 0.18 0.15 0.13High 0.16 0.17 0.43 0.18 0.21 0.09
Apprenticeship (yes) 0.81 0.79 0.25 0.79 0.78 0.43University Degree (yes) 0.11 0.13 0.26 0.14 0.16 0.16Occupational Group
Agriculture, Other 0.04 0.03 0.75 0.02 0.02 0.76Manufacturing 0.48 0.50 0.50 0.46 0.46 0.91Technical Occupations 0.06 0.06 0.97 0.08 0.08 0.80Services 0.42 0.41 0.58 0.44 0.44 0.91
Labor Market HistoryLast daily income (in Euro) 75.92 75.94 0.99 81.44 82.00 0.72Employment last 3 years (in months) 30.66 30.64 0.95 33.82 33.80 0.91Employment last 4-7 years (in months) 39.00 39.33 0.40 39.41 39.44 0.95Unemployed last 7 years (in months) 5.38 5.39 0.94 3.21 3.16 0.80
Months in employment - Year t-1 10.50 10.44 0.55 12.00 12.00t-2 10.02 10.11 0.45 11.11 11.19 0.45t-3 10.16 10.11 0.64 10.71 10.62 0.45
Year cohort2001 0.27 0.27 0.96 0.26 0.26 0.842002 0.35 0.34 0.45 0.37 0.36 0.702003 0.38 0.39 0.49 0.37 0.38 0.57
Source: IZA Evaluation Data Set, own calculations.Note: p-value for t-test of mean equality between above/below age groups.
30

Table A.2: Selected Descriptives and t-Test of Mean Equality for the Two Samples -Women
Age Group Sample A Sample BBelow Above p-value Below Above p-value
N 1974 1810 1442 1334Age (in years) 44.24 45.75 0.00 44.24 45.74 0.00Marital status
Married 0.62 0.64 0.13 0.62 0.65 0.07Nationality
Non-German 0.06 0.06 0.73 0.06 0.05 0.33Migration background 0.02 0.02 0.64 0.02 0.02 0.35Children ≤ 10 years 0.08 0.05 0.00 0.07 0.05 0.01School Degree
No degree 0.06 0.07 0.19 0.05 0.06 0.45Low 0.50 0.53 0.07 0.47 0.52 0.01Medium 0.28 0.26 0.22 0.28 0.27 0.26High 0.17 0.15 0.07 0.19 0.15 0.01
Apprenticeship (yes) 0.80 0.79 0.39 0.81 0.81 0.58University Degree (yes) 0.10 0.10 0.63 0.12 0.09 0.06Occupational Group
Agriculture, Other 0.02 0.02 0.98 0.01 0.01 0.69Manufacturing 0.17 0.16 0.51 0.15 0.15 0.50Technical Occupations 0.02 0.02 0.54 0.02 0.02 0.41Services 0.79 0.80 0.69 0.82 0.82 0.83
Labor Market HistoryLast daily income (in Euro) 49.96 50.53 0.59 53.22 52.63 0.63Employment last 3 years (in months) 31.39 31.26 0.59 33.84 33.91 0.67Employment last 4-7 years (in months) 36.37 37.28 0.04 36.15 37.31 0.03Unemployed last 7 years (in months) 4.21 4.15 0.74 2.87 2.64 0.20
Months in employment - Year t-1 10.80 10.76 0.57 12.00 12.00t-minus2 10.38 10.27 0.31 11.22 11.24 0.76t-minus3 10.21 10.23 0.85 10.63 10.68 0.66
Year cohort2001 0.28 0.30 0.20 0.26 0.28 0.142002 0.33 0.33 0.93 0.34 0.33 0.552003 0.39 0.37 0.27 0.40 0.39 0.45
Source: IZA Evaluation Data Set, own calculations. Note: p-value for t-test of mean equality betweenabove/below age groups.
31

Table A.3: Unemployment Hazard Estimates by GenderMen Women
Coeff SE Coeff SETreated −0.149∗ 0.086 −0.149∗ 0.080Age (untreated) 0.185∗ 0.107 −0.074 0.066Age (treated) −0.035 0.103 0.098 0.064School Degree (Ref.: No Degree)
Low 0.102 0.081 0.066 0.090Medium −0.107 0.097 0.035 0.096High −0.106 0.105 −0.084 0.109
Apprenticeship 0.223∗∗∗ 0.068 0.211∗∗∗ 0.058University Degree 0.003 0.095 −0.051 0.092Occupational Group (Ref.: Agriculture, Other)
Manufacturing −0.111 0.129 0.463∗∗ 0.186Technical Occupations −0.348∗∗ 0.157 0.216 0.230Services −0.358∗∗∗ 0.132 0.459∗∗ 0.180
Marital StatusMarried 0.227∗∗∗ 0.046 0.040 0.042
Children ≤ 10 years −0.066 0.062 −0.206∗∗ 0.087Nationality
Non-German −0.209∗∗∗ 0.079 −0.140 0.090Migration background 0.245∗∗ 0.109 0.407∗∗∗ 0.126
Labor Market HistoryLast daily income (in Euro) 0.002∗∗∗ 0.001 0.001∗ 0.001Employment last 3 years (in months) 0.013∗∗∗ 0.003 0.002 0.003Employment last 4-7 years (in months) 0.005∗∗ 0.002 0.000 0.001
Entry into Unemployment (Ref.: 2001)2002 −0.111∗ 0.057 −0.140∗∗∗ 0.0512003 0.044 0.054 −0.169∗∗∗ 0.049
Duration Dependence (Ref.: t(1-3), in months)t(4-6) −0.867∗∗∗ 0.063 −0.715∗∗∗ 0.062t(7-9) −1.289∗∗∗ 0.078 −0.993∗∗∗ 0.071t(10-12) −1.457∗∗∗ 0.086 −0.856∗∗∗ 0.071t(13-15) −1.501∗∗∗ 0.092 −1.121∗∗∗ 0.083t(16-18) −1.609∗∗∗ 0.101 −1.022∗∗∗ 0.084t(19-21) −2.023∗∗∗ 0.125 −1.252∗∗∗ 0.096t(22-24) −1.911∗∗∗ 0.124 −1.401∗∗∗ 0.106t(25-28) −2.033∗∗∗ 0.098 −1.483∗∗∗ 0.085t(29-36) −2.173∗∗∗ 0.110 −1.623∗∗∗ 0.096
Constant −2.703∗∗∗ 0.194 −2.714∗∗∗ 0.234
Note: ***/**/* indicate significance at the 1%/5%/10% levels. This refers to column (1) in Table 4(Sample A with treatment dummy).
32

Table A.4: Employment Hazard Estimates by GenderMen Women
Coeff SE Coeff SETreated −0.067 0.107 −0.047 0.114Age (untreated) 0.222∗ 0.124 0.102 0.094Age (treated) −0.071 0.128 −0.064 0.092School Degree (Ref.: No Degree)
Low 0.037 0.098 0.180 0.128Medium −0.218∗ 0.123 0.103 0.138High −0.110 0.142 0.054 0.154
Apprenticeship 0.131 0.087 −0.150∗ 0.083University Degree −0.318∗∗ 0.138 −0.094 0.124Occupational Group (Ref.: Agriculture, Other)
Manufacturing −0.069 0.130 −0.187 0.199Technical Occupations −0.308∗ 0.180 −0.507 0.310Services −0.309∗∗ 0.135 −0.318∗ 0.191
Marital StatusMarried −0.135∗∗ 0.058 −0.220∗∗∗ 0.058
Children ≤ 10 years 0.042 0.077 −0.303∗∗ 0.130Nationality
Non-German 0.253∗∗∗ 0.093 0.066 0.127Migration background 0.029 0.128 0.008 0.179
Labor Market HistoryLast daily income (in Euro) −0.001 0.001 −0.001 0.001Employment last 3 years (in months) −0.029∗∗∗ 0.004 −0.024∗∗∗ 0.004Employment last 4-7 years (in months) −0.013∗∗∗ 0.003 −0.007∗∗∗ 0.002
Entry into Unemployment (Ref.: 2001)2002 0.057 0.069 0.190∗∗ 0.0732003 0.203∗∗∗ 0.066 0.263∗∗∗ 0.071
Previous Unemployment Duration (in months)PUD (4-6) 0.103 0.075 0.272∗∗∗ 0.082PUD (7-9) 0.165∗ 0.100 0.188∗ 0.099PUD (10-12) −0.123 0.121 0.038 0.104PUD (13-15) −0.164 0.125 0.151 0.117PUD (16-18) 0.044 0.143 −0.012 0.137PUD (19-21) 0.102 0.181 0.431∗∗∗ 0.139PUD (22-24) 0.172 0.189 0.159 0.182PUD (25-28) 0.390∗∗ 0.164 0.318∗∗ 0.152PUD (29-36) 0.741∗∗∗ 0.264 0.535∗∗ 0.245
Duration Dependence (Ref.: t(1-3), in months)t(4-6) −0.032 0.086 −0.201∗∗ 0.084t(7-9) 0.384∗∗∗ 0.082 −0.300∗∗∗ 0.091t(10-12) 0.320∗∗∗ 0.093 −0.427∗∗∗ 0.100t(13-15) −0.740∗∗∗ 0.135 −1.050∗∗∗ 0.131t(16-18) −0.376∗∗∗ 0.123 −0.942∗∗∗ 0.131t(19-21) −0.258∗∗ 0.125 −1.014∗∗∗ 0.142t(22-24) −0.354∗∗ 0.140 −0.845∗∗∗ 0.140t(25-28) −0.980∗∗∗ 0.149 −1.223∗∗∗ 0.139t(29-36) −0.589∗∗∗ 0.171 −1.397∗∗∗ 0.210
Constant −1.655∗∗∗ 0.229 −1.860∗∗∗ 0.271
Note: ***/**/* indicate significance at the 1%/5%/10% levels. This refers to column (1) in Table 5(Sample A with treatment dummy).
33

Table A.5: Re-Employment Wage (in logs) Estimates by GenderMen Women
Coeff SE Coeff SETreated 0.025 0.024 −0.008 0.042Age (untreated) 0.014 0.029 0.035 0.035Age (treated) −0.016 0.027 −0.001 0.033School Degree (Ref.: No Degree)
Low −0.011 0.023 0.005 0.044Medium 0.015 0.029 0.151∗∗∗ 0.048High 0.036 0.035 0.187∗∗∗ 0.057
Apprenticeship 0.090∗∗∗ 0.021 0.101∗∗∗ 0.031University Degree 0.117∗∗∗ 0.036 0.165∗∗∗ 0.047Occupational Group (Ref.: Agriculture, Other)
Manufacturing 0.000 0.033 0.102 0.083Technical Occupations 0.111∗∗ 0.045 0.389∗∗∗ 0.118Services −0.031 0.034 0.102 0.080
Marital StatusMarried 0.066∗∗∗ 0.014 −0.127∗∗∗ 0.021
Children ≤ 10 years 0.031∗ 0.016 −0.185∗∗∗ 0.058Nationality
Non-German −0.049∗∗ 0.025 0.096∗∗ 0.043Migration background −0.010 0.028 0.017 0.069
Labor Market HistoryLast daily income (in Euro) 0.004∗∗∗ 0.000 0.005∗∗∗ 0.001Employment last 3 years (in months) 0.002∗∗ 0.001 0.001 0.001Employment last 4-7 years (in months) 0.002∗∗∗ 0.001 0.001 0.001
Entry into Unemployment (Ref.: 2001)2002 −0.025 0.015 −0.042 0.0262003 −0.033∗∗ 0.015 −0.087∗∗∗ 0.025
Previous Unemployment Duration (in months)PUD (4-6) −0.070∗∗∗ 0.017 −0.115∗∗∗ 0.027PUD (7-9) −0.065∗∗∗ 0.024 −0.137∗∗∗ 0.033PUD (10-12) −0.109∗∗∗ 0.027 −0.410∗∗∗ 0.041PUD (13-15) −0.120∗∗∗ 0.029 −0.241∗∗∗ 0.047PUD (16-18) −0.140∗∗∗ 0.037 −0.538∗∗∗ 0.053PUD (19-21) −0.170∗∗∗ 0.046 −0.463∗∗∗ 0.063PUD (22-24) −0.088∗∗ 0.045 −0.569∗∗∗ 0.077PUD (25-28) −0.225∗∗∗ 0.038 −0.565∗∗∗ 0.055PUD (29-36) −0.292∗∗∗ 0.059 −0.529∗∗∗ 0.070
Constant 3.664∗∗∗ 0.055 3.365∗∗∗ 0.105
Note: ***/**/* indicate significance at the 1%/5%/10% levels. This refers to column (1) in Table 6(Sample A with treatment dummy).
34