benefits and costs of federal regulations and agency ... · pdf file2016 draft report to...
TRANSCRIPT

2016 Draft Report to Congress on the Benefits and Costs of Federal Regulations and Agency
Compliance with the Unfunded Mandates Reform Act
2016
OFFICE OF MANAGEMENT AND BUDGET OFFICE OF INFORMATION AND REGULATORY AFFAIRS

2016 DRAFT REPORT TO CONGRESS ON THE BENEFITS AND COSTS OF FEDERAL REGULATIONS AND
AGENCY COMPLIANCE WITH THE UNFUNDED MANDATES REFORM ACT
EXECUTIVE SUMMARY ..................................................................................................................... 1
PART I: 2016 REPORT TO CONGRESS ON THE BENEFITS AND COSTS OF FEDERAL REGULATIONS ............................................................................................................................... 4
Chapter I: The Benefits and Costs of Federal Regulations ......................................................... 5
A. Estimates of the Aggregated Annual Benefits and Costs of Regulations Reviewed by OMB over the Last Ten Years ...................................................................................... 7
B. Trends in Annual Benefits and Costs of Regulations Reviewed by OMB over the Last Ten Years .................................................................................................................... 19
C. Estimates of the Benefits and Costs of Major Rules Issued in Fiscal Year 2015 ....... 21
Chapter II: The Impact of Federal Regulation on State, Local, and Tribal Governments, Small Business, Wages and Employment, and Economic Growth ..................................................... 34
A. Impacts on State, Local, and Tribal Governments ...................................................... 34
B. Impact on Small Business ........................................................................................... 36
C. Impact on Wages and Employment ............................................................................ 38
D. Impact on Economic Growth ...................................................................................... 46
Chapter III: Recommendations for Reform .............................................................................. 50
A. Current Efforts to Encourage Retrospective Review by Agencies ............................. 51
B. Improving Retrospective Review by Agencies........................................................... 52
PART II: NINETEENTH ANNUAL REPORT TO CONGRESS ON AGENCY COMPLIANCE WITH THE UNFUNDED MANDATES REFORM ACT ............................................................................. 54
A. Environmental Protection Agency ............................................................................... 57
B. Department of Energy .................................................................................................. 58
C. Department of Health and Human Services ................................................................. 58
D. Departments of Health and Human Services, Labor, and the Treasury ....................... 59
E. Department of Labor .................................................................................................... 59
F. Department of Transportation ...................................................................................... 60
APPENDIX A: CALCULATION OF BENEFITS AND COSTS .............................................................. 61
APPENDIX B: THE BENEFITS AND COSTS OF FISCAL YEAR 2005 MAJOR RULES ...................... 80
APPENDIX C: INFORMATION ON THE REGULATORY ANALYSES FOR MAJOR RULES BY INDEPENDENT AGENCIES ...................................................................................................................................... 82
APPENDIX D: REFERENCES ............................................................................................................ 85

1
EXECUTIVE SUMMARY
The Regulatory Right-to-Know Act calls for the Office of Management and Budget
(OMB) to submit to Congress each year “an accounting statement and associated report” including:
(A) an estimate of the total annual benefits and costs (including quantifiable and nonquantifiable effects) of Federal rules and paperwork, to the extent feasible:
(1) in the aggregate; (2) by agency and agency program; and (3) by major rule;
(B) an analysis of impacts of Federal regulation on State, local, and tribal government, small business, wages, and economic growth; and
(C) recommendations for reform.
The Regulatory Right-to-Know Act does not define “major rule.” For the purposes of this Report, we define major rules to include all final rules promulgated by an Executive Branch agency that meet at least one of the following three conditions:
• Rules designated as major under 5 U.S.C. § 804(2);1 • Rules designated as meeting the analysis threshold under the Unfunded Mandates
Reform Act of 1995 (UMRA);2 or • Rules designated as “economically significant” under section 3(f)(1) of Executive
Order 12866.3 This report covers cost and benefits through Fiscal Year (FY) 2015. The principal
findings of this Report are as follows.
1A major rule is defined in Subtitle E of the Small Business Regulatory Enforcement Fairness Act of 1996 as a rule that is likely to result in: "(A) an annual effect on the economy of $100,000,000 or more; (B) a major increase in costs or prices for consumers, individual industries, Federal, State, or local government agencies, or geographic regions; or (C) significant adverse effects on competition, employment, investment, productivity, innovation, or on the ability of United States-based enterprises to compete with foreign-based enterprises in domestic and export markets." P.L. 104-121, Sec. 804, 5 U.S.C. § 804(2). In order for a rule to take effect, agencies must submit a report to each House of Congress and GAO and make available “a complete copy of any cost-benefit analysis of the rule.” 2A written statement containing a qualitative and quantitative assessment of the anticipated benefits and costs of the Federal mandate is required under the Section 202(a) of the Unfunded Mandates Reform Act of 1995 for all rules that may result in: "the expenditure by State, local, and tribal governments, in the aggregate, or by the private sector, of $100,000,000 or more (adjusted annually for inflation) in any one year." 2 U.S.C. § 1532(a). 3A regulatory action is considered “economically significant” under Executive Order 12866 § 3(f)(1) if it is likely to result in a rule that may have: "an annual effect on the economy of $100 million or more or adversely affect in a material way the economy, a sector of the economy, productivity, competition, jobs, the environment, public health or safety, or State, local, or tribal governments or communities."

2
• The estimated annual benefits of major Federal regulations reviewed by OMB from October 1, 2005, to September 30, 2015,4 for which agencies estimated and monetized both benefits and costs5, are in the aggregate between $208 billion and $672 billion, while the estimated annual costs are in the aggregate between $57 billion and $85 billion, reported in 2001 dollars. In 2014 dollars, aggregate annual benefits are estimated to be between $269 and $872 billion and costs between $74 and $110 billion. These ranges reflect uncertainty in the benefits and costs of each rule at the time that it was evaluated.
• There is substantial variation across agencies in the total net benefits expected from rules. Some rules are anticipated to produce far higher net benefits than others. Over the last decade, a few rules have had net costs, and these rules are often the result of legal requirements. All of these estimates reflect the challenges associated with fully capturing the relevant effects—both benefits and costs.
• During fiscal year FY 2015, executive agencies promulgated 59 major rules, of
which 29 were “transfer” rules – rules that primarily caused income or wealth transfers. Most transfer rules implement Federal budgetary programs as required or authorized by Congress, such as rules associated with the Medicare Program and the Federal Pell Grant Program. More information about the FY 2015 major rules follows:
For 21 rules, the issuing agencies quantified and monetized both benefits
and costs: a total of $19.6 billion to $36.9 billion in annual benefits and $4.2 billion to $5.3 billion in annual costs.
For two rules, the issuing agency was able to quantify and monetize only benefits.
For five rules, the issuing agencies were able to quantify and monetize only costs, in some cases only partially. Also, one notice (which met the E.O. 12866 definition of a “rule”) has its cost estimates listed.
For one rule, the issuing agency was able to quantify and monetize neither costs nor benefits.
For 27 of the 29 transfer rules, the issuing agencies quantified and monetized the transfer amounts, at least partially. (The transfer amounts reflect the principal economic consequences of such rules.)
4We explain later in the Report that OMB chose a ten-year period for aggregation because pre-regulation estimates prepared for rules adopted more than ten years ago are of questionable relevance today. 5 There is one rule for which OMB has monetized the agency’s estimates: Standards of Performance for Stationary Compression Ignition Internal Combustion Engines (2007 Report). Please see Table I-4 in that report for details about specific adjustments.

3
• The independent regulatory agencies, whose regulations are not subject to OMB review under Executive Orders 12866 and 13563, issued ten major final rules in FY 2015. The majority of rules were issued to regulate the financial sector.
• The estimated annual net benefits, benefits net of costs, of major Federal regulations reviewed by OMB from January 21, 2009, to September 30, 2015 (this Administration), for which agencies estimated and monetized both benefits and costs, is between approximately $103 and $393 billion (2001$).
It is important to emphasize that the estimates used here have limitations. These estimates reflect the current state of science and information available to agencies. Insufficient empirical information and data is a continuing challenge to agencies when assessing the likely effects of regulation. In some cases, the quantification of various effects is speculative and may not be complete. For example, the value of particular categories of benefits (such as protection of homeland security or personal privacy) may be sizable but monetization can present significant challenges. As Executive Order 13563 recognizes, some rules produce benefits that cannot be adequately captured in monetary equivalents (at least, with currently-available data and methods). Careful consideration of costs and benefits is best understood as a pragmatic way of helping to ensure that regulations will improve social welfare.
Chapter I summarizes the benefits and costs of major regulations issued between October 1, 2005 and September 30, 2015 and examines in more detail the benefits and costs of major Federal regulations issued in FY 2015. It also discusses regulatory impacts on State, local, and tribal governments, small business, wages, and economic growth. Chapter II provides recommendations for reform.
This Report is being issued along with OMB’s Nineteenth Annual Report to Congress on Agency Compliance with UMRA (Pub. L. No. 104-4, 2 U.S.C. § 1538). OMB reports on agency compliance with Title II of UMRA, which requires that each agency conduct a cost-benefit analysis and select the least costly, most cost-effective, or least burdensome alternative before promulgating any proposed or final rule that may result in expenditures of more than $100 million (adjusted for inflation) in at least one year by State, local, and tribal governments, or by the private sector. Each agency must also seek input from State, local, and tribal governments.
Upon publication of this draft report at www.whitehouse.gov/omb/inforeg_regpol_reports_congress/, OMB will request public comment via a Federal Register notice and will seek input from peer reviewers with expertise in areas related to regulatory policy or cost-benefit analysis. The final version of this report will include revisions made in response to public and peer reviewer comments, and will—like the draft report—be posted on the White House website.

4
PART I: 2016 REPORT TO CONGRESS ON THE BENEFITS AND COSTS OF
FEDERAL REGULATIONS

5
Chapter I: The Benefits and Costs of Federal Regulations
This chapter consists of two parts: (A) the accounting statement and (B) a report on
regulatory impacts on State, local, and tribal governments, small business, and wages. Part A revises the benefit-cost estimates in last year’s Report by updating the estimates through the end of FY 2015 (September 30, 2015). As in previous Reports, this chapter uses a ten-year lookback. Estimates are based on the major regulations (for which the regulatory agency monetized both benefits and costs) that were reviewed by OMB from October 1, 2005 to September 30, 2015.6 For this reason, rules reviewed from October 1, 2004 to September 30, 2005 (FY 2005) were included in the totals for the 2015 Report but are not included in this Report. A list of these FY 2005 rules can be found in Appendix B (see Table B-1). The removal of the 13 FY 2005 rules from the ten-year window is accompanied by the addition of 21 FY 2015 rules.
As has been the practice for many years, all estimates presented in this chapter are agency estimates of benefits and costs, or minor modifications of agency information performed by OMB.7 This chapter also includes a discussion of major rules issued by independent regulatory agencies, although OMB does not review these rules under Executive Orders 12866 and 13563.8 This discussion is based solely on data provided by these agencies to the Government Accountability Office (GAO) under the Congressional Review Act.
In the past, we have adjusted estimates to 2001 dollars, the requested format in OMB Circular A-4. We also report most of the numbers in this chapter in 2014 dollars as well, in order to provide estimates that reflect the most recent annual GDP deflator.
Aggregating benefit and cost estimates of individual regulations produces results that are neither precise nor complete, nor, in some cases, conceptually sound. Six points deserve emphasis.
6All previous Reports are available at: http://www.whitehouse.gov/omb/inforeg_regpol_reports_congress/. 7 OMB used agency estimates where available. We note that those estimates were typically subject to internal review (through the interagency review process) and external review (through the public comment process). The benefit and cost ranges represent lowest and highest agency estimates among all the estimates using both 3 and 7 percent discount rates. When agencies do not provide central estimates but do provide ranges for benefit and cost estimates, we take the mean of the lowest and the highest values, irrespective of the discount rates. Historically, if an agency quantified but did not monetize estimates, we used standard assumptions to monetize them, as explained in Appendix A. However, for this year’s rules, agencies monetized all of the rules for which they provided quantified estimates. All amortizations are performed using discount rates of 3 and 7 percent, unless the agency has already presented annualized, monetized results using a different explicit discount rate. OMB did not independently estimate benefits or costs when agencies did not provide quantified estimates. The estimates presented here rely on the state of the science at the time the Regulatory Impact Analyses (RIAs) were published. We do not update or recalculate benefit and cost numbers based on current understanding of science generally and economics in particular. 8 These executive orders can be found at https://www.whitehouse.gov/sites/default/files/omb/inforeg/eo12866/eo12866_10041993.pdf and https://www.whitehouse.gov/sites/default/files/omb/inforeg/eo12866/eo13563_01182011.pdf. Section 3(b) of Executive Order 12866 excludes “independent regulatory agencies as defined in 44 U.S.C. 3502(10)” from OMB’s regulatory review purview.
6
1. Individual regulatory impact analyses vary in rigor and may rely on different assumptions, including baseline scenarios, methods (including models), data, and measures of welfare changes (including approximations thereof). Summing across estimates involves the aggregation of analytical results that, for reasons we describe below, are not comparable. While important inconsistencies across agencies have been reduced over time, OMB continues to investigate possible inconsistencies and seeks to identify and to promote best practices. Executive Order 13563 emphasizes the importance of such practices and of quantification, directing agencies to “use the best available techniques to quantify anticipated present and future benefits and costs as accurately as possible.” For example, all agencies draw on the existing economic literature for valuation of reductions in mortality and morbidity, but the technical literature has not converged on uniform figures, and consistent with the lack of uniformity in that literature, such valuations vary somewhat (though not dramatically) across agencies. Some agencies provide information on the stream of effects whereas other agencies provide information at specific points in time. Later in this document we provide additional discussion of the uncertainty inherent in quantifying the value of a statistical life.
2. For comparisons or aggregations to be meaningful, benefit and cost estimates should correctly account for all substantial effects of regulatory actions including implementation periods, some of which may not be reflected in the available data. In addition to unquantified benefits and costs, agency estimates reflect the uncertainties associated with the agency’s assumptions and other analytic choices.
3. As we have noted, it is not always possible to quantify or to monetize relevant benefits or costs of rules in light of limits in existing information. For purposes of policy, non-monetized benefits and costs may be important. Some regulations have significant non-quantified or non-monetized benefits (such as protection of privacy, human dignity, and equity) and costs that are relevant under governing statutes and that may serve as a key factor in an agency’s decision to promulgate a particular rule.
4. Prospective analysis may overestimate or underestimate both benefits and costs; retrospective analysis can be important as a corrective mechanism.9 Executive Orders 13563 and 13610 specifically call for such analysis, with the goal of improving relevant regulations through modification, streamlining, expansion, or repeal. The aim of retrospective analysis is to improve understanding of the accuracy of prospective analysis and to provide a basis for potentially modifying rules as a result of ex post evaluations. Rules should be written and designed to facilitate retrospective analysis of their effects, including consideration of the data that will be needed for future evaluation of the rules’ ex post costs and benefits.
5. While emphasizing the importance of quantification, Executive Order 13563 also refers to “values that are difficult or impossible to quantify, including equity, human dignity, fairness, and distributive impacts.” As Executive Order 13563 recognizes, such values may be appropriately considered under relevant law. Using examples from the recent past, if a rule would prevent the denial of health insurance to children with preexisting conditions, or allow wheelchair-bound workers to have access to
9 See Greenstone (2009).

7
bathrooms, a consideration of dignity is involved, and relevant law may require or authorize agencies to take that consideration into account. If a regulation would disproportionately help or hurt those at the bottom of the economic ladder, or those who are suffering from some kind of acute condition or extreme deprivation, relevant law may require or authorize agencies to take that fact into account. While analysis of these types of impacts is more limited, efforts to examine the distributive impacts of regulations is increasing.10 Additional analyses of this type could prove illuminating.11
6. The most fundamental purpose of a regulatory impact analysis is to inform policy options at the time a regulatory decision is being made; however, analytic approaches that serve this purpose may not readily lend themselves to aggregation. For example, suppose the Department of Labor’s Wage and Hour Division (WHD) issues a regulation for which impacts accrue on a per-employee basis, and the number of affected employees is estimated on the assumption that suppliers in the “gig” economy (e.g., Uber and Lyft drivers) qualify as employees. If subsequent case law instead establishes these workers as members of a new category (different from both employees and independent contractors) over which WHD is given jurisdiction, WHD may issue a new rule extending the same policies earlier applied to “employees” to the new category of workers. The RIA for the new rule would appropriately include all the effects related to gig workers, even though such effects were already tallied in the first rule and a multi-year sum of the estimated effects of WHD rules would thus encompass double-counting.12
A. Estimates of the Aggregated Annual Benefits and Costs of Regulations Reviewed by OMB over the Last Ten Years
1. Aggregated Estimates
From FY 2006 through FY 2015, Federal agencies published 36,289 final rules in the Federal Register.13 OMB reviewed 2,753 of these final rules under Executive Orders 12866 and 13563.14 Of these OMB-reviewed rules, 555 are considered major rules, primarily as a result of their anticipated impact on the economy (i.e., an impact of $100 million in at least one year).
10 See, for example, U.S. EPA 2016, Appendix C for examples of environmental justice analyses in recent rulemaking actions. (U.S. Environmental Protection Agency (EPA). 2016. Technical Guidance for Assessing Environmental Justice in Regulatory Analyses.) 11 See, e.g., Kahn (2001); Adler (2011) offers relevant theoretical discussion. 12 In this example, which is kept simple for the sake of explanation, the relevant impacts could be easily netted out of the estimates of the first rule, thus making the cumulative sum correct. However, such corrections have generally been infeasible in this report given the number and complexity of regulations being tracked. 13 This count includes all final and interim final rules from all Federal agencies (including independent agencies). 14 Counts of OMB reviewed rules are available through the “review counts” and “search” tools on OIRA’s regulatory information website (www.reginfo.gov). In addition, the underlying data for these counts are available for download in XML format on the website.

8
Many major rules are budgetary transfer rules,15 and may not impose a significant private mandate.
We include in our 10-year aggregate of annualized benefits and costs of regulations rules that meet two conditions:16 (1) each rule was estimated to generate benefits or costs of approximately $100 million, or more, in at least one year; and (2) a substantial portion of its benefits and costs were quantified and monetized by the agency or, in some cases, monetized by OMB. The estimates are therefore not a complete accounting of all the benefits and costs of all regulations issued by the Federal Government during this period.17 Table 1-1 presents estimates of annualized benefits and costs of regulations reviewed by OMB over the ten-year period from October 1, 2005, to September 30, 2015, broken down by issuing agency.
As discussed in previous Reports, OMB chose a ten-year period for many reasons, including that many analyses choose 10-year or shorter analytic timelines, some rules are replaced by newer rules within the 10-year timeline, and economic conditions may change making the prospective estimates less informative. The estimates of the benefits and costs of Federal regulations over the period October 1, 2005, to September 30, 2015, are based on agency analyses conducted prior to issuance of the regulations and (with few exceptions) are subjected to public notice, comments, and OMB review under Executive Orders 12866 and 13563.
In assembling these tables of estimated benefits and costs, OMB applied a uniform format for the presentation to make agency estimates more closely comparable with each other (for example, annualizing benefit and cost estimates). OMB monetized quantitative estimates where the agency did not do so. For example, for a few rulemakings within the ten-year window of this Report, we have converted agency projections of quantified benefits, such as estimated injuries avoided per year or tons of pollutant reductions per year, to dollars using the valuation estimates discussed in Appendix B of our 2006 Report.18
15 Budgetary transfer rules are rules that primarily cause income transfers usually from taxpayers to program beneficiaries. Agencies typically do not estimate possible resulting distortionary effects on the economy. 16 OMB discusses, in this Report and in previous Reports, the difficulty of estimating and aggregating the benefits and costs of different regulations over long time periods and across many agencies using different methodologies for quantification and monetization as well as for addressing uncertainty. Any aggregation involves the assemblage of benefit and cost estimates that are not strictly comparable. In part to address this issue, the 2003 Report included OMB’s new regulatory analysis guidance, OMB Circular A-4, which took effect on January 1, 2004 for proposed rules and January 1, 2005 for final rules. The guidance recommends what OMB defines as “best practices” in regulatory analysis, with a goal of strengthening the role of science, engineering, and economics in rulemaking. The overall goal of this guidance is a more transparent, accountable, and credible regulatory process and a more consistent regulatory environment. OMB continues to work with the agencies in applying this guidance to their impact analyses. 17 In many instances, agencies were unable to quantify all benefits and costs. We have included information about these unquantified effects on a rule-by-rule basis in the columns titled “Other Information” in Appendix A of this report. The monetized estimates we present necessarily exclude these unquantified effects. 18 The 2006 Report is available at http://www.whitehouse.gov/omb/inforeg_regpol_reports_congress/. For example, the emission reductions associated with EPA’s Standards of Performance for Stationary Compression Ignition Internal Combustion Engines were monetized using the valuation estimates discussed in the 2006 Report. We note that there are discussions regarding the scientific assumptions underlying the benefits per ton numbers that we use to

9
Table 1-1: Estimates of the Total Annual Benefits and Costs of Major Federal Rules (For Which Both Benefits and Costs Have Been Estimates) by Agency, October 1, 2005 -
September 30, 2015 (billions of 2001 or 2014 dollars)19
Agency Number of Rules
Benefits Costs 2001$ 2014$ 2001$ 2014$
Department of Agriculture
4 0.4 to 1.0 0.6 to 1.3 0.4 to 0.8
0.5 to 1.1
Department of Energy 23 14.7 to 25.2 19.0 to 32.8 5.8 to 8.2
7.5 to 10.7
Department of Health and Human Services
17 4.0 to 17.4 5.2 to 22.6 1.2 to 4.4
1.6 to 5.7
Department of Homeland Security
3 0.3 to 0.8 0.3 to 1.1 0.3 to 0.6
0.4 to 0.8
Department of Housing and Urban Development
1 2.3 3.0 0.9 1.1
Department of Justice
3 1.5 to 3.7 1.9 to 4.8 0.7 to 0.9
0.9 to 1.2
Department of Labor 11 7.5 to 21.6 9.7 to 28.1 2.3 to 5.2
3.0 to 6.8
Department of Transportation (DOT)20
27 15.6 to 28.3 20.3 to 36.8 5.7 to 11.1
7.4 to 14.4
Environmental Protection Agency (EPA)21
37 135.2 to 522.6 175.5 to 678.1
33.3 to 39.2
43.2 to 50.9
Joint DOT and EPA 3 27.3 to 49.6 35.4 to 64.3 7.3 to 14.0
9.5 to 18.2
Table 1-2 provides additional information on estimated aggregate benefits and costs for specific agency program offices. In order for a program to be included in Table 1-2, the program office must have finalized three or more major rules in the last ten years with monetized benefits and costs. Two of the program offices included—Department of Transportation’s National Highway Traffic Safety Administration and the Environmental Protection Agency’s Office of monetize benefits that were not monetized. If, for instance, assumptions similar to those described at http://www.epa.gov/air/benmap/bpt.html were used, these estimates would be higher. 19 Benefit and cost values were converted from 2001 dollars to 2014 dollars using Gross Domestic Product implicit price deflators from the Bureau of Economic Analysis. 20 This total excludes FMCSA’s 2010 Electronic On-Board Recorders for Hours-of-Service Compliance rule. The rule was vacated on Aug. 26, 2011, by the U.S Court of Appeals for the Seventh Circuit. 21 For reasons explained in several previous Reports, this total excludes the impacts of EPA’s 2005 Clean Air Interstate Rule (CAIR), but does include an attribution of the benefits and costs of equipment installed under CAIR between CAIR and the subsequently issued Cross State Air Pollution Rule (CSAPR). This total also excludes EPA’s 2005 “Clean Air Mercury Rule”, which was vacated in 2008.

10
Air—finalized three overlapping sets of rules pertaining to the control of greenhouse gas emissions from mobile sources and improved vehicle fuel economy, and these are listed separately.
Table 1-2: Estimates of Annual Benefits and Costs of Major Federal Rules: Selected Program Offices and Agencies, October 1, 2005 - September 30, 2015
(billions of 2001 or 2014 dollars)
Agency Number of Rules
Benefits Costs 2001$ 2014$ 2001$ 2014$
Department of Agriculture Animal and Plant Health Inspection Service
3 $0.4 to $1.0
$0.6 to $1.3
$0.3 to $0.6
$0.3 to $0.8
Department of Energy Energy Efficiency and Renewable Energy 22 $14.7 to
$25.1 $19.0 to
$32.6 $5.8 to
$8.2 $7.5 to $10.6
Department of Health and Human Services
Food and Drug Administration 6 $0.5 to $9.9
$0.7 to $12.8
$0.3 to $0.6
$0.4 to $0.8
Center for Medicare and Medicaid Services
10 $3.4 to $7.4
$4.4 to $9.6
$0.8 to $3.6
$1.1 to $4.7
Department of Labor Occupational Safety and Health Administration
6 $0.9 to $3.2
$1.2 to $4.1
$0.6 to $0.7
$0.7 to $0.9
Employee Benefits Security Administration
3 $6.6 to $18.4
$8.5 to $23.9
$1.7 to $4.5
$2.2 to $5.8
Department of Transportation National Highway Traffic Safety Administration
10 $12.1 to $21.5
$15.7 to $27.9
$4.3 to $8.2
$5.6 to $10.6
Federal Aviation Administration 6 $0.4 to $1.3
$0.5 to $1.7
$0.4 to $0.9
$0.5 to $1.2
Federal Motor Carriers Safety Administration
4 $2.1 to $3.2
$2.7 to $4.1
$0.5 $0.6
Federal Railroad Administration 3 $0.9 to $1.0
$1.2 to $1.3
$0.7 to $1.4
$0.8 to $1.8
Environmental Protection Agency Office of Air 24 $132.3 to
$514.7 $171.7 to
$667.9 $31.6 to
$36.9 $41.0 to
$47.9 Office of Solid Waste and Emergency Response
6 $0.3 to $0.9
$0.4 to $1.2
$0.2 to $0.4
$0.2 to $0.6
Office of Water 5 $1.2 to $2.4
$1.6 to $3.1
$0.9 to $1.2
$1.2 to $1.6
Department of Transportation/Environmental

11
Agency Number of Rules
Benefits Costs 2001$ 2014$ 2001$ 2014$
Protection Agency National Highway Traffic Safety Administration/Office of Air
3 $27.3 to $49.6
$35.4 to $64.3
$7.3 to $14.0
$9.5 to $18.2
The ranges of benefits and costs reported in Tables 1-1 and 1-2 were calculated by adding the lower bounds of agencies’ estimates for each of the underlying rules to generate an aggregate lower bound, and similarly adding the upper bounds of agencies’ estimates to generate an aggregate upper bound.22 The range reported by the agency for each rule reflects a portion of the agency’s uncertainty about the likely impact of the rule. In some cases, this range is a confidence interval based on a formal integration of the statistical uncertainty. Such analyses, however, rarely provide an integrated estimate that includes model and parameter uncertainty. Rather, when agencies do attempt to quantify such sources of uncertainty, they often conduct a component-by-component exploration of the impact of alternative assumptions and parameters. In generating this table, most entries are ranges, based on agency analyses in which input parameters were varied across a plausible range.
More generally, the ranges of benefits and costs presented in Tables 1-1 and 1-2 should be treated with some caution. Because different rules treat uncertainties differently, if at all, the ranges above should not be interpreted as reflecting underlying uncertainties either consistently or comprehensively. If the reasons for uncertainty differ across individual rules, aggregating high and low-end estimates can result in totals that may be misleading. The benefits and costs presented in Tables 1-1 and 1-2 are not necessarily correlated. In other words, when interpreting the meaning of these ranges, the reader should not assume that when benefits are on the low end of their range, costs will also tend to be on the low end of their range. This is because, for some rules, there are factors that affect costs that have little correlation with factors that affect benefits (and vice-versa). Accordingly, to calculate the range of net benefits (i.e., benefits minus costs), one should not simply subtract the lower bound of the benefits range from the lower bound of the cost range and similarly for the upper bound. It is possible that the true benefits are at the higher bound and that the true costs are at the lower bound, as well as vice-versa.
2. EPA Air Rules
Across the Federal government, the rules with the highest estimated benefits as well as the highest estimated costs come from the Environmental Protection Agency and in particular its Office of Air and Radiation. Specifically, EPA rules account for 61 to 80 percent of the monetized benefits and 44 to 55 percent of the monetized costs.23 Of these, rules that have a
22 To the extent that the estimates quantitatively incorporated uncertainty, this approach of adding ranges may overstate the uncertainty in the total benefits and costs for each agency. 23These estimates do not include the joint EPA/DOT GHG/CAFE rules as “EPA” rules.
12
significant aim to improve air quality account for 98 to 99 percent of the benefits of EPA rules. As such, we provide additional information on the estimates associated with these rules.
Of the EPA’s 22 air rules, the highest estimated benefits are for the Clean Air Fine Particle Implementation Rule issued in 2007, with benefits estimates ranging from $19 billion to $167 billion per year; and the National Emission Standards for Hazardous Air Pollutants From Coal- and Oil-Fired Electric Utility Steam Generating Units (“MATS”24) issued in 2011, with benefits estimates ranging from $28 billion to $77 billion (2001$). While the estimated benefits of these rules far exceed the estimated costs, they are also among the costliest rules. The MATS rule, which is estimated to be the costliest of the EPA rules, has annualized costs of about $8.2 billion (2001$).
Importantly, the large estimated benefits of EPA rules issued pursuant to the Clean Air Act are mostly attributable to the reduction in public exposure to fine particulate matter (referred to in many contexts as PM2.5). While many of these rules monetize the estimated benefits of emissions controls designed specifically to limit particulate matter or its precursors, some rules monetize the benefits associated with the ancillary reductions in particulate matter that come from reducing emission of hazardous air pollutants which are difficulty to quantify and monetize because of data limitations. For example, in the case of the Utility MACT (or MATS), particulate matter “co-benefits,”25 make up the majority of the monetized benefits, even though the regulation is designed to limit emissions of mercury and other hazardous air pollutants. The consideration of co-benefits, including the co-benefits associated with reduction of particulate matter, is consistent with standard accounting practices and has long been required under OMB Circular A-4. We will continue to work with agencies to ensure that they clearly communicate when such co-benefits constitute a significant share of the monetized benefits of a rule. We note also that EPA’s 2006 National Ambient Air Quality Standards (NAAQS) for particulate matter with estimated benefits ranging from $4 billion to $40 billion per year and estimated costs of $3 billion per year (2001$), is excluded from the 10-year aggregate estimates or the year-by-year estimates. The reason for the exclusion is to prevent double-counting: EPA finalized implementing rules, such as the Cross-State Air Pollution Rule (CSAPR), that will achieve emission reductions and impose costs that account for a major portion of the benefit and cost estimates associated with this NAAQS rule. The benefit and cost estimates for lead NAAQS, SO2 NAAQS, and 2008 Ozone NAAQS may also be dropped in the future reports to avoid double counting to the extent that EPA publishes implementing regulations that would be designed to achieve the emissions reductions required by these NAAQS.
3. Assumptions and Uncertainties
The largest benefits are associated with regulations that reduce risks to life. As such this section provides additional information on the assumptions underlying such quantification and
24 This rule is commonly known as the “Mercury and Air Toxics Standards” (MATS). In 2014, the U.S. Court of Appeals in the D.C. Circuit upheld the rule stating that EPA is not required to take cost into consideration evaluating whether regulation of electric utility steam generating units under CAA § 112 is “appropriate and necessary” to address hazards to public health. The Supreme Court disagreed and remanded the rule in 2015 on the issue of consideration of costs. EPA finalized a supplemental finding about MATS and costs in April 2016. 25 Co-benefits are benefits that are ancillary to the primary objectives of regulation. In estimating co-benefits, agencies are encouraged to carefully construct baselines so that double-counting of benefits is minimized.

13
valuation. While agency practice is rooted in empirical research and is not widely variable, agencies have adopted somewhat different methodologies—for example, different monetized values for effects (such as mortality and morbidity), different baselines in terms of the regulations and controls already in place, different rates of time preference, and different treatments of uncertainty. These differences are reflected in the estimates provided in Tables 1-1 and 1-2, above. And while we have generally relied on agency estimates in monetizing benefits and costs, and those estimates have generally been subject both to public and to interagency review, our reliance on those estimates in this Report should not necessarily be taken as an OMB endorsement of all the varied methodologies used by agencies to estimate benefits and costs.
An important source of uncertainty in the case of health and safety regulations is how to value the regulations’ expected reduction in risks to life. Agencies vary in how they estimate the value of a statistical life (VSL), which is best understood not as the “valuation of life,” but as the valuation of statistical mortality risks. For example, the average person in a population of 50,000 may value a reduction in mortality risk of 1/50,000 at $150. The value of reducing the risk of 1 statistical (as opposed to a known or identified) fatality in this population would be $7.5 million, representing the aggregation of the willingness to pay values held by everyone in the population. Building on an extensive literature, OMB Circular A-4 provides background and discussion of the theory and practice of calculating VSL. It concludes that a substantial majority of the studies of VSL indicate a value that varies “from roughly $1 million to $10 million per statistical life.” Circular A-4 generally reports values in 2001 dollars; if we update these values to 2014 dollars the range would be $1.3-$13.0 million. In practice, agencies have tended to use a value above the mid-point of this range (i.e., greater than $7.1 million in 2014 dollars).26 To account for the uncertainty in the appropriate value for the reduction of risk to life, agencies often use a range of plausible VSL values to construct a range of estimated benefits for rules.
A second source of uncertainty is the set of assumptions used in projecting the health impact of reducing particulate matter These projections are based on a series of models that take into account emissions changes, resulting distributions of changes in ambient air quality, the estimated reductions in health effects from changes in exposure, and the composition of the population that will benefit from the reduced exposure. Each component includes assumptions, each with varying degrees of uncertainty. A 2002 study by the National Research Council/National Academy of Sciences entitled Estimating the Public Health Benefits of Proposed Air Pollution Regulations (2002) highlighted the uncertainty in the reduction of premature deaths associated with reduction in particulate matter.
The six key assumptions underpinning the particulate matter benefits estimates, and our analysis
26 Two agencies, EPA and DOT, have developed official guidance on VSL. In its 2013 update, DOT adopted a value of $9.1 million ($2012) adjusted for income growth in later years, and requires all the components of the Department to use that value in their RIAs. See Department of Transportation (2013). EPA uses a VSL of $6.3 million ($2000) and adjusts this value for real income growth to later years. In its final rule reviewing the National Ambient Air Quality Standards for particulate matter, for example, EPA adjusted this VSL to account for a different currency year ($2010) and for income growth to 2020, which yields a VSL of $9.6 million. EPA is continuing its efforts to update this guidance, and is preparing draft guidelines in response to recommendations received from its Science Advisory Board. In April of 2014 the Department of Homeland Security adopted DOT’s VSL of $9.1 million. Many other regulatory agencies have used a VSL in individual rulemakings.

14
of these sources of uncertainty, are as follows: 1. Inhalation of fine particles is causally associated with premature death at concentrations
near those experienced by most Americans on a daily basis. EPA, with the endorsement of its Clean Air Scientific Advisory Committee (CASAC), has determined that the weight of available epidemiological evidence indicates that exposure to fine particles is causally related to premature death. The agency further concludes that potential biological mechanisms for this effect, while not completely understood, are also supportive of a causal determination. Although discussed qualitatively in EPA’s regulatory impact analyses, this assumption carries with it uncertainty that is not accounted for in the analysis presented in EPA’s monetized benefits estimates.
2. The concentration-response function for fine particles and premature mortality is approximately linear, even for concentrations below the levels established by the National Ambient Air Quality Standard (NAAQS), which reflect the level determined by EPA to be protective of public health with an adequate margin of safety, taking into consideration effects on susceptible subpopulations.
Although CASAC27 concluded that the evidence supports the use of a no-threshold log-linear model, they specifically recognize the uncertainty about the exact shape of the concentration-response function. EPA’s Policy Assessment28 for the most recent fine particulate matter NAAQS concludes that the range from the 25th to the 10th percentile of the air quality distribution observed in the epidemiological studies is a range below which we start to have appreciably less confidence in the magnitude of the associations observed in the epidemiological studies. This is consistent with the toxicological perspective on fine particulate matter concentration-response functions. In setting the 2012 particulate matter NAAQS, EPA determined that there is no level below which it can be concluded with confidence that particulate matter effects do not occur and that the NAAQS are not zero-risk standards.29 However,
27 U.S. Environmental Protection Agency - Science Advisory Board (U.S. EPA-SAB). 2009. Consultation on EPA’s Particulate Matter National Ambient Air Quality Standards: Scope and Methods Plan for Health Risk and Exposure Assessment. EPA-COUNCIL-09-009. May. Available on the Internet at <http://yosemite.epa.gov/sab/SABPRODUCT.NSF/81e39f4c09954fcb85256ead006be86e/723FE644C5D758DF852575BD00763A32/$File/EPA-CASAC-09-009-unsigned.pdf> and U.S. Environmental Protection Agency - Science Advisory Board (U.S. EPA-SAB). 2009. Review of EPA’s Integrated Science Assessment for Particulate Matter (First External Review Draft, December 2008). EPA-COUNCIL-09-008. May. Available on the Internet at <http://yosemite.epa.gov/sab/SABPRODUCT.NSF/81e39f4c09954fcb85256ead006be86e/73ACCA834AB44A10852575BD0064346B/$File/EPA-CASAC-09-008-unsigned.pdf>. 28 U.S. Environmental Protection Agency (U.S. EPA). 2011. Policy Assessment for the Review of the Particulate Matter National Ambient Air Quality Standards. EPA-452/D-11-003. April. Available on the Internet at <http://www.epa.gov/ttnnaaqs/standards/pm/s_pm_2007_pa.html>. 29 78 FR 3098: “However, evidence- and risk-based approaches using information from epidemiological studies to inform decisions on PM2.5 standards are complicated by the recognition that no population threshold, below which it
15
the possibility of a de minimis population effect at concentrations lower than the NAAQS could be consistent with the criteria for setting the NAAQS. This becomes important for understanding the extent of the uncertainty in the particulate matter benefits estimates if a significant portion of the benefits associated with more recent rules are from projected exposure reductions in areas that are already in attainment with both the 24-hour and annual NAAQS for fine particles. For example, in the MATS rule, a majority of the benefits accrue to populations who live in areas that are projected to meet the annual fine particulate standards. In assessing the comparability of estimates over time, it is worth noting that between FY 2006 and midway through FY 2009, all EPA’s primary benefits estimates explicitly included an assumption of a threshold for premature mortality effects at lower levels—that is, health benefits were not assumed for exposure reductions below a hypothetical threshold of 10 µg/m3 (although sensitivity analyses explored alternative models). Since mid-2009, EPA’s primary benefits estimates reflect a no-threshold assumption.
3. All fine particles, regardless of their chemical composition, are equally potent in causing premature mortality.
Although some scientific experiments have found differential toxicity among species of particulate matter, EPA, with CASAC’s endorsement, has concluded that the scientific evidence is not yet sufficient to allow differentiation of benefits estimates by particle type30. However, some agencies and stakeholders have suggested that this research provides insight regarding potential differential toxicity among species of particulate matter. This assumption of equal toxicity contributes to the uncertainty associated with particulate matter benefits estimates because fine particles vary considerably in composition across sources. For instance, particulate matter indirectly produced via transported precursors emitted from electrical generating utilities (EGUs) may differ significantly in composition from direct particulate matter released by other industrial sources. Similarly, gasoline and diesel engine emissions differ. As such, when a given rule controls a broad range of sources, there is likely less uncertainty in the benefits estimate that if the rule controls a single type of source.
can be concluded with confidence that PM2.5-related effects do not occur, can be discerned from the available evidence. As a result, any general approach to reaching decisions on what standards are appropriate necessarily requires judgments about how to translate the information available from epidemiological studies into a basis for appropriate standards. This includes consideration of how to weigh the uncertainties in the reported associations across the distributions of PM2.5 concentrations in the studies and the uncertainties in quantitative estimates of risk, in the context of the entire body of evidence before the Agency. Such approaches are consistent with setting standards that are either more or less stringent than necessary, recognizing that a zero-risk standard is not required by the CAA.” 30 “[M]any constituents of PM2.5 can be linked with multiple health effects, and the evidence is not yet sufficient to allow differentiation of those constituents or sources that are more closely related to specific outcomes”. U.S. Environmental Protection Agency (U.S. EPA). 2009. Integrated Science Assessment for Particulate Matter (Final Report). EPA-600-R-08-139F. National Center for Environmental Assessment—RTP Division. December. Available on the Internet at <http://cfpub.epa.gov/ncea/cfm/recordisplay.cfm?deid=216546>.

16
4. The forecasts for future emissions and associated air quality modeling accurately predict
both the baseline (state of the world absent a rule) and the air quality impacts of the rule being analyzed.
The models used are based on up-to-date assessment tools and scientific literature that has been peer-reviewed; however, as in all models the results may be significantly influenced by assumptions, incomplete data, and/or model parameter specification.. Inherent uncertainties in the overall enterprise must be recognized, even if the results are critical to projecting the benefits of air quality regulations.
5. National dollar benefit-per-ton estimates of the benefits of reducing directly emitted fine particulates and PM2.5 precursors are applied, as a less modeling and time intensive estimation technique, in some rules that control emissions from specific source categories.
Because these benefit-per-ton estimates are based on national-level analysis that may not reflect local variability in population density, meteorology, exposure, baseline health incidence rates, or other local factors, depending on the analysis and the location, they may not provide an accurate representation of the geographic distribution of benefits, and thus either over-estimate or under-estimate the aggregate benefits of reducing fine particulate emissions or their precursors at specific locations.
6. The value of mortality risk reduction, which is taken largely from studies of the willingness to accept risk in the labor market is an accurate reflection of what people would be willing to pay for incremental reductions in mortality risk from air pollution exposure and these values are uniform for people in different stages of life or with differing health status.
As discussed above, there is considerable uncertainty about how to value reductions in risk to life. Agencies generally assume a uniform VSL; however, some studies indicate that willingness to pay for reductions in risk may change with age. (See Krupnick (2007) for a survey of the literature.) If VSLs do change with age, it would have an important impact on the size of the benefits associated with premature mortality because EPA’s analysis shows that the median age of individuals experiencing reduced mortality is around 75 years old. However it is also worth noting that slightly more than half of the avoided life years occur in populations age <65 due to the fact that the younger populations would lose more life years per death than older population.31
31 Regulatory Impact Analysis for the Final Revisions to the National Ambient Air Quality Standards for Particulate Matter , U.S. Environmental Protection Agency, 2012. [Pages 5-75 and 5-76, Chapter 5, Benefits]. http://www.epa.gov/ttnecas1/regdata/RIAs/finalria.pdf. See OMB Circular A-4 for further discussion on effectiveness metrics for public health and safety rulemakings such as “equivalent lives” (ELs) and “quality-adjusted life years” (QALYs).

17
To the extent that any of these assumptions are incorrect, the benefit ranges in the tables above might be different, though the magnitude and direction of bias is not known with certainty. We understand that additional research is currently being conducted that should help to improve our understanding in each of these areas.
4. Effect of Regulatory Path Dependency on Benefits, Costs and Cumulative Effects of EPA rules
In FY 2015, EPA promulgated three rules regulating the electricity generating sector: the Carbon Pollution Emission Guidelines for Existing Stationary Sources: Electric Utility Generating Units (CPP), the Effluent Limitations Guidelines and Standards for the Steam Electric Power Generating Point Source Category (Steam Electric ELG), and the Standards for the Management of Coal Combustion Residuals Generated by Commercial Electric Power Producers (CCR). The CPP rule regulates carbon dioxide emission from existing power plants. The Steam Electric EGU rule regulates the water discharge from the same sources. The CCR rule regulates the disposal of solid or slurry waste stream from these plants. While the primary motivation for the CPP rule is to reduce CO2 emissions to mitigate climate change effects, the associated reduction of particulate matter due to reduced SO2 and NOx emissions is substantial. Using the rate based approach, the particulate matter benefits as a percentage of the total benefits range from 20% to 39% in 2020, 41% to 64% in 2025 and 41% to 61% in 2030. Because of the multi-medium nature of particulate matter and precursors of particulate matter, emission reductions in air pollutants can either increase or decrease associated water and solid waste generation. If the air pollution decreases due to pollution prevention, associated water and solid waste could decrease; if the air pollution decreases due to end-of-the-pipe treatment, then associated water and solid waste could increase. In the particular case of the CPP rule, reduced water and solid waste generation would be expected since the rule sets a maximum CO2 emission rate for electricity generation, thereby encouraging the use of higher efficiency technologies or retirement of less efficient technologies. However the order in which EPA promulgated the CPP, the Steam Electric ELG, and the CCR, which was largely court driven, did not substantially consider this path dependency. Because the common practice of incorporating finalized rules into analytic baselines, the lack of considering path dependency resulted in over-estimate of benefits and costs primarily for the CCR rule. The sensitivity analysis provided in the final Steam Electric ELG demonstrates the significant magnitude associated with incorporating the CPP rule in the baseline. The final Steam Electric ELG cost estimates includes the proposed CPP into its analytic baseline; the sensitivity cost estimates do not include the CPP. The primary cost estimate that includes the CPPis approximately 40% less than the cost estimate that does not.

18
5. Quantification
We have also noted that many of these major rules have important non-quantified benefits and costs that may have been a key factor in an agency’s decision to select a particular approach. In important cases, agencies have been unable to quantify the benefits of rules, simply because existing information does not permit reliable estimates. These qualitative issues are discussed in Table A-1 of Appendix A, agency rulemaking documents, and previous editions of this Report.
Finally, because these estimates exclude non-major rules and rules adopted more than ten years ago, the total benefits and costs of all Federal rules now in effect are likely to be significantly larger than the sum of the benefits and costs reported in Table 1-1. More research would be necessary to produce current estimates of total benefits and costs for all agencies and programs, though some agencies have developed valuable assessments of the benefits and costs of their programs. And as noted, it is important to consider retrospective, as opposed to ex ante, estimates of both benefits and costs.
6. Other Safety and Health Rules
Although rules that reduce public exposure to fine particulate matter, as well as other environmental regulations from EPA, dominate the monetized benefits and costs of federal regulation over the last ten years, other agencies have contributed to safety, health and well-being in the U.S. Table 1-3 identifies numbers of rules, areas of impact, and associated estimated benefits and costs.
International trade-related environmental and safety regulation attempts to reduce risks associated with pests and disease (e.g., mad cow disease) that may be carried by goods imported to the U.S. USDA and FDA have also issued non-trade rules that attempt to reduce foodborne illnesses and encourage better health. Patient safety rules have dealt with, among other things, reducing medical errors, and safety requirements for long term care facilities. Transportation related safety rules attempt to reduce the risk of injury and death associated with vehicles, airplanes, and trains.
Table 1-3: Estimates of Annual Benefits and Costs of Non-Environmental Health and Safety Rules: October 1, 2005 - September 30, 2015
(billions of 2001 and 2014 dollars)
Area of Safety and Health Regulation
Number of Rules
Estimated Benefits Estimated Costs 2001$ 2014$ 2001$ 2014$
Safety rules to govern international trade
3 $0.4 to $1.0 $0.6 to $1.3 $0.3 to $0.6 $0.3 to $0.8
Food safety and labeling
5 $0.5 to $9.7 $0.6 to $12.5 $0.3 to $0.7 $0.3 to $0.9
Patient safety 4 $0.3 to $1.0 $0.4 to $1.3 $0.2 to $0.5 $0.3 to $0.6
Consumer protection 3 $1.4 to $4.7 $1.8 to $6.1 $0.7 to $0.8 $1.0 to $1.1
19
Worker safety 8 $0.9 to $3.2 $1.2 to $4.2 $0.6 to $0.7 $0.8 to $1.0
Transportation safety 22 $10.5 to $22.5 $13.6 to $29.2 $4.6 to $8.5 $6.0 to $11.1
B. Trends in Annual Benefits and Costs of Regulations Reviewed by OMB over the Last Ten Years
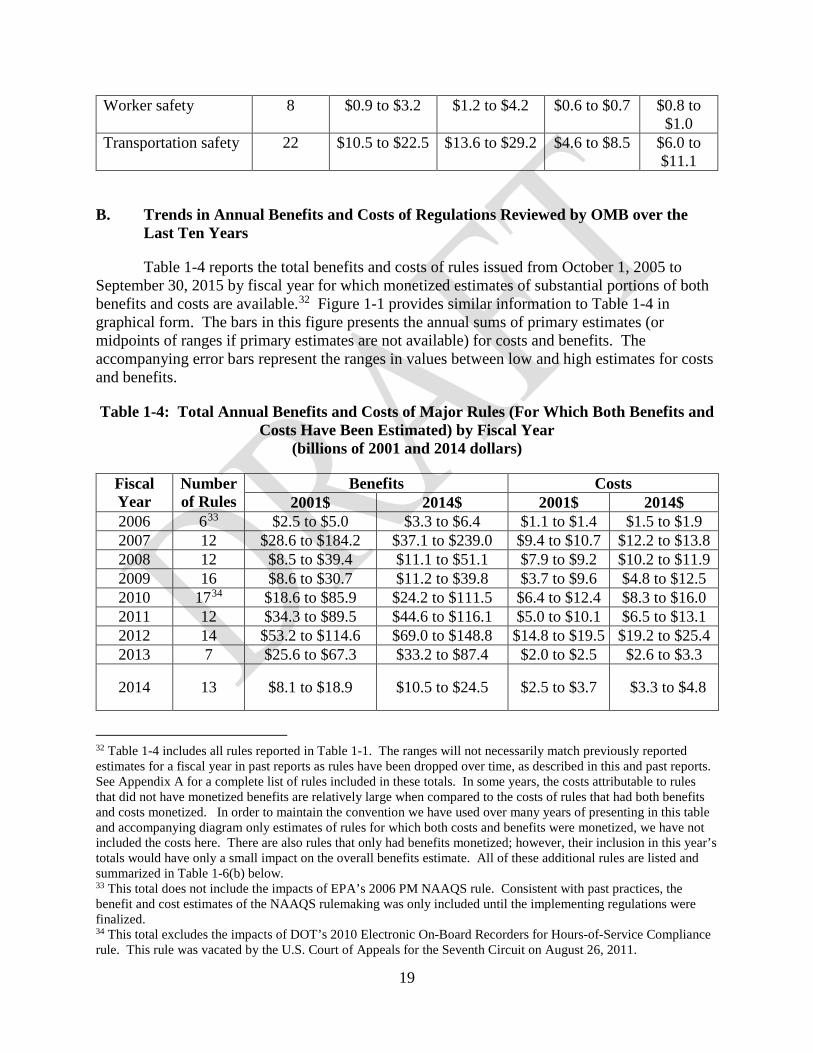
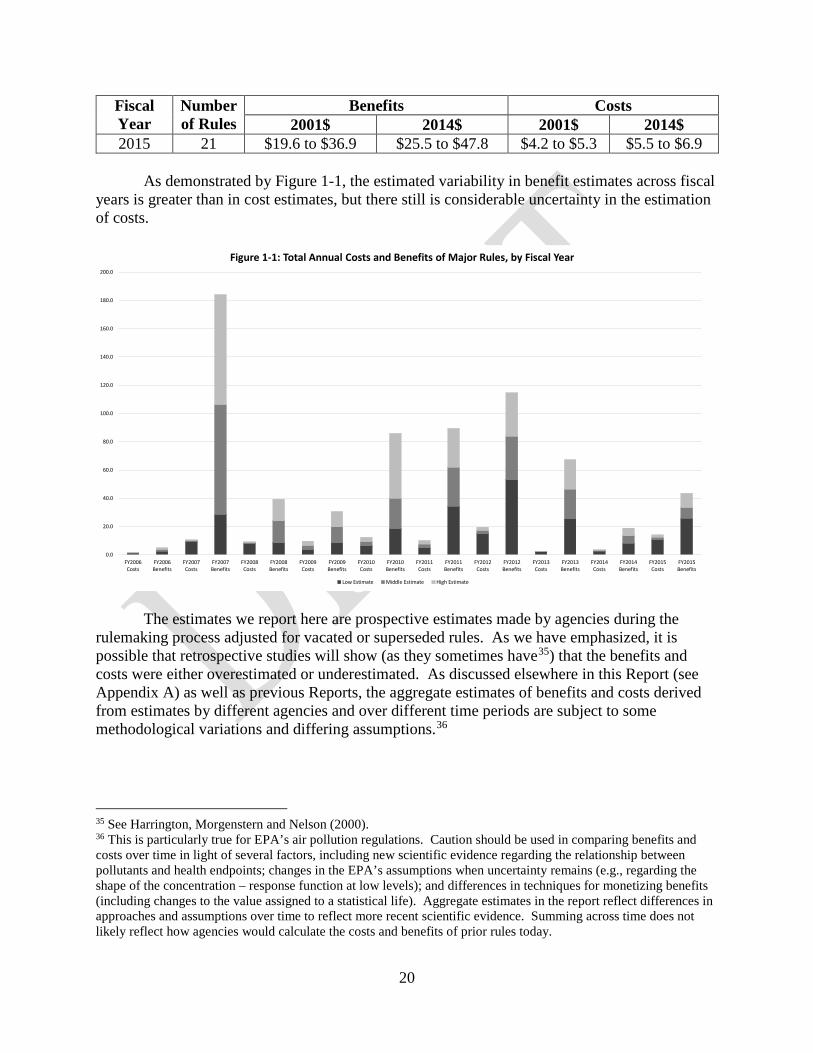
Table 1-4 reports the total benefits and costs of rules issued from October 1, 2005 to September 30, 2015 by fiscal year for which monetized estimates of substantial portions of both benefits and costs are available.32 Figure 1-1 provides similar information to Table 1-4 in graphical form. The bars in this figure presents the annual sums of primary estimates (or midpoints of ranges if primary estimates are not available) for costs and benefits. The accompanying error bars represent the ranges in values between low and high estimates for costs and benefits.
Table 1-4: Total Annual Benefits and Costs of Major Rules (For Which Both Benefits and Costs Have Been Estimated) by Fiscal Year
(billions of 2001 and 2014 dollars)
Fiscal Year
Number of Rules
Benefits Costs 2001$ 2014$ 2001$ 2014$
2006 633 $2.5 to $5.0 $3.3 to $6.4 $1.1 to $1.4 $1.5 to $1.9 2007 12 $28.6 to $184.2 $37.1 to $239.0 $9.4 to $10.7 $12.2 to $13.8 2008 12 $8.5 to $39.4 $11.1 to $51.1 $7.9 to $9.2 $10.2 to $11.9 2009 16 $8.6 to $30.7 $11.2 to $39.8 $3.7 to $9.6 $4.8 to $12.5 2010 1734 $18.6 to $85.9 $24.2 to $111.5 $6.4 to $12.4 $8.3 to $16.0 2011 12 $34.3 to $89.5 $44.6 to $116.1 $5.0 to $10.1 $6.5 to $13.1 2012 14 $53.2 to $114.6 $69.0 to $148.8 $14.8 to $19.5 $19.2 to $25.4 2013 7 $25.6 to $67.3 $33.2 to $87.4 $2.0 to $2.5 $2.6 to $3.3
2014 13 $8.1 to $18.9 $10.5 to $24.5 $2.5 to $3.7 $3.3 to $4.8
32 Table 1-4 includes all rules reported in Table 1-1. The ranges will not necessarily match previously reported estimates for a fiscal year in past reports as rules have been dropped over time, as described in this and past reports. See Appendix A for a complete list of rules included in these totals. In some years, the costs attributable to rules that did not have monetized benefits are relatively large when compared to the costs of rules that had both benefits and costs monetized. In order to maintain the convention we have used over many years of presenting in this table and accompanying diagram only estimates of rules for which both costs and benefits were monetized, we have not included the costs here. There are also rules that only had benefits monetized; however, their inclusion in this year’s totals would have only a small impact on the overall benefits estimate. All of these additional rules are listed and summarized in Table 1-6(b) below. 33 This total does not include the impacts of EPA’s 2006 PM NAAQS rule. Consistent with past practices, the benefit and cost estimates of the NAAQS rulemaking was only included until the implementing regulations were finalized. 34 This total excludes the impacts of DOT’s 2010 Electronic On-Board Recorders for Hours-of-Service Compliance rule. This rule was vacated by the U.S. Court of Appeals for the Seventh Circuit on August 26, 2011.
20
Fiscal Year
Number of Rules
Benefits Costs 2001$ 2014$ 2001$ 2014$
2015 21 $19.6 to $36.9 $25.5 to $47.8 $4.2 to $5.3 $5.5 to $6.9
As demonstrated by Figure 1-1, the estimated variability in benefit estimates across fiscal years is greater than in cost estimates, but there still is considerable uncertainty in the estimation of costs.
0.0
20.0
40.0
60.0
80.0
100.0
120.0
140.0
160.0
180.0
200.0
FY2006Costs
FY2006Benefits
FY2007Costs
FY2007Benefits
FY2008Costs
FY2008Benefits
FY2009Costs
FY2009Benefits
FY2010Costs
FY2010Benefits
FY2011Costs
FY2011Benefits
FY2012Costs
FY2012Benefits
FY2013Costs
FY2013Benefits
FY2014Costs
FY2014Benefits
FY2015Costs
FY2015Benefits
Figure 1-1: Total Annual Costs and Benefits of Major Rules, by Fiscal Year
Low Estimate Middle Estimate High Estimate The estimates we report here are prospective estimates made by agencies during the
rulemaking process adjusted for vacated or superseded rules. As we have emphasized, it is possible that retrospective studies will show (as they sometimes have35) that the benefits and costs were either overestimated or underestimated. As discussed elsewhere in this Report (see Appendix A) as well as previous Reports, the aggregate estimates of benefits and costs derived from estimates by different agencies and over different time periods are subject to some methodological variations and differing assumptions.36
35 See Harrington, Morgenstern and Nelson (2000). 36 This is particularly true for EPA’s air pollution regulations. Caution should be used in comparing benefits and costs over time in light of several factors, including new scientific evidence regarding the relationship between pollutants and health endpoints; changes in the EPA’s assumptions when uncertainty remains (e.g., regarding the shape of the concentration – response function at low levels); and differences in techniques for monetizing benefits (including changes to the value assigned to a statistical life). Aggregate estimates in the report reflect differences in approaches and assumptions over time to reflect more recent scientific evidence. Summing across time does not likely reflect how agencies would calculate the costs and benefits of prior rules today.

21
C. Estimates of the Benefits and Costs of Major Rules Issued in Fiscal Year 2015
1. Major Rules Issued by Executive Departments and Agencies
In this section, we examine in more detail the estimated benefits and costs of the major final rules for which OMB concluded review during the 12-month period beginning October 1, 2014, and ending September 30, 2015.37 (Note that 29 of the 59 rules are transfer rules.) Major rules represent approximately 30 percent of the 194 final rules reviewed by OMB.38,39
Overall, HHS promulgated the largest number of major rules in FY 2015 (eighteen);
eleven of these rules were annual budget rules (i.e., rules that involve changes in the federal government’s outlays, such as Medicare funding, or receipts, such as passport fees), largely transferring income from one group of entities to another without directly imposing significant costs on the private sector, while the other seven do have significant economic impact on the private sector. Several major HHS rules were issued in accordance with the Patient Protection and Affordable Care Act; relevant RINs include 0938-AS19, 0938-AS50, 0910-AG56 and 0910-AG57.
The monetized costs and benefits estimates of 21 FY2015 rules are aggregated by agency in Table 1-5 and listed in Table 1-6(a), and most are included in the ten-year aggregates in Tables 1-1, 1-2, and 1-4.40
37 This count excludes rules that were withdrawn from OMB review or rules that were rescinded, or vacated after publication. It also counts joint rules as a single rule, even if they were submitted to OMB separately for review. 38 Counts of OMB-reviewed rules are available through the “review counts” and “search” tools on OIRA’s regulatory information website (www.reginfo.gov). 39 We discussed the relative contribution of major rules to the total impact of Federal regulation in detail in the “response-to-comments” section on pages 26-27 of the 2004 Report. Our evaluation of a few representative agencies found that major rules represented the vast majority of the benefits and costs of all rules promulgated by these agencies and reviewed by OMB. Based on our ongoing review of rules that are and are not major, we believe this trend is still true today. 40 As noted in previous Reports, we include rules that provide both the benefit and cost estimates to the ten-year aggregation so that “apples-to-apples” comparison can be preserved.

22
Table 1-5: Estimates, by Agency, of the Total Annual Benefits and Costs of Major Rules (For Which Both Benefits and Costs Have Been Estimated): October 1, 2014 - September
30, 2015 (billions of 2001 or 2014 dollars) Agency Number of
Rules Benefits Costs
2001$ 2014$ 2001$ 2014$ Department of Agriculture 2 $0.3 to
$0.7 $0.3 to
$0.9 $0.2 to
$0.4 $0.2 to $0.5
Department of Energy 3 $1.1 to $1.3
$1.5 to $1.6
$0.6 to $0.8
$0.8 to $1.0
Department of Health and Human Services
3 $0.5 to $1.3
$0.6 to $1.7
$0.3 to $0.4
$0.4 to $0.5
Department of Homeland Security
1 $0.2 to $0.4
$0.3 to $0.5
$0.2 to $0.4
$0.3 to $0.5
Department of Labor 1 $0.0 to $0.1
$0.0 to $0.1
$0.0 to $0.1
$0.0 to $0.1
Department of Transportation
3 $0.3 to $0.7
$0.4 to $1.0
-$1.3 to -$1.2
-$1.7 to -$1.5
Environmental Protection Agency
8 $17.2 to
$32.5
$22.4 to $42.1
$4.3 to $4.5
$5.5 to $5.9
Total 21 $19.6 to
$36.9
$25.5 to $47.8
$4.2 to $5.3 $5.5 to $6.9
Twenty-nine of the major rules issued in FY 2015 were “transfer rules”— rules that primarily caused income transfers, usually from taxpayers to program beneficiaries. Most of these implement Federal budgetary programs as required or authorized by Congress. Rules of this kind are promulgated in response to statutes that authorize and often require them. Although rules that affect Federal budget programs are subject to Executive Orders 12866 and 13563 and OMB Circular A-4, and are reviewed by OMB, past Reports have focused primarily on regulations that have effects largely through private sector mandates. (For transfer rules, agencies typically report the estimated budgetary impacts.)
We recognize that markets embed distortions and that the transfers are not lump-sum, thereby changing relative prices of goods and services. Hence, transfer rules may create social benefits or costs. For example, they may impose real costs on society to the extent that they cause people to change behavior, either by directly prohibiting or mandating certain activities, or, more often, by altering prices. The costs resulting from these behavior changes are referred to as the “deadweight losses” associated with the transfer. Rules that reduce distortions may result in analogous gains. The Regulatory Right-to-Know Act requires OMB to report the total costs and benefits of these rules, which includes the social costs and benefits of these rules, and OMB encourages agencies to report these costs and benefits for transfer rules; OMB will consider incorporating any such estimates into future Reports.
23
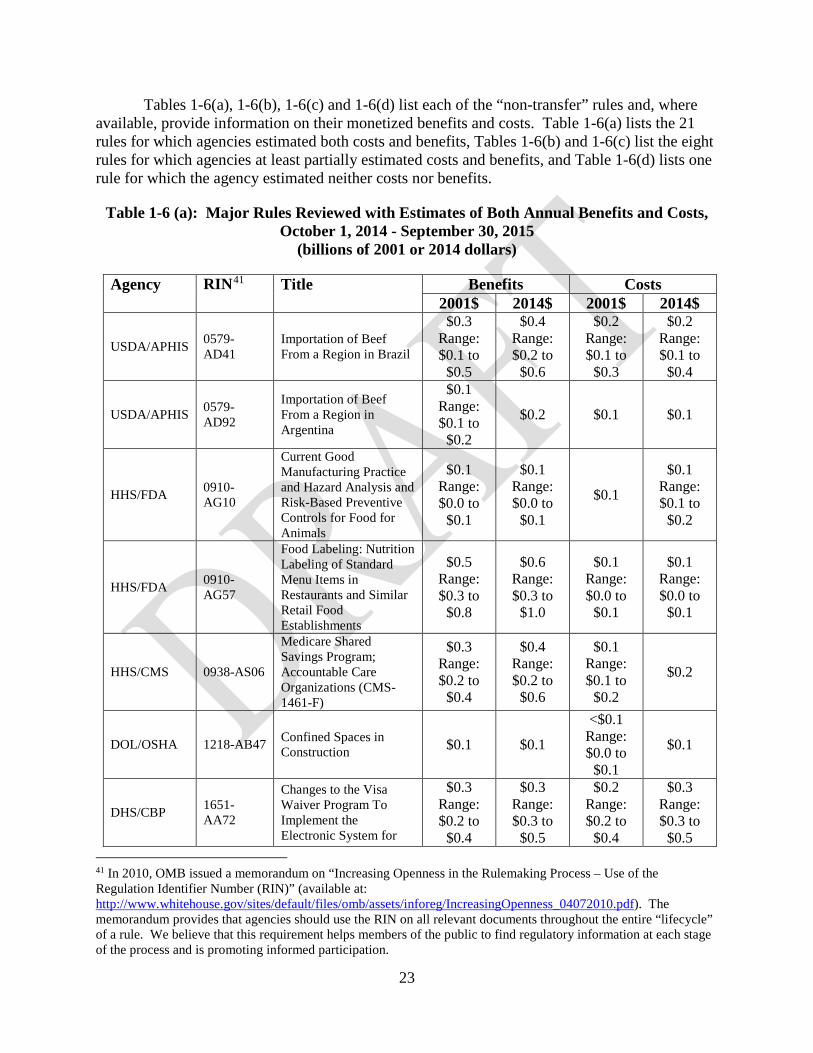
Tables 1-6(a), 1-6(b), 1-6(c) and 1-6(d) list each of the “non-transfer” rules and, where available, provide information on their monetized benefits and costs. Table 1-6(a) lists the 21 rules for which agencies estimated both costs and benefits, Tables 1-6(b) and 1-6(c) list the eight rules for which agencies at least partially estimated costs and benefits, and Table 1-6(d) lists one rule for which the agency estimated neither costs nor benefits.
Table 1-6 (a): Major Rules Reviewed with Estimates of Both Annual Benefits and Costs, October 1, 2014 - September 30, 2015
(billions of 2001 or 2014 dollars)
Agency RIN41 Title Benefits Costs 2001$ 2014$ 2001$ 2014$
USDA/APHIS 0579-AD41
Importation of Beef From a Region in Brazil
$0.3 Range: $0.1 to
$0.5
$0.4 Range: $0.2 to
$0.6
$0.2 Range: $0.1 to
$0.3
$0.2 Range: $0.1 to
$0.4
USDA/APHIS 0579-AD92
Importation of Beef From a Region in Argentina
$0.1 Range: $0.1 to
$0.2
$0.2 $0.1 $0.1
HHS/FDA 0910-AG10
Current Good Manufacturing Practice and Hazard Analysis and Risk-Based Preventive Controls for Food for Animals
$0.1 Range: $0.0 to
$0.1
$0.1 Range: $0.0 to
$0.1
$0.1
$0.1 Range: $0.1 to
$0.2
HHS/FDA 0910-AG57
Food Labeling: Nutrition Labeling of Standard Menu Items in Restaurants and Similar Retail Food Establishments
$0.5 Range: $0.3 to
$0.8
$0.6 Range: $0.3 to
$1.0
$0.1 Range: $0.0 to
$0.1
$0.1 Range: $0.0 to
$0.1
HHS/CMS 0938-AS06
Medicare Shared Savings Program; Accountable Care Organizations (CMS-1461-F)
$0.3 Range: $0.2 to
$0.4
$0.4 Range: $0.2 to
$0.6
$0.1 Range: $0.1 to
$0.2
$0.2
DOL/OSHA 1218-AB47 Confined Spaces in Construction $0.1 $0.1
<$0.1 Range: $0.0 to
$0.1
$0.1
DHS/CBP 1651-AA72
Changes to the Visa Waiver Program To Implement the Electronic System for
$0.3 Range: $0.2 to
$0.4
$0.3 Range: $0.3 to
$0.5
$0.2 Range: $0.2 to
$0.4
$0.3 Range: $0.3 to
$0.5 41 In 2010, OMB issued a memorandum on “Increasing Openness in the Rulemaking Process – Use of the Regulation Identifier Number (RIN)” (available at: http://www.whitehouse.gov/sites/default/files/omb/assets/inforeg/IncreasingOpenness_04072010.pdf). The memorandum provides that agencies should use the RIN on all relevant documents throughout the entire “lifecycle” of a rule. We believe that this requirement helps members of the public to find regulatory information at each stage of the process and is promoting informed participation.

24
Agency RIN41 Title Benefits Costs 2001$ 2014$ 2001$ 2014$
Travel Authorization (ESTA) Program
DOE/EE 1904-AC39 Energy Efficiency Standards for Automatic Commercial Ice Makers
$0.1 $0.1 <$0.1 <$0.1
DOE/EE 1904-AC43
Energy Conservation Standards for General Service Fluorescent Lamps and Incandescent Reflector Lamps
$1.1 Range: $1.0 to
$1.1
$1.4
$0.7 Range: $0.6 to
$0.7
$0.9 Range: $0.7 to
$0.9
DOE/NNSA 1994-AA02
Assistance to Foreign Atomic Energy Activities
<$0.1 Range: $0.0 to
$0.1
<$0.1 Range: $0.0 to
$0.1
<$0.1 Range: $0.0 to
$0.1
<$0.1 Range: $0.0 to
$0.1
EPA/WATER 2040-AF14
Effluent Limitations Guidelines and Standards for the Steam Electric Power Generating Point Source Category
$0.3 to $0.4
Range: $0.5 to
$0.6 $0.4 $0.5
EPA/WATER 2040-AF30 Clean Water Rule: Definition of "Waters of the United States"42
Range: $0.3 to
$0.4
Range: $0.3 to
$0.6
Range: $0.1 to
$0.4
Range: $0.2 to
$0.5
EPA/SWER 2050-AE81
Standards for the Management of Coal Combustion Residuals Generated by Commercial Electric Power Producers
$0.2
$0.2 Range: $0.2 to
$0.3
$0.4 Range: $0.4 to
$0.6
$0.5 Range: $0.5 to
$0.7
EPA/SWER 2050-AG46
Revising Underground Storage Tank Regulations - Revisions to Existing Requirements and New Requirements for Secondary Containment and Operator Training
$0.2 Range: $0.1 to
$0.4
$0.3 Range: $0.1 to
$0.5
$0.1 $0.2
EPA/AR 2060-AP38 Review of the National Ambient Air Quality Standards for Ozone
Range: $1.2 to
$2.7
Range: $1.5 to
$3.5 $0.6 $0.7
EPA/AR 2060-AP69
NESHAP for Brick and Structural Clay Products Manufacturing and NESHAP for Clay Ceramics Manufacturing
$0.1 Range: $0.1 to
$0.2
Range: $0.1 to
$0.2 <$0.1 <$0.1
42 The “high end scenario” EPA analyzed, representing the high ends of the ranges of benefits and costs, includes a doubling of the number of “other waters” as represented in the data on jurisdictional determinations, to counter the argument that “other waters” were underrepresented; this doubling is not, however, based on specific data.

25
Agency RIN41 Title Benefits Costs 2001$ 2014$ 2001$ 2014$
EPA/AR 2060-AP93
Standards of Performance for New Residential Wood Heaters and New Residential Hydronic Heaters and Forced-Air Furnaces
Range: $2.4 to
$5.9
Range: $3.2 to
$7.7 <$0.1 <$0.1
EPA/AR 2060-AR33
Carbon Pollution Emission Guidelines for Existing Stationary Sources: Electric Utility Generating Units43
Range: $12.7 to
$22.1
Range: $16.5 to
$28.7
Range: $2.5 to
$2.6
Range: $3.2 to
$3.4
DOT/FMCSA 2126-AB46 Inspection, Repair, and Maintenance; Driver- $0 $0 -$1.4 -$1.8
43 The annual compliance cost presented here is based EPA’s illustrative compliance scenario, and is a standard annualization of the projected additional cost of complying with the rule. It reflects the net difference in the sum of the annualized cost of capital investment in new generating sources and heat rate improvements at coal steam facilities, the change in the ongoing costs of operating pollution controls, the change in expenditures on various fuels (inclusive of changes in the price of these fuels), demand-side energy efficiency measures, and other actions associated with compliance. In simple terms, these costs are an estimate of the increased power industry expenditures required to meet demand projections while complying with state goals, including the total demand-side energy efficiency costs. In particular, this cost represents the net outcome of several effects, explained in more detail in EPA’s Regulatory Impact Analysis. First, EPA estimated that annualized expenditures required to supply enough electricity to meet demand decline by between $18 billion (rate) and $21 billion (mass) from the base case in 2030 (with similar scaled impacts in other years of the analysis). This incremental decline is a net outcome of two simultaneous effects that move in opposite directions. First, imposing the CO2 constraints represented by each illustrative plan scenario on electric generators would, other things equal, result in an incremental increase in expenditures to supply any given level of electricity. However, once electricity demand is reduced to reflect demand-side energy efficiency improvements, there is a substantial reduction in the expenditures needed to supply a correspondingly lower amount of electricity demand. Second, in order to reflect the full compliance cost, EPA included the annualized expenditures needed to secure the demand-side energy efficiency improvements. EPA has estimated these energy efficiency-related expenditures to be, for example, $26.3 billion in 2030 (using a 3 percent discount rate). The energy efficiency-related expenditures include costs incurred by parties administering energy efficiency programs, and costs incurred by participants in those programs. Note that in rulemakings involving energy efficiency standards for appliances and other products, OMB has typically followed a reporting convention of disaggregating the costs of energy efficiency investments and their subsequent fuel or power savings (as well as the external climate and air pollution benefits). In those energy efficiency rules, however, fuel or power savings are their direct regulatory objective. In contrast, in rules where emissions reductions are the direct objective, saving fuel or power savings are a means of achieving the required emissions reductions but are not in and of themselves required by the regulation. OMB solicits comment on whether, in future consideration of emissions or other rules in which energy efficiency is a compliance mechanism but not a direct regulatory requirement, we should disaggregate some of the different components of cost estimates similarly to the disaggregation we use for the energy efficiency rules. Under a disaggregated approach, OMB could separately report those savings as a benefit of the rule, instead of a cost offset, if the data and modeling support reasonable separation of these effects. We note that in the EPA analysis under discussion, such a disaggregation of impacts would not represent a substantive change to EPA’s analysis or affect the welfare conclusions reached regarding the rule.

26
Agency RIN41 Title Benefits Costs 2001$ 2014$ 2001$ 2014$
Vehicle Inspection Report (RRR)
DOT/NHTSA 2127-AK97
Electronic Stability Control Systems for Heavy Vehicles (MAP-21)
$0.4 Range: $0.3 to
$0.5
$0.5 Range: $0.4 to
$0.7
<$0.1 <$0.1
DOT/PHMSA 2137-AE91
Hazardous Materials: Enhanced Tank Car Standards and Operational Controls for High-Hazard Flammable Trains
$0.1 Range: $0.1 to
$0.2
Range: $0.1 to
$0.3 $0.2 $0.2
Eight rules for which agencies monetized either benefits or costs are listed in Tables 1-6(b) and 1-6(c). In some cases, agencies lack data to fully monetize. In other cases, benefits or costs may be difficult to quantify, leading agencies to rely on qualitative measures. Two of the rules in Table 1-6(b), DOI’s two Migratory Bird Hunting regulations, assessed only benefits. Six rules reported (partially or fully) monetized costs, without monetizing benefits according to an analytic standard approaching the level set by Circular A-4. The potential transfer effects and non-quantified effects of rules are described in “other information” column of Table A-1.44
One rule(s) for which agencies estimated neither costs nor benefits is listed in Table 1-6(d).
We continue to work with agencies to improve the quantification of the benefits and costs of these types of regulations and to make progress toward quantifying variables that have thus far been discussed only qualitatively. Executive Order 13563 notes that agencies “may consider (and discuss qualitatively) values that are difficult or impossible to quantify,” but firmly states that “each agency is directed to use the best available techniques to quantify anticipated present and future benefits and costs as accurately as possible.”
44 In some instances, agencies have been unable to quantify the benefits and costs of rules because existing information does not permit reliable estimates. In these cases, agencies generally have followed the guidance of Circular A-4 and have provided detailed discussions of the non-quantified benefits and costs in their analysis of rules in order to help decision-makers understand the significance of these factors. For example, DOI promulgates annual Migratory Bird Hunting regulations, which permit hunting of migratory birds. The two potential societal costs are (1) any long-run effect on the bird populations and (2) the cost associated with administering and enforcing the permit program. Evaluating the long-term population effect of annual hunting permits is difficult. Also, State governments administer and enforce the permit program; gathering relevant information is difficult.

27
Table 1-6(b): Major Rules Reviewed with Estimates of Annual Costs, October 1, 2014 - September 30, 2015
(billions of 2001 or 2014 dollars)
Agency RIN Title Costs 2001$ 2014$
HHS 0910-AG36
Current Good Manufacturing and Hazard Analysis, and Risk-Based Preventive Controls for Human Food
$0.9 $1.2
HHS 0910-AG56
Food Labeling: Calorie Labeling of Articles of Food Sold in Vending Machines
<$0.1 <$0.1 Range: $0.0 to $0.1
HHS not applicable Final Determination Regarding Partially Hydrogenated Oils
$0.4 Range: $0.2 to $0.8
$0.6 Range: $0.2 to $1.1
ED 1840-AD15 Gainful Employment45 $0.3 $0.3
EPA 2060-AQ75
Petroleum Refinery Sector Risk and Technology Review and New Source Performance Standards
$0.1 $0.1
EPA 2060-AR76 Renewable Fuel 2014 Volume Standards Range: $0.0 to $0.8 Range: $0.0 to $1.0
Table 1-6(c): Major Rules Reviewed with Estimates of Annual Benefits, October 1, 2014 - September 30, 2015
(billions of 2001 or 2014 dollars)
Agency RIN Title Benefits 2001$ 2014$
DOI 1018-BA67 Migratory Bird Hunting; 2015-2016 Migratory Game Bird Hunting Regulations (Early Season)
$0.2-$0.3 $0.3-$0.4
DOI 1018- BA67 Migratory Bird Hunting; 2015-2016 Migratory Game Bird Hunting Regulations (Late Season)
$0.2-$0.3 $0.3-$0.4
45 This rule also has substantial non-budget transfers among affected entities.

28
Table 1-6(d): Major Rule Reviewed Without Estimates of Annual Benefits or Costs October 1, 2014- September 30, 2015
Agency RIN Title Benefits Costs
HHS 0938-AS50 Coverage of Certain Preventive Services; Eligible Organizations (CMS-9940-F)
Not Estimated Not Estimated
Table 1-7(a) lists each of 25 “budget” rules and provides information on the estimated income transfers. Unless otherwise noted, OMB simply converts to 2001 and 2014 dollars agencies’ own estimates of annualized impacts. For many budget and non-budget rules, we summarize the available information on the non-monetized impacts, where available, for these regulations in the “other information” column of Table A-1 in Appendix A. Table 1-7(b) lists the four non-budget transfer rules. The primary economic impact of each of these rules is to cause transfers between parties outside the Federal Government, and the table includes agencies’ estimates of these transfers, if available.
Table 1-7(a) Major Rules Implementing or Adjusting Federal Budgetary Programs, October 1, 2014 - September 30, 2015
(billions of 2001 or 2014 dollars)
Agency RIN Title Transfers 2001$ 2014$
USDA 0579-AD77 User Fees for Agricultural Quarantine and Inspection Services (<$0.1) (<$0.1)
USDA 0570-AA73 Biorefinery, Renewable Chemical,
and Biobased Product Manufacturing Assistance Program
$0.1 $0.1
USDA 0570-AA76 Rural Energy for America Program $0.2 $0.2
USDA 0570-AA94 Strategic Economic and Community
Development $0.3
Range: $0.3 to $0.4
$0.4 Range: $0.4 to
$0.5
USDA 0578-AA62 Environmental Quality Incentives
Program (EQIP) $0.7
Range: $0.7 to $0.9
$0.9 Range: $0.9 to
$1.1
DHS 1652-AA68 Adjustment of Passenger Civil Aviation Security Service Fee $0.1 $0.1
ED 1810-AB22 School Improvement Grants (SIG) Program $0.4 $0.5
ED 1855-AA12 Charter Schools Grants to SEAs $0.1 $0.1
HHS 0938-AP01 Requirements for the Medicare Incentive Reward Program and
Provider Enrollment (CMS-6045-F)
($0.3) Range: ($0.1) to
($0.4)
($0.3) Range: ($0.2)
to ($0.5)
HHS 0938-AQ37 Medicaid Disproportionate Share
Hospital Payments Uninsured Definition (CMS-2315-F)
Not Estimated Not Estimated
HHS 0938-AS12 CY 2015 Revisions to Payment Policies Under the Physician Fee ($11.1) ($14.5)

29
Agency RIN Title Transfers 2001$ 2014$
Schedule and Other Revisions to Medicare Part B (CMS-1612-FC)
HHS 0938-AS13
CY 2015 End-Stage Renal Disease Prospective Payment System, Quality
Incentive Program, and Durable Medical Equipment, Prosthetics,
Orthotics, and Supplies (CMS-1614-F)
$0.9 $1.2
HHS 0938-AS14 CY 2015 Home Health Prospective Payment System Refinements and
Rate Update (CMS-1611-F) (<$0.1) ($0.1)
HHS 0938-AS15
CY 2015 Hospital Outpatient Prospective Payment System (PPS) Policy Changes and Payment Rates, and CY 2015 Ambulatory Surgical
Center Payment System Policy Changes and Payment Rates (CMS-
1613-FC)
$0.7 $0.9
HHS 0938-AS19 CY 2016 Notice of Benefit and Payment Parameters (CMS-9944-F) $0.3 $0.4
HHS 0938-AS39 FY 2016 Hospice Rate Update (CMS-1629-F) $0.1 $0.2
HHS 0938-AS41
Hospital Inpatient Prospective Payment System for Acute Care
Hospitals and the Long-Term Care Hospital Prospective Payment
System and FY 2016 Rates (CMS-1632-FC)
<$0.1 <$0.1
HHS 0938-AS44
FY 2016 Prospective Payment System and Consolidated Billing for
Skilled Nursing Facilities (CMS-1622-F)
$0.3 $0.4
HHS 0938-AS45 FY 2016 Inpatient Rehabilitation
Facility Prospective Payment System (CMS-1624-F)
$0.1 $0.1
HUD 2506-AC30 Housing Trust Fund $0.3
Range: $0.1 to $1.1
$0.4 Range: $0.1 to
$1.4 VA 2900-AN94 Caregivers Program $0.4 $0.5 VA 2900-AP15 Copayments for Medications in 2015 $0.1 $0.1 VA 2900-AP15 Copayments for Medications in 2015 $0.1 $0.2
VA 2900-AP24 Driving Distance Eligibility for the Veterans Choice Program $2.6 $3.4
VA 2900-AP24 Driving Distance Eligibility for the Veterans Choice Program $0.7 to $4.3 $0.9 to $5.6

30
( ) indicates a budget savings
Table 1-7(b): Non-Budget Transfer Rules, October 1, 2014 - September 30, 2015 (billions of 2001 or 2014 dollars)
Agency RIN Title Transfers 2001$ 2014$
OPM 3206-AN08 Federal Employees Health Benefits Program Self Plus One Enrollment Type
$0.3 $0.4
DoD 0790-AJ10 Limitations on Terms of Consumer Credit Extended to Service Members and Dependents
$0.1 $0.1
DHS and DOL 1205-AB76 Temporary Non-Agricultural Employment of H-2B
Aliens in the United States $0.1 $0.1
DOL 1235-AA10 Establishing a Minimum Wage for Contractors, Executive Order 13658
$0.2 $0.3
2. Major Rules Issued by Independent Agencies
The Small Business Regulatory Enforcement Fairness Act of 1996 (SBREFA)46 requires the Government Accountability Office (GAO) to submit to Congress reports on major rules, including rules issued by agencies not subject to Executive Orders 12866 and 13563. In preparing this Report, we reviewed the information contained in GAO reports on benefits and costs of major rules issued by independent agencies for the period of October 1, 2014 to September 30, 2015.47 GAO reported that ten agencies issued a total of ten major rules during this period. (Rules by independent agencies are not subject to OMB review under Executive Order 13563 and Executive Order 12866.)
Table 1-10 lists each of these major rules and the extent to which GAO reported benefit and cost estimates for the rule. The majority of rules were issued to regulate the financial sector. The Federal Reserve System issued a rule that implements capital surcharges to global systemically important bank holding companies. The Securities and Exchange Commission issued a corporate governance rule that discloses the ratio of the median total compensation of all employees in a company and the total compensation of its CEO. However, the Federal Communications Commission issued its open internet rule which is expected to have significant economic effects. Some of the financial regulations were promulgated to comply with the requirements of the Dodd-Frank Wall Street Reform and Consumer Protection Act (Dodd-Frank Act).
Nine of the ten rules48 provided some information on the benefits and costs of the regulation. The independent agencies still have challenges in providing monetized estimates of benefits and costs of regulation. Six rules included analyses that monetized costs of some 46 Pub. L. No. 104-121. 47 In practice, a rule was considered “major” for the purposes of the report if (a) it was estimated to have either annual costs or benefits of $100 million or more or (b) it was likely to have a significant impact on the economy. 48 One out of the 17 rules finalizes an interim final rule that was reported in the 2014 Report.

31
provisions. The costs associated with disclosure related provisions have been largely monetized because of the requirements of the Paperwork Reduction Act; the costs associated with provisions that change how the markets are regulated are not generally monetized. In light of the limited information provided by the GAO, the Office of Management and Budget does not know whether the rigor of the analyses conducted by these agencies is similar to that of the analyses performed by agencies subject to OMB review.
The agencies in question are independent under the law; existing Executive Orders generally do not require independent agencies to submit their regulations for review or to engage in analysis of costs and benefits. We emphasize, however, that for the purposes of informing the public and obtaining a full accounting, it would be highly desirable to obtain better information on the benefits and costs of the rules issued by independent agencies. The absence of such information is a continued obstacle to transparency, and it might also have adverse effects on public policy. Consideration of costs and benefits is a pragmatic instrument for ensuring that regulations will improve social welfare; an absence of information on costs and benefits can lead to inferior decisions.
Executive Order 13563 emphasizes the importance of agency use of “the best available techniques to quantify anticipated present and future benefits and costs as accurately as possible.” While that Executive Order applies only to executive agencies, independent agencies may wish to consider the use of such techniques. In Executive Order 13579, the President explicitly said that the independent agencies should follow the central principles of Executive Order 13563. In its February 2, 2011, guidance on Executive Order 13563, OMB also encouraged the independent agencies to follow the principles and requirements of the order.49
OMB provides in Appendix C of this Report a summary of the information available on the regulatory analyses for major rules by the independent agencies over the past ten years. This summary is similar to the ten-year lookback for regulation included in recent Reports. It examines the number of major rules promulgated by independent agencies as reported to the GAO from 2006 through 2015, which are presented in Tables C-1 and C-2.50
49 Memorandum for the Heads of Executive Departments and Agencies, and of Independent Regulatory Agencies, M-11-10, “Executive Order 13563, ‘Improving Regulation and Regulatory Review,’” p. 6, available at http://www.whitehouse.gov/sites/default/files/omb/memoranda/2011/m11-10.pdf. 50 OMB reconstructed the estimates for this period based on GAO reports. Prior to the 2003 Report, OMB did not report on independent agency major rules on a fiscal year basis, but rather on an April-March cycle. Similar to last year, OMB is reporting all of the rules from 2006 through 2015 on a fiscal year basis (see Table C-1). The number of rules presented in earlier Reports may therefore not match the number of rules presented here.

32
Table 1-10: Major Rules Issued by Independent Regulatory Agencies, October 1, 2014 - September 30, 2015
Agency Rule Information on Benefits
or Costs
Monetized Benefits
Monetized Costs
Department of Housing and Urban Development, Department of the Treasury, Office of the Comptroller of the Currency, Federal Deposit Insurance Corporation, Federal Housing Finance Agency, Federal Reserve System, and Securities and Exchange Commission
Credit Risk Retention (79 FR 77,602)
Yes No Yes
Department of the Treasury, Office of the Comptroller of Currency, Federal Deposit Insurance Corporation, Federal Reserve System, Farm Credit Administration, and National Credit Union Administration
Loans in Areas Having Special Flood Hazards (80 FR 43,216)
Yes No Yes
Federal Communications Commission
Protecting and Promoting the Open Internet (80 FR 19,738)
No No No
Federal Reserve System
Regulatory Capital Rules: Implementation of Risk-Based Capital Surcharges for Global Systemically Important Bank Holding Companies (80 FR 49,082)
Yes No No
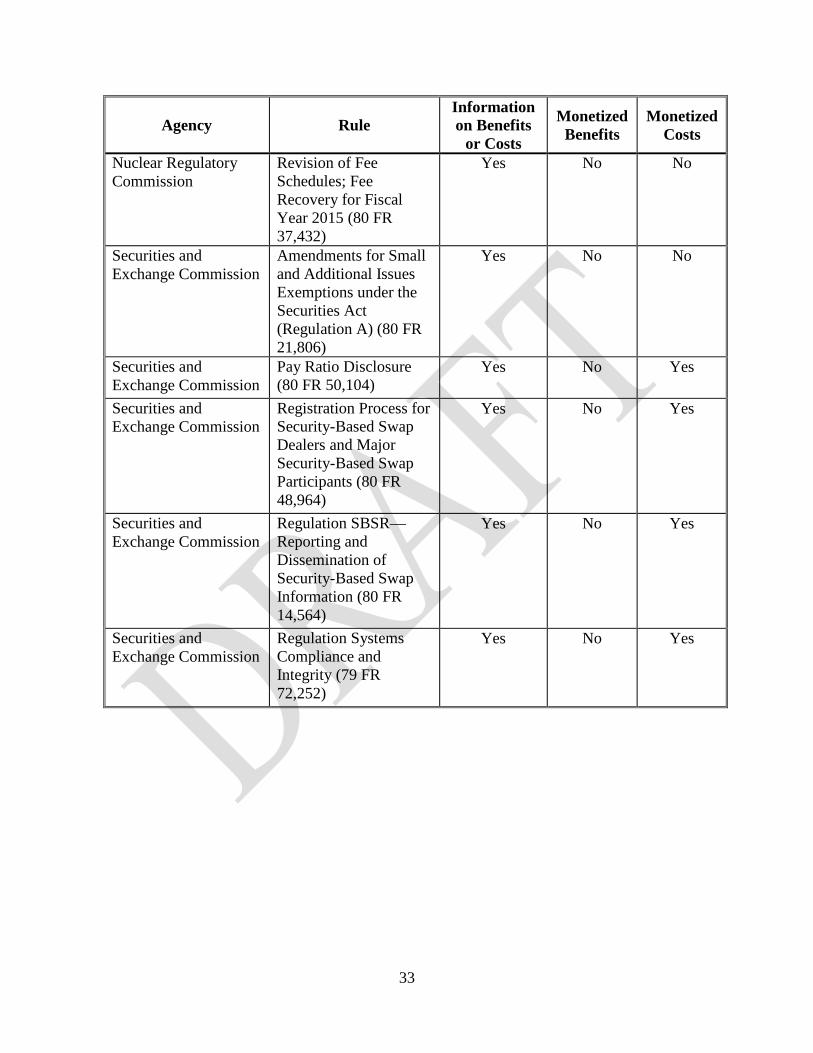
33
Agency Rule Information on Benefits
or Costs
Monetized Benefits
Monetized Costs
Nuclear Regulatory Commission
Revision of Fee Schedules; Fee Recovery for Fiscal Year 2015 (80 FR 37,432)
Yes No No
Securities and Exchange Commission
Amendments for Small and Additional Issues Exemptions under the Securities Act (Regulation A) (80 FR 21,806)
Yes No No
Securities and Exchange Commission
Pay Ratio Disclosure (80 FR 50,104)
Yes No Yes
Securities and Exchange Commission
Registration Process for Security-Based Swap Dealers and Major Security-Based Swap Participants (80 FR 48,964)
Yes No Yes
Securities and Exchange Commission
Regulation SBSR—Reporting and Dissemination of Security-Based Swap Information (80 FR 14,564)
Yes No Yes
Securities and Exchange Commission
Regulation Systems Compliance and Integrity (79 FR 72,252)
Yes No Yes

34
Chapter II: The Impact of Federal Regulation on State, Local, and Tribal Governments, Small Business, Wages and Employment, and Economic Growth
Section 624 (a)(2) of the Regulatory Right-to-Know Act requires OMB to present an
analysis of the impacts of Federal regulation on State, local, and tribal governments, small business, wages, and economic growth. In addition, the 2011 Presidential Memorandum: Administrative Flexibility calls for a series of measures to promote flexibility for State, local, and tribal governments; these measures include reduced reporting burdens and streamlined regulation.51
A. Impacts on State, Local, and Tribal Governments
In the United States, State and local governments have the primary role in providing domestic public services, such as public education, law enforcement, road building and maintenance, water supply, and sewage treatment. The Federal Government contributes to that role by promoting a healthy economy and by providing grants, loans, and tax subsidies to State and local governments. However, State, local, and tribal governments can have difficulty complying with Federal mandates without additional Federal resources.
In response, Congress passed the Unfunded Mandates Reform Act of 1995 (UMRA, or “the Act”). Title II, which addresses the Executive Branch, begins with a general directive for agencies to assess, unless otherwise prohibited by law, the effects of their rules on other levels of government and on the private sector. Title II also describes specific analyses and consultations that agencies must undertake for rules that may result in expenditures of over $100 million (adjusted annually for inflation) in any year by State, local, and tribal governments in the aggregate, or by the private sector.
Over the past ten years, the following rules have imposed costs of more than $100 million per year (1995$) on State, local, and tribal governments and have been classified as public sector mandates under the Act:52
• EPA’s National Primary Drinking Water Regulations: Stage 2 Disinfectants and Disinfection Byproducts Rule (2006): The rule protects against illness due to drinking water disinfectants and disinfection byproducts (DBPs).53 The rule effectively
51 President Barack Obama, Memorandum for the Heads of Executive Departments and Agencies, “Presidential Memorandum – Administrative Flexibility,” available at http://www.whitehouse.gov/the-press-office/2011/02/28/presidential-memorandum-administrative-flexibility. 52 We note that EPA’s rules setting air quality standards for ozone and particulate matter may ultimately lead to expenditures by State, local, or tribal governments of $100 million or more. However, Title II of the Unfunded Mandates Reform Act provides that agency statements of compliance with Section 202 must be conducted “unless otherwise prohibited by law.” 2 U.S.C. § 1532 (a). The conference report to this legislation indicates that this language means that the section “does not require the preparation of any estimate or analysis if the agency is prohibited by law from considering the estimate or analysis in adopting the rule.” H.R. Conf. Rep. No. 104-76 at 39 (1995). EPA has stated, and the courts have affirmed, that under the Clean Air Act, the criteria air pollutant ambient air quality standards are health-based and EPA is not to consider costs in setting the standards. 53 While causal links have not been definitively established, a growing body of evidence has found associations between exposure to DBPs and various forms of cancer, as well as several adverse reproductive endpoints (e.g., spontaneous abortion).
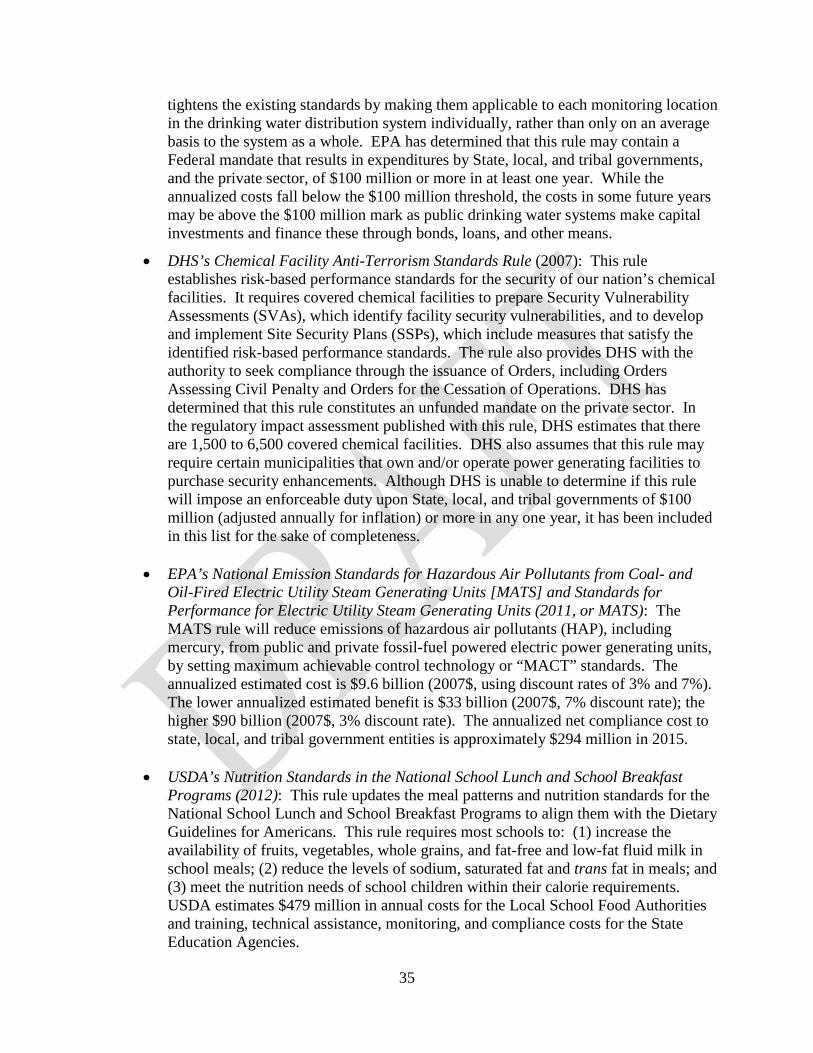
35
tightens the existing standards by making them applicable to each monitoring location in the drinking water distribution system individually, rather than only on an average basis to the system as a whole. EPA has determined that this rule may contain a Federal mandate that results in expenditures by State, local, and tribal governments, and the private sector, of $100 million or more in at least one year. While the annualized costs fall below the $100 million threshold, the costs in some future years may be above the $100 million mark as public drinking water systems make capital investments and finance these through bonds, loans, and other means.
• DHS’s Chemical Facility Anti-Terrorism Standards Rule (2007): This rule establishes risk-based performance standards for the security of our nation’s chemical facilities. It requires covered chemical facilities to prepare Security Vulnerability Assessments (SVAs), which identify facility security vulnerabilities, and to develop and implement Site Security Plans (SSPs), which include measures that satisfy the identified risk-based performance standards. The rule also provides DHS with the authority to seek compliance through the issuance of Orders, including Orders Assessing Civil Penalty and Orders for the Cessation of Operations. DHS has determined that this rule constitutes an unfunded mandate on the private sector. In the regulatory impact assessment published with this rule, DHS estimates that there are 1,500 to 6,500 covered chemical facilities. DHS also assumes that this rule may require certain municipalities that own and/or operate power generating facilities to purchase security enhancements. Although DHS is unable to determine if this rule will impose an enforceable duty upon State, local, and tribal governments of $100 million (adjusted annually for inflation) or more in any one year, it has been included in this list for the sake of completeness.
• EPA’s National Emission Standards for Hazardous Air Pollutants from Coal- and Oil-Fired Electric Utility Steam Generating Units [MATS] and Standards for Performance for Electric Utility Steam Generating Units (2011, or MATS): The MATS rule will reduce emissions of hazardous air pollutants (HAP), including mercury, from public and private fossil-fuel powered electric power generating units, by setting maximum achievable control technology or “MACT” standards. The annualized estimated cost is $9.6 billion (2007$, using discount rates of 3% and 7%). The lower annualized estimated benefit is $33 billion (2007$, 7% discount rate); the higher $90 billion (2007$, 3% discount rate). The annualized net compliance cost to state, local, and tribal government entities is approximately $294 million in 2015.
• USDA’s Nutrition Standards in the National School Lunch and School Breakfast Programs (2012): This rule updates the meal patterns and nutrition standards for the National School Lunch and School Breakfast Programs to align them with the Dietary Guidelines for Americans. This rule requires most schools to: (1) increase the availability of fruits, vegetables, whole grains, and fat-free and low-fat fluid milk in school meals; (2) reduce the levels of sodium, saturated fat and trans fat in meals; and (3) meet the nutrition needs of school children within their calorie requirements. USDA estimates $479 million in annual costs for the Local School Food Authorities and training, technical assistance, monitoring, and compliance costs for the State Education Agencies.
36
• CMS’s Patient Protection and Affordable Care Act; Benefit and Payment Parameters
for 2014 (issued FY2013), for 2015 (issued FY2014), and for 2016 (issued FY2015): These final rules provide detail and parameters related to various aspect of Affordable Care Act implementation, including: the risk adjustment, reinsurance, and risk corridors programs; cost-sharing reductions; user fees for Federally-facilitated Exchanges; advance payments of the premium tax credit; the Federally-facilitated Small Business Health Option Program; and the medical loss ratio program. Although HHS has not been able to quantify the user fees that will be associated with these rules, the combined administrative cost and user fee impact may be high enough to constitute a State, local, or Tribal government mandate under UMRA.
Although these rules were the only ones over the past ten-year period to require public sector mandates under UMRA on State, local, and tribal governments exceeding $100 million (adjusted for inflation), they were not the only rules with impacts on other levels of governments. For example, many rules had monetary impacts lower than the $100 million threshold, and agencies are also required to consider the federalism implications of rulemakings under Executive Order 13132.
B. Impact on Small Business
The Regulatory Right-to-Know Act calls for an analysis of the effects of regulations on small business. Consistent with that direction, Executive Order 12866 recognizes the need to consider such effects and to minimize costs on small business. That Executive Order, reaffirmed by Executive Order 13563, “Improving Regulation and Regulatory Review,” directs agencies to tailor their regulations by business size in order to impose the least burden on society, consistent with the achievement of regulatory objectives. It also calls for the development of short, or more simplified, forms and other efficient regulatory approaches for small businesses and other entities.
In the findings section of SBREFA, Congress states that “small businesses bear a disproportionate share of regulatory costs and burdens.”54 When relevant regulations are issued, each firm must determine whether a regulation applies, how to comply, and whether it is in compliance. For small business, making that determination may impose significant costs. As firms increase in size, fixed costs of regulatory compliance are spread over a larger revenue and employee base, which often results in lower regulatory costs per unit of output.
In recognition of these principles, many statutes and regulations explicitly attempt to reduce burdens on small businesses, in part to promote economic growth and in part to mitigate against unnecessary or unjustified costs and adverse effects on employment and wages. For example, agencies frequently tailor regulations to limit the costs imposed on small business and to offer regulatory relief, including explicit exemptions for small businesses and slower phase-in schedules, allowing adequate periods of transition. Moreover, the Regulatory Flexibility Act (RFA) requires agencies to assess the effect of regulations on small businesses.55 Generally, under the RFA, whenever an agency concludes that a particular regulation, if promulgated, will 54 Section 202(2) of Pub. L. No. 104-121. 55 5 U.S.C. §§ 601-612.
37
have a significant economic effect on a substantial number of small entities and the agency is or was required by law to publish a notice of proposed rulemaking, the agency must prepare both an initial and final regulatory flexibility analysis. This analysis must include (among other things) an assessment of the likely burden of the rule on small entities and an analysis of alternatives that may afford relief to small entities while achieving the regulatory goals. OMB works closely with agencies to promote compliance with RFA and to tailor regulations to reduce unjustified costs and to create appropriate flexibility.
On January 18, 2011, President Obama issued a memorandum to emphasize the requirements of the RFA and to direct agencies to offer an explanation of any failure to provide flexibility to small businesses in proposed or final rules. Such flexibility may include delayed compliance dates, simplified reporting requirements, and partial or total exemptions. The President’s memorandum emphasizes the relationship between small and new businesses and economic growth and job creation; he directed agencies to ensure, to the extent feasible and consistent with law, that regulatory initiatives contain flexibility for small businesses.56
The empirical evidence of the effects of regulation on small business remains less than clear. We have cited in previous Reports research by the Small Business Administration (SBA) Office of Advocacy, suggesting that small entities disproportionately shoulder regulatory and paperwork burdens. The Office of Advocacy has sponsored at least four studies that estimate the burden of regulation on small businesses.57 A study sponsored by SBA (and cited in our 2010 Report), by Dean, et al., concludes that environmental regulations act as barriers to entry for small firms.58
Becker offers a more complex view, focusing on the effect of air pollution regulation on small business.59 He finds that although “progressively larger facilities had progressively higher unit abatement costs, ceteris paribus,”60 the relationship between firm size and pollution abatement costs varies depending on the regulated pollutant. For troposphere ozone, the regulatory burden seems to fall substantially on the smallest three quartiles of plants. For SOx, the relationship between regulatory burden and the firm size seems to be U-shaped. For total suspended particles, new multi-unit emitting plants in the smallest size class had $265 more capital expenditure (per $10,000 of value added) in non-attainment counties than similar plants in attainment counties, while “those in the larger size classes had an additional $511-687 in expenditure…though the rise was not monotonic.”61
However, more recent work by Becker, Pasurka and Shadbegian, which focuses on the
relationship between establishment size and spending on pollution abatement, finds that “spending on pollution abatement operating costs per unit of output increases with establishment
56 Barack Obama, Memorandum for the Heads of Executive Departments and Agencies, “Presidential Memoranda – Regulatory Flexibility, Small Business, and Job Creation,” available at http://www.whitehouse.gov/the-press-office/2011/01/18/presidential-memoranda-regulatory-flexibility-small-business-and-job-cre. 57 See Hopkins (1995); Dean, et al. (2000); Crain and Hopkins (2001); Crain (2005). 58 Dean, et al. (2000). 59 Becker (2005). 60 Id., p. 163. 61 Id., p. 165.

38
size.”62 In particular, they find that the very largest establishments (with 1000+ employees) spend between $1.92 and $5.61 more on pollution abatement operating costs per $1000 of output than the establishments with 1-19 employees.
The evidence in the literature, while suggestive, remains preliminary, inconclusive, and
mixed. OMB continues to investigate the evolving literature on the relevant questions in order to obtain a more precise picture. It is clear, however, that some regulations have significant adverse effects on small business and that it is appropriate to take steps to create flexibility in the event that those adverse effects cannot be justified by commensurate benefits. As the President’s 2011 memorandum directs, agencies should specifically explain any refusal to take such steps, especially in light of the importance of small businesses and startups for economic growth and job creation.
C. Impact on Wages and Employment
Regulations of many different markets and areas of activity can ultimately affect labor markets, producing changes in wages and employment levels. Some regulations can have adverse effects on one or both dimensions, other regulations might produce benefits, and some regulations may contribute to wage and/or employment losses in one sector but gains in other sectors. The relevant effects can be quite complex, since in general equilibrium, regulation in one area can have ripple effects across many markets, making it difficult to produce aggregate figures.
Executive Order 13563 states that our “regulatory system must protect public health, welfare, safety, and our environment while promoting economic growth, innovation, competitiveness, and job creation” (emphasis added). Furthermore, Executive Order 12866 states that regulatory impact analyses should include assessments of regulations’ effects on the functioning of the economy and on employment. OMB continues to believe that it is important for regulatory agencies to attempt, to the extent feasible, to consider the employment effects (whether negative or positive) of their regulations. However, when assessing the effects of regulations on employment and applying those assessments to policy decisions, there are several potential pitfalls:
• Expecting a precise, measurable impact from most individual regulations. Only a small fraction of individual regulations or agency actions will have a large enough effect to allow for measurement of changes in gross domestic product (GDP) or national employment. It is the cumulative sum over time of many small changes that is much more likely to be significant in these areas.
• Ignoring long-run or indirect impacts. Many regulatory actions have direct, short-run effects that are mitigated by long-run market adjustments. For example, businesses sometimes shut down as a result of a regulation; because jobs are temporarily lost, a short-run, industry-specific job-counting model would give the impression that regulation reduces employment. Alternatively, firms may need to hire new workers to perform activities necessary for coming into compliance with a regulation; in this case, the same
62 Becker, Pasurka and Shadbegian (2013), p. 535.

39
job-counting model would give an impression that regulation increases employment. In addition, firms that produce goods or services that are substitutes for the outputs from regulated firms may increase employment to an extent that significantly offsets employment losses for regulated firms. Apparent reductions or increases in employment often will, in the medium or long run, turn out to be shifts in employment between economic sectors.63
• Ignoring the importance of timing. With employment-related policy goals, timing is often essential; spurring job creation is much more desirable during an economic downturn than during expansionary portions of the business cycle. Regulatory development, meanwhile, typically involves years of assessing evidence on the need for and effect of regulation; also, once issued, many regulations will remain effective indefinitely. Given their development and effectiveness timeframes, very few regulations that were originally motivated by policy goals unrelated to employment will be well-suited to targeting job creation when it is most needed.64
We discuss below the effect of labor market regulations, environmental regulations, and economic regulations on wages and employment. OMB continues to investigate the possibility that certain kinds of regulations can have adverse effects on job creation in particular, and is interested both in empirical work and in taking steps to reduce or eliminate such adverse effects. 1. Labor market regulations.
There are many different types of labor market regulations, aiming to address certain market failures, e.g. information asymmetries and externalities, and equity concerns. Perhaps the most obvious types of labor market regulation are direct price controls, such as minimum wage laws and regulations.
Other types of labor market regulations mandate employer-provided benefits, rules that protect worker health and safety, anti-discrimination regulations, and regulations governing the ability of workers and firms to bargain collectively; in general, U.S. competition law prohibits collusion among employers and allows collective bargaining by workers. Here we outline the theory and evidence on the effect of labor market regulations on wages and employment levels.
Labor markets are driven by many dynamic, simultaneous economic forces, therefore the employment and wage effects of any single regulation are quite difficult to disentangle, even for those regulations directly focused on labor markets. Economic theory provides a framework for analyzing the potential impacts of labor market regulation on employment and wages. In the basic theory framework, labor markets are assumed to function perfectly: labor supply and demand are equal at the market wage, without externalities, frictions or adjustment costs, or missing or imperfect information. Summers (1989) presents a standard theoretic approach for evaluating the economics of mandated employer benefits. This standard supply and demand model may be extended to address more complicated features of labor markets, such as, in the
63 Examples may be seen in a variety of areas, including tobacco (Warner et al., 1996), water resource investment (Haveman and Krutilla, 1967) and many others. 64 See Ferris and McGartland (2013) for further discussion of the difficulty of projecting the timing of effects.

40
context of minimum wage policies, approaches that consider incomplete coverage of the minimum wage, impacts on skilled and relatively less-skilled workers, monopsony, job search models, efficiency wages, and informational asymmetries.65 The standard theoretic approach, using labor supply, labor demand, and wages, is foundational for evaluating impacts, but additional consideration of theory is needed. Evidence in the labor economics literature indicates the importance of considering different theoretic approaches and extensions, specifically tailored to the policy analyzed. In some cases, such as minimum wage policies, alternative or more-detailed theoretic approaches can predict different employment impacts than the basic approach. For example, the basic labor supply and labor demand model predicts a decline in employment if the minimum wage is set above the market-clearing wage. However, other theoretic approaches predict, as long as the minimum wage is not set too high, that the policy may raise both wages and employment levels for low-wage workers. (Card and Krueger (1995), Brown (1999)). Utilizing different theoretic and methodological approaches, the empirical literature on minimum wages has found evidence of employment declines, no effect on employment, or even positive employment growth (Neumark and Wascher (2008), Card and Krueger (2016)). The past twenty years of empirical research on minimum wages finds that positive employment effects are about equally as likely as negative effects, with the “typical estimate very close to zero.” (Card and Krueger (2016) p. xvi).
Summers (1989) provides a standard price-theoretic treatment of mandated benefit regulations.
To be concrete, consider a workplace safety regulation. Such a regulation will shift
the labor supply curve down by the amount that workers value the increase in safety, so that workers are willing to supply more labor for a given wage than in the absence of the regulation. Because it imposes compliance costs on employers, the regulation also shifts the labor demand curve down by the amount of the compliance cost. If workers value the mandated benefit at more than it costs employers to provide the benefit, then both the employment level and monetary compensation plus the value of non-monetary benefits such as safety will rise. Under standard assumptions, employers have incentives to provide such benefits, but various market failures may result in suboptimal provision of such benefits. Conversely, if workers value the mandated benefit at less than its cost, then the employment level and net wages will fall. This simple model assumes that wages can indeed perfectly adjust downwards in response to the mandated benefits—but if wages are sticky (more likely to be the case in the short-run), then the regulation could result in a decrease in employment levels and an increase in monetary compensation plus the value of non-monetary benefits.
In the case of group-specific mandated benefits, which are targeted at identifiable groups of workers in the population, the theoretical analysis is more complicated. Jolls (2000), DeLiere (2000) and Acemoglu and Angrist (2001) suggest that the interaction of group-specific mandated benefits regulation with anti-discrimination law determines its consequences for labor markets; the net theoretic effects on employment are ambiguous.
Specifically, regulations under the
Americans with Disabilities Act (ADA) require that employers accommodate the special needs of disabled employees—a group-specific mandated benefit. In addition the law also forbids employers from discriminating against disabled workers in hiring and compensation decisions. 65 See Brown (1999) for a description of theory models used to evaluate employment impacts of the minimum wage, and see Giuliano (2013) for a brief, updated discussion.
41
To the extent that it is easier to enforce the prohibition of discrimination in wage setting than in hiring decisions, Jolls argues that the law will result in no reduction in wages for disabled workers but a reduction in their employment level, because employers will prefer to hire (cheaper) non-disabled workers. DeLeire (2000) and Acemoglu and Angrist (2001) find, empirically, that employment rates for disabled workers declined after the ADA, while wages were unchanged.
In contrast, group-specific mandates that target women, such as maternity leave mandates, are more likely to have an effect on wages because women are disproportionately represented in a few occupations, and hence their wages can more easily be adjusted downward without triggering anti-discrimination enforcement. In the standard supply and demand framework, because wages adjust down, such mandates are less likely to have a negative effect on employment. Gruber (1994) finds that regulations that require employers to provide comprehensive coverage for childbirth in health insurance plans result in a decrease in women’s wages but have no effect on their employment levels.
Studies examining the effect of the Family
Medical Leave Act in the U.S., however, find little effect on either relative employment levels or wages of women, perhaps because the mandated leave is short and unpaid, and many employers provided maternity leave prior to the law.66
Studies evaluating California’s paid family leave program find effects for employed mothers after child birth: increased hours worked and earnings, as well as increased employment probabilities during the child’s first year.67 OMB continues to investigate the growing literature on these topics. The references here are meant to be illustrative rather than exhaustive.
In addition to the complications of conceptual analysis, regulatory agencies assessing labor market impacts as part of their policy-making process face additional challenges, often not considered in the economic literature. Most available empirical studies rely on historical data to estimate impacts of policies that have already been implemented. Few conduct forward-looking analysis considering potential impacts of policies under development. An example of this difficulty of prospectively analyzing labor market impacts of regulations is a recent research effort investigating labor market impacts of the Affordable Care Act.68 A number of researchers used analysis of past state-level expansions of health insurance coverage to estimate potential impacts of the ACA. A striking variance was noted in terms of the projected employment effects, both across studies and within studies, by demographic groups.
2. Environmental regulation.
New or more stringent environmental regulations may raise production costs thereby reducing production which in turn leads to lower employment (“output effect”). However, it is also conceivable that the new regulation will require more labor input – this will depend on the extent to which the required abatement activities and labor are substitutes or compliments (“abatement activity” effect).69 Thus, the effects of environmental regulation on the labor
66 Waldfogel (1999) and Baum (2003). Ruhm (1998) examines parental leave mandates in Europe and finds that they are associated with increases in women’s relative employment levels and reductions in their relative wages. 67 Rossin-Slater, Ruhm and Waldfogel (2013); Baum and Ruhm (2013). 68 Aaronson and Lubotsky (2014). 69 See Berman and Bui (2001).

42
market can be difficult to assess. Isolating the effect of environmental regulation on employment is further complicated by the fact that changes in other economic conditions (e.g. recessions, import competition, tax policy) also affect employment over time and across sectors and therefore must be taken into consideration. Moreover, estimating changes in net employment is complicated by the fact that they are comprised of changes in employment in different sectors and while some changes represent potential decreases in employment (i.e. the directly regulated sector and up and down stream sectors70) some of these changes represent increases in employment (e.g. pollution abatement sector71). Therefore, the underlying questions regarding the effect of environmental regulations on labor markets requires careful and continuing conceptual analysis and empirical study, and OMB is following new developments in both areas. In this section we summarize some of the leading articles that are often cited in the academic literature.
Pollution abatement activities can be divided into two basic categories: end-of-pipe (EOP) controls, which remove pollutants from the discharge stream after they are produced (e.g. electrostatic precipitators removing particulates or a waste water treatment plant removing total suspended solids), and change-in-production-process (CIPP) techniques which reduce the amount of waste produced during production (e.g. switching from high to low sulfur coal or increasing the efficiency of boilers). EOP controls will require labor to install them and to operate them, so in this case labor and abatement activities are likely to be complements. On the other hand, CIPP techniques may reduce the amount of labor to operate the plant due to an increase in the capital-labor ratio caused by technological change. Thus, the abatement activity effect is ambiguous and therefore standard microeconomic analysis cannot predict a priori whether or not environmental regulations have a negative effect on labor demand in the directly regulated sector. Determining the sign and magnitude of the effect of environmental regulation on labor demand in the directly regulated sector will require empirical studies.
To estimate the net employment impacts of an environmental regulation requires the additional step of estimating the employment impacts of regulation in the up and down stream sectors as well as the pollution abatement sector. In many instances environmental regulations generate increased demand by regulated facilities for pollution control equipment and services to bring them into compliance with the regulation. In turn this higher demand could increase employment in the pollution abatement sector, especially in time of high unemployment.72 On the other hand, while increased employment in the pollution abatement sector is positive for that industry, it represents labor costs to the directly regulated sector, potentially leading to lower production and associated employment, so determining the net effect is important.
There is a broad empirical literature analyzing the effect of environmental regulations on various economic outcomes including productivity, investment, competitiveness as well as 70 Upstream sectors supply inputs to the regulated sector (e.g., coal mines supplying coal to power plants) and downstream sectors purchase output from the regulated sector (e.g., manufacturing plants purchasing electricity from power plants). 71 In 2008 the pollution abatement sector, according to the U.S. Department of Commerce (2010), consisted of 119,000 environmental technology (ET) firms which produced roughly $300 billion in domestic revenues (approximately 2% of GDP), and produced exports worth $43.8 billion (roughly 2% of total export). 72 Schmalansee and Stavins (2011).

43
environmental performance. On the other hand, there are only a few papers that examine the impact of environmental regulation on employment, but this literature has been growing. Studies that examine the effect of environmental regulation on employment include Berman and Bui73, Greenstone74, Walker75, Gray and Shadbegian76, Gray, et al.77 and Ferris, Shadbegian and Wolverton78.79
Berman and Bui,80 using plant-level data, estimate the impact of some of the most stringent air quality regulations in the United States enacted by the South Coast Air Quality Management District around Los Angeles from 1979 to 1992. They find that even though regulations impose large costs on plants they only have a very small insignificant effect on employment. According to Berman and Bui, the likely explanation for the small effects is that the regulations disproportionately affect capital-intensive plants with relatively low levels of employment, which sold output mostly to local markets where their competition faced the same level of regulation. Furthermore, they surmised that pollution abatement inputs and employment were complements.
Gray, et al.81 and Ferris, Shadbegian and Wolverton82 both use plant-level data to
examine the effect of environmental regulations on employment as well. More specifically, Gray, et al. examine the effect of the 1998 Cluster Rule, EPA’s first integrated, multi-media (air and water) regulation, on employment at pulp and paper mills. They found that plants that needed to comply with both the air and water regulations experienced relatively small (3%-7%), but not always statistically significant, decreases in employment. These decreases are concentrated in plants that had to comply with both the air and water rules. Ferris, Shadbegian and Wolverton estimate the impact of the Phase I of the Title IV SO2 Trading Program on employment at fossil-fired power plants. Using an estimation technique that combines propensity score matching with a difference-in-difference estimator, they find little evidence that fossil-fuel fired power plants experienced significant declines in employment under the Phase I Program compared to non-Phase I power plants. This finding is robust to modeling compliance decisions at the plant- or owning utility-level. Gray and Shadbegian83 use 4-digit SIC industry level data to examine the impact of environmental regulation, proxied by the percent of output spent on pollution abatement operating costs, on employment in U.S. manufacturing (1973-1994). They find that in most cases more stringent regulations have a statistically significant yet quantitatively small negative effect on employment, with slightly larger effects in the most highly regulated industries.
73 Berman and Bui (2001). 74 Greenstone (2002). 75 Walker (2011). 76 Gray and Shadbegian (2013). 77 Gray, et al (2014). 78 Ferris, Shadbegian, and Wolverton (2014). 79 All these studies examine the impact of regulations in the directly regulated sector and do not estimate employment effects in either the up or down stream industries or the pollution abatement sector. 80 Berman and Bui (2001). 81 Gray, et al (2014). 82 Ferris, Shadbegian and Wolverton (2014). 83 Gray and Shadbegian (2013).

44
Greenstone84 examines the difference in employment growth between counties that are
designated as being in nonattainment for one or more of the criteria pollutants (particulate matter, sulfur dioxide, ozone and carbon monoxide) and counties in attainment. Regulators impose more stringent regulations on plants in non-attainment areas relative to attainment areas to help bring those areas into compliance. Greenstone finds that these more stringent regulations cause a loss of approximately 590,000 jobs in non-attainment areas relative to attainment areas between 1972 and 1987. Walker finds that employment at plants in newly designated non-attainment areas due to the 1990 Clean Air Act Amendments is 15% lower relative to plants in attainment areas. At first glance, the employment effects in these studies sound large, however one important point to note about these studies is that their findings do not mean that there is lower aggregate employment due to more stringent environmental regulation. The findings only imply that the relative growth rate of employment in some sectors differs between attainment and non-attainment areas. In other words, the results of Greenstone and Walker may be due to their lack of control for geographic reallocation of economic activity from non-attainment to attainment areas. As a matter of fact, List et al. find that new pollution-intensive plants are less likely to open in non-attainment areas implying that this geographic relocation is most likely occurring.85
Environmental regulations may also have a less visible effect on employment, by lowering investment in the U.S. by multinational corporations. Using 17-year panel data, Keller and Levinson find the stringency of environmental regulation (expressed in pollution abatement costs) has “small deterrent effects” on states competing for foreign direct investment.86 Xing and Kolstad find “using instruments for the unobserved variables, the statistical results show that the laxity of environmental regulations in a host country is a significant determinant of F[oreign] D[irect] I[nvestment] from the US for heavily polluting industries and is insignificant for less polluting industries.”87
A recent study by Hanna measured the response of US-based multinationals foreign direct investment decisions to the Clean Air Act Amendments using a panel of firm-level data over the period 1966-1999.88 Consistent with the theory that regulation causes firms to substitute foreign for domestic production, the authors find that in the environmental area, domestic regulation has led US-based multinational companies “to increase their foreign assets in polluting industries by 5.3 percent and their foreign output by 9 percent.”89 The authors also find that these results are more robust for firms that manufactured within an industry for which imports had historically accounted for a large percentage of US consumption (see also Greenstone discussed above). Like Hanna, Brunnermeier and Levinson, using panel data, also find “statistically significant pollution haven effects of reasonable magnitude.”90 Levinson and Taylor’s results in examining trade flows and environmental regulation are consistent with these 84 Greenstone (2002). 85 List, et al. (2003). 86 Keller and Levinson (2002), p. 691. 87 Xing and Kolstad (2002), p. 1. 88 Hanna (2010). 89 Hanna (2010), p. 160. 90 Brunnermeier and Levinson (2004), p. 6.
45
other studies.91 However, Levinson finds in a recent study that air emissions have been reduced from US manufacturers over the period 1990-2008 without movement of these manufacturers abroad or from reduced production of US manufactured goods.92
Coglianese, Finkel and Carrigan93 assemble works examining the methods to examine
employment effects, evidence thus far on the effects of regulation on employment, and further policy recommendations. Included in this volume are papers by Aldy and Pizer94 and Fӓre, Grosskopf, Pasurka, Jr., and Shadbegian95 on the evidence of the effects of regulation on employment, Ferris and McGartland96 and Masur and Posner97 on further research and policy recommendations. Aldy and Pizer examine the effects of regulating the electricity sector on the gross employment and competitiveness of 400 manufacturing industries using data from 1986 through 1994. They find no statistically significant relationship between the electricity price and gross employment for low energy intensity manufacturing industries. For industries that are more energy intensive, the gross employment elasticity with respect to electric prices range from -0.2 to -0.3. They also find the employment elasticity due to competitiveness effect ranges between -0.05 and -0.1 for the upper 20% of energy intensive industries. Fӓre, Grosskopf, Pasurka, Jr., and Shadbegian demonstrate that less labor is required to produce good and bad outputs under a tradable permit system than a command-and-control system. Masur and Posner98 respond to comments and criticisms of Masur and Posner99, and continue to recommend that regulatory agencies incorporate unemployment costs into their benefit-cost analysis. Ferris and McGartland call for conceptual research on how to incorporate employment assessment into benefit-cost framework and empirical research based on the conceptual research.
In this context, the evidence is both suggestive and mixed. In their review of the
literature on the effect of environmental regulation on the manufacturing sector, Jaffe et al. find that “although the long-run social costs of environmental regulation may be significant, including adverse effects on productivity, studies attempting to measure the effect of environmental regulation on net exports, overall trade flows, and plant-location decisions have produced estimates that are either small, statistically insignificant, or not robust to tests of model specification.”100
3. Economic regulation.
Rate regulations and restrictions on entry in product markets—commonly referred to as “economic regulation”—can have important effects on labor markets. As emphasized by
91 Levinson and Taylor (2008). 92 Levinson (2008). 93 Coglianese, Finkel, and Carrigan (2013). 94 Aldy and Pizer (2013). 95 Fӓre, Grosskopf, Pasurka, Jr., and Shadbegian, (2013). 96 Ferris and McGartland (2013). 97 Masur and Pozner (2013). 98 Masur and Posner (2013). 99 Masur and Posner (2012). 100 Jaffe et al. (1995), p. 157-158.

46
Peoples,101 restrictions on entry into an industry can make unionization of the industry easier because as a result the industry is dominated by a few large firms, which lowers the cost of organizing workers. The resulting high unionization rates give unions in the regulated industries substantial bargaining power, and as a result wages in regulated industries, which historically include trucking, electricity, and airlines, are higher. Moreover, rate regulations that allow firms in these industries to pass costs on to customers may make it easier for unions to bargain for relatively high wages.
To the extent that economic regulation also results in higher prices in the product market, consumers, including workers, will of course have to pay those prices. Blanchard and Giavazzi show in theoretical terms that the increased markups in the product market caused by widespread economic regulation can result in both lower real wages of workers, measured in terms of purchasing power, and lower employment levels.102 The theoretical negative effect of entry regulation on employment was supported empirically by Bertrand and Kramarz,103 who examine entry restrictions in the French retail industry and find that they have reduced employment growth in France. Using individual worker information from the Current Population Survey (CPS) files from 1973 through 1988, Peoples and Saunders show that deregulation of the trucking industry led to significant real wage reduction for white drivers.104
D. Impact on Economic Growth
Measuring the effects of regulation on economic growth is a complex task. The category of “regulation” is of course very large. Criminal law, property law, and contract law are not always characterized as “regulation,” but they do have regulatory functions, and if well-designed, they can promote and even be indispensable to economic growth. A system of freedom of private property and freedom of contract promotes such growth, and it cannot exist without regulation (including the form of regulation that occurs through the common law). Some forms of national regulation may have a positive effect on growth, perhaps by promoting stable and efficient operation of financial markets, by improving educational outcomes, by promoting innovation, or by upgrading the operation of the transportation system. An absence of regulation, or poorly designed deregulatory initiatives, may have significant adverse effects on growth – if, for example, they undermine the stability and efficiency of financial markets.
Excessive and unnecessary regulations, on the other hand, can place undue burdens on companies, consumers, and workers, and may cause growth and overall productivity to slow. While the evidence remains less than entirely clear, some evidence suggests that domestic environmental regulation has led some U.S. firms to invest in other nations, and in that sense, such regulation may have an adverse effect on domestic growth.105 At the same time, the direct impacts of particular regulations, or categories of regulations, on the overall economy may be difficult to establish because causal chains are uncertain and because it is hard to control for
101 Peoples (1998). 102 Blanchard and Giavazzi (2003). 103 Bertrand and Kramarz (2002). 104 Peoples and Saunders (1993). 105 See Brunnermeier and Levinson (2004), Levinson and Taylor (2008).
47
relevant variables.
If they are not carefully designed, regulations can impose significant costs on businesses, potentially dampening economic competition and capital investment. Djankov et al.106 find that increased regulations on entry into markets—such as licensing and fees—create higher costs of entry and thus adversely affect economic outcomes.107 By contrast, van Stel et al. find that entry regulations actually have little impact on entrepreneurship, but that regulations creating greater labor rigidity have a discernible negative impact.108
Relatively few studies attempt to measure the economic impact of regulations in the aggregate; the literature focuses instead on particular regulatory arenas.109 The literature examining the effects of environmental regulations in particular is extensive. Here are a few examples:110
• Jaffe and Palmer111 find that increases in compliance costs generated by environmental regulations lead to a lagged effect of increases in research and development expenditures, as measured by patents of new environmental technologies. Other studies provide similar findings. 112 These studies suggest that there may be positive economic effects related to technological innovation in the years following increased environmental regulatory compliance costs. As Jaffe and Palmer argue, “in the aggregate, the disincentives for R&D attributed to a command-and-control approach to environmental regulation may be overcome by the high returns that regulation creates for new pollution-control technology.”113 These results, however, are noted to be sensitive to the definitions of the time lag and difficulties in specifying research and development models, coding patent types, and linking research and development to overall economic growth.
106 Djankov, et al. (2002). 107 Djankov et al. (2002). 108 van Stel et al. (2007). They also find that regulations improving access to credit have a positive impact on entrepreneurship. 109 One of the few such studies is an analysis by Hahn and Hird (1991), which estimates the net costs of regulations on the economy to be $46 billion, with aggregate annual transfer payments between $172.1 and $209.5 billion. But the authors note that their estimates have a wide range of uncertainty due to difficulties in estimation methods and available data. Further, this study is likely to be outdated due to major policy and economic developments in the years since its publication. Dawson and Seater (2013) estimated the effects of regulation by examining the effects on growth of output and total factor productivity (TFP). They conclude that the regulation has substantial and negative effects on output and TFP. EPA (2011) conducted an analysis to examine the macroeconomic effects of the Clean Air Act Amendments using a computable general equilibrium model. They find that output of goods and services decrease as a result of regulations associated with the Clean Air Act Amendments but these decreases are offset by increases in welfare resulting from reductions in medical expenditures and other welfare improvements associated with reduced air pollution-related morbidity and mortality. 110 Berman and Bui (2001a) provide a helpful summary of some of this literature. It should be recalled that many environmental regulations affect provision of non-market goods that are not explicitly reflected in standard measures of economic activity. Thus, in addition to the direct economic costs imposed by environmental regulations, these same regulations have social welfare and other non-market impacts that are not captured in these studies. 111 Jaffe and Palmer (1997). 112 See Lanoie et al. (2008). 113 Jaffe & Palmer (1997), at 618.
48
• Gray and Shadbegian examine the investment activity of paper mills from 1979 to 1990,114 and they find that “plants with relatively high pollution abatement capital expenditures over the period invest less in productive capital. The reduction in productive investment is greater than the increase in abatement investment, leading to lower total investment at high abatement cost plants. The magnitude of this impact is quite large, suggesting that a dollar of pollution abatement investment reduces productive investment by $1.88 at that plant. This seems to reflect both environmental investment crowding out productive investment within a plant and firms shifting investment towards plants facing less stringent abatement requirements. Estimates placing less weight on within-firm reallocation of investment indicate approximate dollar-for-dollar ($0.99) crowding out of productive investment.”115
• Becker and Henderson116 find that in response to ground-level ozone regulation, in polluting industries “birth [of plants] fall dramatically in nonattainment counties, compared to attainment counties…This shift in birth patterns induces a reallocation of stocks of plants toward attainment areas. Depending on the interpretation of reduced-form coefficients, net present value for a typical new plant in a nonattainment area could fall by 13-22 percent.”117
• Berman and Bui find that during a period of aggressive environmental regulation, productivity increased among the petroleum refineries located in the Los Angeles from 1987 to 1992, suggesting that “[a]batement costs may severely overstate the true cost of environmental regulation”118 and that “abatement associated with the SCAQMD regulations was productivity enhancing.”119
• Greenstone120 finds that “in the first 15 years after the [Clean Air Act Amendments] became law (1972-1987, nonattainment counties (relative to attainment ones) lost approximately $37 billion in capital stock and $75 billion (1987 dollars) of output in polluting industries)” through reduced growth of pollution intensive industries.121 However, Greenstone notes that these impacts remain modest in comparison to the size of the national manufacturing sector. Further, these results indicate statistically significant economic costs associated with carbon monoxide regulations but not with ozone or sulfur dioxide regulations.
• List, et al., examined the effects of air quality regulation stringency and location decisions of new plants in New York State from 1980 to 1990, and found that regulatory stringency and the decision to locate is negatively correlated, and the current parametric estimates of this negative correlation may be understated.122
114 Gray & Shadbegian (1998). 115 Id, at 254-255. 116 Becker & Henderson (2000). 117 Id., at 414-415. 118 Id, p. 509. 119 Id, p. 499. SCAQMD is South Coast Air Quality Management District. 120 Greenstone (2002). 121 Id, at 1213. 122 List, et al. (2003).

49
• As noted above, Hanna123 finds that domestic environmental regulation has had an effect in increasing the outbound foreign direct investment of U.S.-based multinational firms. The results include an increase in foreign investments in polluting industries by 5.3 percent and in foreign output by 9 percent; the results are concentrated in manufacturing.
• Greenstone, List, and Syverson124 analyze plant-level production data to estimate the effects of environmental regulations on manufacturing plants’ total factor productivity (TFP) levels. Using the Clean Air Act Amendments’ division of counties into pollutant-specific nonattainment and attainment categories, they find that among surviving polluting plants, a nonattainment designation is associated with a roughly 2.6 percent decline in TFP.
Outside of the context of environmental regulation, a number of studies find that some regulations have promoted economic growth and otherwise had desirable economic effects. For example, Carpenter125 finds that certain approaches to entry regulation – such as the discretionary approval regimes used by the Food and Drug Administration – can actually increase economic activity by establishing credible expectations of fairness and product safety.126 Similarly, Greenstone et al.127 find that disclosure rules in the securities industry can reduce the adverse effects of informational asymmetries and increase market confidence. Their study finds that the 1964 Securities Act Amendments generated $3-6 billion of asset value for shareholders as a result of increased investment activity. According to their evidence, higher levels of investor protection and disclosure requirements are associated with the higher valuation of equities.128
Executive Order 13563 refers in particular to the importance of flexible approaches, stating that with relevant qualifications, “each agency shall identify and consider regulatory approaches that reduce burdens and that maintain flexibility and freedom of choice for the public.” In some cases, carefully chosen forms of regulation, increasing flexibility, may yield the same social welfare benefits as existing regulatory approaches while imposing significantly lower costs. In other cases, alternative regulatory approaches may actually improve market functioning, increase economic activity, and promote economic growth.129
OMB continues to investigate the underlying question of how regulations impact economic growth; no clear consensus has emerged. Further work of the sort outlined here might ultimately make it possible to connect regulatory initiatives to changes in GDP and also to changes in well-being under various measures.
123 Hanna (2010). 124 Greenstone, List and Syverson (2011). 125 Carpenter (2009). 126 Carpenter (2009). For more historical and formal modeling approaches to this same argument, see, e.g., Carpenter (2004) and Carpenter & Ting (2007). 127 Greenstone, et al. (2006). 128 Id. See also La Porta et al. (1999). 129 Id. See also Balleisen and Moss, eds. (2009).

50
Chapter III: Recommendations for Reform
The Regulatory Right-to-Know Act charges OMB with making “recommendations to reform inefficient or ineffective regulatory programs.” This year’s Report focuses on OMB’s and federal agencies’ efforts to implement the retrospective review components of Executive Orders 13563 and 13610 and also focuses on how retrospective review can be expanded and improved as agencies gain greater experience with the process.
Recommendations for Reform
In recent reports to Congress, OMB has recommended a wide range of regulatory and analytic reforms and practices, including:130
• quantification of opportunity costs, where possible;
• transparency and reproducibility of regulatory effects estimates;
• examination of how to conduct and present regulatory impact analyses when necessary inputs are non-quantifiable;
• use of cost-effectiveness analysis, especially for regulations designed to reduce mortality risks;
• promotion of public participation in the regulatory process through technological means;
• improved regulatory cooperation with international trading partners;
• and consideration of regulatory effects on economic growth and innovation;
OMB continues to support these recommendations.
Retrospective Review of Regulations
When an agency adopts a new regulation, the agency is required by E.O. 12866 and E.O. 13563 to provide a prospective analysis of the regulation’s expected future costs and benefits. Regardless of how well done that analysis is, it can never fully capture all uncertainties and future changes in the regulated industry. Therefore, the estimated costs and benefits may either under- or overstate the actual cost and benefits of the regulation. For that reason, it is necessary for agencies to carefully reassess those actual costs and benefits to determine whether continued regulation is warranted. Agencies can also consider whether it is possible to streamline, modify, expand, or eliminate rules that do not make sense in their current form or under existing circumstances.
130 Earlier versions of OMB’s Report to Congress on the Benefits and Costs of Federal are available on OMB’s website at http://www.whitehouse.gov/omb/inforeg_regpol_reports_congress/.
51
A. Current Efforts to Encourage Retrospective Review by Agencies
Executive Order (E.O.) 13563 was signed by the President in January 2011. The Order requires that each federal agency develop plans to periodically review its existing regulations, “to determine whether any such regulations should be modified, streamlined, expanded, or repealed so as to make the agency’s regulatory program more effective or less burdensome.” E.O. 13610, signed by the President in February 2012, is intended to develop and maintain a culture of retrospective analysis by requiring agencies to periodically report to OIRA about their progress on their regulatory review programs. Starting in 2012, agencies were required to provide a public report on their retrospective review efforts twice per year. During FY 2015, agencies summited updated progress reports to OMB in February and July. The most recent reports can be found here: https://www.whitehouse.gov/omb/oira/regulation-reform
As part of their progress reports, federal agencies have also been asked to submit to OMB plans for stakeholder engagement. The purpose of stakeholder engagement is for agencies to solicit ideas for regulatory reform from entities impacted by regulations. Agencies have used a variety of methods to reach the public. Some, for example the Department of Transportation (DOT) and the Environmental Protection Agency (EPA), have held public meetings with interested parties. Others, such as the Department of Labor (DOL) and the Department of Homeland Security (DHS), have used IdeaScale to create websites for the public to suggest and vote on ideas for regulatory reforms.
In recent years, agencies have adopted a variety of regulatory reforms as a result of retrospective regulatory review. However, the majority of these changes have focused on reducing unnecessary reporting requirements and paperwork burdens. Several agencies have adopted regulatory changes that involved switching from paper to electronic notifications or applications. This type of simple reform can result in significant reductions in costs. One time-saving example is the Social Security Administration’s recent development of an online form that allows many beneficiaries to apply for replacement Social Security cards electronically, rather than sending paper forms or making an in-person visit to a local office. In other cases, agencies have concluded that the costs of required reports outweigh their benefits and should be eliminated. For example, until recently the Commerce Department required fishermen to file weekly reports in weeks they did not fish; eliminating this requirement reduced fishermen’s reporting burden substantially. Similarly, the Department of Transportation has eliminated an unnecessary inspection reporting requirement for truck drivers. Until this change, drivers were required to inspect their trucks at the end of their trip and file a report, whether they found a defect with the vehicle or not. The Department eliminated the no-defect reports after it determined that the reports provided no safety benefit and were unnecessarily burdensome. As agencies develop greater experience with retrospective review, we expect to see a greater emphasis on more complex regulatory reforms. The earliest reforms have tended to focus on regulatory problems that are easiest to perceive and easiest to remedy. However, we expect that, over time, agencies will develop greater expertise with retrospective empirical analysis of regulatory effects and greater confidence in interpreting and applying the results of such analyses. This will allow them to better measure the actual costs and benefits of their
52
regulations and to consider how best to revise particular provisions or, in some cases, engage in a wholesale overhaul of the structure of their regulations. B. Improving Retrospective Review by Agencies
While progress has been made on retrospective review, additional changes may ensure that the quality of review and resulting regulatory revisions improve over time. Changes will ensure that progress continues, that the focus of regulatory revisions expand beyond reductions in paperwork burdens and reporting requirements, and that periodic reassessment and revision becomes a permanent feature of regulation. To this end, we recommend that agencies adopt the following practices:
• Include sunset provisions or formal requirements for periodic review when
adopting regulations with significant uncertainties. In some cases, it is particularly difficult to predict the future effects of regulations and design optimal provisions. For example, in industries experiencing rapid technical change, it may be difficult to draft a regulation that adapts to changes in the industry over time. In these cases, requirements for sunset or formal review may help to ensure that regulations keep pace with changed circumstances.
• Include plans for data collection to facilitate period review as part of new regulations. In some cases, agencies have difficulty with reviewing their regulations because they lack appropriate data. Including plans for data collection when rules are adopted will ensure that there is sufficient data to empirically evaluate the effects of new regulations and determine whether they require revisions to achieve their intended purposes.
• Consider pilot projects when designing new regulations. Often it is difficult to
determine whether a regulation will achieve its intended policy objective or to determine which of several policy options is the optimal choice. In such cases, agencies may be able to gain insights by developing one or more pilot projects to test the measures under consideration. This practice may prevent agencies from adopting regulations with unforeseen negative effects and thus may obviate the need for later revisions.
• Consider third-party evaluations of regulations. Generally, agencies receive
comments during regulatory review and other proceedings from entities that are directly affected by their regulations. In some cases, agencies may wish to solicit input from disinterested entities, such as academics, when reviewing regulations. In the case of a few regulations, third-party studies of effects may be available in academic journals or working papers. Agencies may find it helpful to review the estimated effects and methodologies of these studies.
As part of its effort toward the goal of promoting retrospective review, OMB requests
comment on all aspects of the Administration’s regulatory reform program. We are particularly interested in comments on particular regulations that might benefit from review or revision and

53
also on ways to ensure that retrospective regulatory review becomes a routine, inherent part of agencies’ regulatory programs in the future.

54
PART II: NINETEENTH ANNUAL REPORT TO CONGRESS ON AGENCY
COMPLIANCE WITH THE UNFUNDED MANDATES REFORM ACT

55
Introduction
This report represents OMB’s nineteenth annual submission to Congress on agency compliance with the Unfunded Mandates Reform Act of 1995 (UMRA). This report on agency compliance with the Act covers the period of October 2014 through September 2015; rules published before October 2014 are described in previous years’ reports.
Since 2001, this report has been included in our final Report to Congress on the Benefits and Costs of Federal Regulations. This is done because the two reports together address many of the same issues. Both reports also highlight the need for regulating in a responsible manner, accounting for benefits and costs and taking into consideration the interests of our intergovernmental partners.
State and local governments have a vital constitutional role in providing government services. They have the primary role in providing domestic public services, such as public education, law enforcement, road building and maintenance, water supply, and sewage treatment. The Federal Government contributes to that role by promoting a healthy economy and by providing grants, loans, and tax subsidies to State and local governments. However, State, local, and tribal governments have expressed concerns about the difficulty of complying with Federal mandates without additional Federal resources.
In response, Congress passed the Unfunded Mandates Reform Act of 1995 (UMRA, or “the Act”). Title I of the Act focuses on the Legislative Branch, addressing the processes Congress should follow before enactment of any statutory unfunded mandates. Title II addresses the Executive Branch. It begins with a general directive for agencies to assess, unless otherwise prohibited by law, the effects of their rules on the other levels of government and on the private sector (Section 201). Title II also describes specific analyses and consultations that agencies must undertake for rules that may result in expenditures of over $100 million (adjusted annually for inflation) in any year by State, local, and tribal governments in the aggregate, or by the private sector.
Specifically, Section 202 requires an agency to prepare a written statement for intergovernmental mandates that describes in detail the required analyses and consultations on the unfunded mandate. Section 205 requires that for all rules subject to Section 202, agencies must identify and consider a reasonable number of regulatory alternatives, and then generally select the least costly, most cost-effective, or least burdensome option that achieves the objectives of the rule. Sec 205 does not apply if the agency head explains in the final rule why such a selection was not made or if such a selection would be inconsistent with law.
Title II requires agencies to “develop an effective process” for obtaining “meaningful and timely input” from State, local and tribal governments in developing rules that contain significant intergovernmental mandates (Section 204). Title II also singles out small governments for
56
particular attention (Section 203). OMB’s guidelines assist Federal agencies in complying with the Act and are based upon the following general principles131:
• Intergovernmental consultations should take place as early as possible, beginning before issuance of a proposed rule and continuing through the final rule stage, and be integrated explicitly into the rulemaking process;
• Agencies should consult with a wide variety of State, local, and tribal officials;
• Agencies should prepare an estimate of direct benefits and costs for use in the consultation process;
• The scope of consultation should reflect the cost and significance of the mandate being considered;
• Effective consultation requires trust and significant and sustained attention so that all who participate can enjoy frank discussion and focus on key priorities; and
• Agencies should seek out State, local, and tribal views on costs, benefits, risks, and alternative methods of compliance and whether the Federal rule will harmonize with and not duplicate similar laws in other levels of government.
Federal agencies have been actively consulting with states, localities, and tribal governments in order to ensure that regulatory activities were conducted consistent with the requirements of UMRA (a description of agency consultation activities will be included in the final version of this Report).
The remainder of this report lists and briefly discusses the regulations meeting the Title II
threshold and the specific requirements of Sections 202 and 205 of the Act from October 1, 2014 to September 30, 2015.
In FY 2015, Federal agencies issued 13 final rules that were subject to Sections 202 and
205 of the Unfunded Mandate Reform Act of 1995 (UMRA), as they required expenditures by State, local or tribal governments, in the aggregate, or by the private sector, of at least $100 million in at least one year (adjusted annually for inflation). The Environmental Protection Agency published four, the Department of Energy published two, the Department of Health and Human Services published four on its own and one in conjunction with the Departments of Labor and the Treasury, the Department of Labor published one on its own and one in conjunction with the Departments of Health and Human Services and the Treasury, and the Department of Transportation published one.132
131 OMB, Memorandum for the Heads of Executive Departments and Agencies, M-95-09, “Guidance for Implementing Title II of S.1,” 1995, available at http://www.whitehouse.gov/sites/default/files/omb/memoranda/m95-09.pdf. 132 Interim final rules were not included in this chapter since “Section 202 [of the Unfunded Mandates Reform Act]... does not apply to interim final rules or non-notice rules issued under the ‘good cause’ exemption in 5 U.S.C. 553(b)(B).” See OMB, Memorandum for the Heads of Executive Departments and Agencies, M-95-09, “Guidance for Implementing Title II of S.1,” 1995, available at http://www.whitehouse.gov/sites/default/files/omb/memoranda/m95-09.pdf.

57
OMB worked with the agencies in applying the requirements of Title II of the Act to their selection of the regulatory options for these rules. Descriptions of the rules are included in the following section.
A. Environmental Protection Agency
1. Standards for the Management of Coal Combustion Residuals by Commercial Electric
Power Producers
This rule provides a comprehensive set of requirements for the safe disposal of coal combustion residuals (CCRs) from coal-fired power plants. More specifically, the rule establishes technical requirements for CCR landfills and surface impoundments under subtitle D of the Resource Conservation and Recovery Act. Additionally, the rule sets out recordkeeping and reporting requirements, as well as the requirement for each facility to establish and post specific information to a publicly accessible website. The overall impact on the private sector exceeds the $100 million threshold in the aggregate. Consequently, the provisions of this rule constitute a private sector mandate under UMRA.
2. Revising Underground Storage Tank Regulations – Revisions to Existing Requirements
for Secondary Containment and Operator Training
This rule amends Underground Storage Tank (UST) regulations that were first promulgated in 1988. Changes to the regulations include: adding secondary containment requirements for new and replaced tanks and piping; adding operator training requirements; adding periodic operation and maintenance requirements for UST systems; addressing UST systems deferred in the 1988 UST regulation; adding new release prevention and detection technologies; updating codes of practice; making editorial and technical corrections; and updating state program approval requirements to incorporate these new changes. The overall impact on the private sector exceeds the $100 million threshold in the aggregate. Consequently, the provisions of this rule constitute a private sector mandate under UMRA.
3. Effluent Limitations Guidelines and Standards for the Steam Electric Power Generating
Point Source Category
With the goal of reducing discharges of pollutants from industries to waters of the United States, these steam electric effluent limitations guidelines and standards apply to steam electric power plants using nuclear or fossil fuels, such as coal, oil and natural gas. The overall impact on the private sector exceeds the $100 million threshold in at least one year. Consequently, the provisions of this rule constitute a private sector mandate under UMRA.
4. Carbon Pollution Emission Guidelines for Existing Stationary Sources: Electric Utility
Generating Units
This rule establishes greenhouse gas standards for the power sector. The overall impact on the private sector exceeds the $100 million threshold in the aggregate. Consequently, the provisions of this rule constitute a mandate under UMRA.

58
B. Department of Energy
1. Energy Efficiency Standards for Automatic Commercial Ice Makers
This final rule prescribes energy conservation standards for automatic commercial ice makers. DOE has concluded that this final rule would likely require expenditures of $100 million or more by the private sector. Such expenditures may include: (1) investment in research and development and in capital expenditures by manufacturers, and (2) incremental additional expenditures by consumers.
2. Energy Conservation Standards for General Service Fluorescent Lamps and Incandescent
Reflector Lamps
This final rule prescribes energy conservation standards for various consumer products and commercial and industrial equipment, including general service fluorescent lamps and incandescent reflector lamps. DOE has concluded that this final rule would likely require expenditures of $100 million or more by the private sector. Such expenditures may include: (1) investment in research and development and in capital expenditures by manufacturers, and (2) incremental additional expenditures by consumers to purchase higher-efficiency lamps.
C. Department of Health and Human Services
1. Current Good Manufacturing Practice and Hazard Analysis, and Risk-Based Preventive Controls for Human Food
This rule requires a food facility to have and implement preventive controls to significantly minimize or prevent the occurrence of hazards that could affect food manufactured, processed, packed, or held by the facility. This action is intended to prevent or, at a minimum, quickly identify foodborne pathogens before they get into the food supply. FDA estimates associated private costs of well over $100 million annually. Consequently, the provisions of this rule constitute a private sector mandate under UMRA.
2. Current Good Manufacturing Practice and Hazard Analysis and Risk-Based
Preventive Controls for Food for Animals
This rule establishes requirements for good manufacturing practice, and requires that certain facilities establish and implement hazard analysis and risk-based preventive controls for animal food, including ingredients and mixed animal feed. This action is intended to provide greater assurance that food for all animals, including pets, is safe. FDA estimates associated private costs of well over $100 million annually. Consequently, the provisions of this rule constitute a private sector mandate under UMRA.
59
3. Food Labeling: Nutrition Labeling of Standard Menu Items in Restaurants and Similar Retail Food Establishments
This rule requires restaurants and similar retail food establishments that are part of a chain with 20 or more locations doing business under the same name and offering for sale substantially the same menu items to provide calorie and other nutrition information for standard menu items, including food on display and self-service food. FDA estimates associated private costs of well over $100 million annually. Consequently, the provisions of this rule constitute a private sector mandate under UMRA.
4. CY 2016 Notice of Benefit and Payment Parameters
This final rule sets forth payment parameters and provisions related to various aspect of Affordable Care Act implementation, including: risk adjustment, reinsurance, and risk corridors programs; cost sharing parameters and cost-sharing reductions; user fees for Federally-facilitated; standards for the annual open enrollment period for 2016, essential health benefits, network adequacy, essential community providers, quality improvement strategies, the sale of non-qualified health plans through Exchanges, the good faith compliance enforcement safe harbor, a suppression status for QHPs, the Small Business Health Options Program, guaranteed availability and guaranteed renewability, minimum essential coverage, and the medical loss ratio program. Although HHS has not been able to quantify the impacts that will be associated with this rule, the combined administrative cost and user fee impact may be high enough to constitute a State, local, or Tribal government or private sector mandate under UMRA.
D. Departments of Health and Human Services, Labor, and the Treasury
1. Coverage of Certain Preventive Services; Eligible Organization
This rule finalize provisions from three rulemaking actions: interim final regulations issued in July 2010, related to coverage of preventive services; interim final regulations issued in August 2014, related to the process an eligible organization uses to provide notice of its religious objection to the coverage of contraceptive services; and proposed regulations issued in August 2014, related to the definition of “eligible organization,” which would expand the set of entities that may avail themselves of an accommodation with respect to the coverage of contraceptive services. Although the Departments have not been able to quantify the impacts that will be associated with this rule, the combined costs may be high enough to constitute a private sector mandate under UMRA.
E. Department of Labor
1. Establishing a Minimum Wage for Contractors, Executive Order 13658
60
This final rule implements Executive Order 13658, which increases the minimum wage that must be paid to workers working on certain new Federal contracts to $10.10 per hour and indexes the wage rate to inflation thereafter. Most contracts covered by this final rule are paid through appropriated funds, but how Congress and agencies respond to rising bids is subject to political processes whose unpredictability limited the Department’s ability to project how much of the regulatory burden would fall on affected entities and how much would be passed through to taxpayers. Therefore, this final rule may yield private sector effects that make it subject to UMRA requirements.
F. Department of Transportation
1. Hazardous Materials: Enhanced Tank Car Standards and Operational Controls for High-Hazard Flammable Trains
This final rule defines certain trains transporting large volumes of flammable liquids as “high-hazard flammable trains” (HHFT) and regulates their operation in terms of speed restrictions, braking systems, and routing. The final rule also adopts safety improvements in tank car design standards, a sampling and classification program for unrefined petroleum-based products, and notification requirements. DOT estimates private expenditures of well over $100 million annually. Consequently, the provisions of this rule constitute a private sector mandate under UMRA.

61
APPENDIX A: CALCULATION OF BENEFITS AND COSTS
Chapter I presents estimates of the annual benefits and costs of selected major final regulations reviewed by OMB between October 1, 2005 and September 30, 2015. OMB presents more detailed explanation of these regulations in several documents.
• Rules from October 1, 2005 to September 30, 2006: Tables 1-4 and A-1 of the 2007 Report.
• Rules from October 1, 2006 to September 30, 2007: Tables 1-4 and A-1 of the 2008 Report.
• Rules from October 1, 2007 to September 30, 2008: Tables 1-4 and A-1 of the 2009 Report.
• Rules from October 1, 2008 to September 30, 2009: Tables 1-4 and A-1 of the 2010 Report.
• Rules from October 1, 2009 to September 30, 2010: Tables 1-5(a) and A-1 of the 2011 Report.
• Rules from October 1, 2010 to September 30, 2011: Tables 1-5(a) and A-1 of the 2012 Report.
• Rules from October 1, 2011 to September 30, 2012: Tables 1-6(a) and A-1 of the 2013 Report.
• Rules from October 1, 2012 to September 30, 2013: Tables 1-6(a) and A-1 of the 2014 Report.
• Rules from October 1, 2013 to September 30, 2014: Tables 1-6(a) and A-1 of the 2015 Report.
• Rules from October 1, 2014 to September 30, 2015: Tables 1-6(a) and A-1 of this Report.
In assembling estimates of benefits and costs presented in this Report, OMB has:
1. Applied a uniform format for the presentation of benefit and cost estimates in order to make agency estimates more closely comparable with each other (for example, annualizing benefit and cost estimates); and
2. Monetized quantitative estimates where the agency has not done so (for example, converting agency projections of quantified benefits, such as estimated injuries avoided per year or tons of pollutant reductions per year, to dollars using the valuation estimates discussed below).
All benefit and cost estimates are adjusted to 2001 dollars using the latest Gross Domestic Product (GDP) deflator, available from the Bureau of Economic Analysis at the

62
Department of Commerce.133 In instances where the nominal dollar values the agencies use for their benefits and costs is unclear, we assume the benefits and costs are presented in nominal dollar values of the year before the rule is finalized. In periods of low inflation such as the past few years, this assumption does not affect the overall totals. All amortizations are performed using discount rates of 3 and 7 percent unless the agency has already presented annualized, monetized results using a different explicit discount rate.
OMB discusses, in this Report and in previous Reports, the difficulty of estimating and aggregating the benefits and costs of different regulations over long time periods and across many agencies. In addition, where OMB has monetized quantitative estimates where the agency has not done so, we have attempted to be faithful to the respective agency approaches. The adoption of a uniform format for annualizing agency estimates allows, at least for purposes of illustration, the aggregation of benefit and cost estimates across rules; however, agencies have used different methodologies and valuations in quantifying and monetizing effects. Thus, an aggregation involves the assemblage of benefit and cost estimates that are not strictly comparable.
To address this issue in part, the 2003 Report included OMB’s regulatory analysis guidance, also released as OMB Circular A-4, which took effect on January 1, 2004 for proposed rules and January 1, 2005 for final rules. The guidance recommends what OMB considers to be “best practices” in regulatory analysis, with a goal of strengthening the role of science, engineering, and economics in rulemaking. The overall goal of this guidance is a more competent and credible regulatory process and a more consistent regulatory environment. OMB expects that as more agencies adopt and refine these recommended best practices, the benefits and costs presented in future Reports will become more comparable across agencies and programs. The 2006 Report was the first report that included final rules subject to OMB Circular A-4. OMB will continue to work with the agencies in applying the guidance to their impact analyses.
Table A-1 below presents the unmodified information on the impacts of 59 major rules reviewed by OMB from October 1, 2014 through September 30, 2015, and includes additional explanatory text on the impacts for these rulemakings. The estimates presented in Table A-1 are annualized impacts in 2001 dollars, which is the requested format in OMB Circular A-4.
Table 1-6(a) in Chapter I of this Report presents the adjusted impact estimates for the thirteen rules finalized in FY2015 that were added to the Chapter 1 accounting statement totals. Table A-2 below presents the benefits and costs of previously reported major rules reviewed by OMB from October 1, 2005 through September 30, 2014 that are also included in the Chapter I accounting statement totals.
133 See National Income and Product Accounts, http://www.bea.gov.

63
Table A-1: Summary of Agency Estimates for Final Rules October 1, 2014 - September 30, 2015, As of Date of Completion of OMB Review (Millions of $2001)134
RIN Title Benefits
Costs
Transfers Other Information
Department of Agriculture 0570-AA73
Biorefinery, Renewable Chemical, and Biobased Product Manufacturing Assistance Program
not estimated
not estimated Range: $87.8-$137.9
Transfers are from the federal government to project developers.
0570-AA76
Rural Energy for America Program not estimated
not estimated $176.5 Range: $171.8-$176.5
Transfers are from the federal government to producers.
0570-AA94
Strategic Economic and Community Development
not estimated
not estimated $359.1 Range: $343.7-$359.1
Transfers are from the federal government to communities.
0578-AA62
Environmental Quality Incentives Program (EQIP)
not estimated
not estimated $730.8 Range: $726.1-$860.1
Transfers are from the federal government to producers.
0579-AD41
Importation of Beef From a Region in Brazil
$296.4 Range: $146.0-$483.6
$187.7 Range: $92.7-
$306.4
not estimated
0579-AD77
User Fees for Agricultural Quarantine and Inspection Services
not estimated
not estimated $44.8 Range:
$44.6-$44.8
Estimated transfers include $108.3 to $118.6 million per year from recipients of AQI services to the U.S. government and $31.7 to $65.3 million per year from the U.S. government to taxpayers. Changes in user fee rates affect the cost of importation and inbound travel. The impact of fee changes on import and traveler volumes and prices depends on their magnitude and the ability of suppliers to pass along or absorb the changes.
0579-AD92
Importation of Beef From a Region in Argentina
$146.0 Range: $119.6-$177.9
$92.7 Range: $75.9-
$113.0
not estimated
Department of Defense
134 Please note that for budgetary transfer rules, benefits and costs are generally not estimated because agencies typically estimate budgetary impacts instead.
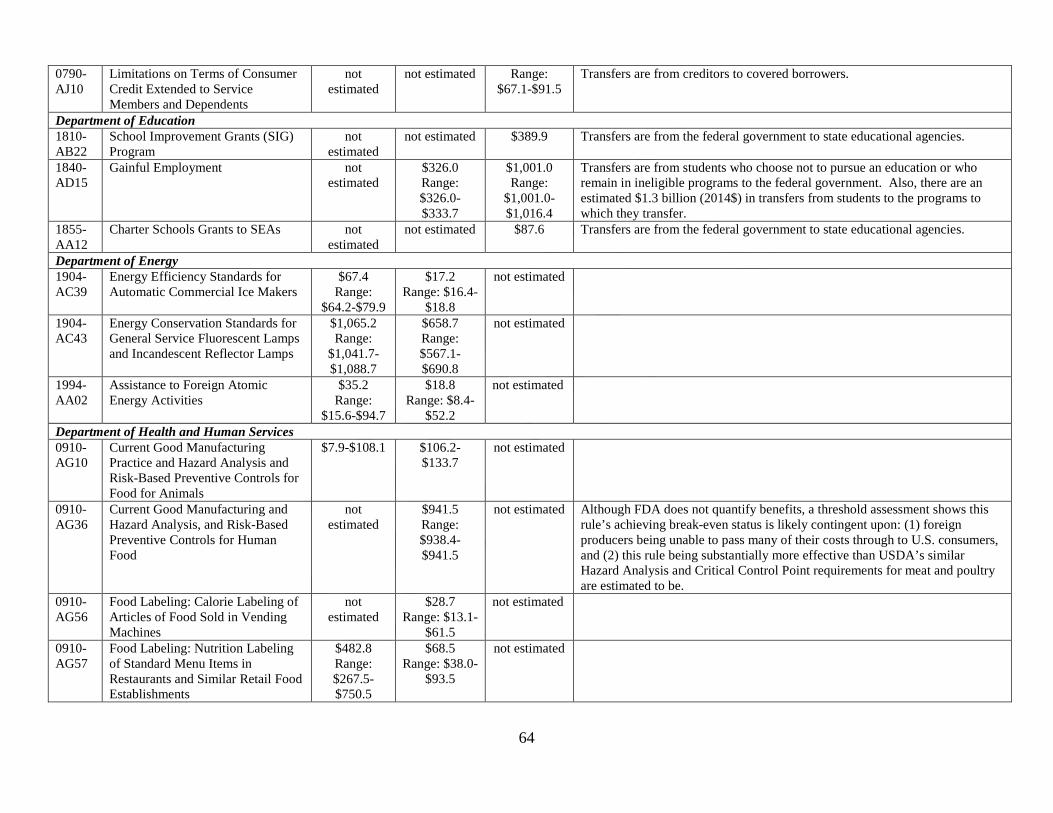
64
0790-AJ10
Limitations on Terms of Consumer Credit Extended to Service Members and Dependents
not estimated
not estimated Range: $67.1-$91.5
Transfers are from creditors to covered borrowers.
Department of Education 1810-AB22
School Improvement Grants (SIG) Program
not estimated
not estimated $389.9 Transfers are from the federal government to state educational agencies.
1840-AD15
Gainful Employment not estimated
$326.0 Range: $326.0-$333.7
$1,001.0 Range:
$1,001.0-$1,016.4
Transfers are from students who choose not to pursue an education or who remain in ineligible programs to the federal government. Also, there are an estimated $1.3 billion (2014$) in transfers from students to the programs to which they transfer.
1855-AA12
Charter Schools Grants to SEAs not estimated
not estimated $87.6 Transfers are from the federal government to state educational agencies.
Department of Energy 1904-AC39
Energy Efficiency Standards for Automatic Commercial Ice Makers
$67.4 Range:
$64.2-$79.9
$17.2 Range: $16.4-
$18.8
not estimated
1904-AC43
Energy Conservation Standards for General Service Fluorescent Lamps and Incandescent Reflector Lamps
$1,065.2 Range:
$1,041.7-$1,088.7
$658.7 Range: $567.1-$690.8
not estimated
1994-AA02
Assistance to Foreign Atomic Energy Activities
$35.2 Range:
$15.6-$94.7
$18.8 Range: $8.4-
$52.2
not estimated
Department of Health and Human Services 0910-AG10
Current Good Manufacturing Practice and Hazard Analysis and Risk-Based Preventive Controls for Food for Animals
$7.9-$108.1 $106.2-$133.7
not estimated
0910-AG36
Current Good Manufacturing and Hazard Analysis, and Risk-Based Preventive Controls for Human Food
not estimated
$941.5 Range: $938.4-$941.5
not estimated Although FDA does not quantify benefits, a threshold assessment shows this rule’s achieving break-even status is likely contingent upon: (1) foreign producers being unable to pass many of their costs through to U.S. consumers, and (2) this rule being substantially more effective than USDA’s similar Hazard Analysis and Critical Control Point requirements for meat and poultry are estimated to be.
0910-AG56
Food Labeling: Calorie Labeling of Articles of Food Sold in Vending Machines
not estimated
$28.7 Range: $13.1-
$61.5
not estimated
0910-AG57
Food Labeling: Nutrition Labeling of Standard Menu Items in Restaurants and Similar Retail Food Establishments
$482.8 Range: $267.5-$750.5
$68.5 Range: $38.0-
$93.5
not estimated

65
n/a Final Determination Regarding Partially Hydrogenated Oils
see notes $443.6 Range: $154.5-$813.3
not estimated Estimates reflect minimal quantification of losses in consumer utility due to reformulation or switching to foods with less-preferred taste, texture, or other characteristics. The analytic issues surrounding the associated private benefits are similar to those discussed in the 2014 Report in the context of energy efficiency regulations. A key study underlying the benefits estimates does not report its estimating equation; therefore, it is unknown to FDA and interagency reviewers whether that study’s regression analysis of the dose-response relationship between trans fat consumption and cholesterol levels estimates its intercept empirically or sets it to zero. Estimating intercepts empirically is the near-universal practice in the economics profession.
0938-AP01
Requirements for the Medicare Incentive Reward Program and Provider Enrollment (CMS-6045-F)
not estimated
not estimated $128.2-$427.4
Transfers are from ambulance suppliers to the federal government.
0938-AQ37
Medicaid Disproportionate Share Hospital Payments Uninsured Definition (CMS-2315-F)
not estimated
not estimated not estimated Transfers of value will flow from other disproportionate share hospitals to hospitals with changes DSH limits. CMS has done a rough calculation for one large hospital system and found that its transfer impacts will exceed $100 million. $11 billion is the total amount of yearly DSH payments and therefore represents a theoretical upper bound on transfers brought about by the rule.
0938-AS06
Medicare Shared Savings Program; Accountable Care Organizations (CMS-1461-F)
$307.0 Range: $183.9-$434.3
$143.2 Range: $143.2-$154.1
not estimated
0938-AS12
CY 2015 Revisions to Payment Policies Under the Physician Fee Schedule and Other Revisions to Medicare Part B (CMS-1612-FC)
not estimated
not estimated -$11,147.6 Transfers consist of a $14.7 billion (2014$) decrease in payments from the federal government to eligible Medicare providers due to changing in the physician fee schedule and a $234 million (2014$) increase from the federal government to eligible providers participating in the Physician Quality Reporting System.
0938-AS13
CY 2015 End-Stage Renal Disease Prospective Payment System, Quality Incentive Program, and Durable Medical Equipment, Prosthetics, Orthotics, and Supplies (CMS-1614-F)
not estimated
$0.1 -$894.6 Range: (908.2)-(894.6)
Transfers are from the federal government to Medicare providers. The $1.16 and $1.18 billion (2014$) estimates include only impacts associated with pricing items in non-competitive areas using competitive bidding pricing. Other estimated are: $30 million from the federal government to ESRD providers and $10 million from beneficiaries to ESRD providers due to the ESRD PPS; -$11.9 million from the federal government to ESRD providers due to the ESRD Quality Improvement Program for PY 2017; and -$11.6 million from the federal government to ESRD due to the ESRD QIP for PY 2018. There are a further $290 million (2014$) in estimated transfers from Medicare providers to beneficiaries.
0938-AS14
CY 2015 Home Health Prospective Payment System Refinements and Rate Update (CMS-1611-F)
not estimated
-$16.6 $46.2 Transfers are from home health providers to the federal government and reflect the effects of 2.1 percent in the CY 2015 home health payment update ($390 million increase) and the second year of the four-year phase-in of the rebasing adjustments ($450 million decrease).

66
0938-AS15
CY 2015 Hospital Outpatient Prospective Payment System (PPS) Policy Changes and Payment Rates, and CY 2015 Ambulatory Surgical Center Payment System Policy Changes and Payment Rates (CMS-1613-FC)
not estimated
not estimated $693.5 Transfers are from the federal government to Medicare outpatient hospitals. There are a further estimated $42 million (2014$) transfers from the federal government to ambulatory surgical centers.
0938-AS19
CY 2016 Notice of Benefit and Payment Parameters (CMS-9944-F)
not estimated
$5.4 $322.6 Transfers reflect incremental cost increases from 2015-2016 for reinsurance administrative expenses, FFE user fees, and the risk adjustment user fee, which are transfers from contributing entities and health insurance issuers to the Federal government. FFE user fees are newly included in the estimated transfers. Transfers also reflect annual transfer from shareholders or nonprofit stakeholders to enrollees of rebates paid by issuers for coverage in the individual and group markets, resulting from clarification regarding MLR methodology to account for Federal and State employment taxes.
0938-AS39
FY 2016 Hospice Rate Update (CMS-1629-F)
not estimated
not estimated $121.9 Transfers are from the federal government to Medicare hospice providers.
0938-AS41
Hospital Inpatient Prospective Payment System for Acute Care Hospitals and the Long-Term Care Hospital Prospective Payment System and FY 2016 Rates (CMS-1632-FC)
not estimated
not estimated $16.8 The operating capital payments and all other policies should result in a net increase of $272 million to IPPS providers (the sign is incorrect in Table V of the final rule's preamble). Payments from the federal government to LTCHs are estimated to decrease by $250 million.
0938-AS44
FY 2016 Prospective Payment System and Consolidated Billing for Skilled Nursing Facilities (CMS-1622-F)
not estimated
not estimated $327.7 Transfers are from the federal government to skilled nursing facilities.
0938-AS45
FY 2016 Inpatient Rehabilitation Facility Prospective Payment System (CMS-1624-F)
not estimated
$18.3 $102.9 Transfers are from the federal government to Medicare providers.
0938-AS50
Coverage of Certain Preventive Services; Eligible Organizations (CMS-9940-F)
not estimated
not estimated not estimated Costs previously paid out-of-pocket for certain preventive services are now covered by group health plans and issuers.
Department of Homeland Security 1651-AA72
Changes to the Visa Waiver Program To Implement the Electronic System for Travel Authorization (ESTA) Program
$256.1 Range: $241.2-$368.9
$234.2 Range: $224.0-$363.4
not estimated Quantified costs and benefits include costs and benefits to foreign travelers.
1652-AA68
Adjustment of Passenger Civil Aviation Security Service Fee
not estimated
not estimated $65.5 Range:
$65.5-$66.1
Transfers are from the federal government to airline passengers.
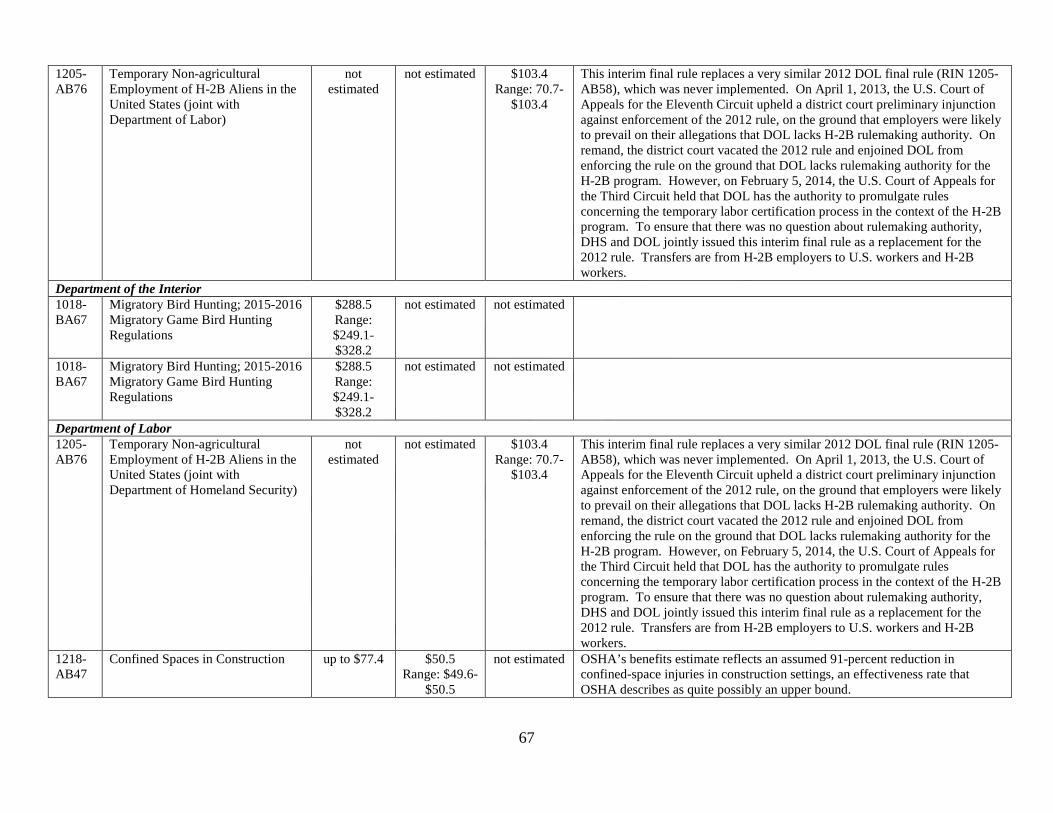
67
1205-AB76
Temporary Non-agricultural Employment of H-2B Aliens in the United States (joint with Department of Labor)
not estimated
not estimated $103.4 Range: 70.7-
$103.4
This interim final rule replaces a very similar 2012 DOL final rule (RIN 1205-AB58), which was never implemented. On April 1, 2013, the U.S. Court of Appeals for the Eleventh Circuit upheld a district court preliminary injunction against enforcement of the 2012 rule, on the ground that employers were likely to prevail on their allegations that DOL lacks H-2B rulemaking authority. On remand, the district court vacated the 2012 rule and enjoined DOL from enforcing the rule on the ground that DOL lacks rulemaking authority for the H-2B program. However, on February 5, 2014, the U.S. Court of Appeals for the Third Circuit held that DOL has the authority to promulgate rules concerning the temporary labor certification process in the context of the H-2B program. To ensure that there was no question about rulemaking authority, DHS and DOL jointly issued this interim final rule as a replacement for the 2012 rule. Transfers are from H-2B employers to U.S. workers and H-2B workers.
Department of the Interior 1018-BA67
Migratory Bird Hunting; 2015-2016 Migratory Game Bird Hunting Regulations
$288.5 Range: $249.1-$328.2
not estimated not estimated
1018-BA67
Migratory Bird Hunting; 2015-2016 Migratory Game Bird Hunting Regulations
$288.5 Range: $249.1-$328.2
not estimated not estimated
Department of Labor 1205-AB76
Temporary Non-agricultural Employment of H-2B Aliens in the United States (joint with Department of Homeland Security)
not estimated
not estimated $103.4 Range: 70.7-
$103.4
This interim final rule replaces a very similar 2012 DOL final rule (RIN 1205-AB58), which was never implemented. On April 1, 2013, the U.S. Court of Appeals for the Eleventh Circuit upheld a district court preliminary injunction against enforcement of the 2012 rule, on the ground that employers were likely to prevail on their allegations that DOL lacks H-2B rulemaking authority. On remand, the district court vacated the 2012 rule and enjoined DOL from enforcing the rule on the ground that DOL lacks rulemaking authority for the H-2B program. However, on February 5, 2014, the U.S. Court of Appeals for the Third Circuit held that DOL has the authority to promulgate rules concerning the temporary labor certification process in the context of the H-2B program. To ensure that there was no question about rulemaking authority, DHS and DOL jointly issued this interim final rule as a replacement for the 2012 rule. Transfers are from H-2B employers to U.S. workers and H-2B workers.
1218-AB47
Confined Spaces in Construction up to $77.4 $50.5 Range: $49.6-
$50.5
not estimated OSHA’s benefits estimate reflects an assumed 91-percent reduction in confined-space injuries in construction settings, an effectiveness rate that OSHA describes as quite possibly an upper bound.
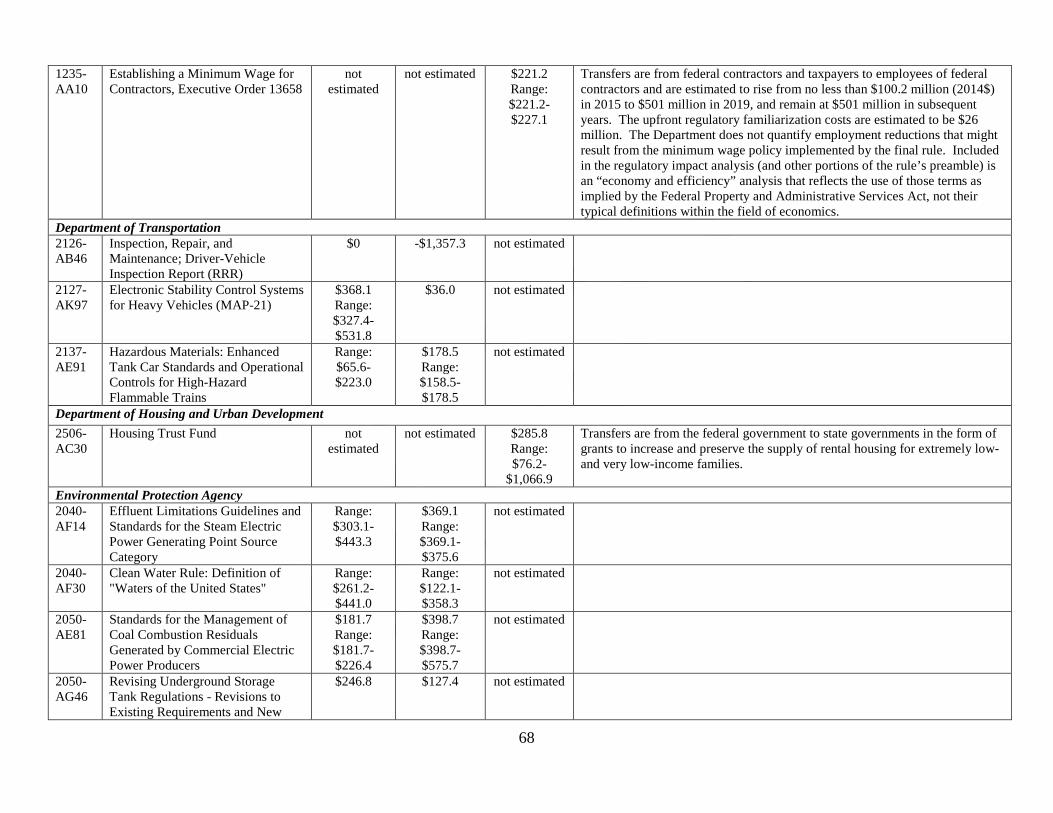
68
1235-AA10
Establishing a Minimum Wage for Contractors, Executive Order 13658
not estimated
not estimated $221.2 Range: $221.2-$227.1
Transfers are from federal contractors and taxpayers to employees of federal contractors and are estimated to rise from no less than $100.2 million (2014$) in 2015 to $501 million in 2019, and remain at $501 million in subsequent years. The upfront regulatory familiarization costs are estimated to be $26 million. The Department does not quantify employment reductions that might result from the minimum wage policy implemented by the final rule. Included in the regulatory impact analysis (and other portions of the rule’s preamble) is an “economy and efficiency” analysis that reflects the use of those terms as implied by the Federal Property and Administrative Services Act, not their typical definitions within the field of economics.
Department of Transportation 2126-AB46
Inspection, Repair, and Maintenance; Driver-Vehicle Inspection Report (RRR)
$0 -$1,357.3 not estimated
2127-AK97
Electronic Stability Control Systems for Heavy Vehicles (MAP-21)
$368.1 Range: $327.4-$531.8
$36.0 not estimated
2137-AE91
Hazardous Materials: Enhanced Tank Car Standards and Operational Controls for High-Hazard Flammable Trains
Range: $65.6-$223.0
$178.5 Range: $158.5-$178.5
not estimated
Department of Housing and Urban Development 2506-AC30
Housing Trust Fund not estimated
not estimated $285.8 Range: $76.2-
$1,066.9
Transfers are from the federal government to state governments in the form of grants to increase and preserve the supply of rental housing for extremely low- and very low-income families.
Environmental Protection Agency 2040-AF14
Effluent Limitations Guidelines and Standards for the Steam Electric Power Generating Point Source Category
Range: $303.1-$443.3
$369.1 Range: $369.1-$375.6
not estimated
2040-AF30
Clean Water Rule: Definition of "Waters of the United States"
Range: $261.2-$441.0
Range: $122.1-$358.3
not estimated
2050-AE81
Standards for the Management of Coal Combustion Residuals Generated by Commercial Electric Power Producers
$181.7 Range: $181.7-$226.4
$398.7 Range: $398.7-$575.7
not estimated
2050-AG46
Revising Underground Storage Tank Regulations - Revisions to Existing Requirements and New
$246.8 $127.4 not estimated
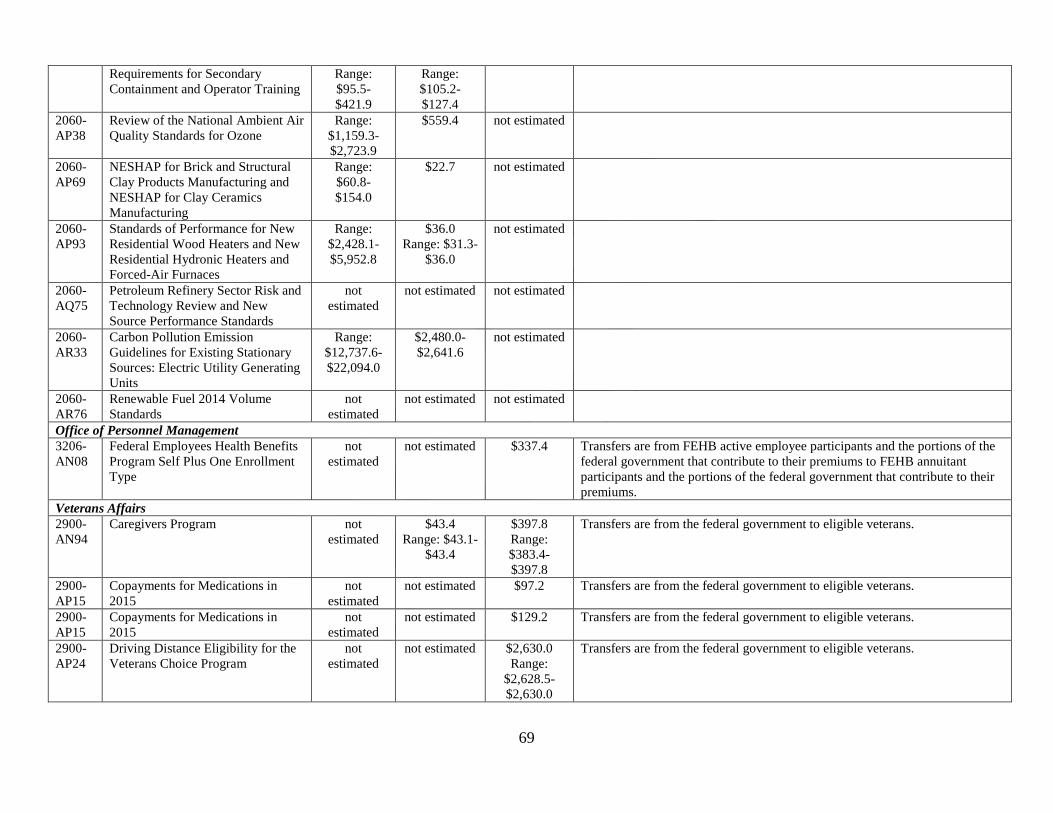
69
Requirements for Secondary Containment and Operator Training
Range: $95.5-$421.9
Range: $105.2-$127.4
2060-AP38
Review of the National Ambient Air Quality Standards for Ozone
Range: $1,159.3-$2,723.9
$559.4 not estimated
2060-AP69
NESHAP for Brick and Structural Clay Products Manufacturing and NESHAP for Clay Ceramics Manufacturing
Range: $60.8-$154.0
$22.7 not estimated
2060-AP93
Standards of Performance for New Residential Wood Heaters and New Residential Hydronic Heaters and Forced-Air Furnaces
Range: $2,428.1-$5,952.8
$36.0 Range: $31.3-
$36.0
not estimated
2060-AQ75
Petroleum Refinery Sector Risk and Technology Review and New Source Performance Standards
not estimated
not estimated not estimated
2060-AR33
Carbon Pollution Emission Guidelines for Existing Stationary Sources: Electric Utility Generating Units
Range: $12,737.6-$22,094.0
$2,480.0-$2,641.6
not estimated
2060-AR76
Renewable Fuel 2014 Volume Standards
not estimated
not estimated not estimated
Office of Personnel Management 3206-AN08
Federal Employees Health Benefits Program Self Plus One Enrollment Type
not estimated
not estimated $337.4 Transfers are from FEHB active employee participants and the portions of the federal government that contribute to their premiums to FEHB annuitant participants and the portions of the federal government that contribute to their premiums.
Veterans Affairs 2900-AN94
Caregivers Program not estimated
$43.4 Range: $43.1-
$43.4
$397.8 Range: $383.4-$397.8
Transfers are from the federal government to eligible veterans.
2900-AP15
Copayments for Medications in 2015
not estimated
not estimated $97.2 Transfers are from the federal government to eligible veterans.
2900-AP15
Copayments for Medications in 2015
not estimated
not estimated $129.2 Transfers are from the federal government to eligible veterans.
2900-AP24
Driving Distance Eligibility for the Veterans Choice Program
not estimated
not estimated $2,630.0 Range:
$2,628.5-$2,630.0
Transfers are from the federal government to eligible veterans.

70
2900-AP24
Driving Distance Eligibility for the Veterans Choice Program
not estimated
not estimated $685.9-$4,343.9
Transfers are from the federal government to eligible veterans.

Table A-2: Estimates of Annual Benefits and Costs of Major Final Rules October 1, 2005 - September 30, 2014135
(millions of 2001 dollars)
RIN Title Completed Published Benefits Costs Source of Estimates
Department of Agriculture 0579-AC01
Bovine Spongiform Encephalopathy; Minimal-Risk Regions and Importation of Commodities
9/14/07 9/18/07 169-340 98-194 2008 Report: Table 1-4
0583-AC88
Prohibition of the Use of Specified Risk Materials for Human Food and Requirements for the Disposition of Non-Ambulatory Disabled Cattle
6/29/07 7/13/07 0 87-221 2008 Report: Table 1-4
Department of Energy 1904-AA78
Energy Efficiency Standards for Residential Furnaces and Boilers
11/6/07 11/19/07 120-182 33-38 2009 Report: Table 1-4
1904-AA89
Energy Efficiency Standards for Clothes Dryers and Room Air Conditioners
4/8/11 4/21/11
169-310 129-182 2012 Report: Table 1-5(a)
1904-AA90
Energy Efficiency Standards for Pool Heaters and Direct Heating Equipment and Water Heaters [75 FR 20112]
3/30/10 4/16/10 1,274-1,817 975-1,122
2011 Report: Table A-1
1904-AA92
Energy Efficiency Standards for General Service Fluorescent Lamps and Incandescent Lamps
6/26/09 7/14/09 1,111-2,886 192-657 2010 Report: Table 1-4
1904-AB08
Energy Efficiency Standards for Electric Distribution Transformers
9/27/07 10/12/07 490-865 381-426 2008 Report: Table 1-4
1904-AB50
Energy Efficiency Standards for Fluorescent Lamp Ballasts
10/28/2011 11/14/2011 760-1,556 179-153 2013 Report: Table 1-6(a)
1904-AB59
Energy Efficiency Standards for Commercial Refrigeration Equipment
12/18/08 1/9/09 186-224 69-81 2010 Report: Table 1-4
1904-AB70
Energy Conservation Standards for Small Electric Motors [75 FR 10874]
2/25/10 3/9/10 688-827 218 2011 Report: Table A-1
1904-AB79
Energy Efficiency Standards for Residential Refrigerators, Refrigerator-Freezers, and Freezers
8/25/11 9/15/11 1,660-3,034 803-1.281
2012 Report: Table 1-5(a)
1904-AB90
Energy Conservation Standards for Residential Clothes Washers
4/26/12 5/31/12 1,010-1,802 151-253 2013 Report: Table 1-6(a)
135 Based on date of completion of OMB review.
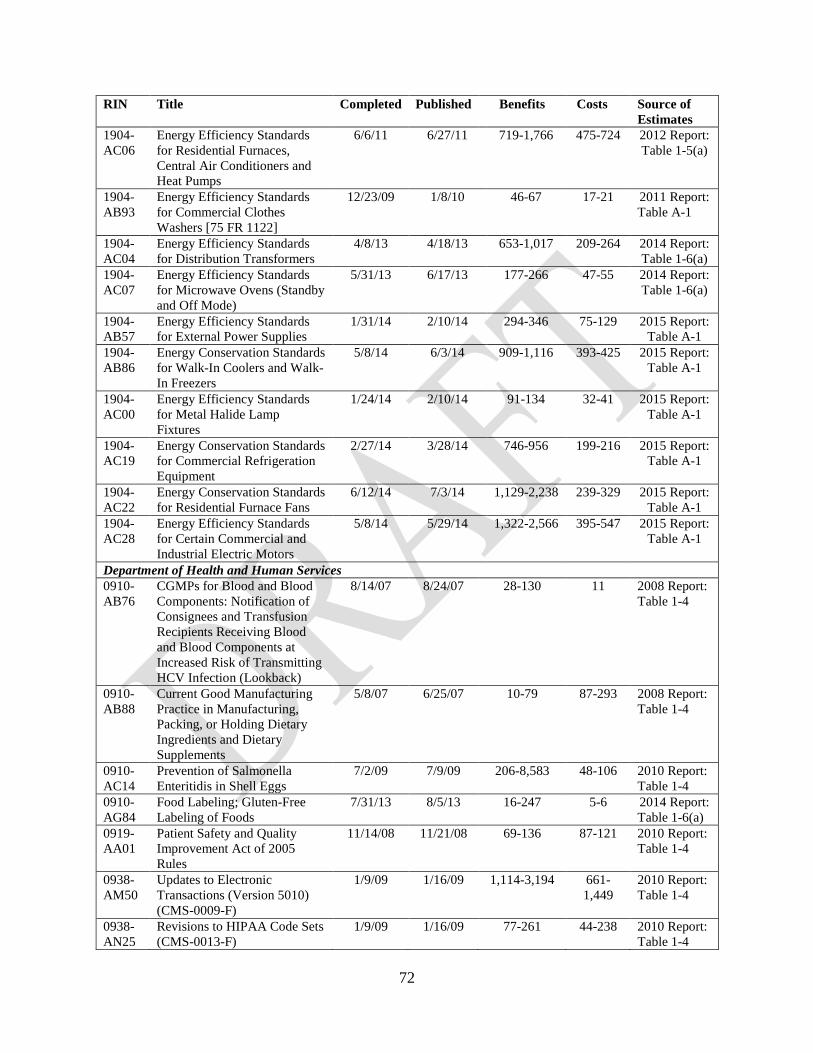
72
RIN Title Completed Published Benefits Costs Source of Estimates
1904-AC06
Energy Efficiency Standards for Residential Furnaces, Central Air Conditioners and Heat Pumps
6/6/11 6/27/11 719-1,766 475-724 2012 Report: Table 1-5(a)
1904-AB93
Energy Efficiency Standards for Commercial Clothes Washers [75 FR 1122]
12/23/09 1/8/10 46-67 17-21 2011 Report: Table A-1
1904-AC04
Energy Efficiency Standards for Distribution Transformers
4/8/13 4/18/13 653-1,017 209-264 2014 Report: Table 1-6(a)
1904-AC07
Energy Efficiency Standards for Microwave Ovens (Standby and Off Mode)
5/31/13 6/17/13 177-266 47-55 2014 Report: Table 1-6(a)
1904-AB57
Energy Efficiency Standards for External Power Supplies
1/31/14 2/10/14 294-346 75-129 2015 Report: Table A-1
1904-AB86
Energy Conservation Standards for Walk-In Coolers and Walk-In Freezers
5/8/14 6/3/14 909-1,116 393-425 2015 Report: Table A-1
1904-AC00
Energy Efficiency Standards for Metal Halide Lamp Fixtures
1/24/14 2/10/14 91-134 32-41 2015 Report: Table A-1
1904-AC19
Energy Conservation Standards for Commercial Refrigeration Equipment
2/27/14 3/28/14 746-956 199-216 2015 Report: Table A-1
1904-AC22
Energy Conservation Standards for Residential Furnace Fans
6/12/14 7/3/14 1,129-2,238 239-329 2015 Report: Table A-1
1904-AC28
Energy Efficiency Standards for Certain Commercial and Industrial Electric Motors
5/8/14 5/29/14 1,322-2,566 395-547 2015 Report: Table A-1
Department of Health and Human Services 0910-AB76
CGMPs for Blood and Blood Components: Notification of Consignees and Transfusion Recipients Receiving Blood and Blood Components at Increased Risk of Transmitting HCV Infection (Lookback)
8/14/07 8/24/07 28-130 11 2008 Report: Table 1-4
0910-AB88
Current Good Manufacturing Practice in Manufacturing, Packing, or Holding Dietary Ingredients and Dietary Supplements
5/8/07 6/25/07 10-79 87-293 2008 Report: Table 1-4
0910-AC14
Prevention of Salmonella Enteritidis in Shell Eggs
7/2/09 7/9/09 206-8,583 48-106 2010 Report: Table 1-4
0910-AG84
Food Labeling; Gluten-Free Labeling of Foods
7/31/13 8/5/13 16-247 5-6 2014 Report: Table 1-6(a)
0919-AA01
Patient Safety and Quality Improvement Act of 2005 Rules
11/14/08 11/21/08 69-136 87-121 2010 Report: Table 1-4
0938-AM50
Updates to Electronic Transactions (Version 5010) (CMS-0009-F)
1/9/09 1/16/09 1,114-3,194 661-1,449
2010 Report: Table 1-4
0938-AN25
Revisions to HIPAA Code Sets (CMS-0013-F)
1/9/09 1/16/09 77-261 44-238 2010 Report: Table 1-4

73
RIN Title Completed Published Benefits Costs Source of Estimates
0938-AN49
Electronic Prescribing Standards(CMS-0011-F)
11/1/05 11/7/05 196-660 82-274 2007 Report: Table 1-4
0938-AN79
Fire Safety Requirements for Long-Term Care Facilities: Sprinkler Systems (CMS-3191-F)
8/6/08 8/13/08 53-56 45-56 2009 Report: Table 1-4
0938-AQ11
Administrative Simplification: Adoption of Standards for Electronic Funds Transfer (EFT) (CMS-0024-IFC)
1/6/2012 1/10/2012 223-332 2-3 2013 Report: Table 1-6a)
0938-AQ12
Administrative Simplification: Adoption of Authoring Organizations for Operating Rules and Adoption of Operating Rules for Eligibility and Claims Status (CMS-0032-IFC)
6/30/11 7/8/11 930-1,138 260-616 2012 Report: Table 1-5(a)
0938-AQ13
Administrative Simplification: Standard Unique Identifier for Health Plans and ICD-10 Compliance Date Delay (CMS-0040-F)
8/27/2012 9/5/2012 425-1,017 150-758 2013 Report: Table 1-6(a)
0938-AR49
Part II--Regulatory Provisions To Promote Program Efficiency, Transparency, and Burden Reduction (CMS-3267-F)
5/5/14 5/12/14 0 (178)-(642)
2015 Report: Table A-1
0938-AQ12
Administrative Simplification: Adoption of Authoring Organizations for Operating Rules and Adoption of Operating Rules for Eligibility and Claims Status (CMS-0032- IFC)
6/30/11 7/8/11 1,034 438 2012 Report: Table D-3
Department of Homeland Security 1625-AA32
Standards for Living Organisms in Ships' Ballast Water Discharged in U.S. Waters
2/23/2012 3/23/2012 4-442 77-152 2013 Report: Table 1-6(a)
1651-AA72
Changes to the Visa Waiver Program To Implement the Electronic System for Travel Authorization (ESTA) Program
5/30/08 6/9/08 20-29 13-99 2009 Report: Table 1-4
Department of Housing and Urban Development 2502-AI61
Real Estate Settlement Procedures Act (RESPA); To Simplify and Improve the Process of Obtaining Mortgages and Reduce Consumer Costs (FR-5180)
11/7/08 11/17/08 2,303 884 2010 Report: Table 1-4
Department of Justice
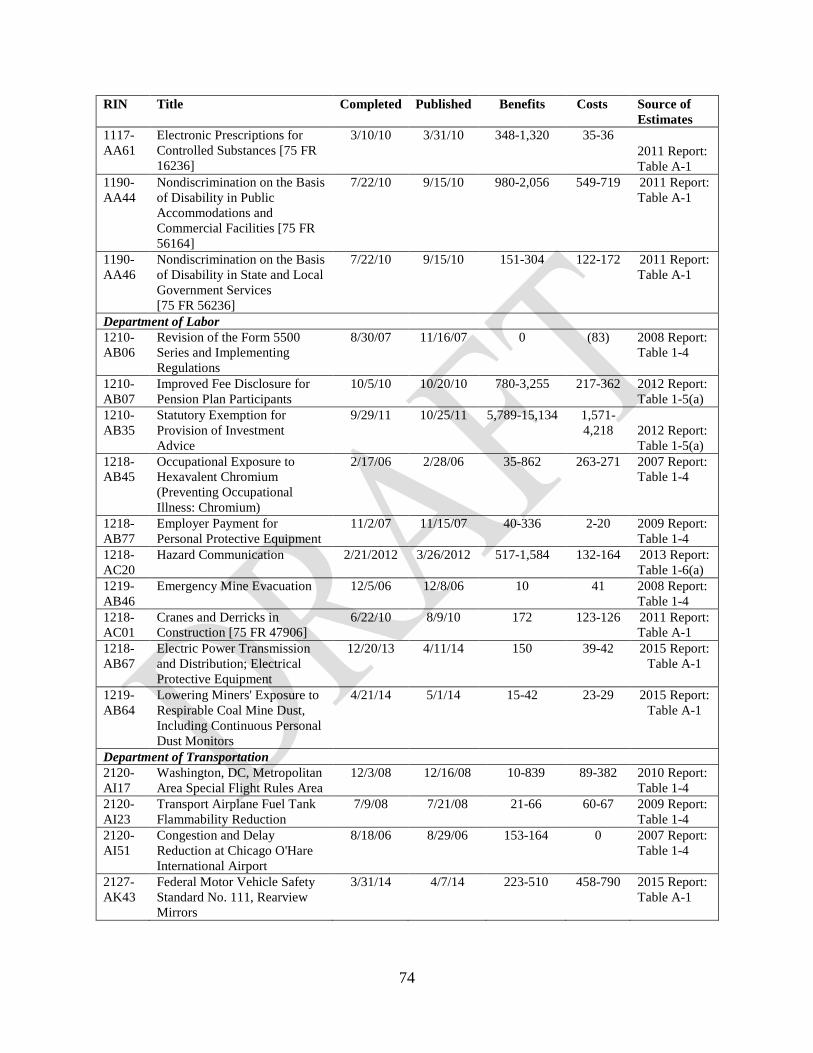
74
RIN Title Completed Published Benefits Costs Source of Estimates
1117-AA61
Electronic Prescriptions for Controlled Substances [75 FR 16236]
3/10/10 3/31/10 348-1,320 35-36 2011 Report: Table A-1
1190-AA44
Nondiscrimination on the Basis of Disability in Public Accommodations and Commercial Facilities [75 FR 56164]
7/22/10 9/15/10 980-2,056 549-719 2011 Report: Table A-1
1190-AA46
Nondiscrimination on the Basis of Disability in State and Local Government Services [75 FR 56236]
7/22/10 9/15/10 151-304 122-172 2011 Report: Table A-1
Department of Labor 1210-AB06
Revision of the Form 5500 Series and Implementing Regulations
8/30/07 11/16/07 0 (83) 2008 Report: Table 1-4
1210-AB07
Improved Fee Disclosure for Pension Plan Participants
10/5/10 10/20/10 780-3,255 217-362 2012 Report: Table 1-5(a)
1210-AB35
Statutory Exemption for Provision of Investment Advice
9/29/11 10/25/11 5,789-15,134 1,571-4,218 2012 Report:
Table 1-5(a) 1218-AB45
Occupational Exposure to Hexavalent Chromium (Preventing Occupational Illness: Chromium)
2/17/06 2/28/06 35-862 263-271 2007 Report: Table 1-4
1218-AB77
Employer Payment for Personal Protective Equipment
11/2/07 11/15/07 40-336 2-20 2009 Report: Table 1-4
1218-AC20
Hazard Communication 2/21/2012 3/26/2012 517-1,584 132-164 2013 Report: Table 1-6(a)
1219-AB46
Emergency Mine Evacuation 12/5/06 12/8/06 10 41 2008 Report: Table 1-4
1218-AC01
Cranes and Derricks in Construction [75 FR 47906]
6/22/10 8/9/10 172 123-126 2011 Report: Table A-1
1218-AB67
Electric Power Transmission and Distribution; Electrical Protective Equipment
12/20/13 4/11/14 150 39-42 2015 Report: Table A-1
1219-AB64
Lowering Miners' Exposure to Respirable Coal Mine Dust, Including Continuous Personal Dust Monitors
4/21/14 5/1/14 15-42 23-29 2015 Report: Table A-1
Department of Transportation 2120-AI17
Washington, DC, Metropolitan Area Special Flight Rules Area
12/3/08 12/16/08 10-839 89-382 2010 Report: Table 1-4
2120-AI23
Transport Airplane Fuel Tank Flammability Reduction
7/9/08 7/21/08 21-66 60-67 2009 Report: Table 1-4
2120-AI51
Congestion and Delay Reduction at Chicago O'Hare International Airport
8/18/06 8/29/06 153-164 0 2007 Report: Table 1-4
2127-AK43
Federal Motor Vehicle Safety Standard No. 111, Rearview Mirrors
3/31/14 4/7/14 223-510 458-790 2015 Report: Table A-1

75
RIN Title Completed Published Benefits Costs Source of Estimates
2127-AK56
Require Installation of Seat Belts on Motorcoaches, FMVSS No. 208 (MAP-21)
11/20/13 11/25/13 18-134 5-6 2015 Report: Table A-1
2120-AI92
Automatic Dependent Surveillance--Broadcast (ADS-B) Equipage Mandate to Support Air Traffic Control Service [75 FR 30160]
5/20/10 5/28/10 144-189 148-284 Internal database136
2120-AJ01
Part 121 Pilot Age Limit 6/8/09 7/15/09 30-35 4 2010 Report: Table 1-4
2120-AJ67
Pilot Certification and Qualification Requirements (Formerly First Officer Qualification Requirements) (HR 5900)
7/9/13 7/15/13 13-29 122-153 2014 Report: Table 1-6(a)
2125-AF19
Real-Time System Management Information Program
10/13/10 11/8/10 152-166 132-137 2012 Report: Table 1-5(a)
2126-AA59
New Entrant Safety Assurance Process
11/26/08 12/16/08 472-602 60-72 2010 Report: Table 1-4
2126- AA89
Electronic On-Board Recorders for Hours-of-Service Compliance137
3/18/2010 4/5/10
Not Included
Not Included
2011 Report: Table A-1
2126-AA97
National Registry of Certified Medical Examiners
4/4/2012 4/20/2012 58-180 25-28 2013 Report: Table 1-6(a)
2126-AB14
Hours of Service of Drivers138 11/13/08 11/19/08 Not included
Not included
2010 Report: Table 1-4
2126-AB26
Hours of Service 12/20/2012 12/27/2012 182-1,025 389 2013 Report: Table 1-6(a)
2127-AG51
Roof Crush Resistance 4/30/09 5/12/09 374-1,160 748-1,189
2010 Report: Table 1-4
2127-AJ10
Side Impact Protection Upgrade--FMVSS No. 214
8/28/07 9/11/07 736-1,058 401-1,051
2008 Report: Table 1-4
2127-AJ37
Reduced Stopping Distance Requirements for Truck Tractors
7/16/09 7/27/09 1,250-1,520 23-164 2010 Report: Table 1-4
2127-AJ61
Light Truck Average Fuel Economy Standards, Model Year 2008 and Possibly Beyond
3/28/06 4/6/06 847-1,035 666-754 2007 Report: Table 1-4
2127-AJ77
Electronic Stability Control (ESC)
3/23/07 4/6/07 5,987-11,282
913-917 2008 Report: Table 1-4
2127-AK23
Ejection Mitigation 12/23/10 1/19/11 1,500-2,375 419-1,373
2012 Report: Table 1-5(a)
136 The benefits and costs of this rule were misreported in Table A-1 of the 2011 Report to Congress on the Costs and Benefits of Federal Regulations and Unfunded Mandates on State, Local and Tribal Entities. The correct estimates are drawn from the OMB internal database, “ROCIS.” 137 This rule was vacated on Aug. 26, 2011, by the U.S Court of Appeals for the Seventh Circuit. (Benefits: $165-170 million; Costs: $126-129 million) 138 As explained in the 2010 Report, the benefits and costs of this rule are not included in the benefit and cost totals for the 10-year aggregate.

76
RIN Title Completed Published Benefits Costs Source of Estimates
2127-AK29
Passenger Car and Light Truck Corporate Average Fuel Economy Model Year 2011
3/24/09 3/30/09 857-1,905 650-1,910
2010 Report: Table 1-4
2130-AC03
Positive Train Control [75 FR 2597]
12/30/09 1/15/10 34-37 519-1,264
2011 Report: Table A-1
2130-AC27
Positive Train Control Systems Amendments (RRR)
5/9/2012 5/14/2012 34-65 1-3 2013 Report: Table 1-6(a)
2137-AE15
Pipeline Safety: Distribution Integrity Management [74 FR 63906]
11/6/09 12/4/09 97-145 92-97 2011 Report: Table A-1
2137-AE25
Pipeline Safety: Standards for Increasing the Maximum Allowable Operating Pressure for Gas Transmission Pipelines
10/2/08 10/17/08 85-89 13-14 2010 Report: Table 1-4
2130-AB84
Regulatory Relief for Electronically Controlled Pneumatic Brake System Implementation
8/29/08 10/16/08 828-884 130-145 2009 Report: Table 1-4
Department of Transportation and Environmental Protection Agency
2127-AK50: 2060-AP58
Light-Duty Greenhouse Gas Emission Standards and Corporate Average Fuel Economy Standards [75 FR 25323]
3/31/10 5/7/10 3.9-18.2 thousand
1.7-4.7 thousand
2011 Report: Table 1-5(a)
2127-AK74; 2060-AP61
Commercial Medium- and Heavy-Duty On-Highway Vehicles and Work Truck Fuel Efficiency Standards
8/8/11 9/15/11 2,150-2,564 331-496 2012 Report: Table 1-5(a)
2127-AK79;2060-AQ54
Joint Rulemaking to Establish 2017 and Later Model Year Light Duty Vehicle GHG Emissions and CAFE Standards
8/27/12 10/15/12 21,220-28,822
5,305-8,828
2013 Report: Table 1-6(a)
Environmental Protection Agency 2040-AD38
National Primary Drinking Water Regulations: Stage 2 Disinfectants and Disinfection Byproducts Rule
11/23/05 1/4/06 598-1,473 74-76 2007 Report: Table 1-4
2040-AF11
Water Quality Standards (Numeric Nutrient Criteria) for Florida's Lakes and Flowing Waters
11/18/10 12/6/10 23 111-169 2012 Report: Table 1-5(a)
2050-AG16
Revisions to the Spill Prevention, Control, and Countermeasure (SPCC) Rule [74 FR 58784]
10/23/09 11/13/09 0 (78-85) 2011 Report: Table A-1
2050-AG23
Oil Pollution Prevention; Spill Prevention, Control, and Countermeasure (SPCC) Requirements--Amendments
11/15/06 12/26/06 0 (86-148) 2008 Report: Table 1-4
2050-AG31
Definition of Solid Wastes Revisions
9/17/08 10/30/08 16-285 14 2009 Report: Table 1-4

77
RIN Title Completed Published Benefits Costs Source of Estimates
2050-AG50
Oil Pollution Prevention: Spill Prevention, Control, and Countermeasure Rule Requirements - Amendments for Milk Containers
4/8/11 4/18/11 0 (118-121)
2012 Report: Table 1-5(a)
2060-AI44
Review of the National Ambient Air Quality Standards for Particulate Matter139
9/21/06 10/17/06 Not Included Not Included
2007 Report: Table 1-4
2060-AK70
Control of Hazardous Air Pollutants From Mobile Sources
2/8/07 2/26/07 2,310-2,983 298-346 2008 Report: Table 1-4
2060-AK74
Clean Air Fine Particle Implementation Rule
3/28/07 4/25/07 18,833-167,408
7,324 2008 Report: Table 1-4
2060-AM06
Control of Emissions from New Locomotives and New Marine Diesel Engines Less Than 30 Liters per Cylinder
2/14/08 5/6/08 4,145-14,550 295-392 2009 Report: Table 1-4
2060-AM34
Control of Emissions From Nonroad Spark-Ignition Engines and Equipment
8/18/08 10/8/08 899-4,762 196-200 2009 Report: Table 1-4
2060-AM82
Standards of Performance for Stationary Compression Ignition Internal Combustion Engines
6/28/06 7/11/06 679-757 56 2007 Report: Table 1-4
2060-AN24
Review of the National Ambient Air Quality Standards for Ozone
3/12/08 3/27/08 1,581-14,934 6,676-7,730
2009 Report: Table 1-4
2060-AN72
Petroleum Refineries--New Source Performance Standards (NSPS)--Subpart J
4/30/08 6/24/08 176-1,669 27 2009 Report: Table 1-4
2060-AN72
Petroleum Refineries--New Source Performance Standards (NSPS)--Subparts J and Ja
5/7/2012 9/12/2012 240-580 (79)
2060-AN83
Review of the National Ambient Air Quality Standards for Lead
10/15/08 11/12/08 455-5,203 113-2,241
2010 Report: Table A-1
2060-AO15
National Emission Standards for Hazardous Air Pollutants from the Portland Cement Manufacturing Industry and Standards of Performance for Portland Cement Plants [75 FR 54970]
8/6/10 9/9/10
6,074-16,317 839-861 2011 Report: Table A-1
2060-AO47
Review of the National Ambient Air Quality Standards for Particulate Matter
12/14/12 1/15/13 2,980-7,532 44-290 2014 Report: Table 1-6(a)
2060-AO48
Review of the National Ambient Air Quality Standards for Sulfur Dioxide [75 FR 35519]
6/2/10 6/22/10 2,809-38,628 334-2,019
2011 Report: Table A-1
139 Although promulgated in 2006, this rule was removed from the 10-year aggregate estimates to avoid double counting benefits and costs with implementing regulations. (Benefits: $3,837-39,879: Costs: 2,590-2,833.)

78
RIN Title Completed Published Benefits Costs Source of Estimates
2060-AP36
National Emission Standards for Hazardous Air Pollutants for Reciprocating Internal Combustion Engines (Diesel) [75 FR 9647]
2/17/10 3/3/10 709-1,920
296-311 2011 Report: Table A-1
2060-AP50
Cross State Air Pollution Rule (CAIR Replacement Rule)
7/1/11 8/8/11 20,467-59,697
691 2012 Report: Table 1-5(a)
2060-AP52
National Emission Standards for Hazardous Air Pollutants From Coal- and Oil-Fired Electric Utility Steam Generating Units and Standards of Performance for Electric Utility Steam Generating Units
12/16/11 2/16/12 28,143-76,753
8,187 2013 Report: Table 1-6(a)
2060-AP76
Oil and Natural Gas Sector--New Source Performance Standards and National Emission Standards for Hazardous Air Pollutants
4/17/12 8/16/12 155 142 2013 Report: Table 1-6(a)
2060-AQ13
National Emission Standards for Hazardous Air Pollutants for Reciprocating Internal Combustion Engines--Existing Stationary Spark Ignition (Gas-Fired) [75 FR 51569]
8/10/10 8/20/10 380-992 202-209 2011 Report: Table A-1
2060-AQ58
Reconsideration of Final National Emission Standards for Hazardous Air Pollutants for Reciprocating Internal Combustion Engines
1/14/13 1/30/13 617-1,697 404 2014 Report: Table 1-6(a)
2060-AR13
National Emission Standards for Hazardous Air Pollutants for Major Sources: Industrial, Commercial, and Institutional Boilers and Process Heaters; Proposed Reconsideration
12/20/12 1/31/13 21.103-56,555
1,182-1,351
2014 Report: Table 1-6(a)
2070-AC83
Lead-Based Paint; Amendments for Renovation, Repair and Painting
3/28/08 4/22/08 618-1,612 366-400 2009 Report: Table 1-4
2070-AJ55
Lead; Amendment to the Opt-out and Recordkeeping Provisions in the Renovation, Repair, and Painting Program [75 FR 24802]
4/22/10 5/6/10 785-2,953 267-290 2011 Report: Table A-1
2040-AE95
Criteria and Standards for Cooling Water Intake Structures
5/19/14 8/15/14 24-27 223-241 2015 Report: Table A-1
2060-AQ86
Control of Air Pollution From Motor Vehicles: Tier 3 Motor Vehicle Emission and Fuel Standards
3/3/14 4/28/14 3,199-10,638 1,063 2015 Report: Table A-1
( ) indicates negative.

79

80
APPENDIX B: THE BENEFITS AND COSTS OF FISCAL YEAR 2005 MAJOR RULES
Table B-1 lists rules that were omitted from the ten-year running totals presented in Chapter I of our Report to Congress. Rules for which OMB concluded review between October 1, 2004, and September 30, 2005, were included in Chapter I of the 2015 Report as part of the ten-year totals, but are not included in the 2016 Report.
While we limit the Chapter I accounting statement to regulations issued over the previous ten years, we have included in this Appendix the benefits and cost estimates provided for the economically significant rulemakings that have been covered in the previous year’s Report in order to provide transparency.
Table B-1: Estimates of Annual Benefits and Costs of Major Federal Rules October 1, 2004 - September 30, 2005
(millions of 2001 dollars)
Agency RIN Title OMB Review Completed
Benefits Costs
USDA 0579-AB73 Bovine Spongiform Encephalopathy: Minimal Risk Regions and Importation of Commodities
12/29/04 572-639 557-623
USDA 0579-AB81 Mexican Hass Avocado Import Program
11/23/04 122-184 71-114
HHS 0910-AC34 Amendments to the Performance Standard for Diagnostic X-Ray Systems and Their Major Components
5/27/05 87-2,549 30
HHS 0938-AN95 Immunization Standard for Long Term Care Facilities (CMS-3198-P)
9/30/05 11,000 6
DOJ 1117-AA60 Electronic Orders for Schedule I and II Controlled Substances
3/18/05 275 108-118
DOT 2126-AA90 Hours of Service of Drivers 8/16/05 19 (235) DOT 2127-AH09 Upgrade of Head Restraints 11/23/04 111-139 83 DOT 2127-AI91 Rear Center Lap/Shoulder Belt
Requirement--Standard 208 11/30/04 188-236 162-202
DOT 2127-AJ23 Tire Pressure Monitoring Systems 3/31/05 1,012-1,316 938-2,282 EPA 2040-AD37 National Primary Drinking Water
Regulations: Long Term 2 Enhanced Surface Water Treatment Rule
6/22/05 262-1,785 89-144
EPA 2060-AJ31 Clean Air Visibility Rule 6/15/05 2,302-8,153 314-846 EPA 2060-AJ65 Clean Air Mercury Rule--Electric
Utility Steam Generating Units140 3/15/05 not included not included
140 On February 8, 2008, the D.C. Circuit vacated EPA's rule removing power plants from the Clean Air Act list of sources of hazardous air pollutants. At the same time, the Court vacated the Clean Air Mercury Rule. Thus, we excluded this rule from the previous Report’s 10-year aggregates. (Benefits: $1-2 million; Costs: $500 million)

81
EPA 2060-AL76 Clean Air Interstate Rule Formerly Titled: Interstate Air Quality Rule141
3/10/05 11,947-151,769
1,716-1,894
141 The relationship between this rule and EPA’s subsequently issued Cross-State Air Pollution Rule has been covered extensively in previous Reports.

82
APPENDIX C: INFORMATION ON THE REGULATORY ANALYSES FOR MAJOR RULES BY INDEPENDENT AGENCIES
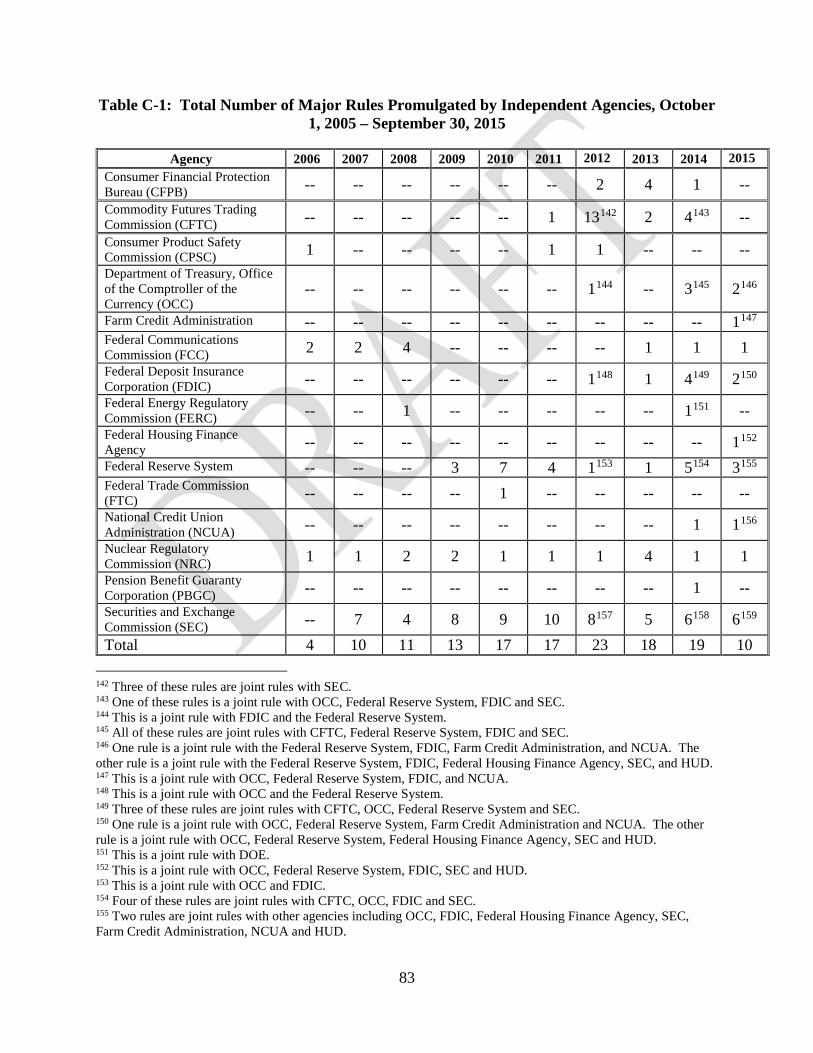
83
Table C-1: Total Number of Major Rules Promulgated by Independent Agencies, October 1, 2005 – September 30, 2015
Agency 2006 2007 2008 2009 2010 2011 2012 2013 2014 2015 Consumer Financial Protection Bureau (CFPB) -- -- -- -- -- -- 2 4 1 -- Commodity Futures Trading Commission (CFTC) -- -- -- -- -- 1 13142 2 4143 -- Consumer Product Safety Commission (CPSC) 1 -- -- -- -- 1 1 -- -- -- Department of Treasury, Office of the Comptroller of the Currency (OCC)
-- -- -- -- -- -- 1144 -- 3145 2146
Farm Credit Administration -- -- -- -- -- -- -- -- -- 1147 Federal Communications Commission (FCC) 2 2 4 -- -- -- -- 1 1 1 Federal Deposit Insurance Corporation (FDIC) -- -- -- -- -- -- 1148 1 4149 2150 Federal Energy Regulatory Commission (FERC) -- -- 1 -- -- -- -- -- 1151 -- Federal Housing Finance Agency -- -- -- -- -- -- -- -- -- 1152 Federal Reserve System -- -- -- 3 7 4 1153 1 5154 3155 Federal Trade Commission (FTC) -- -- -- -- 1 -- -- -- -- -- National Credit Union Administration (NCUA) -- -- -- -- -- -- -- -- 1 1156 Nuclear Regulatory Commission (NRC) 1 1 2 2 1 1 1 4 1 1 Pension Benefit Guaranty Corporation (PBGC) -- -- -- -- -- -- -- -- 1 -- Securities and Exchange Commission (SEC) -- 7 4 8 9 10 8157 5 6158 6159 Total 4 10 11 13 17 17 23 18 19 10
142 Three of these rules are joint rules with SEC. 143 One of these rules is a joint rule with OCC, Federal Reserve System, FDIC and SEC. 144 This is a joint rule with FDIC and the Federal Reserve System. 145 All of these rules are joint rules with CFTC, Federal Reserve System, FDIC and SEC. 146 One rule is a joint rule with the Federal Reserve System, FDIC, Farm Credit Administration, and NCUA. The other rule is a joint rule with the Federal Reserve System, FDIC, Federal Housing Finance Agency, SEC, and HUD. 147 This is a joint rule with OCC, Federal Reserve System, FDIC, and NCUA. 148 This is a joint rule with OCC and the Federal Reserve System. 149 Three of these rules are joint rules with CFTC, OCC, Federal Reserve System and SEC. 150 One rule is a joint rule with OCC, Federal Reserve System, Farm Credit Administration and NCUA. The other rule is a joint rule with OCC, Federal Reserve System, Federal Housing Finance Agency, SEC and HUD. 151 This is a joint rule with DOE. 152 This is a joint rule with OCC, Federal Reserve System, FDIC, SEC and HUD. 153 This is a joint rule with OCC and FDIC. 154 Four of these rules are joint rules with CFTC, OCC, FDIC and SEC. 155 Two rules are joint rules with other agencies including OCC, FDIC, Federal Housing Finance Agency, SEC, Farm Credit Administration, NCUA and HUD.

84
Table C-2: Total Number of Major Rules with Some Information on Benefits or Costs Promulgated by Independent Agencies, October 1, 2005- September 30, 2015160
Agency 2006 2007 2008 2009 2010 2011 2012 2013 2014 2015 Consumer Financial Protection Bureau (CFPB) -- -- -- -- -- -- 2 4 1 -- Commodity Futures Trading Commission (CFTC) -- -- -- -- -- 1 9161 1 2 -- Consumer Product Safety Commission (CPSC) 1 -- -- -- -- 0 0 -- -- -- Department of Treasury, Office of the Comptroller of the Currency (OCC)
-- -- -- -- -- -- 0 -- 1162 2
Farm Credit Administration -- -- -- -- -- -- -- -- -- 0 Federal Communications Commission (FCC) 0 0 0 -- -- -- -- 0 0 0 Federal Deposit Insurance Corporation (FDIC) -- -- -- -- -- -- 0 1 1163 1 Federal Energy Regulatory Commission (FERC) -- -- 1 -- -- -- -- -- 0164 -- Federal Housing Finance Agency -- -- -- -- -- -- -- -- -- 1 Federal Reserve System -- -- -- 0 2 0 0 0 2165 2 Federal Trade Commission (FTC) -- -- -- -- 1 -- -- -- -- -- National Credit Union Administration (NCUA) -- -- -- -- -- -- -- -- 0 0 Nuclear Regulatory Commission (NRC) -- -- 1 1 -- -- -- 1 -- -- Pension Benefit Guaranty Corporation (PBGC) -- -- -- -- -- -- -- -- 1 -- Securities and Exchange Commission (SEC) -- 7 4 8 9 9 7166 5 4 5 Total 1 7 6 8 11 10 16 7 11 9
156 This is a joint rule with OCC, Federal Reserve System, FDIC, and Farm Credit Administration. 157 Three of these rules are joint rules with CFTC. 158 Two of these rules are joint rules CFTC, OCC, Federal Reserve System, and FDIC. 159 One rule is a joint rule with OCC, Federal Reserve System, FDIC, Federal Housing Finance Agency and HUD. 160 Table C-2 excludes all fee assessment rules promulgated by independent agencies. FCC promulgated six fee assessment rules from 1997 through 2002. NRC promulgated statutorily mandated fee assessment rules from 1997 through 2015. 161 Two of these rules are joint rules with SEC. 162 This rule is a joint rule with FDIC and Federal Reserve System. 163 This rule is a joint rule with OCC and Federal Reserve System. 164 This is a joint rule with DOE. 165 These rules are joint rules with OCC, and FDIC. 166 Two of these rules are joint rules with CFTC.

85
APPENDIX D: REFERENCES
Aaronson, Daniel and Darren Lubotsky. “The Affordable Care Act and the Labor Market.” Chicago Fed Letter No. 323, June 2014. Acemoglu, Daron and Joshua D. Angrist. “Consequences of Employment Protection? The Case of the Americans with Disabilities Act.” Journal of Political Economy, 2001, 109(5), 915-957. Adler, Matthew. Well-being and Fair Distribution: Beyond Cost-Benefit Analysis, 2011, Oxford: Oxford University Press. Aldy, Joseph E., and William Pizer. “The Employment and Competitive Impacts of Power-Sector Regulations.” Does Regulation Kill Jobs? Cary Coglianese, Adam M. Finkel and Christopher Carrigan, eds., 2013, Philadelphia, Pennsylvania: University of Pennsylvania. Allcott, Hunt and Michael Greenstone. “Is There an Energy Efficiency Gap?” Journal of Economic Perspectives, 2012, 26(1): 3-28. Allcott, Hunt and Nathan Wozny. “Gasoline Prices, Fuel Economy, and the Energy Paradox.” The Review of Economics and Statistics, 2014, 96(5): 779-795. Ashenfelter, Orley and Alan Krueger. “Estimates of the Economic Return to Schooling from a New Sample of Twins.” The American Economic Review, 1994, 84(5). Balleisen, Edward and David Moss. Government and Markets: Toward a New Theory of Regulation, 2009, Cambridge, U.K.: The Tobin Project. Bartik, Timony J. “Including Jobs in Benefit-Cost Analysis.” Annual Review of Resource Economics, 2012, 4(1), 55-73. Baum, Charles L. “The Effect of State Maternity Leave Legislation and the 1993 Family and Medical Leave Act on Employment and Wages.” Labour Economics, 2003, 10(5), 573-596. Baum, Charles L. and Christopher J. Ruhm. “The Effects of Paid Family Leave in California on Labor Market Outcomes” National Bureau of Economic Research working paper, 2013, no. 1974. Becker, Randy. “Air Pollution Abatement Costs under the Clean Air Act: Evidence from the PACE Survey.” Journal of Environmental Economics and Management 50.1 (2005): 144-189. Becker, Randy, Carl Pasurka Jr., and Ronald Shadbegian. “Do Environmental Regulations Disproportionately Affect Small Businesses? Evidence from the Pollution Abatement Costs and Expenditures Survey.” Journal of Environmental Economics and Management, 2013, 523-538. Becker, Randy and Vernon Henderson. “Effects of Air Quality Regulation on Polluting Industries.” Journal of Political Economy, 2000, 108(2), 379-421.

86
Bento, Antonio M., Shanjun Li, and Kevin Roth. “Is There an Energy Paradox in Fuel Economy? A Note on the Role of Consumer Heterogeneity and Sorting Bias.” Economic Letters 115 (2012): 44-48. Berman, Eli and Linda T.M. Bui. “Environmental Regulation and Labor Demand: Evidence from the South Coast Air Basin.” Journal of Public Economics, 2001, 79: 265-295. Berman, Eli and Linda T.M. Bui. “Environmental Regulation and Productivity: Evidence from Oil Refineries.” The Review of Economics and Statistics, 2001, 83(3), 498-510. Bertrand, Marianne and Francis Kramarz. “Does Entry Regulation Hinder Job Creation? Evidence from the French Retail Industry.” The Quarterly Journal of Economics, 2002, 117(4), 1369-1413. Blanchard, Olivier and Francesco Giavazzi. “Macroeconomic Effects of Regulation and Deregulation in Goods and Labor Markets.” The Quarterly Journal of Economics, 2003, 118(3), 879-907. Bloom, David, Canning, David and Jaypee Sevilla. “The Effect of Health on Economic Growth: A Production Function Approach,” World Development, 2004, 32:1: 1-13. Brown, Charles. “Minimum wages, employment, and the distribution of income, ch. 32, p. 2101-2163 in Ashenfelter, O. and Card, D. eds., Handbook of Labor Economics, vol. 3, Part B, Elsevier, 1999. Brunnermeier, Smita B., and Arik Levinson. “Examining the Evidence on Environmental Regulations and Industry Location.” The Journal of Environment and Development, 2004, 13:1, 6-41. Card, David and Alan B. Krueger. Myth and Measurement: The New Economics of the Minimum Wage, Princeton University Press, 1995. Carpenter, Dan. “Confidence Games: How Does Regulation Constitute Markets?” in Edward Balleisen and David Moss, eds., Government and Markets: Toward a New Theory of Regulation, (New York: Cambridge University Press, 2009). Carpenter, Dan. “Protection without Capture: Dynamic Product Approval by a Politically Responsive, Learning Regulator,” American Political Science Review, 2004, 98:4, 613-631. Carpenter, Dan and M.M. Ting. “Regulatory Errors with Endogenous Agendas,” American Journal of Political Science 51:4 (2007), pp. 835-853. Chay, Kenneth and Michael Greenstone. “Does Air Quality Matter? Evidence from the Housing Market,” Journal of Political Economy, 2005, 113(2): 376-424.

87
Coglianese, Cary, Adam M. Finkel, and Christopher Carrigan, eds. Does Regulation Kill Jobs?, 2013, Philadelphia, Pennsylvania: University of Pennsylvania Press. Cohen, Daniel and Marcelo Soto. “Growth and Human Capital: Good Data, Good Results,” Journal of Economic Growth, 2007, 12: 51-76. Crain, W. Mark. The Impact of Regulatory Costs on Small Firms. Report to the Office of Advocacy, United States Small Business Administration, September 2005, available at www.sba.gov/advo/research/rs264tot.pdf. Crain, W. Mark and Thomas D. Hopkins. The Impact of Regulatory Costs on Small Firms. Report to the Office of Advocacy, United States Small Business Administration, 2001. Dawson, John W., and John J. Seater. “Federal Regulation and Aggregate Economic Growth,” Journal of Economic Growth, 2013, 18: 137-177. Dean, Thomas J., Robert L. Brown, and Victor Stango. “Environmental Regulation as a Barrier to the Formation of Small Manufacturing Establishments: A Longitudinal Examination.” Journal of Environmental Economics and Management, 2000, 40, 56-75. DeLiere, Thomas. “The Wage and Employment Effects of the Americans with Disabilities Act” The Journal of Human Resources, Vol. 35, No. 4, 2000, pp. 693-715. Djankov, Simeon, Rafael La Porta, Florencio Lopez-de-Silanes and Andrei Shleifer. “The Regulation of Entry,” Quarterly Journal of Economics, 2002, 107:1: 1-37. Environmental Protection Agency. “Valuing Mortality Risk Reductions for Environmental Policy: A White Paper.” Dec. 10, 2010. Available at: http://yosemite.epa.gov/ee/epa/eerm.nsf/vwAN/EE-0563-1.pdf/$file/EE-0563-1.pdf. Fӓre, Rolf, Shawna Grosskopf, Carl A. Pasurka, Jr., and Ronald J. Shadbegian. “Environmental Regulatory Rigidity and Employment in the Electric Power Sector.” Does regulation Kill Jobs? Cary Coglianese, Adam M. Findel, and Christopher Carrigan, eds., 2013, Philadelphia, Pennsylvania: University of Pennsylvania Press. Ferris, Ann, Ronald J. Shadbegian, and Ann Wolverton. “The Effect of Environmental Regulation on Power Sector Employment: Phase I of the Title IV SO2 Trading Program.” Journal of the Association of Environmental and Resource Economists, 2014, 1, 521-553. Ferris, Ann, and Al McGartland. “A Research Agenda for Improving the Treatment of Employment Impacts in Regulatory Impact Analysis.” Does Regulation Kill Jobs?, Cary Coglianese, Adam M. Finkel, and Christopher Carrigan, eds, 2013, Philadelphia, Pennsylvania: University of Pennsylvania Press. Giuliano, Laura. “Minimum Wage Effects on Employment, Substitution, and the Teenage Labor Supply: Evidence from Personnel Data “Journal of Labor Economics, 31(1) 2013, 155 – 194.

88
Gray, Wayne B. and Ronald Shadbegian. “Environmental Regulation, Investment Timing, and Technology Choice.” The Journal of Industrial Economics, 1998, 46(2), 235-256. Gray, Wayne and Ron Shadbegian. “Do the Job Effects of Regulations Differ with the Competitive Environment?” In Jobs and Regulation, edited by Cary Coglianese, Adam Finkel and Chris Carrigan. University of Pennsylvania Press. 2013. Gray, Wayne B., Ronald J. Shadbegian, Chunbei Wang, and Merve Meral. “Do EPA Regulations Affect Labor Demand? Evidence from the Pulp and Paper Industry.” Journal of Environmental Economics and Management, 2014, 68, 188-202. Greenstone, Michael. “The Impacts of Environmental Regulations on Industrial Activity: Evidence from the 1970 and 1977 Clean Air Act Amendments and the Census of Manufacturers.” Journal of Political Economy, 2002, 110(6), 1175-1219. Greenstone, Michael. “Toward a Culture of Persistent Regulatory Experimentation and Evaluation.” In New Perspectives on Regulation, David Moss and John Cisternino (Eds.). Cambridge, MA: The Tobin Project, Inc., 2009. Greenstone, Michael, John A. List and Chad Syverson. “The Effects of Environmental Regulation on the Competitiveness of U.S. Manufacturing.” U.S. Census Bureau Center for Economic Studies Discussion Paper (February 2011). Greenstone, Michael, Paul Oyer and Annette Vissing-Jorgensen. “Mandated Disclosure, Stock Returns, and the 1964 Securities Acts Amendments.” The Quarterly Journal of Economics 121(2): 399-460. 2006. Gruber, Jonathan. “The Incidence of Mandated Maternity Benefits.” American Economic Review, 1994, 84(3), 622-641. Hahn, Robert and John Hird, “The Costs and Benefits of Regulation: Review and Synthesis,” Yale Journal on Regulation 8 (1991), pp. 233-278. Hanna, Rema. “U.S. Environmental Regulation and FDI: Evidence from a Panel of U.S.-Based Multinational Firms,” American Economic Journal: Applied Economics, 2010, 2(3), 158-189. Harrington, Winston. “Grading Estimates of the Benefits and Costs of Federal Regulation: A Review of Reviews,” 33 tbl.7 (Res. for the Future, Discussion Paper No. RFF DP 06-39, Sept. 2006), available at http://ssrn.com/abstract=937357. Harrington, Winston, Richard D. Morgenstern and Peter Nelson. “On the Accuracy of Regulatory Cost Estimates.” Journal of Policy Analysis and Management, 2000, 19(2), 297-322. Haveman, Robert and John Krutilla. “Unemployment, Excess Capacity, and Benefit-Cost Investment Criteria.” The Review of Economics and Statistics 49(3): 382-392. August 1967.
89
Hopkins, Thomas D. Profiles of Regulatory Cost, Report to the Office of Advocacy, United States Small Business Administration, 1995. Jaffe, Adam B., et al. “Environmental Regulation and the Competitiveness of U.S. Manufacturing: What Does the Evidence Tell Us?” Journal of Economic Literature, 1995, 33(1), 132-163. Jaffe, Adam and Karen Palmer. “Environmental Regulation and Innovation: A Panel Data Study,” Review of Economics and Statistics 1997, 610-9. Jaffe, Adam B., and Robert N. Stavins. “The Energy-Efficiency Gap. What Does It Mean?” Energy Policy 22.10 (1994): 804-810. Jolls, Christine. “Accommodation Mandates.” Stanford Law Review, 2000, 53, 223-306. Jorgenson, Dale W. and Peter J. Wilcoxen. “Environmental Regulation and U.S. Economic Growth.” RAND Journal of Economics, 1990, 21(2), 314-340. Kahn, Lawrence M. “The Impact of Employment Protection Mandates on Demographic Temporary Employment Patterns: International Microeconomic Evidence.” The Economic Journal 117(521): F333-F356. June 2007. Kahn, Matthew E. “The Beneficiaries of Clean Air Act Regulation.” Regulation Magazine, 2001 24(1). Kahneman, Daniel, Alan Krueger, David Schkade, Nobert Schwarz and Arthur Stone. “Toward National Well-Being Accounts.” American Economic Review, 2004, 94(2), 429-434. Keller, Wolfgang, and Arik Levinson. “Pollution Abatement Costs and Foreign Direct Investment Inflows to U.S. States.” The Review of Economics and Statistics, 2002, 84(4), 691-703. Krueger, Alan B., ed. Measuring the Subjective Well-Being of Nations: National Accounts of Time Use and Well-Being. The University of Chicago Press, 2009. Krueger, Alan B., et al. “National Time Accounting: The Currency of Life.” Measuring the Subjective Well-Being of Nations: National Accounts of Time Use and Well-being, Alan B. Krueger, ed. Chicago: The University of Chicago Press, 2009, 9-86. Krueger, Alan B. and Mikael Lindahl. “Education for Growth: Why and For Whom?” Journal of Economic Literature, 2001, XXXIX, 1101-1136. Krupnick, Alan. “Mortality-risk Valuation and Age: Stated Preference Evidence.” Review of Environmental Economics and Policy, 2007,1(2), 261-282.
90
La Porta, Rafael, Florencio Lopez-de-Silanes, and Andrei Shleifer, “Corporate Ownership around the World,” Journal of Finance, 1999, 54, 471–517. Lanoie, Paul, Michel Patry, and Richard Lajeunesse, “Environmental Regulation and Productivity: Testing the Porter Hypothesis,” Journal of Productivity Analysis, 2008, 30, 121-8. Levinson, Arik, and M. Scott Taylor. “Unmasking the Pollution Haven Effect.” International Economic Review, 2008, 49(1), 223-254. Levinson, Arik. "A Direct Estimate of the Technique Effect: Changes in the Pollution Intensity of US Manufacturing 1990-2008." Journal of the Association of Environmental and Resource Economists, 2(1) March 2015, pp. 43-56. List, John A., Daniel L. Millimet, Per G. Fredriksson, and W. Warren McHone. “Effects of Environmental Regulations on Manufacturing Plant Births: Evidence from a Propensity Score Matching Estimator.” The Review of Economics and Statistics, 2003, 85(4), 944-952. Masur, Jonathan and Eric Posner. “Regulation, Unemployment, and Cost-Benefit Analysis.” Virginia Law Review 98(3) (2012): 579-634. Masur, Jonathan S., and Eric A. Posner. “Unemployment and Regulatory Policy.” Does Regulation Kill Jobs?, Cary Coglianese, Adam M. Finkel, and Christopher Carrigan, eds. Philadelphia: University of Pennsylvania Press, 2013. Miller, Wilhelmine, Lisa Robinson, and Robert S. Lawrence, eds. Valuing Health for Regulatory Cost-Effectiveness Analysis. National Academies Press, 2006. Moss, David and John Cisternino, eds., New Perspectives on Regulation, 2009. Cambridge, U.K.: The Tobin Project. National Research Council. Estimating the Public Health Benefits of Proposed Air Pollution Regulations. National Academies Press, 2002. National Research Council. Estimating Mortality Risk Reduction and Economic Benefits from Controlling Ozone Air Pollution. National Academies Press, 2008. Neumark, David and William L. Wascher. Minimum Wages. Cambridge: The MIT Press, 2008. Nordhaus, William D. “Principles of National Accounting For Non-Market Accounts.” National Bureau of Economic Research Paper (Feburary 6, 2004). Nordhaus, William D. and Edward C. Kokkelenberg. Nature’s Numbers: Expanding the National Economic Accounts to Include the Environment. National Academies Press, 1999. Peoples, James. “Deregulation and the Labor Market.” Journal of Economic Perspectives, 1998, 12(3), 111-130.
91
Rossin-Slater, Maya, Christopher J. Ruhm, and Jane Waldfogel. “The Effects of California's Paid Family Leave Program on Mothers’ Leave-Taking and Subsequent Labor Market Outcomes” Journal of Policy Analysis and Management, 2013, 32(2), 224-245. Ruhm, Christopher. “The Economic Consequences of Parental Leave Mandates: Lessons From Europe.” The Quarterly Journal of Economics, 1998, 113(1), 285-317. Schmalansee, R. and R. Stavins (2011). “A Guide to Economic and Policy Analysis for the Transport Rule.” White Paper. Boston, MA: Exelon Corp. Sen, Amartya. Development as Freedom, Oxford University Press, 1999. Sen, Amartya. Commodities and Capabilities, Oxford University Press, 1999. Seong, Si Kyung and John Mendeloff. “Assessing the Accuracy of OSHA’s Projections of the Benefits of New Safety Standards.” American Journal of Industrial Medicine, 2004, 45(4): 313-328. Stiglitz, Joseph, Amartya Sen, and Jean-Paul Fitoussi. Mismeasuring Our Lives: Why GDP Doesn’t Add Up. The New Press, 2010. Summers, Lawrence. “Some Simple Economics of Mandated Benefits.” The American Economic Review, 1989, 79(2), 177-183. Temple, Jonathan, “The New Growth Evidence,” Journal of Economic Literature, 1999, 37(1), 112-156. U.S. Environmental Protection Agency, Office of Air and Radiation. The Benefits and Costs of the Clean Air Act from 1990 and 2020. Final Report – Rev. A. (2011) van Stel, Andre, David Storey, and A. Roy Thurik, “The Effect of Business Regulations on Nascent and Young Business Entrepreneurship,” Small Business Economics, 2007, 28, 171-186. Waldfogel, Jane. “The Impact of the Family and Medical Leave Act.” Journal of Policy Analysis and Management, 1999, 18(2), 281-302. Walker, W. Reed. “Environmental Regulation and Labor Reallocation: Evidence from the Clean Air Act.” American Economic Review: Papers & Proceedings, 2011, 101, 442-447. Warner, Kenneth E., George A. Fulton, Peter Nicolas and Donald R. Grimes. “Employment Implications of Declining Tobacco Product Sales for the Regional Economies of the United States.” Journal of the American Medical Association, 1996, 275(16): 1241-1246. Xing, Yuqing, and Charles D. Kolstad. “Do Lax Environmental Regulations Attract Foreign Investment?” Environment and Resource Economics, 2002, 21, 1-22.

92