benefits of regenerative braking and eco driving for high ...405993/fulltext01.pdf · benefits of...
TRANSCRIPT
Postal address Royal Institute of Technology (KTH) Aeronautical and Vehicle Engineering Div. of Rail Vehicles SE-100 44 Stockholm, Sweden
Visiting address Teknikringen 8 Stockholm
Telephone +46 8 790 84 76 Fax +46 8 790 76 29
E-mail [email protected]
Benefits of regenerative braking and eco driving for high-speed trains
Energy consumption and brake wear
by
Mikael Sjöholm
Master of Science Thesis
TRITA AVE 2011:23 ISSN 1651-7660
ISRN KTH/AVE/RTM-11/23 ISBN 978-91-7415-920-2

Benefits of regenerative braking and eco driving for high-speed trains
i
Preface and acknowledgements
This is the outcome of my work at the Aeronautical and Vehicle Engineering programme at
the Royal Institute of Technology (KTH) in Stockholm, Sweden, constituting my Master of
Science thesis. It is part of “Gröna Tåget” (Eng: Green Train) research and development
programme and has been carried out in close cooperation with Bombardier Transportation,
Västerås.
I would like to thank my supervisor at KTH; Evert Andersson for his great efforts in this
study and for all the hours of his time this meant.
I would also like to thank my supervisor at Bombardier Transportation; Christina Larsson for
all her invaluable help.
Thanks also to Björn Roos at Bombardier Transportation for all his thoughts regarding the
final paper and presentations. Also all other great people at Bombardier Transportation who
have consistently been helping me with information and valuable advises.
Thanks also to the people at KTH; first and foremost my examiner Mats Berg for his valuable
assistance regarding the final paper and presentations. Thanks also to Ulf Olofsson and Saeed
Abbasi at the Department of Machine Design.
Big thanks to Tore Vernersson at the Department of Applied Mechanics at Chalmers.
To the people at SJ, especially Per Furukrona and Stefan Berndtsson, for answering my
questions, thank you.
The financial support from the Swedish Transport Administration (Trafikverket) is gratefully
acknowledged.
Many thanks to my mother and father, Yvonne and Bengt, for all your aid throughout my time
at KTH. Also big hugs to my sisters Marlene and Melinda and my brother Bobby for being
there for me.
Special thanks to my friends.
Last but not least I would like to thank the rose of my heart; Martina - for everything.
Stockholm, March 2011
Mikael Sjöholm

Benefits of regenerative braking and eco driving for high-speed trains
iii
Abstract
This study is a part of “Gröna Tåget” (Eng: “Green Train”) research and development
programme that is preparing for new high-speed trains in Sweden. The purpose of this study
is to investigate the effects of regenerative braking and eco driving with regard to energy
consumption and wear of the mechanical brakes.
New sophisticated “eco driving” systems could help train drivers to run as energy efficient
and economically as possible. Combined with more powerful drive systems this could lead to
more regenerated energy and reduced wear on mechanical brakes. The electric regenerative
brakes can thus be used as normal service brake with minimum time loss.
The first part of the study aims at developing a method to calculate wear on train brake pads.
This is done by using a reformulated version of Archard’s wear equation with a temperature
dependent wear coefficient and a temperature model to predict the brake pad temperature
during braking. The temperature model is calibrated using trustworthy data from a brake
system supplier and full-scale test results.
By performing simulations in the program STEC (Simulation of Train Energy Consumption),
energy consumption for different cases of high-speed train operations is procured and
significant data for the wear calculations are found. Simulations include both “normal driving
techniques” and “eco driving”. The driving styles were decided through interviews with train
drivers and experts on energy optimized driving systems.
The simulations show that more powerful drive systems reduce both energy consumption and
travel time by permitting higher acceleration and energy regeneration while braking.
Calculations show that since the electric motors could carry out more of the braking the wear
of the mechanical brakes becomes lower.
Eco driving techniques can help to further reduce the energy consumption and mechanical
brake wear. This driving style can require some time margins though, since it takes slightly
longer time to drive when using coasting and avoiding speed peaks. However, if used
properly this should not have to affect the actual travel time, partly because some time
margins are always included in the timetable.
Even if new, more powerful, trains would have the ability to reduce energy consumption and
brake wear it is also necessary to have an appropriate slip control system for the electric
brakes, making it possible to use them also under slippery conditions. In this context it is
important that the adhesion utilization is modest, about 12 – 15 % for speeds up to 100 km/h
and lower at higher speeds.

Benefits of regenerative braking and eco driving for high-speed trains
v
Sammanfattning
Denna studie är en del av forsknings- och utvecklingsprogrammet “Gröna Tåget” (Eng: Green
Train) som förbereder för nya höghastighetståg i Sverige. Syftet med detta arbete är att
undersöka vilka effekter som återmatande broms och ”eco driving” har på
energiförbrukningen och slitaget på de mekaniska bromsarna.
Nya sofistikerade system för ”eco driving” kan hjälpa tågförare att köra så energisnålt och
ekonomiskt som möjligt. Detta i kombination med kraftfulla drivsystem (hög effekt) kan leda
till att man kan återmata mera energi och minska slitaget på det mekaniska bromssystemet.
Elektrisk återmatande broms kan då användas som normal driftsbroms med minimal
tidsförlust.
Den första delen av studien syftar till att utveckla en metod för att beräkna slitaget på tågens
bromsbelägg. Detta görs genom att använda en omformulerad variant på Archards
slitageekvation med en temperaturberoende slitagekoefficient och en temperaturmodell för att
approximativt kunna beräkna beläggens temperatur vid inbromsning. Temperaturmodellen
kalibreras med hjälp av trovärdiga data från en bromssystemleverantör och genom ett
fullskaletest.
Genom att göra simuleringar i programmet STEC (Simulation of Train Energy Consumption)
beräknades energiförbrukning och körtider för olika intressanta körfall och viktiga data för
slitageberäkningarna togs fram. Simuleringarna inkluderade både ”normal körstil” och ”eco
driving”. De olika körstilarna togs fram med hjälp av en enkätundersökning bland tågförare
och intervjuer med experter på energioptimerande körsystem.
Simuleringarna visar att både energiförbrukningen och restiden kan minskas med hjälp av
högre effekt i drivsystemet. Detta medger högre acceleration och retardation och därigenom
mer energiåtermatning vid bibehållen bromssträcka och bromstid. Beräkningar visar också att
då de elektriska återmatande bromsarna kan utföra mer av bromsarbetet så sänks slitaget på de
mekaniska bromsarna.
Teknik för ”eco driving” kan ytterligare hjälpa till att minska energiförbrukningen och det
mekaniska bromsslitaget. Det fordrar dock att man har en viss tidsmarginal då det tar något
längre tid att köra när man utnyttjar frirullning och undviker hastighetstoppar. Använt på rätt
sätt behöver dock inte detta påverka den faktiska restiden, delvis på grund av att vissa
tidsmarginaler alltid finns inkluderade i tidtabellen.
Även om nya tåg, med hög driveffekt, skulle ha möjligheten att sänka både energiförbrukning
och bromsslitage så är det också nödvändigt att ha reglersystem som motverkar slirning även
vid elektrisk broms. De regenerativa bromsarna bör fungera tillfredsställande även när spåret
inte är torrt. Det är i detta sammanhang också viktigt att adhesionsutnyttjningen vid elektrisk
bromsning är modest, förslagsvis 12 – 15 % i hastigheter upp till ca 100 km/h och lägre vid
högre hastigheter.

Benefits of regenerative braking and eco driving for high-speed trains
vii
Table of contents
Preface and acknowledgements ........................................................................................... i
Abstract............................................................................................................................... iii
Sammanfattning ...................................................................................................................v
Table of contents ................................................................................................................ vii
Nomenclature...................................................................................................................... ix
Definitions and explanations ................................................................................................x
Abbreviations and names .................................................................................................. xii
1. Introduction ......................................................................................................................1
Background .....................................................................................................................1 Purpose ...........................................................................................................................1
Objectives .......................................................................................................................1 Limitations ......................................................................................................................2
Methods ..........................................................................................................................2 Further studies ................................................................................................................2
2. General information concerning brake wear ..................................................................3
2.1 General background ......................................................................................................3
2.2 Existing wear models ....................................................................................................4 2.3 Tribology and third body ..............................................................................................7
3. Model for brake pad wear ................................................................................................8
3.1 Pad material and temperature dependence .....................................................................8 3.2 Temperature calibration ................................................................................................8
3.3 Temperature calculations ............................................................................................ 11 3.4 Final wear model ........................................................................................................ 12
4. Simulation software (STEC) .......................................................................................... 13
4.1 Input ........................................................................................................................... 13 4.2 Output......................................................................................................................... 13
5. Train driver survey and review...................................................................................... 14
6. Trains and operational cases .......................................................................................... 16
6.1 Train specifications ..................................................................................................... 16 X2 ................................................................................................................................. 17
GT-250 and GT-250 Regional ....................................................................................... 17 GT-VHST ...................................................................................................................... 18
Traction force vs. speed ................................................................................................. 18 6.2 Braking ....................................................................................................................... 20
6.3 Electric supply system ................................................................................................ 22 6.4 Operational scenarios .................................................................................................. 23
7. Driving styles .................................................................................................................. 26
7.1 “Normal” driving style ................................................................................................ 26
7.2 Eco driving ................................................................................................................. 26
8. Calculation of brake wear .............................................................................................. 28
8.1 Brake pad temperatures and wear coefficients ............................................................. 28
8.2 Wear contribution for one blended braking sequence .................................................. 29
9. Simulation results ........................................................................................................... 30
9.1 X2 on “Västra stambanan” .......................................................................................... 31
9.2 GT-250 (7200 kW) on “Västra stambanan” ................................................................. 32 9.3 GT-250 (5040 kW) on “Västra stambanan” ................................................................. 33
viii
9.4 GT-250 Regional (7200 kW) on “Västra stambanan regional” .................................... 34
9.5 GT-250 Regional (5040 kW) on “Västra stambanan regional” .................................... 35 9.6 GT-VHST (9000 kW) on “Götalandsbanan” ............................................................... 36
9.7 GT-VHST (6300 kW) on “Götalandsbanan” ............................................................... 37
10. Graphical presentation ................................................................................................. 38
11. Conclusions and discussion .......................................................................................... 42
References ........................................................................................................................... 44
Appendix A ...................................................................................................................... A-1
Survey regarding train driving styles ........................................................................... A-1
Appendix B ....................................................................................................................... B-1
X2 (up to 4000 kW) ..................................................................................................... B-1
GT-250 (7200 kW) ...................................................................................................... B-2
GT-250 (5040 kW) ...................................................................................................... B-3
GT-250 Regional (7200 kW) ........................................................................................ B-4
GT-250 Regional (5040 kW) ........................................................................................ B-5
GT-VHST (9000 kW) ................................................................................................... B-6
GT-VHST (6300 kW) ................................................................................................... B-7
Benefits of regenerative braking and eco driving for high-speed trains
ix
Nomenclature
In order of appearance
V Wear volume [m3]
s Sliding distance [m]
FT Tangential friction force [N]
τ Constant that characterizes the shear stress of the sliding bodies
ΔW Wear [m3]
k Wear rate coefficient [m3/Nm]
FN Contact normal force [N]
v Speed [m/s]
t Sliding time [s]
a, b, c Friction material specific parameters
T Operative temperature [°C]
T* Melting point of the brake pad material [°C]
P1, P2, P3 Parameters related to the friction coefficient of the material
K Dimensionless wear coefficient
Hs Hardness of the softer material [N/m2] (Vicker’s hardness test)
A Area [m2]
Wear displacement [m]
Wear displacement rate [m/s]
vM Mean value of slide rate [m/s]
tr Running time [s]
Wear rate [m/s]
p Contact pressure [Pa]
kw Wear coefficient
E Mechanical brake energy [J]
k0 Wear coefficient at reference temperature
Tcrit Temperature from which the wear increases exponentially [°C]
H Heaviside function
c1, c2, c3 Dimensionless constants
TP Brake pad temperature [°C]
cSB Start brake coefficient
cSL Start leakage coefficient
tb Time of braking [s]
ts Start of braking [s]
td Time delay [s]
TPE Achieved temperature at end of braking [°C]
cEL End leakage coefficient
te End of braking [s]
Fr Running resistance [N]
A, B, C Parameters related to the running resistance
Ft Traction force [N]
at Train acceleration [m/s2]
me Equivalent mass [kg]
P Power [W]
x
Definitions and explanations
In alphabetical order
Adhesion Part of friction between wheel and rail that can be
used for traction or braking.
Adhesive mass Part of train mass supported by driven (powered)
axles.
Brake disc A disc that is usually mounted on the wheel axle or
the wheel itself, used in combination with a brake
pad in order to brake the train.
Brake pad Part of disc brake system that by a link mechanism is
pressed against the brake disc. When pressed against
the disc it produces friction and a brake force.
Catenary Cable over the track that supplies trains with electric
power via the current collector (pantograph) on the
train roof.
Coasting Running the train with no tractive or brake force.
Degree of regeneration Percentage of full regeneration since it is sometimes
not possible for the train to regenerate all available
power back to the catenary.
Eco driving In the context of this study it is an eco-efficient
driving style focused on minimizing, or reducing,
energy consumption and brake wear, while still
trying to keep the timetable.
Load factor Relation between the number of passenger-km and
the offered number of seat-km.
Motor coach Type of train with no locomotive; instead the traction
equipment is distributed throughout the train.
Pantograph Device that is collecting electrical current and
voltage from the overhead wiring (also known as
catenary). Usually located on the roof of the train.
Regeneration In the context of this study it is the percentage of the
accumulated input energy regenerated to the
catenary.
Regenerative braking Using the electric motors as generators, transforming
the train’s kinetic energy to electricity and, with the
exception of losses, feed it back to the catenary.

Benefits of regenerative braking and eco driving for high-speed trains
xi
Speed peak In the context of this study it is when accelerating
right before a speed reduction or stop.
Wear The loss or displacement of material from a solid
surface due to mechanical action.
Wear index In the context of this study it reflects the relative
brake pad wear per seat-km.
xii
Abbreviations and names
In alphabetical order
ATP/ATC Automatic Train Protection system that applies the
brakes of the train automatically if the driver does
not apply brakes in due time before a stop or speed
restriction. The Swedish ATP system is called ATC
(Automatic Train Control).
Bombardier Transportation Train supplier.
(www.bombardier.com)
EMU Electrical Multiple Unit, train with the traction
equipment distributed amongst the coaches.
ERTMS European Rail Transport Management System, an
initiative within the European Union to create a
European standard for train control and command
systems.
ETCS European Train Control System, a train protection
system for in-cab control and signalling.
Green Train Swedish “Gröna Tåget” research and development
programme which prepares for high-speed trains in
Sweden and the Nordic countries.
(www.gronataget.se)
GT Abbreviation for ”Green Train” or ”Gröna Tåget”.
GT-250 Train concept in the Green Train research
programme with top speed of 250 km/h, normally
with car body tilt.
GT-VHST Very High-Speed Train; concept in the Green Train
research programme with top speed of 280 – 320
km/h.
KTH Royal Institute of Technology (Kungliga Tekniska
Högskolan), Stockholm, Sweden.
(www.kth.se)
Regina An electrically powered motor coach train (EMU) for
fast regional passenger services, operating in
different areas of Sweden.
SJ AB Swedish train operator.
(www.sj.se)
Benefits of regenerative braking and eco driving for high-speed trains
xiii
STEC Simulation of Train Energy Consumption.
Simulation software for calculating train energy
consumption and running times.
TGV Train á Grande Vitesse, French high-speed train.
Trafikverket The Swedish Transport Administration.
(www.trafikverket.se)
UIC International Union of Railways.
X2 (X2000) High-speed train, using a tilting car body allowing
higher speed on Swedish conventional main lines.
Top speed of 210 km/h, utilized at maximum 200
km/h.


Benefits of regenerative braking and eco driving for high-speed trains
1
1. Introduction
Background
”Gröna Tåget” (Eng. “Green Train”) is a research and development programme preparing for
future high-speed trains in Sweden. The Division of Rail Vehicles at the Royal Institute of
Technology (KTH) is actively participating in this project together with the industry
(Bombardier Transportation), the Swedish Transport Administration (Trafikverket, former
Banverket), SJ AB and other actors.
Trains have, among other benefits, the advantage of being able to regenerate energy to the
feeding power lines (known as catenaries) when braking. This saves energy and reduces wear
on the mechanical brakes.
The electric regenerative brakes used by the trains have a great potential in this area.
However, in most trains today it cannot be used to the extent that might be desirable. They do
not have the capability to brake fast enough to be used as the main service brake, especially
not at higher speeds and in urgent braking cases, with short braking distance. The deceleration
will be too low and the train will risk running late. There is simply a conflict where a more
ecological and economic driving will result in longer travel times which will risk making the
railway system less attractive for passengers. Also, the braking distance may be too long to
suit the pre-warning distance in the signalling system. To solve this it would be necessary to
make the electric regenerative brakes more efficient and practical both at higher speeds and
for cases involving harder braking.
This thesis work aims to immerse on the benefits of this technology, especially when running
at higher speeds. Would it, for instance, be more economical to have a more powerful drive
system which allows for more regeneration and less wear on mechanical brakes compared to
most trains today?
Purpose
The purpose of the thesis work is to show the benefits of the regenerative braking and energy
optimized driving technology, eco driving, when looking at energy consumption and brake
wear.
Objectives
Make an inventory of existing mathematical models that describe the wear of brake
pads (as function of braking characteristics) and select the most suitable for the present
work.
Perform a survey and a review among train drivers to learn more about different
driving techniques and the cause of these techniques.
Perform simulations of energy consumption when using a “normal driving style” with
different braking styles compared to using eco driving with almost only regenerative
braking on representative routes for the Green Train.
Perform calculations of the brake pad wear.
Make a comparison of the energy consumption and wear between different driving
and braking styles.
Introduction
2
Limitations
The mathematical model used for the wear calculations is an approximation.
No separate model for brake disc wear is developed. However, disc wear is assumed
to be close to proportional to brake pad wear, at least in normal operational braking
with modest braking power dissipation and energy.
Methods
The study is carried out through literature studies, calculations and simulations, as well as a
review of driver’s experience and opinion.
Further studies
It would be an advantage to be able to perform experiments or measurements for validation
purposes, both for the brake pad temperature calculations as well as for wear of brake pads
and brake discs.
Benefits of regenerative braking and eco driving for high-speed trains
3
2. General information concerning brake wear
2.1 General background
There are three main principles of braking a running train. Using the adhesion between wheels
and rails is the most common; these brakes are called adhesion brakes. There are also brakes
which use the friction between the track and brake shoes on the train known as track brakes.
Track brakes are in principle only used as emergency brakes. The third principle is the eddy
current brake that instead of friction uses electromagnetic current to create resistance between
the track and the brake shoes.
The adhesion brakes can in turn be divided into three sub-principles: tread brakes, disc brakes
(which are mechanical brakes) and electrical brakes. Some trains use all three, with an
additional track brake as emergency brake:
the tread brakes are used to clean the wheel treads and improve the adhesion;
disc brakes as the main mechanical brake and
electrical brakes to perform as much of the braking as possible to save energy and
mechanical brake wear.
Each disc brake set consists of two pairs of brake pads which press against both sides of a
brake disc. The pads are pressed against the disc by a link mechanism, which normally is
controlled by a pneumatic cylinder. The discs can be placed on the wheel axle (usually
between the wheels) or on the wheels themselves. The pads are usually made of an organic or
sintered material; the latter makes them able to withstand higher temperatures. The discs are
usually made of steel, but they can also be made of an aluminium alloy to save weight.
The electrical brake can be either rheostatic or regenerative and produces brake force by using
the traction motors as generators. In both cases a braking torque on the wheel axle is
produced, which in turn produces a braking force between the wheels and rails. If it’s
rheostatic the kinetic energy is transformed into heat in resistors. If it’s regenerative the
electrical energy can be returned to the catenary and used by other trains or sometimes it is
even possible to feed it back to the public grid. A big advantage of regenerative brakes is thus
the possibility to re-use the electrical energy that otherwise would have been transformed into
heat when using either rheostatic electrical brakes or mechanical brakes. This benefits both
the environment and the economy for the operator. There is also a big advantage as the wear
of the mechanical brakes becomes lower which prolongs the maintenance intervals. [1]
For safety reason the mechanical brakes must be capable to stop the train running at full speed
at a maximum distance. This means that each brake disc must be able to dissipate a large
amount of energy in a very short time, in some cases up to 25 MJ (about 7 kWh) per disc in
less than two minutes (TGV train braking from 310 km/h). [2]
The pad material is sometimes depending on whether they are used for a locomotive, motor
coach or a trailing car. Locomotives and motor coaches usually have sinter pads which can
withstand higher temperatures while trailing cars sometimes are equipped with organic pads,
mainly for economic reasons. [3]
The size of the discs varies depending on type and use but usually has an outer diameter of
610 – 680 mm and an inner diameter of 330 – 390 mm. The pads have a contact area of about
200 – 300 cm2 and there are usually four pads per brake disc.
General information concerning brake wear
4
2.2 Existing wear models
Wear can be defined as the loss or displacement of material from a solid surface as a result of
mechanical action (friction). A lot of the work on this subject has been done with the aid of
finite element simulations or by experimental studies. Many models also include parameters
and constants that need to be determined by experiments and are strictly valid for specific
materials and operations. There is no “magic formula” available as a simplified mathematical
model for calculating wear on train disc brakes. There are however a few models that are
more suitable than others.
Reye’s hypothesis, sometimes referred to as the energy dissipative hypothesis, states that the
volume of the removed material is proportional to the work (dissipative energy) done by the
tangential force. [4]
(1)
where
V = Wear volume [m3]
s = Sliding distance [m]
FT = Tangential friction force [N]
τ = Constant that characterizes the shear stress of the sliding bodies
One formula that is also often mentioned, when speaking of mechanical wear in brakes, is
Rhee’s wear formula [5]:
(2)
where
ΔW = Wear [m3]
k = Wear rate coefficient [m3/Nm]
FN = Contact normal force [N]
v = Speed [m/s]
t = Sliding time [s]
a, b, c = Friction material specific parameters
None of these is however taking into account the temperature dependence; they assume a
constant temperature which could be a major weakness if not investigated properly. Neither
can they be used without knowing details about the materials in the brake pads and discs.
One formula which was developed to be able to calculate the wear on aircraft brakes [6] is:
(3)
where
ΔW = Wear [m3]
kw = Wear coefficient
T = Operative temperature [°C]
T* = Melting point of the brake pad material [°C]
Benefits of regenerative braking and eco driving for high-speed trains
5
The melting point is suggested to be related to the base material of the air plane brake pads,
which in this case was copper with melting temperature at 1083° C. The disc was made of
steel.
Accordingly, a way to calculate the surface temperature was suggested:
(4)
Where P1, P2 and P3 are parameters that are related to the friction coefficient of the material
and other properties also depending on the materials. The wear was reported to increase
dramatically when the surface temperature reached over 600 °C. [6].
The equation’s weakness is that it only considers cases where the speed is constant.
A general theory is Archard’s wear equation [7], or different interpretations of it. It was
developed through experimental tests. In [4] it is used to calculate wear volume:
(5)
where
V = Wear volume [m3]
s = Sliding distance [m]
K = Dimensionless wear coefficient
FN = Contact normal force [N]
Hs = Hardness of the softer material [N/m2] (According to Vicker’s hardness test)
Archard’s wear equation is sometimes written with the aspect of wear displacement, which
from a design view can be convenient. With Δh = V/A, where A is the area subjected to wear,
and contact pressure p = FN/A it is stated as:
(6)
where
vM = Mean value of slide rate [m/s]
tr = Running time [s]
Archard’s wear equation in local form is stated as in [8]:
(7) where
= Wear rate [m/s]
kw = Wear rate coefficient [m3/Nm]
p = Contact pressure [Pa]
v = Sliding speed [m/s]
General information concerning brake wear
6
If this equation is reformulated according to the following:
(8)
(9)
where
= Wear rate [m/s]
V = Wear volume [m3]
kw = Wear coefficient [m3/Nm]
E = Mechanical brake energy [J]
It is then possible to use the mechanical brake energy to calculate the wear volume of the
brake pads.
One way to introduce temperature dependency is to state the wear coefficient as temperature
dependent. kw(T) would mean that the coefficient changes with the temperature, as in [8] and
[9].
(10)
where
kw0 = Wear coefficient at reference temperature [m3/Nm]
T = Temperature [°C]
Tcrit = Temperature from which the wear increases exponentially [°C]
H = Heaviside function
c1, c2, c3 = Dimensionless constants
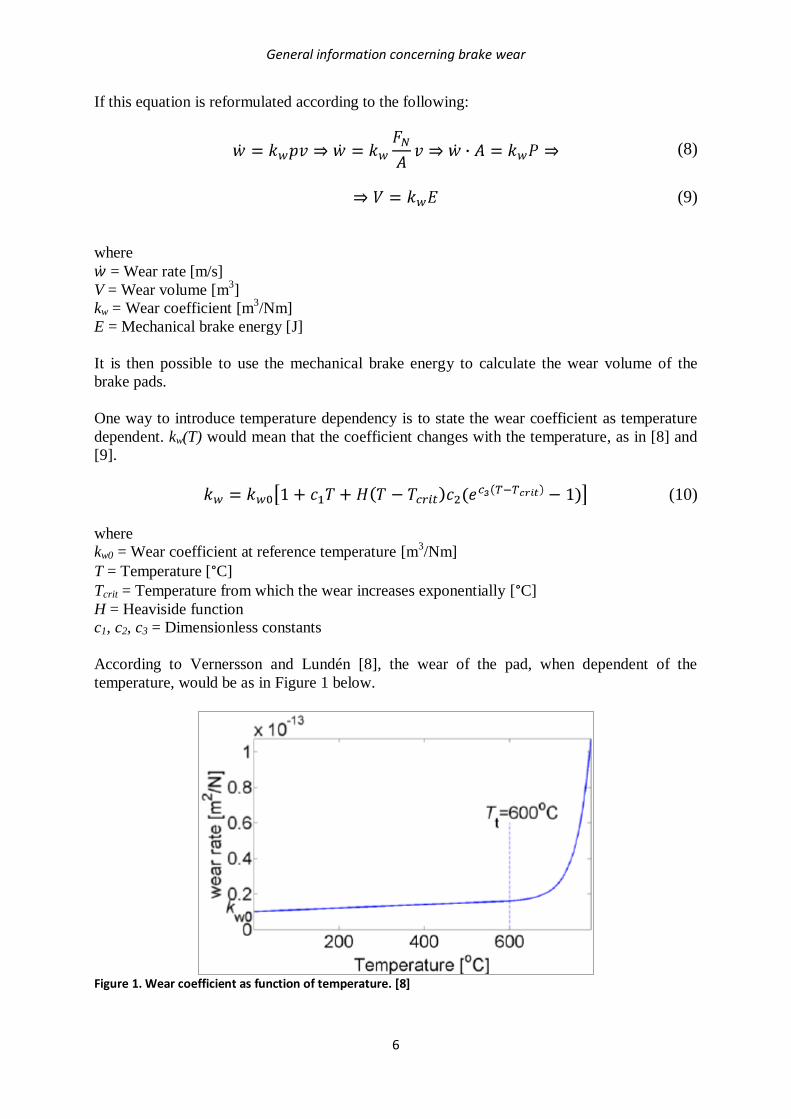
According to Vernersson and Lundén [8], the wear of the pad, when dependent of the
temperature, would be as in Figure 1 below.
Figure 1. Wear coefficient as function of temperature. [8]
Benefits of regenerative braking and eco driving for high-speed trains
7
2.3 Tribology and third body
Calculations of the sliding between friction surfaces are highly complex, in particular when
considering high-speed cases. The reason for this, among many, is because most friction
brakes are functioning in the thermoelastic instability regime. In this regime the interface
pressure distribution, heat generation, temperature and wear vary both in space and time.
Thermoelastic instabilities are introduced as a cause of the absence of homogeneity in the
contact pressure distribution. This results in increased frictional heating and temperatures in
regions with higher pressure. As the temperature rises the expansion of the material will
increase, resulting in a further concentration of contact pressure and wear. [8]
Another reason for the very complex behaviour is because of the so-called third body. The
third body, also known as friction layer, is an expression for the wear debris and other
contaminations that gather up between the contact surfaces, i.e. between the other two bodies
of contact. The sliding wears down weaker material leaving plateaus of more resistant
materials which will make up the primary contact zones between the two bodies. The third
body will act as a film between the two bodies where the materials no longer are subjected to
all the stresses and displacements. The third body in the interface can withstand shear without
serious degradation which is not the case for the two solid bodies. [10]
Model for brake pad wear
8
3. Model for brake pad wear
The following chapter describes the different stages of the temperature estimations and the
subsequent brake wear calculations done in this study.
3.1 Pad material and temperature dependence
Archard’s reformulated wear equation, see Equation 9, was chosen for this study with the
temperature dependent wear coefficient (10) proposed by Thuresson [9] and further developed
for this explicit use by Vernersson and Lundén [8]. This will make the equation both
temperature and speed dependent. Coefficients from Vernersson and Lundén [8] (kw0 = 10 ∙
10-15
and c1 = 0.001) will be used and the critical temperature when the wear increases
exponentially will be set to 600 °C as in [8], [9]. This is also proven for a certain line-up by
Ho and Peterson [6]. This value also coincides with Seidenschwang [11] which leads to the
conclusion that 600 °C as a critical temperature is a good approximation. This will have the
consequence of being well above the temperatures reached in the cases of this study. In the
report “Brake disc – temperature calculation” [11] there is also a highest temperature of 380
°C stated for the brake disc of a Regina motor coach decelerating from 200 km/h to stop at
1.17 m/s2 (approx. 9.56 ton braked mass per brake disc). This could be seen as an emergency
braking with use of the disc brakes only. This data was calculated for a four-car Regina on a
demanding route between Uppsala and Gävle in Sweden. Trains that run at higher speeds are
usually fitted with more brake discs to make sure the temperature of the braking equipment is
held at an acceptable level. No “normal working temperature” can be stated as it largely
depends on the actual line and the applied braking. Many stations and speed restrictions lead
to a higher mean temperature while a fairly straight track with few stations will allow the
brake discs and pads to cool down between braking events.
UIC declares in “Brakes – Disc brakes and their application” [12] that “The brake pad shall withstand the thermal loading within the limits of the approval program without burning, melting, or forming large deposits on the brake disc or wearing unusually quickly. The frictional material shall be able to withstand without worsening of its properties the following temperatures, measured on the rubbing surfaces of the brake discs:
• for organic brake pads: 400°C, • for sintered brake pads: 550°C.”
The brake pad material which is used in this work is “Becorit BM 40”, which is a sintered pad
material for high thermal loads. It is approved for speeds up to 350 km/h.
3.2 Temperature calibration
In order for the wear formula to work properly the temperature must be known at any
moment. This can be done by a series of heat dissipation and convection formulas. It could
also be done by the use of an equation which could deliver resembling results regarding
temperature as function of brake energy. If the parameters are trimmed properly a good
adaptation can be achieved, which is the method used in this thesis.
Data from full scale testing [13] was first used for the calibration. In the beginning this
method was considered to be a good approximation. The measured temperature in the test was
collected with thermocouples located inside the brake pad, one millimetre from the interface
surface, see Figure 2.

Benefits of regenerative braking and eco driving for high-speed trains
9
Figure 2. Brake pad with installed thermocouples. [Photo – Courtesy of Saeed Abbasi, KTH]
Since the temperature is measured at a specific point in the pad at a specific moment it is
possible that the temperature just millimetres away from the thermocouples is significantly
higher. For a better conformity with reality one should perform new tests with the sole
purpose of measure the pad surface temperature.
To be able to make an equation that can resemble both the temperature increase and decrease,
the “Net dose model” was used. Förstberg used it to predict motion sickness [14] but it can
also be used to predict brake pad temperatures. The mathematical formula uses two sets of
equations to predict rising and falling temperatures, with the help of a few parameters. Instead
of using parameters associated with motion sickness, brake energy and brake coefficients
were used together with the braking time.
To do this a steady state (ambient) and starting temperature of 40 °C was approximated,
considering and including heat radiation from the train. When the braking starts the first
formula sets in and stepwise calculates the temperature rise. When the pressure of the brake
pads is reduced and the pad temperature starts to decrease the second formula sets in and
calculates (also stepwise) the temperature fall. The calculation ends when the steady state
temperature is reached again.
For the braking sequence the following equation was used:
(11)
where
ΔTP = Brake pad temperature increment [°C]
ΔE = Mechanical brake energy input [J]
cSB = Start brake coefficient
cSL = Start leakage coefficient
tb = Time of braking [s]
ts = Start of braking [s]
td = Time delay [s]
Model for brake pad wear
10
If no further brake energy is supplied, i.e. the pads are no longer in contact with the discs or
the train has completely stopped, the temperature will start to fall. The following equation is
used to calculate the decrease in temperature:
(12)
where
TPE = Achieved temperature at end of braking [°C]
cEL = End leakage coefficient
te = End of braking [s]
The three coefficients cSB, cSL and cEL thus need to be calibrated, as well as the time delay td,
in order for the final formula to work properly. The leakage coefficient during the cooling
period would need to vary depending on ambient temperature and speed due to convection
and radiation.
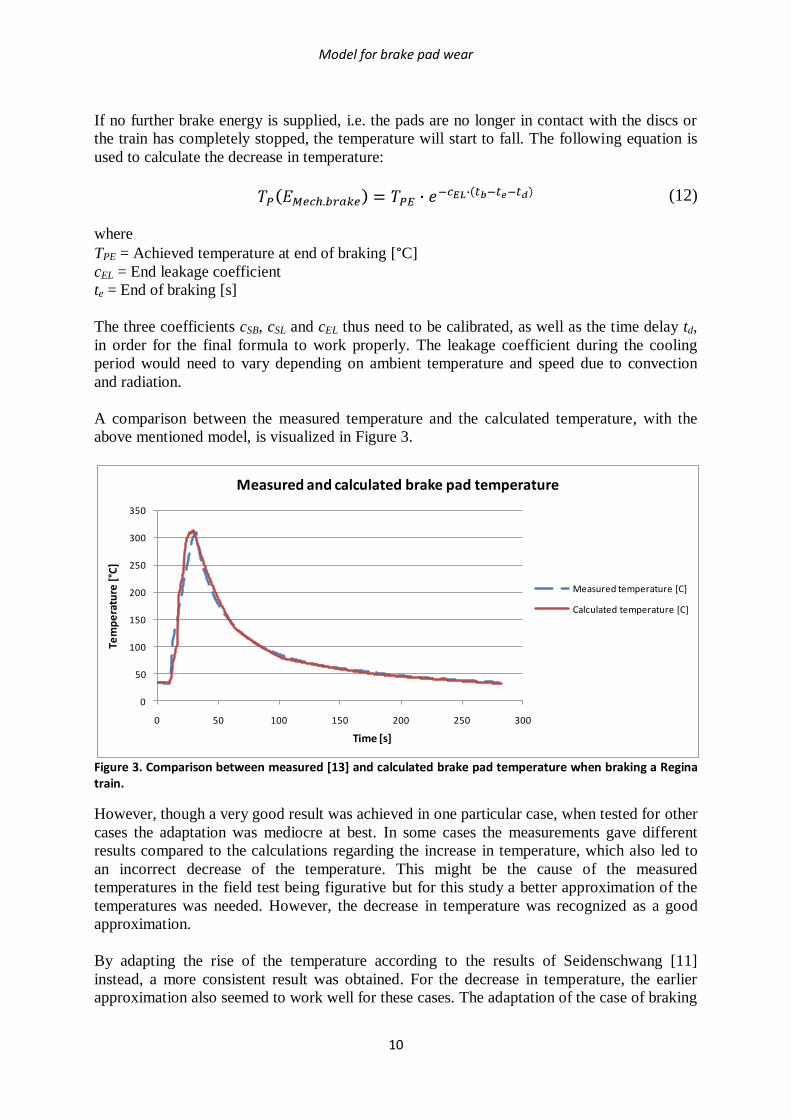
A comparison between the measured temperature and the calculated temperature, with the
above mentioned model, is visualized in Figure 3.
Figure 3. Comparison between measured [13] and calculated brake pad temperature when braking a Regina train.
However, though a very good result was achieved in one particular case, when tested for other
cases the adaptation was mediocre at best. In some cases the measurements gave different
results compared to the calculations regarding the increase in temperature, which also led to
an incorrect decrease of the temperature. This might be the cause of the measured
temperatures in the field test being figurative but for this study a better approximation of the
temperatures was needed. However, the decrease in temperature was recognized as a good
approximation.
By adapting the rise of the temperature according to the results of Seidenschwang [11]
instead, a more consistent result was obtained. For the decrease in temperature, the earlier
approximation also seemed to work well for these cases. The adaptation of the case of braking
0
50
100
150
200
250
300
350
0 50 100 150 200 250 300
Tem
pe
ratu
re [
°C]
Time [s]
Measured and calculated brake pad temperature
Measured temperature [C]
Calculated temperature [C]
Benefits of regenerative braking and eco driving for high-speed trains
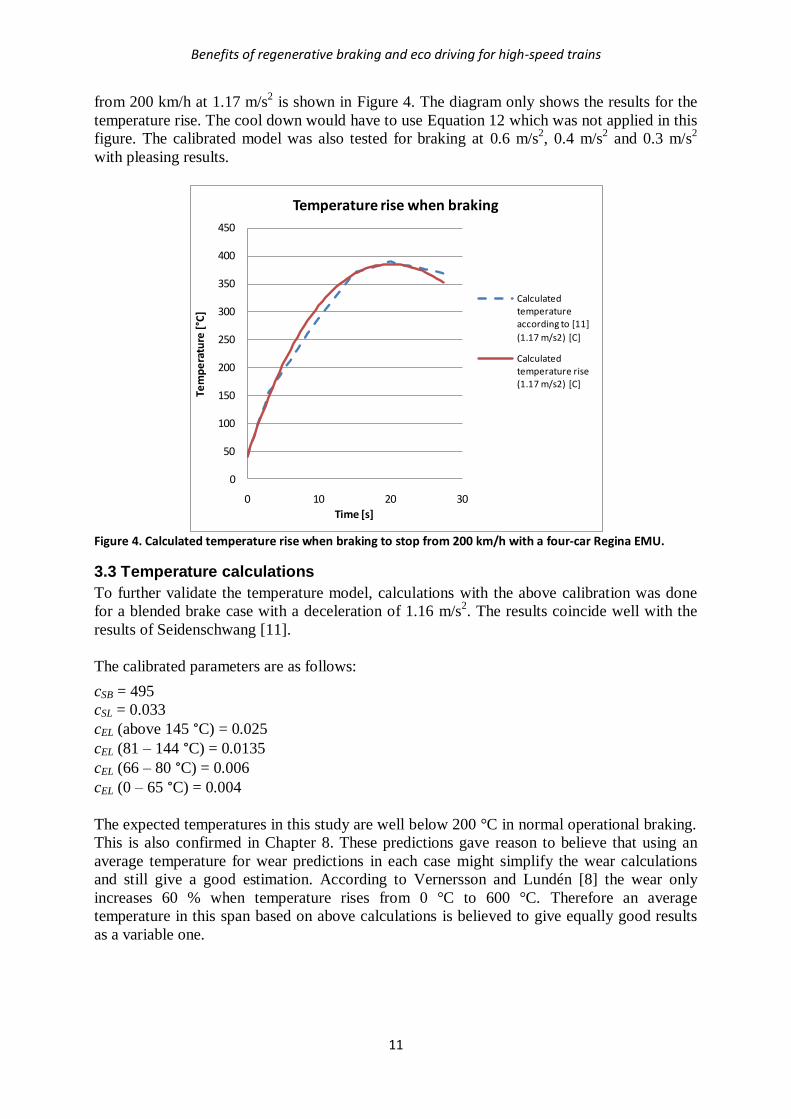
11
from 200 km/h at 1.17 m/s2 is shown in Figure 4. The diagram only shows the results for the
temperature rise. The cool down would have to use Equation 12 which was not applied in this
figure. The calibrated model was also tested for braking at 0.6 m/s2, 0.4 m/s
2 and 0.3 m/s
2
with pleasing results.
Figure 4. Calculated temperature rise when braking to stop from 200 km/h with a four-car Regina EMU.
3.3 Temperature calculations
To further validate the temperature model, calculations with the above calibration was done
for a blended brake case with a deceleration of 1.16 m/s2. The results coincide well with the
results of Seidenschwang [11].
The calibrated parameters are as follows:
cSB = 495
cSL = 0.033
cEL (above 145 °C) = 0.025
cEL (81 – 144 °C) = 0.0135
cEL (66 – 80 °C) = 0.006
cEL (0 – 65 °C) = 0.004
The expected temperatures in this study are well below 200 °C in normal operational braking.
This is also confirmed in Chapter 8. These predictions gave reason to believe that using an
average temperature for wear predictions in each case might simplify the wear calculations
and still give a good estimation. According to Vernersson and Lundén [8] the wear only
increases 60 % when temperature rises from 0 °C to 600 °C. Therefore an average
temperature in this span based on above calculations is believed to give equally good results
as a variable one.
0
50
100
150
200
250
300
350
400
450
0 10 20 30
Tem
pe
ratu
re [
°C]
Time [s]
Temperature rise when braking
Calculated temperature according to [11]
(1.17 m/s2) [C]
Calculated temperature rise (1.17 m/s2) [C]
Model for brake pad wear
12
3.4 Final wear model
By the above discussion the following calculation path is determined:
1. Increase in brake pad temperature is calibrated using results from Seidenschwang [11]
and Equation 11.
2. Decrease in brake pad temperature is calibrated using field test data [13] and Equation
12.
3. Brake pad temperature for the cases in this study is calculated using Equations 11 and
12, the average temperature for a blended braking sequence is then extracted for each
case.
4. By using the average brake pad temperatures, the wear coefficients relevant to this
study can be determined by Equation 10.
5. With the wear coefficients the actual brake wear can be calculated using Archard’s
reformulated wear equation (Equation 9) with simulated mechanical brake energy as
input.
The brake wear calculations for the cases of this study are further described in Chapter 8.
Benefits of regenerative braking and eco driving for high-speed trains
13
4. Simulation software (STEC)
In 2009 the Royal Institute of Technology (KTH), Division of Rail Vehicles, identified the
need for a new train energy simulation software with an easy to use interface. This resulted in
the Microsoft-Excel-based STEC (Simulation of Train Energy Consumption) software [15]
developed by Johan Öberg (MiW Konsult AB) for KTH. The main purpose of the program is
to calculate the energy consumption and running times after that the user have defined the
train and track with a number of parameters.
The program has earlier been used in the EU funded project “TOSCA” (Technology
Opportunities and Strategies toward Climate-friendly trAnsport), which deals with transport
energy efficiency and reduced environmental impact. This project is carried out by a
consortium of seven organizations across Europe with expertise in areas related to
transportation and environment.
The main advantages of the program, and the reasons why it is used in this study, are the user-
friendly interface and the flexibility that allows for a build-on customization.
A few changes were actually made for this specific study, where the added output of
mechanical brake energy was vital. The new version was tested and verified before it was
used on a regular basis. One limitation that still could need some improvements is the
coasting function. It did nonetheless deliver satisfactory results for this study.
4.1 Input
To be able to simulate different train type’s energy consumption and performance, one must
first state their properties in the program. Train data, like maximum speed, needs to be
defined together with train mass, adhesive mass, number of seats, load factor and so forth.
Coefficients of train resistance, traction characteristics and limitations, braking characteristics
and limitations, as well as information about the comfort and auxiliary systems are other
examples of what information is necessary to be able to perform simulations.
The railway line also needs to be defined. Line gradients and target speeds need to be entered
along the line, together with information on locations of stations, as well as dwell time on
each station. Information of total track length and desired step length of the calculations are
also necessary.
Further, a realistic number of unplanned stops and speed restrictions have to be defined. The
final step before it is possible to perform a simulation is to define the run, which means to
specify braking mode, coasting, and the output.
4.2 Output
Once a successful simulation has been performed the program instantly shows information
about total travel time, details about energy consumption and brake characteristics. It is also
possible to see plots of “Speed and target speed as function of position”, “Train forces as
function of position”, “Acceleration as function of position” and “Adhesion coefficient as
function of position”.
Train driver survey and review
14
5. Train driver survey and review
In order to learn about the driving style in actual high-speed operations and to understand
more of the reasons behind the way of driving, a survey was made among professional train
drivers (see Appendix A; in Swedish). The survey was sent out to instruction drivers at SJ
AB. The results of the survey was also discussed and clarified by Furukrona and Berndtsson
at SJ AB [16] [17].
According to the survey the drivers usually plan their driving to be able to make most speed
reductions with the electric regenerative brake. More than 50 % of the reductions at higher
speeds are made with this brake. Some drivers are able to make more than 75 % of the
reductions with the regenerative brake.
The main reasons of not being able to use the regenerative brake are the following:
Slippery track (poor adhesion).
Not sufficient electric brake capabilities when urgent speed reduction is needed.
Not sufficient electric brake capabilities at higher speeds.
When the rails are slippery, for example during the winter, the electric regenerative brake
sometimes suffers from slow control. When the motors are braking the wheels and they start
to slide, the system must release the brake and restart the braking. This is not always done fast
enough and the braking sequence becomes very uncomfortable, resulting in the driver using
the mechanical brakes instead. It should be mentioned that improvements have been made in
more recent trains compared to the X2, which also can be negatively influenced by its high
adhesion utilization (only 20 – 25 % of the total mass is on powered axles).
High adhesion utilization increases the risk of entering into a "slippery" region of operation.
Slippery conditions will most likely limit the use of electric regenerative brakes, leading to
more extensive use of mechanical brakes. This is because the latter have inherently a lower
adhesion utilization; mechanical brakes are usually active on all axles in the train.
In normal passenger operations it is sometimes hard to keep the timetable if only using the
electric regenerative brakes. When braking to a stop it is therefore uncommon to only use the
regenerative brakes. It is also very common today that unexpected events delay the trains for a
few minutes, forcing the drivers to try to gain time. Since the mechanical brakes allow for
quicker braking drivers have to use these if they want to regain time.
The insufficient brake capabilities in today’s electric regenerative brakes when reducing speed
urgently, in particular at higher speeds, are mainly due to relatively low power of the traction
system.
Coasting is commonly used but is harder to perform on regional lines where the operations are
“tougher”, with higher accelerations and decelerations.
Benefits of regenerative braking and eco driving for high-speed trains
15
To be able to drive more eco efficient the drivers would like:
System that makes it possible for planning the driving ahead.
Realistic timetables, i.e. more time margins.
Improved braking equipment (more electric braking power that also is tuned for
slippery conditions).
Independent control of electric and mechanical braking.
If the drivers had a system that could show if a train is close ahead of their proximity they
could maintain a safe distance without having to stop. This would reduce the energy
consumption and brake wear. It would also result in a smoother driving which would be more
comfortable for the passengers. A step in the right direction is the new ERTMS (European
Rail Transport Management System) including ETCS (European Train Control System) that
are successively introduced in Europe. This system determines the position of the trains on the
lines which gives real-time updates for the train dispatcher and the drivers.
A more generous timetable would give the drivers more opportunities to coast and to use the
regenerative brakes. It would also make sure that any unforeseen events that are slowing
down the train would not cause too much delay to be able to use the eco efficient driving
techniques. Further, possibility to use the regenerative brake only, independent of the
mechanical brake, would allow for a more controlled braking. Improved braking equipment
(high electric braking power etc.) would make sure that even at higher speeds and in high-
deceleration braking the electric regenerative brakes would be possible to use without losing
too much time. If the control equipment was better tuned the electric brakes would be able to
perform well during slippery conditions. This also includes that the adhesion utilization
should be kept quite low.
Trains and operational cases
16
6. Trains and operational cases
Four different types of trains are studied in this thesis. The X2 (also known as X2000) is a
common high-speed train in Sweden that has been operating since 1990. The X2 is set as
reference train, since all its specifications and energy consumption etc. are widely
documented, see for example Lukaszewicz and Andersson [18].
The other three trains are different versions of the Green Train: the GT-250 and GT-250
Regional with a top speed of 250 km/h and the GT-VHST with a top speed of 320 km/h.
VHST is an abbreviation of Very High-Speed Train. A lot of effort has been put into the
Green Train research programme and its specification has been thoroughly investigated even
though no full train has been built. Each version of the Green Train will also be simulated
with 30 % reduced traction power.
In this study the Green Train configurations will be simulated with regenerative electric
brakes and disc brakes as the main mechanical brake. These are the standard brake systems on
most trains of today. X2 also uses disc brakes and regenerative electric brakes. No emergency
braking will be simulated.
6.1 Train specifications
For the reference train X2 as well as the GT-250 Regional, most information in this study
emanates from Andersson [19] and the report “Green Train energy consumption” by
Lukaszewicz and Andersson [18]. In [18], most information about the Green Trains GT-250
and GT-VHST was found and is presented in Table 1 together with data for X2. In [18] the
coefficients A, B and C for train running resistance are derived as well.
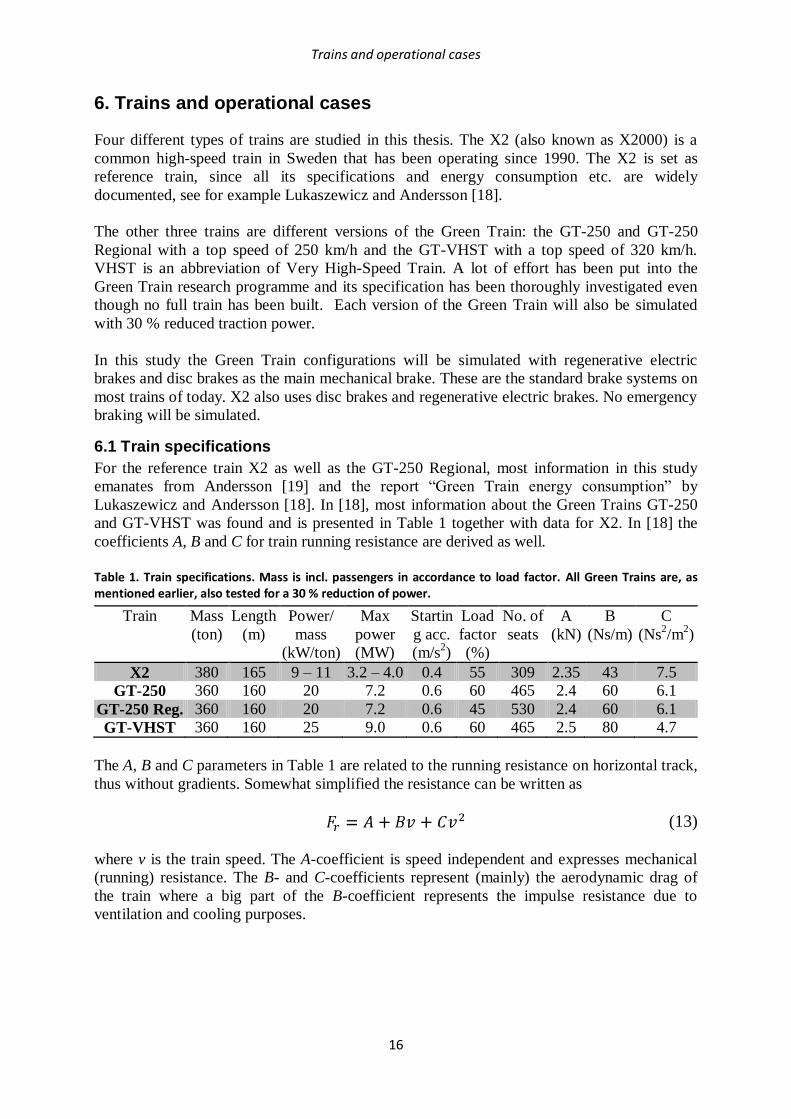
Table 1. Train specifications. Mass is incl. passengers in accordance to load factor. All Green Trains are, as mentioned earlier, also tested for a 30 % reduction of power.
Train Mass
(ton)
Length
(m)
Power/
mass
(kW/ton)
Max
power
(MW)
Startin
g acc.
(m/s2)
Load
factor
(%)
No. of
seats
A
(kN)
B
(Ns/m)
C
(Ns2/m
2)
X2 380 165 9 – 11 3.2 – 4.0 0.4 55 309 2.35 43 7.5
GT-250 360 160 20 7.2 0.6 60 465 2.4 60 6.1
GT-250 Reg. 360 160 20 7.2 0.6 45 530 2.4 60 6.1
GT-VHST 360 160 25 9.0 0.6 60 465 2.5 80 4.7
The A, B and C parameters in Table 1 are related to the running resistance on horizontal track,
thus without gradients. Somewhat simplified the resistance can be written as
(13)
where v is the train speed. The A-coefficient is speed independent and expresses mechanical
(running) resistance. The B- and C-coefficients represent (mainly) the aerodynamic drag of
the train where a big part of the B-coefficient represents the impulse resistance due to
ventilation and cooling purposes.
Benefits of regenerative braking and eco driving for high-speed trains
17
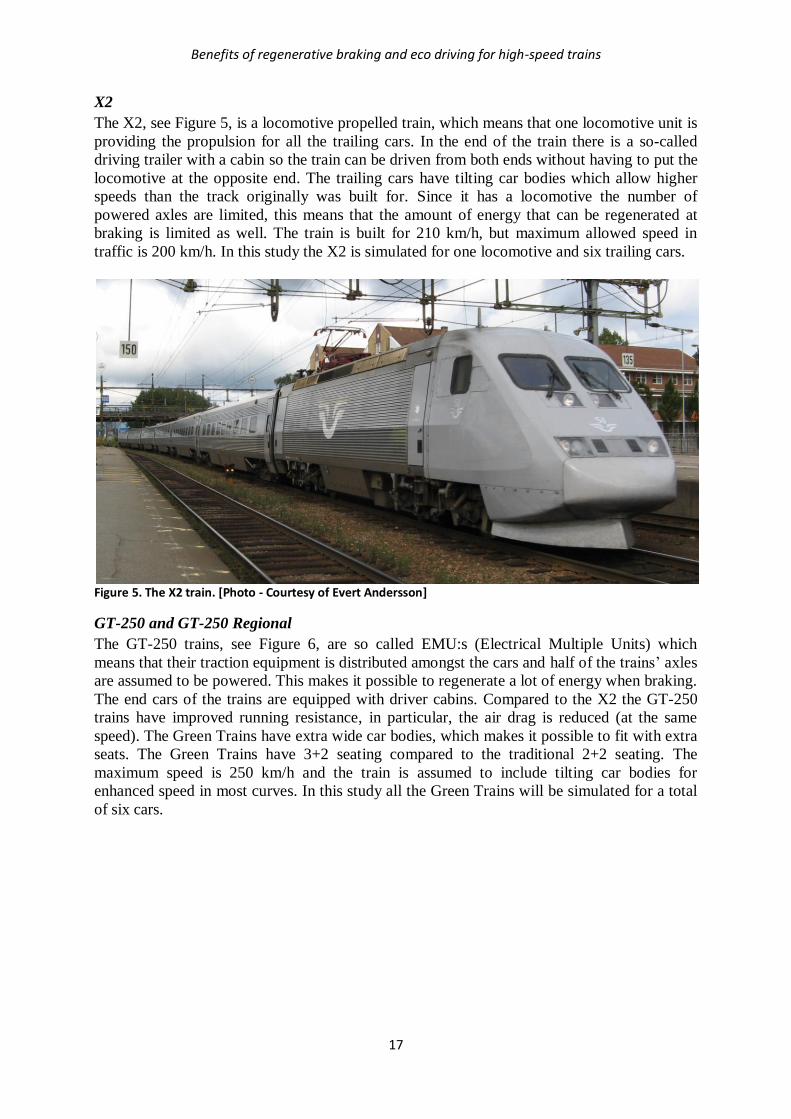
X2
The X2, see Figure 5, is a locomotive propelled train, which means that one locomotive unit is
providing the propulsion for all the trailing cars. In the end of the train there is a so-called
driving trailer with a cabin so the train can be driven from both ends without having to put the
locomotive at the opposite end. The trailing cars have tilting car bodies which allow higher
speeds than the track originally was built for. Since it has a locomotive the number of
powered axles are limited, this means that the amount of energy that can be regenerated at
braking is limited as well. The train is built for 210 km/h, but maximum allowed speed in
traffic is 200 km/h. In this study the X2 is simulated for one locomotive and six trailing cars.
Figure 5. The X2 train. [Photo - Courtesy of Evert Andersson]
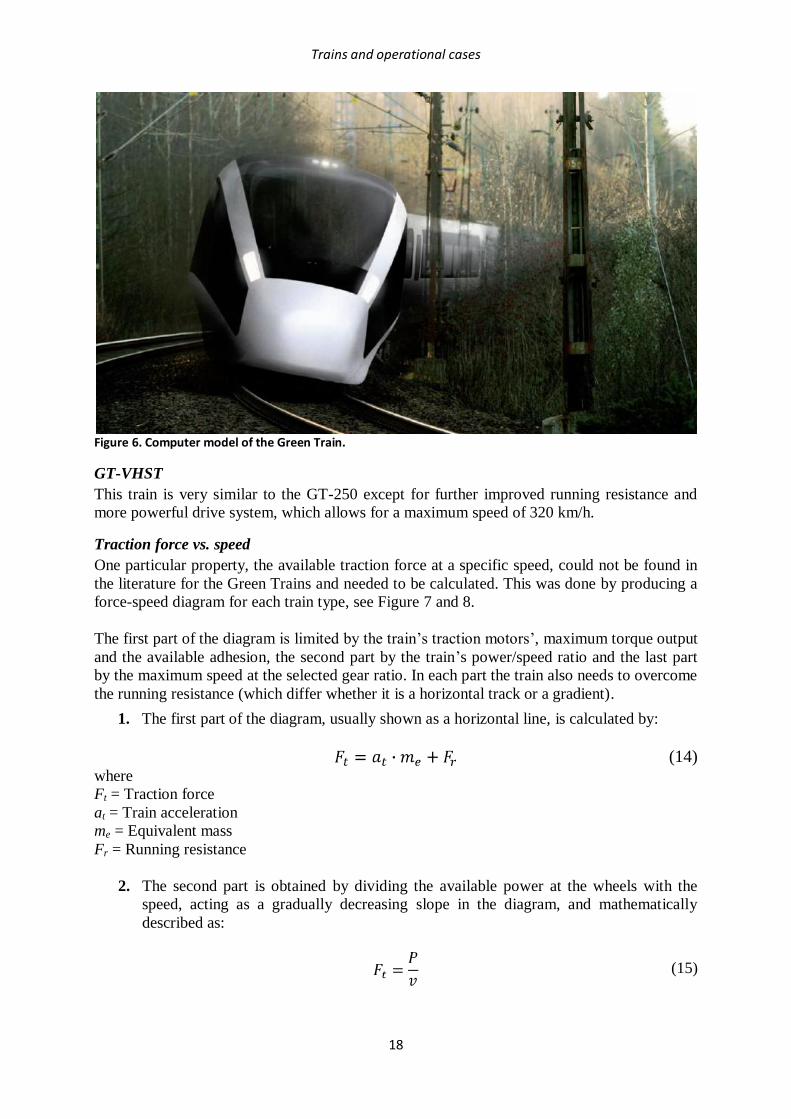
GT-250 and GT-250 Regional
The GT-250 trains, see Figure 6, are so called EMU:s (Electrical Multiple Units) which
means that their traction equipment is distributed amongst the cars and half of the trains’ axles
are assumed to be powered. This makes it possible to regenerate a lot of energy when braking.
The end cars of the trains are equipped with driver cabins. Compared to the X2 the GT-250
trains have improved running resistance, in particular, the air drag is reduced (at the same
speed). The Green Trains have extra wide car bodies, which makes it possible to fit with extra
seats. The Green Trains have 3+2 seating compared to the traditional 2+2 seating. The
maximum speed is 250 km/h and the train is assumed to include tilting car bodies for
enhanced speed in most curves. In this study all the Green Trains will be simulated for a total
of six cars.
Trains and operational cases
18
Figure 6. Computer model of the Green Train.
GT-VHST
This train is very similar to the GT-250 except for further improved running resistance and
more powerful drive system, which allows for a maximum speed of 320 km/h.
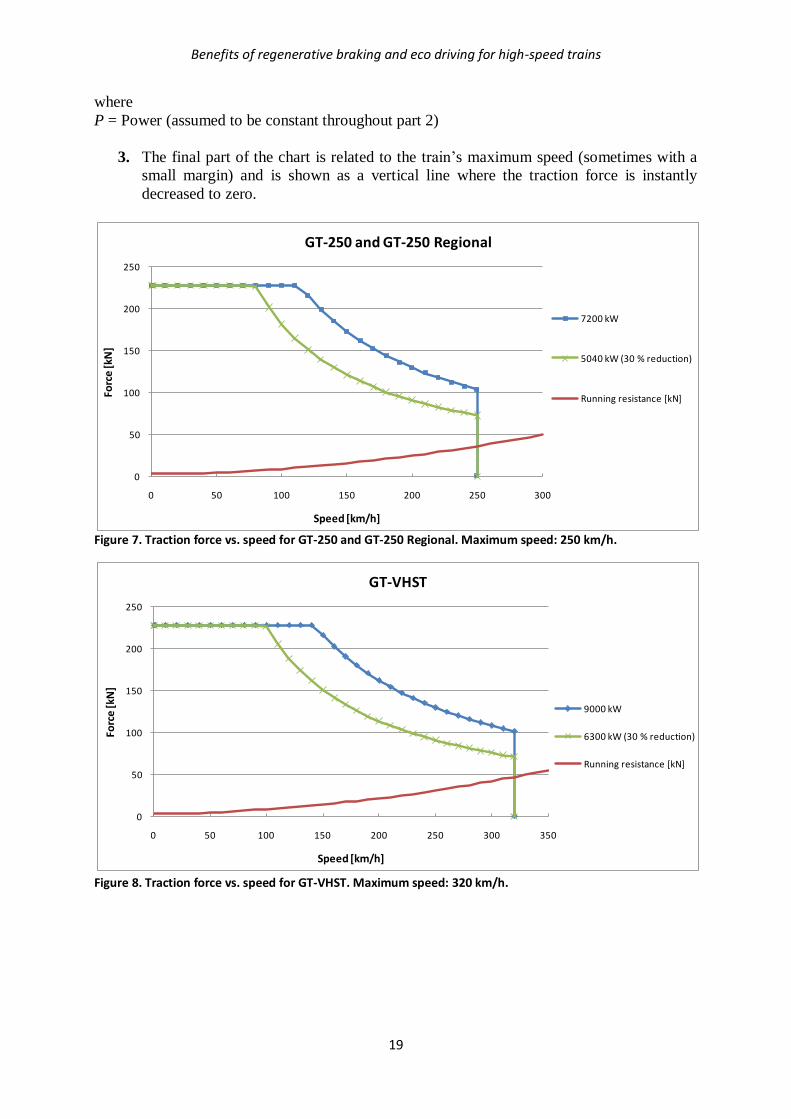
Traction force vs. speed
One particular property, the available traction force at a specific speed, could not be found in
the literature for the Green Trains and needed to be calculated. This was done by producing a
force-speed diagram for each train type, see Figure 7 and 8.
The first part of the diagram is limited by the train’s traction motors’, maximum torque output
and the available adhesion, the second part by the train’s power/speed ratio and the last part
by the maximum speed at the selected gear ratio. In each part the train also needs to overcome
the running resistance (which differ whether it is a horizontal track or a gradient).
1. The first part of the diagram, usually shown as a horizontal line, is calculated by:
(14) where
Ft = Traction force
at = Train acceleration
me = Equivalent mass
Fr = Running resistance
2. The second part is obtained by dividing the available power at the wheels with the
speed, acting as a gradually decreasing slope in the diagram, and mathematically
described as:
(15)
Benefits of regenerative braking and eco driving for high-speed trains
19
where
P = Power (assumed to be constant throughout part 2)
3. The final part of the chart is related to the train’s maximum speed (sometimes with a
small margin) and is shown as a vertical line where the traction force is instantly
decreased to zero.
Figure 7. Traction force vs. speed for GT-250 and GT-250 Regional. Maximum speed: 250 km/h.
Figure 8. Traction force vs. speed for GT-VHST. Maximum speed: 320 km/h.
0
50
100
150
200
250
0 50 100 150 200 250 300
Forc
e [k
N]
Speed [km/h]
GT-250 and GT-250 Regional
7200 kW
5040 kW (30 % reduction)
Running resistance [kN]
0
50
100
150
200
250
0 50 100 150 200 250 300 350
Forc
e [k
N]
Speed [km/h]
GT-VHST
9000 kW
6300 kW (30 % reduction)
Running resistance [kN]
Trains and operational cases
20
6.2 Braking
Just as the traction system has limitations so does the braking system. Generally, the available
adhesion between wheel and rail is the limiting factor. If there is not enough adhesion the
wheels will lock and slide along the rails, resulting in wheel flats. On modern trains there are
anti-lock braking systems preventing this. Also passenger ride comfort should limit the degree
of deceleration. In normal passenger high-speed operations the deceleration is usually limited
to about 0.6 m/s2.
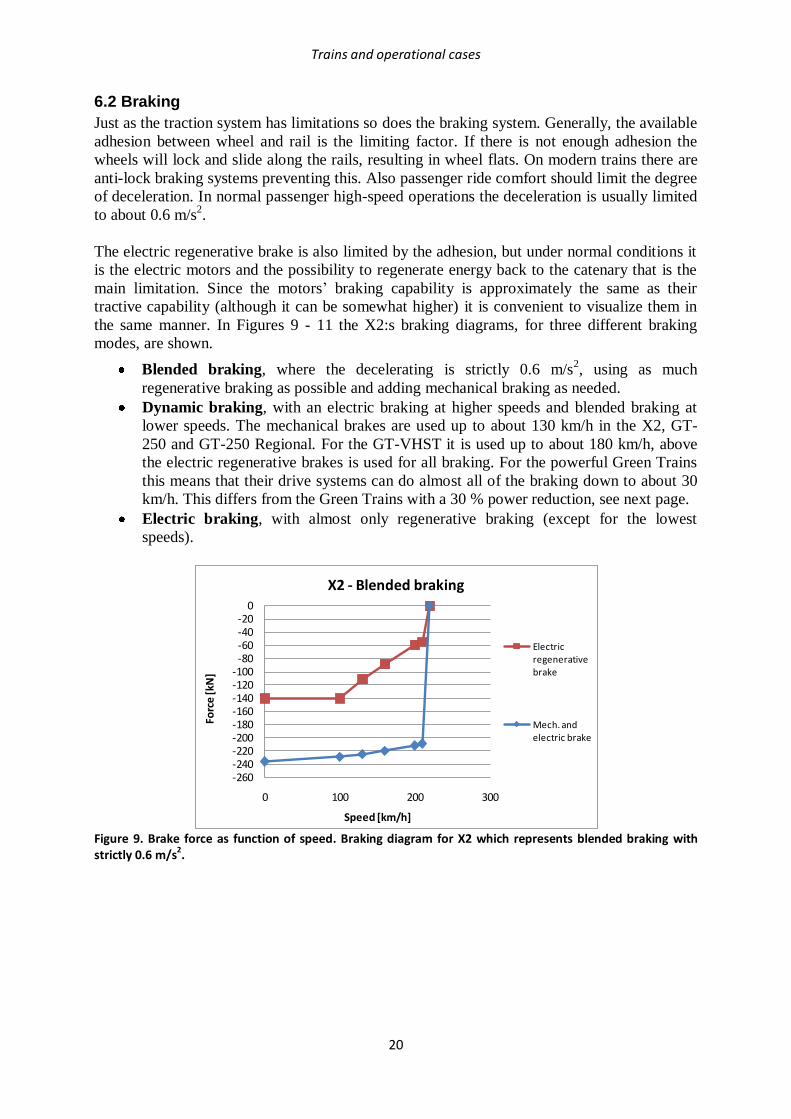
The electric regenerative brake is also limited by the adhesion, but under normal conditions it
is the electric motors and the possibility to regenerate energy back to the catenary that is the
main limitation. Since the motors’ braking capability is approximately the same as their
tractive capability (although it can be somewhat higher) it is convenient to visualize them in
the same manner. In Figures 9 - 11 the X2:s braking diagrams, for three different braking
modes, are shown.
Blended braking, where the decelerating is strictly 0.6 m/s2, using as much
regenerative braking as possible and adding mechanical braking as needed.
Dynamic braking, with an electric braking at higher speeds and blended braking at
lower speeds. The mechanical brakes are used up to about 130 km/h in the X2, GT-
250 and GT-250 Regional. For the GT-VHST it is used up to about 180 km/h, above
the electric regenerative brakes is used for all braking. For the powerful Green Trains
this means that their drive systems can do almost all of the braking down to about 30
km/h. This differs from the Green Trains with a 30 % power reduction, see next page.
Electric braking, with almost only regenerative braking (except for the lowest
speeds).
Figure 9. Brake force as function of speed. Braking diagram for X2 which represents blended braking with strictly 0.6 m/s2.
-260-240-220-200-180-160-140-120-100
-80-60-40-20
0
0 100 200 300
Forc
e [k
N]
Speed [km/h]
X2 - Blended braking
Electric regenerative brake
Mech. and electric brake
Benefits of regenerative braking and eco driving for high-speed trains
21
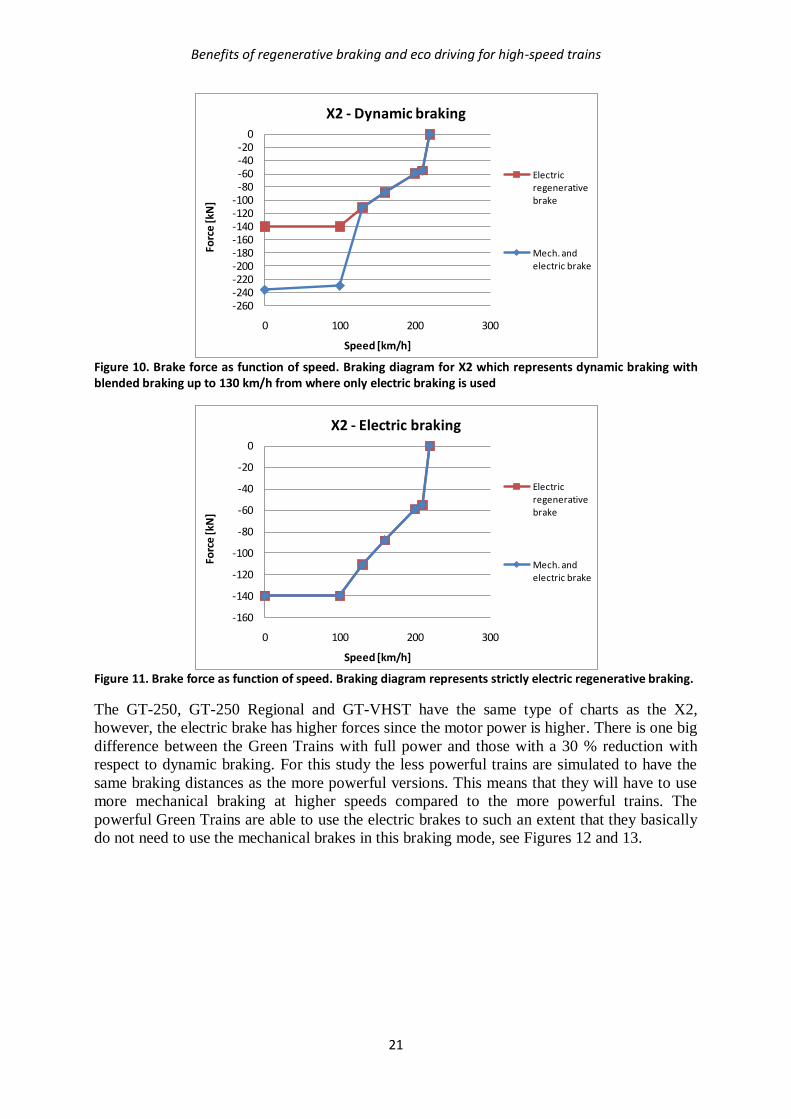
Figure 10. Brake force as function of speed. Braking diagram for X2 which represents dynamic braking with blended braking up to 130 km/h from where only electric braking is used
Figure 11. Brake force as function of speed. Braking diagram represents strictly electric regenerative braking.
The GT-250, GT-250 Regional and GT-VHST have the same type of charts as the X2,
however, the electric brake has higher forces since the motor power is higher. There is one big
difference between the Green Trains with full power and those with a 30 % reduction with
respect to dynamic braking. For this study the less powerful trains are simulated to have the
same braking distances as the more powerful versions. This means that they will have to use
more mechanical braking at higher speeds compared to the more powerful trains. The
powerful Green Trains are able to use the electric brakes to such an extent that they basically
do not need to use the mechanical brakes in this braking mode, see Figures 12 and 13.
-260-240-220-200-180-160-140-120-100
-80-60-40-20
0
0 100 200 300
Forc
e [k
N]
Speed [km/h]
X2 - Dynamic braking
Electric regenerative brake
Mech. and electric brake
-160
-140
-120
-100
-80
-60
-40
-20
0
0 100 200 300
Forc
e [k
N]
Speed [km/h]
X2 - Electric braking
Electric regenerative brake
Mech. and electric brake

Trains and operational cases
22
Figure 12. Brake force as function of speed. The diagram represents dynamic braking for the GT-250.
Figure 13. Brake force as function of speed. The diagram represents dynamic braking for the GT-250 with a 30 % power reduction.
6.3 Electric supply system
All electrical systems have losses which make them less than 100 % efficient. In this case the
supply both has losses due to resistance in the electrical wires as well as losses in the
converter stations. These losses are included in the simulation results as well as the energy
consumption due to the comfort and auxiliary systems.
The efficiency assumptions of this study can be seen in Table 2 below.
Table 2. Efficiency assumptions.
Train Efficiency in train’s
traction and electric
braking system
Efficiency in
railway’s supply
system
Comfort and
auxiliary power
efficiency
X2 82 % 88 % 90 %
Green Trains 84 % 88 % 90 %
-240
-220-200-180
-160-140
-120-100
-80
-60-40-20
0
0 100 200 300
Forc
e [k
N]
Speed [km/h]
GT-250 (6300 kW) - Dynamic braking
Electric regenerative brake
Mech. and electric brake
-240-220-200-180-160-140-120-100
-80-60-40-20
0
0 100 200 300
Forc
e [k
N]
Speed [km/h]
GT-250 (5040 kW) - Dynamic braking
Electric regenerative brake
Mech. and electric brake
Benefits of regenerative braking and eco driving for high-speed trains
23
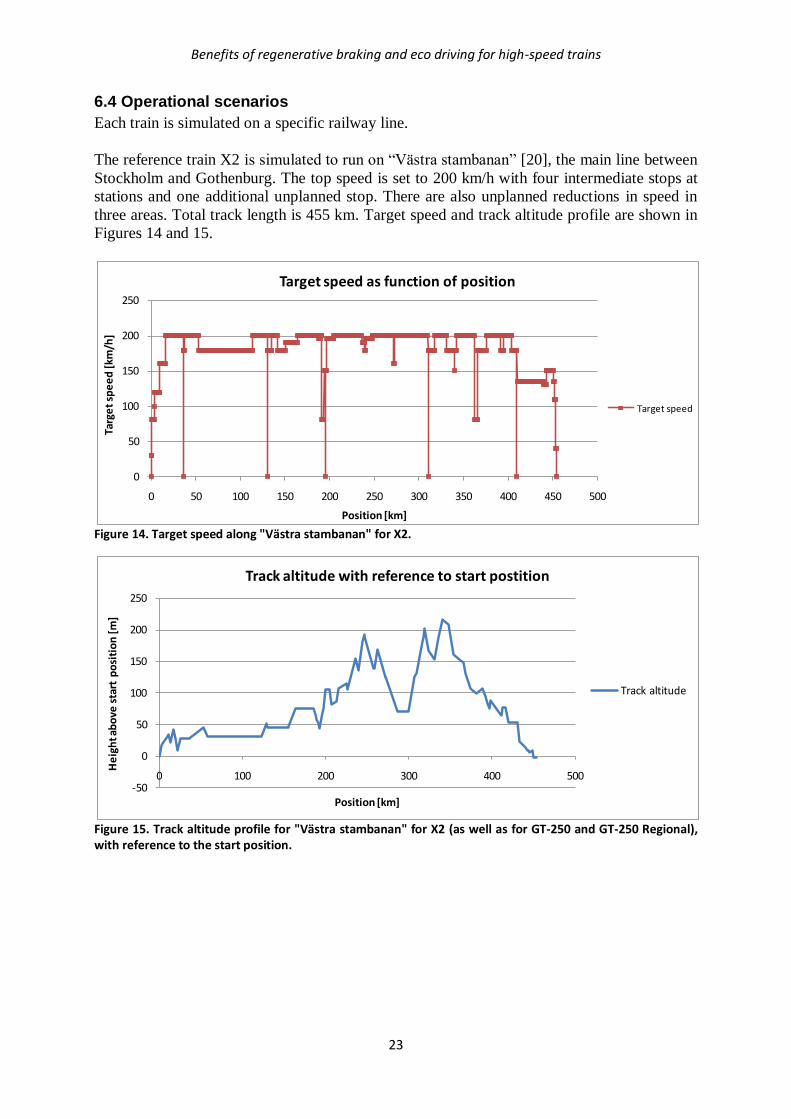
6.4 Operational scenarios
Each train is simulated on a specific railway line.
The reference train X2 is simulated to run on “Västra stambanan” [20], the main line between
Stockholm and Gothenburg. The top speed is set to 200 km/h with four intermediate stops at
stations and one additional unplanned stop. There are also unplanned reductions in speed in
three areas. Total track length is 455 km. Target speed and track altitude profile are shown in
Figures 14 and 15.
Figure 14. Target speed along "Västra stambanan" for X2.
Figure 15. Track altitude profile for "Västra stambanan" for X2 (as well as for GT-250 and GT-250 Regional), with reference to the start position.
0
50
100
150
200
250
0 50 100 150 200 250 300 350 400 450 500
Targ
et
spe
ed
[km
/h]
Position [km]
Target speed as function of position
Target speed
-50
0
50
100
150
200
250
0 100 200 300 400 500
He
igh
t ab
ove
sta
rt p
osi
tio
n [
m]
Position [km]
Track altitude with reference to start postition
Track altitude
Trains and operational cases
24
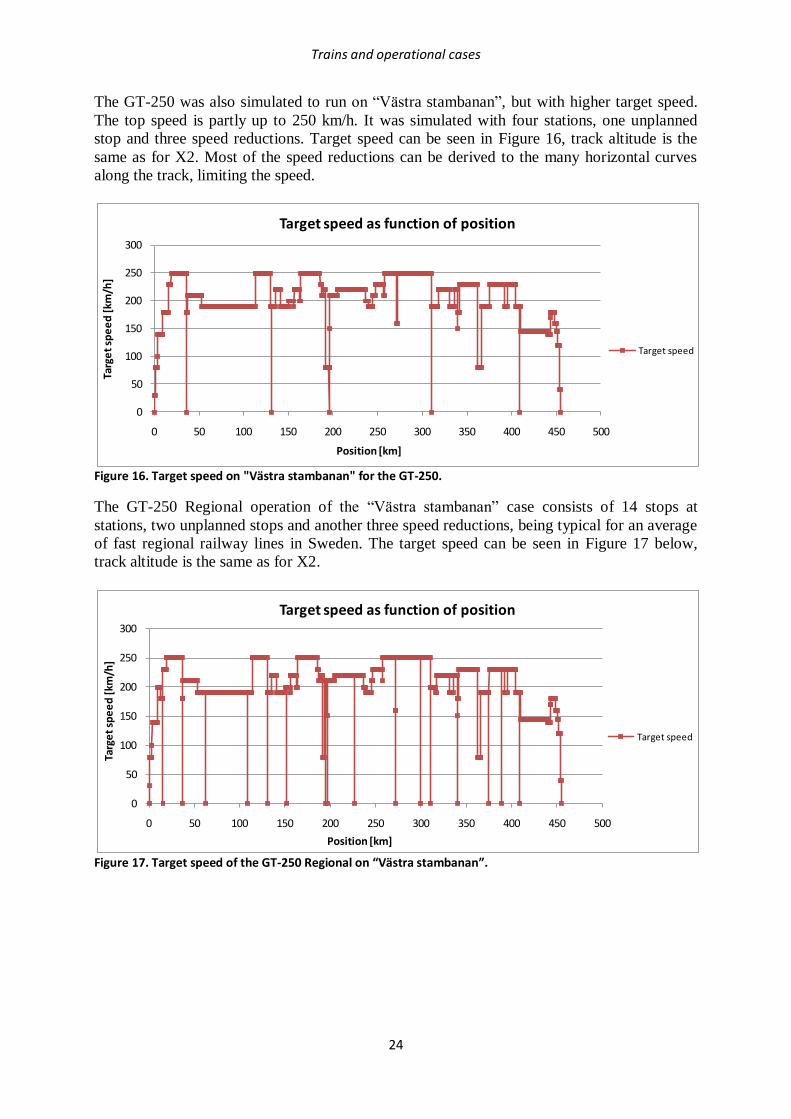
The GT-250 was also simulated to run on “Västra stambanan”, but with higher target speed.
The top speed is partly up to 250 km/h. It was simulated with four stations, one unplanned
stop and three speed reductions. Target speed can be seen in Figure 16, track altitude is the
same as for X2. Most of the speed reductions can be derived to the many horizontal curves
along the track, limiting the speed.
Figure 16. Target speed on "Västra stambanan" for the GT-250.
The GT-250 Regional operation of the “Västra stambanan” case consists of 14 stops at
stations, two unplanned stops and another three speed reductions, being typical for an average
of fast regional railway lines in Sweden. The target speed can be seen in Figure 17 below,
track altitude is the same as for X2.
Figure 17. Target speed of the GT-250 Regional on “Västra stambanan”.
0
50
100
150
200
250
300
0 50 100 150 200 250 300 350 400 450 500
Targ
et
spe
ed
[km
/h]
Position [km]
Target speed as function of position
Target speed
0
50
100
150
200
250
300
0 50 100 150 200 250 300 350 400 450 500
Targ
et
spe
ed
[km
/h]
Position [km]
Target speed as function of position
Target speed
Benefits of regenerative braking and eco driving for high-speed trains
25
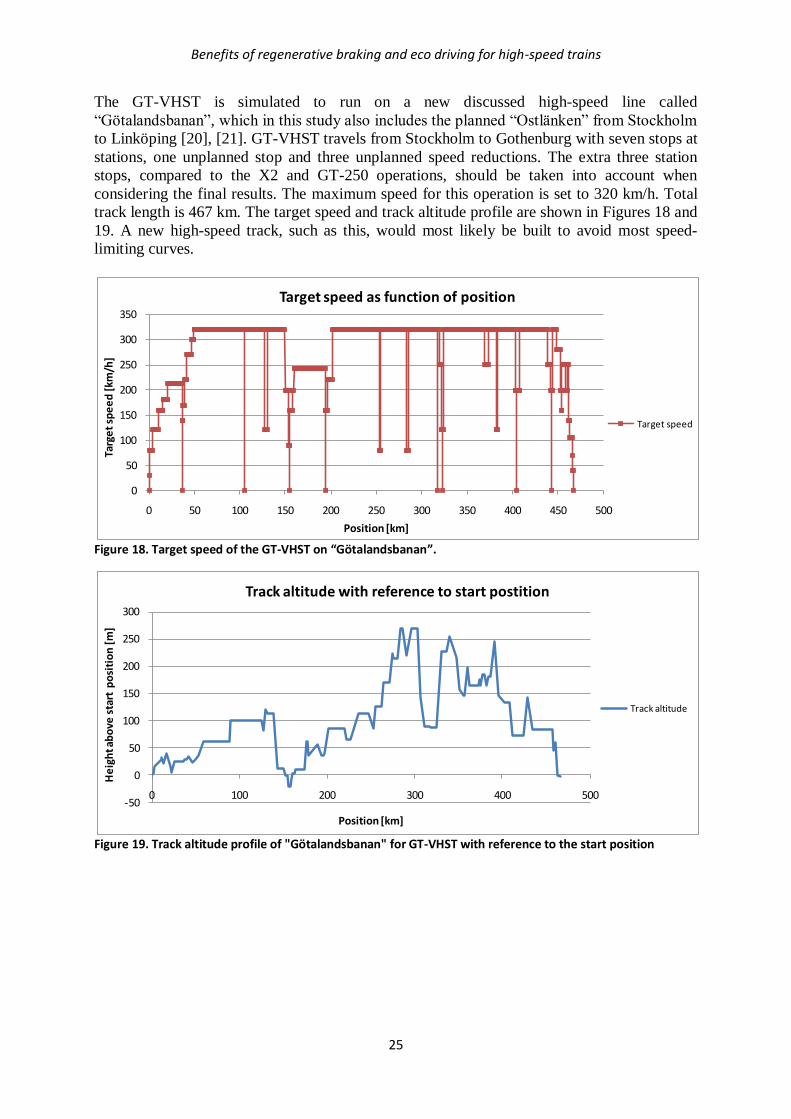
The GT-VHST is simulated to run on a new discussed high-speed line called
“Götalandsbanan”, which in this study also includes the planned “Ostlänken” from Stockholm
to Linköping [20], [21]. GT-VHST travels from Stockholm to Gothenburg with seven stops at
stations, one unplanned stop and three unplanned speed reductions. The extra three station
stops, compared to the X2 and GT-250 operations, should be taken into account when
considering the final results. The maximum speed for this operation is set to 320 km/h. Total
track length is 467 km. The target speed and track altitude profile are shown in Figures 18 and
19. A new high-speed track, such as this, would most likely be built to avoid most speed-
limiting curves.
Figure 18. Target speed of the GT-VHST on “Götalandsbanan”.
Figure 19. Track altitude profile of "Götalandsbanan" for GT-VHST with reference to the start position
0
50
100
150
200
250
300
350
0 50 100 150 200 250 300 350 400 450 500
Targ
et
spe
ed
[km
/h]
Position [km]
Target speed as function of position
Target speed
-50
0
50
100
150
200
250
300
0 100 200 300 400 500
He
igh
t ab
ove
sta
rt p
osi
tio
n [
m]
Position [km]
Track altitude with reference to start postition
Track altitude
Driving styles
26
7. Driving styles
To confirm the simulations made with STEC with respect to energy, regeneration and running
time, several test simulations were made to verify the program for the intended purpose. The
simulations were compared with simulations in [18] and with some tuning, mostly regarding
speeds, the results were in line with the previous study.
All cases used a 3 % lower maximum speed than the train’s permissible speed; this was to
make up for different reasons why the speed is sometimes lower than the target speed.
7.1 “Normal” driving style
Each train was simulated for a “normal” driving style, verified by the driver survey. The trains
were tested with the three different modes of braking described in Section 6.2: blended,
dynamic and electric braking. They were also simulated with both 90 % and 100 % degree of
regeneration.
“Normal” driving style was defined, in cooperation with Furukrona and Berndtsson [16] [17]
at the operator SJ AB, as a driving style similar to the ones commonly used in passenger
operations with a tight schedule. Essentially this means to quickly accelerate to the target
speed and to keep it for as long as possible before braking when approaching the next stop.
Coasting was not considered during these simulations even though train drivers also use this
technique.
7.2 Eco driving
A more ecological and economical driving style, called eco driving, was also simulated where
the same trains used as much electric regenerative braking as possible. A total of four eco
driving simulations were made for each train. It is estimated that the drivers are able to use 2 –
3 % of the timetabled travel time for eco driving, as an average over all operations, according
to Andersson [19]. Timetables have, in passenger operations, usually about 8 – 10 % of the
estimated travel time added for unforeseen events, sometimes more.
Coasting is a normal procedure to save energy, which means that the driver can turn off the
traction and let the train continue to roll, though the train will slowly decelerate due to the
running resistance. The coasting used in STEC follows Equation 16, at least initially, since
coasting to a stop would take too much time.
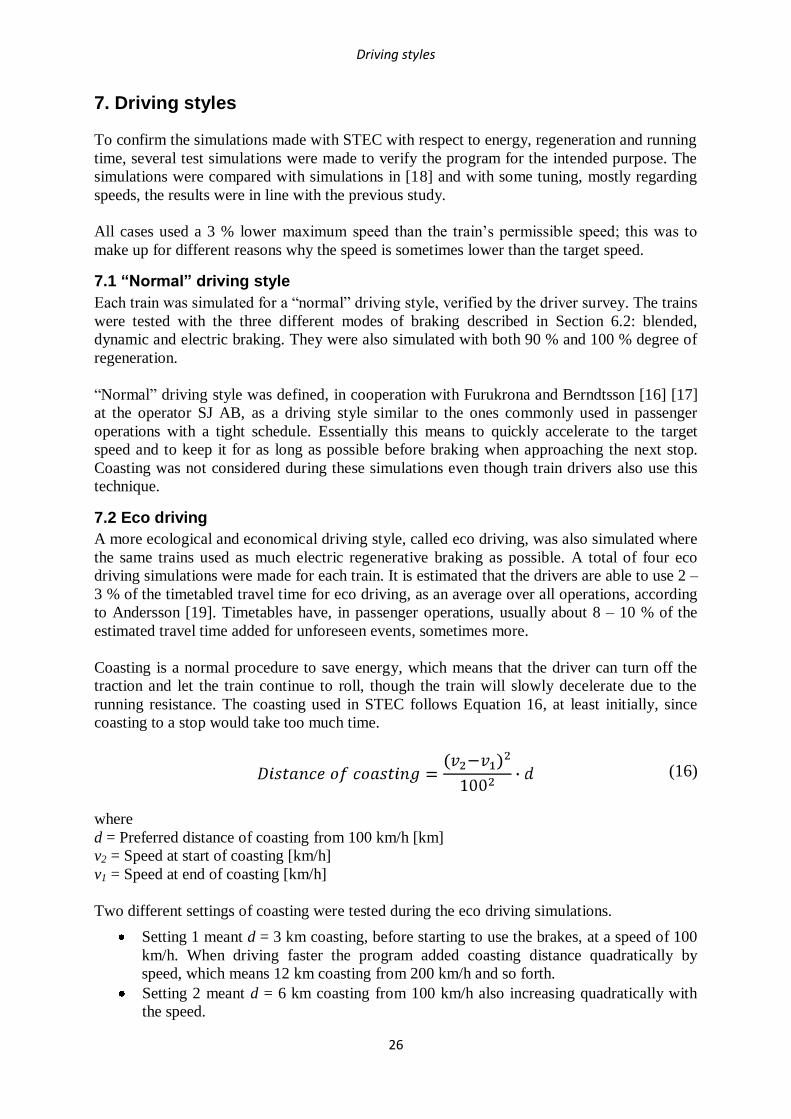
(16)
where
d = Preferred distance of coasting from 100 km/h [km]
v2 = Speed at start of coasting [km/h]
v1 = Speed at end of coasting [km/h]
Two different settings of coasting were tested during the eco driving simulations.
Setting 1 meant d = 3 km coasting, before starting to use the brakes, at a speed of 100
km/h. When driving faster the program added coasting distance quadratically by
speed, which means 12 km coasting from 200 km/h and so forth.
Setting 2 meant d = 6 km coasting from 100 km/h also increasing quadratically with
the speed.
Benefits of regenerative braking and eco driving for high-speed trains
27
The first two eco driving simulations were done with either coasting setting 1 or setting 2. A
third simulation was done with a reduction of speed peaks and a fourth simulation with both
reduced speed peaks and coasting setting number one.
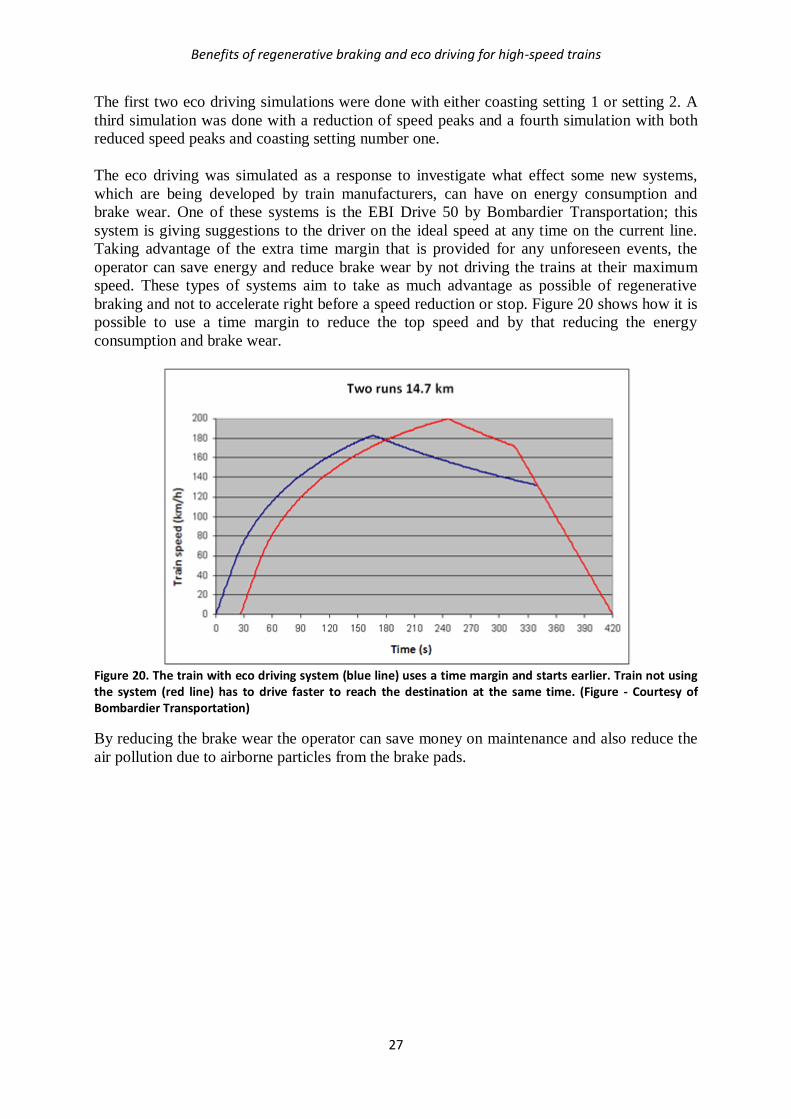
The eco driving was simulated as a response to investigate what effect some new systems,
which are being developed by train manufacturers, can have on energy consumption and
brake wear. One of these systems is the EBI Drive 50 by Bombardier Transportation; this
system is giving suggestions to the driver on the ideal speed at any time on the current line.
Taking advantage of the extra time margin that is provided for any unforeseen events, the
operator can save energy and reduce brake wear by not driving the trains at their maximum
speed. These types of systems aim to take as much advantage as possible of regenerative
braking and not to accelerate right before a speed reduction or stop. Figure 20 shows how it is
possible to use a time margin to reduce the top speed and by that reducing the energy
consumption and brake wear.
Figure 20. The train with eco driving system (blue line) uses a time margin and starts earlier. Train not using the system (red line) has to drive faster to reach the destination at the same time. (Figure - Courtesy of Bombardier Transportation)
By reducing the brake wear the operator can save money on maintenance and also reduce the
air pollution due to airborne particles from the brake pads.
Calculation of brake wear
28
8. Calculation of brake wear
In this chapter the calculation of brake wear is further described and some results used for the
final simulations and calculations are presented. All final results for the different operational
cases are presented in Chapter 9 and in Appendix B.
8.1 Brake pad temperatures and wear coefficients
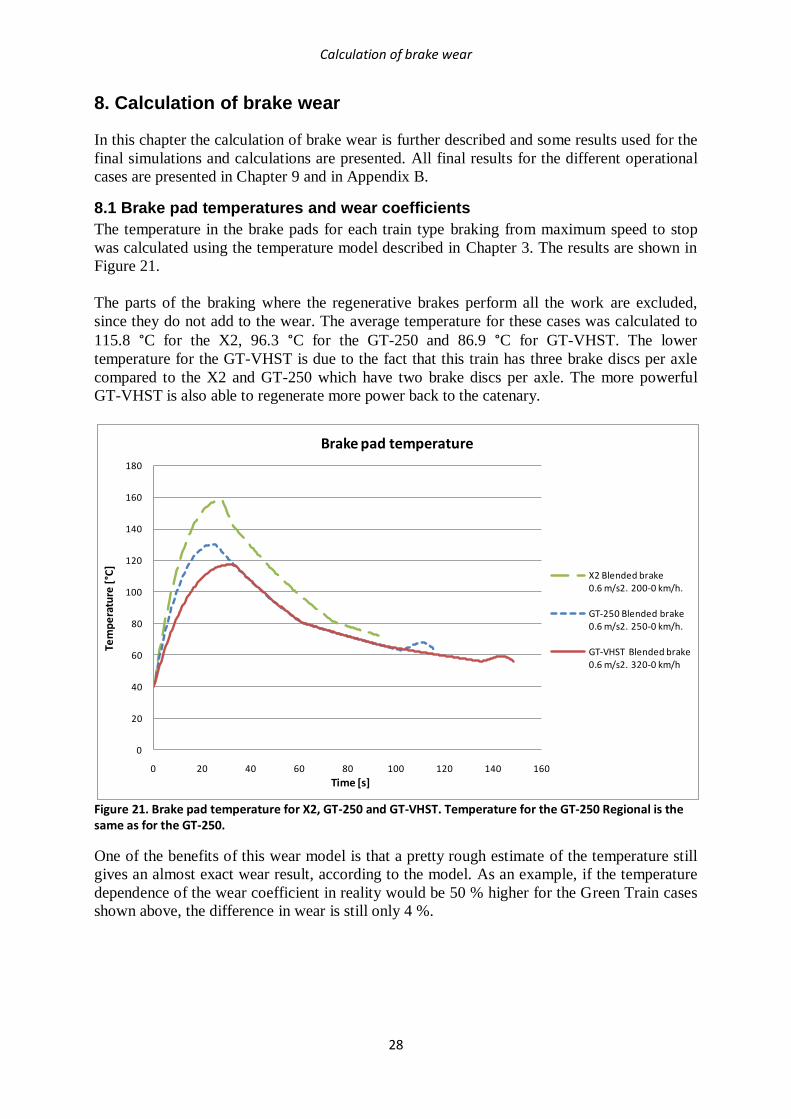
The temperature in the brake pads for each train type braking from maximum speed to stop
was calculated using the temperature model described in Chapter 3. The results are shown in
Figure 21.
The parts of the braking where the regenerative brakes perform all the work are excluded,
since they do not add to the wear. The average temperature for these cases was calculated to
115.8 °C for the X2, 96.3 °C for the GT-250 and 86.9 °C for GT-VHST. The lower
temperature for the GT-VHST is due to the fact that this train has three brake discs per axle
compared to the X2 and GT-250 which have two brake discs per axle. The more powerful
GT-VHST is also able to regenerate more power back to the catenary.
Figure 21. Brake pad temperature for X2, GT-250 and GT-VHST. Temperature for the GT-250 Regional is the same as for the GT-250.
One of the benefits of this wear model is that a pretty rough estimate of the temperature still
gives an almost exact wear result, according to the model. As an example, if the temperature
dependence of the wear coefficient in reality would be 50 % higher for the Green Train cases
shown above, the difference in wear is still only 4 %.
0
20
40
60
80
100
120
140
160
180
0 20 40 60 80 100 120 140 160
Tem
pe
ratu
re [
°C]
Time [s]
Brake pad temperature
X2 Blended brake 0.6 m/s2. 200-0 km/h.
GT-250 Blended brake 0.6 m/s2. 250-0 km/h.
GT-VHST Blended brake 0.6 m/s2. 320-0 km/h
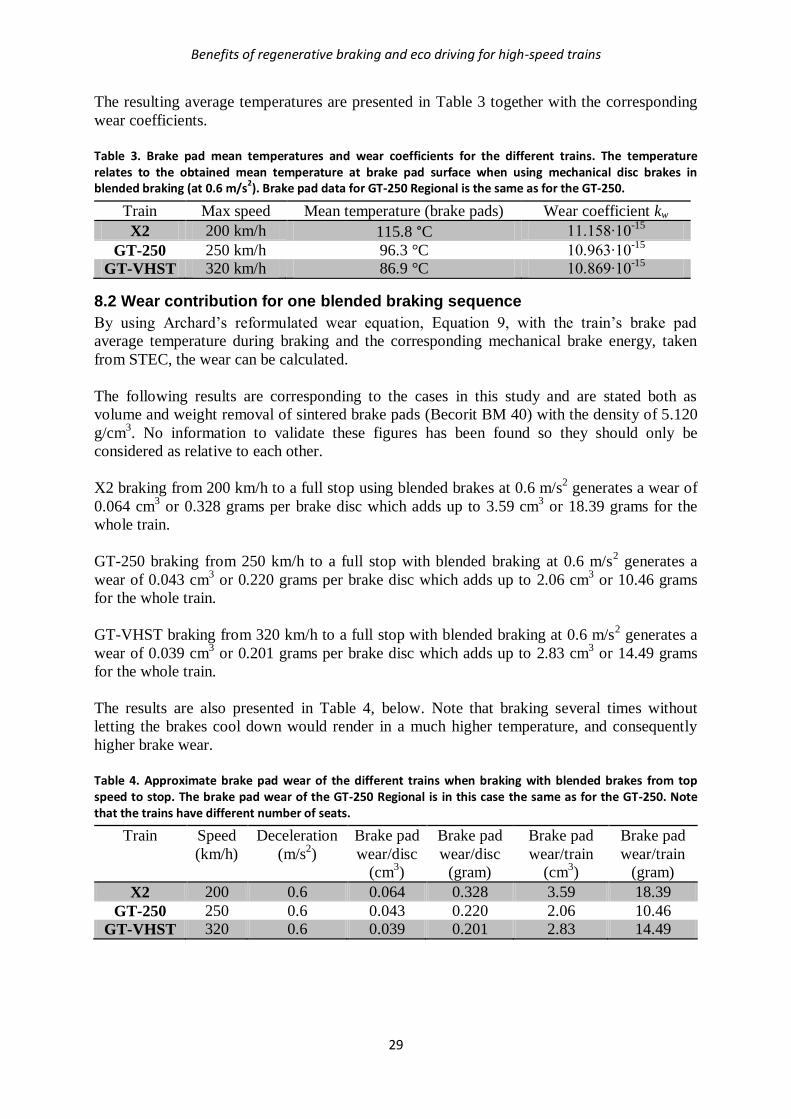
Benefits of regenerative braking and eco driving for high-speed trains
29
The resulting average temperatures are presented in Table 3 together with the corresponding
wear coefficients.
Table 3. Brake pad mean temperatures and wear coefficients for the different trains. The temperature relates to the obtained mean temperature at brake pad surface when using mechanical disc brakes in blended braking (at 0.6 m/s2). Brake pad data for GT-250 Regional is the same as for the GT-250.
Train Max speed Mean temperature (brake pads) Wear coefficient kw
X2 200 km/h 115.8 °C 11.158∙10-15
GT-250 250 km/h 96.3 °C 10.963∙10-15
GT-VHST 320 km/h 86.9 °C 10.869∙10-15
8.2 Wear contribution for one blended braking sequence
By using Archard’s reformulated wear equation, Equation 9, with the train’s brake pad
average temperature during braking and the corresponding mechanical brake energy, taken
from STEC, the wear can be calculated.
The following results are corresponding to the cases in this study and are stated both as
volume and weight removal of sintered brake pads (Becorit BM 40) with the density of 5.120
g/cm3. No information to validate these figures has been found so they should only be
considered as relative to each other.
X2 braking from 200 km/h to a full stop using blended brakes at 0.6 m/s2 generates a wear of
0.064 cm3 or 0.328 grams per brake disc which adds up to 3.59 cm
3 or 18.39 grams for the
whole train.
GT-250 braking from 250 km/h to a full stop with blended braking at 0.6 m/s2 generates a
wear of 0.043 cm3 or 0.220 grams per brake disc which adds up to 2.06 cm
3 or 10.46 grams
for the whole train.
GT-VHST braking from 320 km/h to a full stop with blended braking at 0.6 m/s2 generates a
wear of 0.039 cm3 or 0.201 grams per brake disc which adds up to 2.83 cm
3 or 14.49 grams
for the whole train.
The results are also presented in Table 4, below. Note that braking several times without
letting the brakes cool down would render in a much higher temperature, and consequently
higher brake wear.
Table 4. Approximate brake pad wear of the different trains when braking with blended brakes from top speed to stop. The brake pad wear of the GT-250 Regional is in this case the same as for the GT-250. Note that the trains have different number of seats.
Train Speed
(km/h)
Deceleration
(m/s2)
Brake pad
wear/disc
(cm3)
Brake pad
wear/disc
(gram)
Brake pad
wear/train
(cm3)
Brake pad
wear/train
(gram)
X2 200 0.6 0.064 0.328 3.59 18.39
GT-250 250 0.6 0.043 0.220 2.06 10.46
GT-VHST 320 0.6 0.039 0.201 2.83 14.49
Simulation results
30
9. Simulation results
In this chapter the results from the simulations (regarding energy consumption, travel time
etc.) and corresponding brake wear calculations are provided. Additional results of energy
consumption and brake wear are found in Appendix B.
Thanks to the results of the simulations in the program STEC and calculations made in earlier
chapters the brake wear of the different cases can be calculated. The wear data are presented
to allow for a comparison between the different cases in this study and should be seen as
relative. To be able to give precise figures of the wear it is necessary to validate them through
experimental studies or full scale testing.
For the simulations, a limited number of driving characteristics has been chosen. The types of
braking that is used during the simulations are:
Blended braking; means that maximum available regenerative braking is used and that
the mechanical brakes are used as a supplement to make the desired deceleration of
0.6 m/s2.
Dynamic braking; uses mechanical brakes as a supplement below a certain speed, thus
at higher speeds only electric regenerative braking is used. When using only
regenerative brakes it is not always possible to reach 0.6 m/s2.
Electric braking; means that only the regenerative brakes are being used.
The specific energy consumption is stated in Wh/seat-km. These figures include all losses in
the electric systems in the train and the railway’s electric supply system as well as comfort
and auxiliary systems energy consumption.
Two different settings of the degree of regeneration have been tested, i.e. 90 % and 100 %.
This is because it is sometimes not possible for the train to regenerate all available power
back to the catenary, or that for some reason the emergency brakes are applied. The degree of
regeneration is stated in percent of full regeneration in all operational cases.
The regeneration of the accumulated input energy is also stated and is simply called
“Regeneration”, or “Regen.” for short, in Tables 5 – 18. This value indicates how much
energy that the electric regenerative brakes really feed back to the catenary in relation to the
input energy, taking losses in the train’s propulsion system as well as the assumed degree of
regeneration into account.
A nominal value of the brake pad wear is made available, where the wear of X2 on “Västra
stambanan” (4+1 stops) with blended braking (case 001 in Table 5) is set to index 100. All
other cases have a value compared to this. The nominal value is based on the wear/seat-km
which means that the length of the track does not interfere, it does however favour trains with
more seats.
In Sections 9.1 – 9.7 the results for the different trains, in their respective operations in this
study, are shown. Several, for this study, important comparisons are made and in Chapter 10
some of these are clarified graphically.
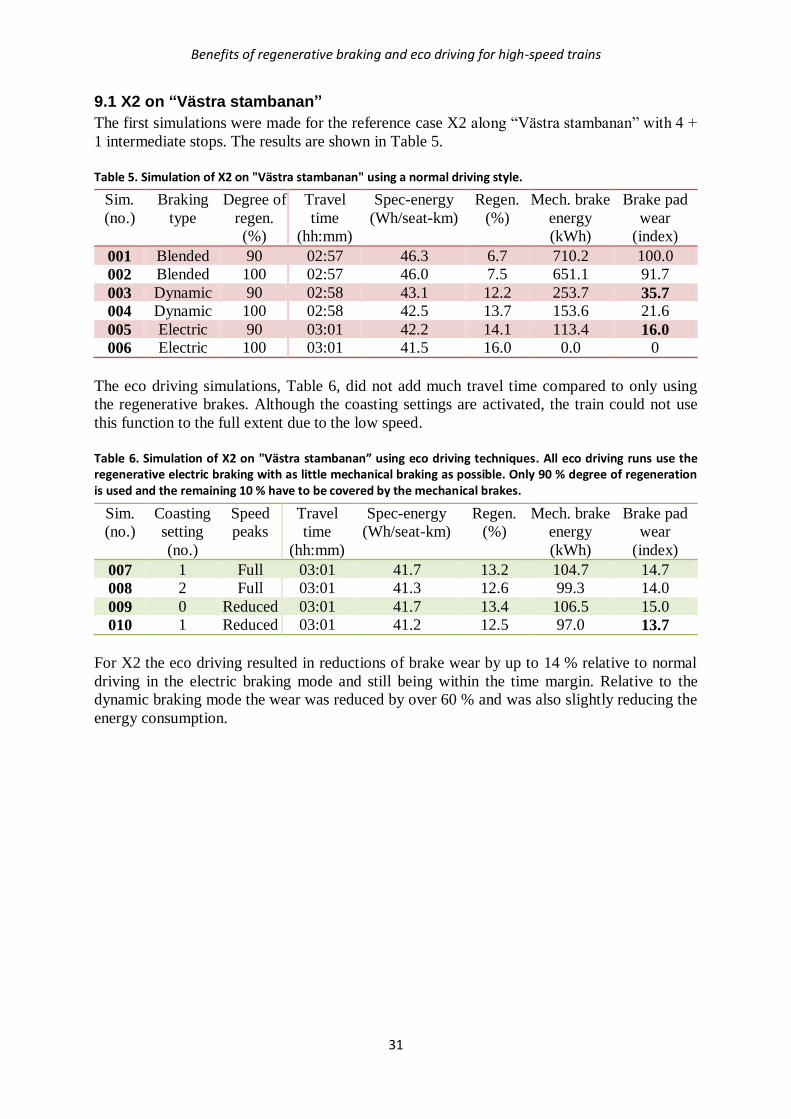
Benefits of regenerative braking and eco driving for high-speed trains
31
9.1 X2 on “Västra stambanan”
The first simulations were made for the reference case X2 along “Västra stambanan” with 4 +
1 intermediate stops. The results are shown in Table 5.
Table 5. Simulation of X2 on "Västra stambanan" using a normal driving style.
Sim.
(no.)
Braking
type
Degree of
regen.
(%)
Travel
time
(hh:mm)
Spec-energy
(Wh/seat-km)
Regen.
(%)
Mech. brake
energy
(kWh)
Brake pad
wear
(index)
001 Blended 90 02:57 46.3 6.7 710.2 100.0
002 Blended 100 02:57 46.0 7.5 651.1 91.7
003 Dynamic 90 02:58 43.1 12.2 253.7 35.7
004 Dynamic 100 02:58 42.5 13.7 153.6 21.6
005 Electric 90 03:01 42.2 14.1 113.4 16.0
006 Electric 100 03:01 41.5 16.0 0.0 0
The eco driving simulations, Table 6, did not add much travel time compared to only using
the regenerative brakes. Although the coasting settings are activated, the train could not use
this function to the full extent due to the low speed.
Table 6. Simulation of X2 on "Västra stambanan” using eco driving techniques. All eco driving runs use the regenerative electric braking with as little mechanical braking as possible. Only 90 % degree of regeneration is used and the remaining 10 % have to be covered by the mechanical brakes.
Sim.
(no.)
Coasting
setting
(no.)
Speed
peaks
Travel
time
(hh:mm)
Spec-energy
(Wh/seat-km)
Regen.
(%)
Mech. brake
energy
(kWh)
Brake pad
wear
(index)
007 1 Full 03:01 41.7 13.2 104.7 14.7
008 2 Full 03:01 41.3 12.6 99.3 14.0
009 0 Reduced 03:01 41.7 13.4 106.5 15.0
010 1 Reduced 03:01 41.2 12.5 97.0 13.7
For X2 the eco driving resulted in reductions of brake wear by up to 14 % relative to normal
driving in the electric braking mode and still being within the time margin. Relative to the
dynamic braking mode the wear was reduced by over 60 % and was also slightly reducing the
energy consumption.
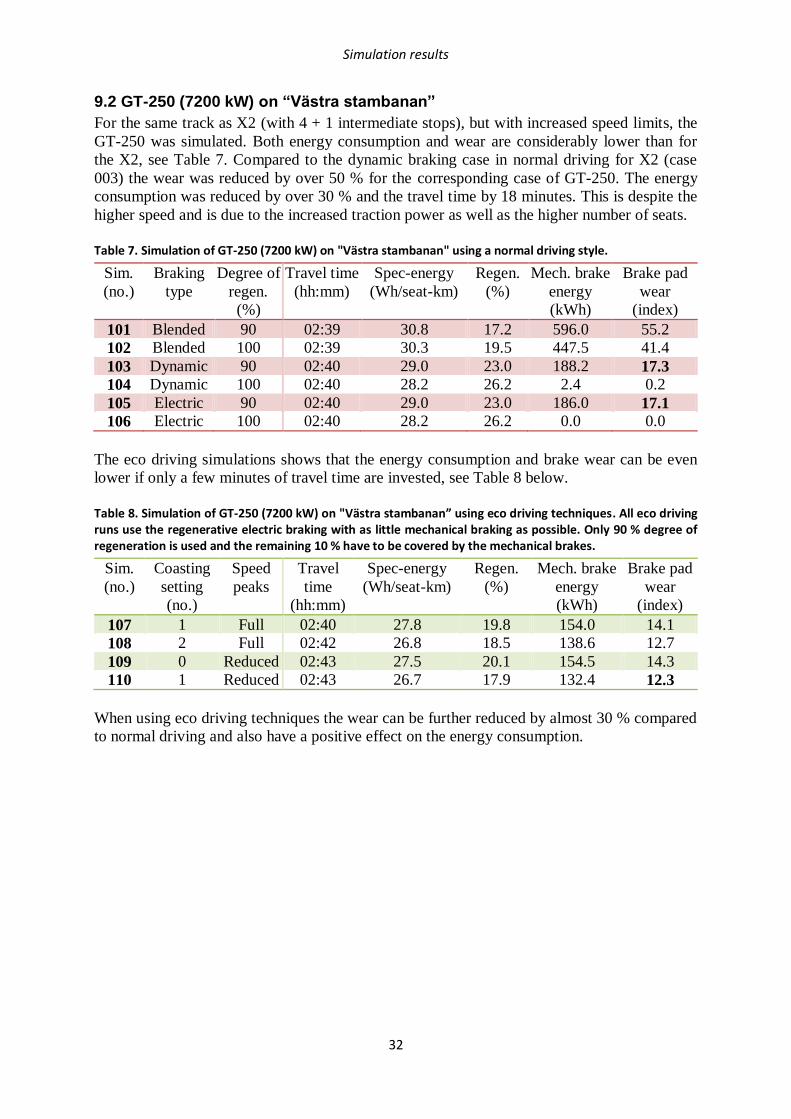
Simulation results
32
9.2 GT-250 (7200 kW) on “Västra stambanan”
For the same track as X2 (with 4 + 1 intermediate stops), but with increased speed limits, the
GT-250 was simulated. Both energy consumption and wear are considerably lower than for
the X2, see Table 7. Compared to the dynamic braking case in normal driving for X2 (case
003) the wear was reduced by over 50 % for the corresponding case of GT-250. The energy
consumption was reduced by over 30 % and the travel time by 18 minutes. This is despite the
higher speed and is due to the increased traction power as well as the higher number of seats.
Table 7. Simulation of GT-250 (7200 kW) on "Västra stambanan" using a normal driving style.
Sim.
(no.)
Braking
type
Degree of
regen.
(%)
Travel time
(hh:mm)
Spec-energy
(Wh/seat-km)
Regen.
(%)
Mech. brake
energy
(kWh)
Brake pad
wear
(index)
101 Blended 90 02:39 30.8 17.2 596.0 55.2
102 Blended 100 02:39 30.3 19.5 447.5 41.4
103 Dynamic 90 02:40 29.0 23.0 188.2 17.3
104 Dynamic 100 02:40 28.2 26.2 2.4 0.2
105 Electric 90 02:40 29.0 23.0 186.0 17.1
106 Electric 100 02:40 28.2 26.2 0.0 0.0
The eco driving simulations shows that the energy consumption and brake wear can be even
lower if only a few minutes of travel time are invested, see Table 8 below.
Table 8. Simulation of GT-250 (7200 kW) on "Västra stambanan” using eco driving techniques. All eco driving runs use the regenerative electric braking with as little mechanical braking as possible. Only 90 % degree of regeneration is used and the remaining 10 % have to be covered by the mechanical brakes.
Sim.
(no.)
Coasting
setting
(no.)
Speed
peaks
Travel
time
(hh:mm)
Spec-energy
(Wh/seat-km)
Regen.
(%)
Mech. brake
energy
(kWh)
Brake pad
wear
(index)
107 1 Full 02:40 27.8 19.8 154.0 14.1
108 2 Full 02:42 26.8 18.5 138.6 12.7
109 0 Reduced 02:43 27.5 20.1 154.5 14.3
110 1 Reduced 02:43 26.7 17.9 132.4 12.3
When using eco driving techniques the wear can be further reduced by almost 30 % compared
to normal driving and also have a positive effect on the energy consumption.
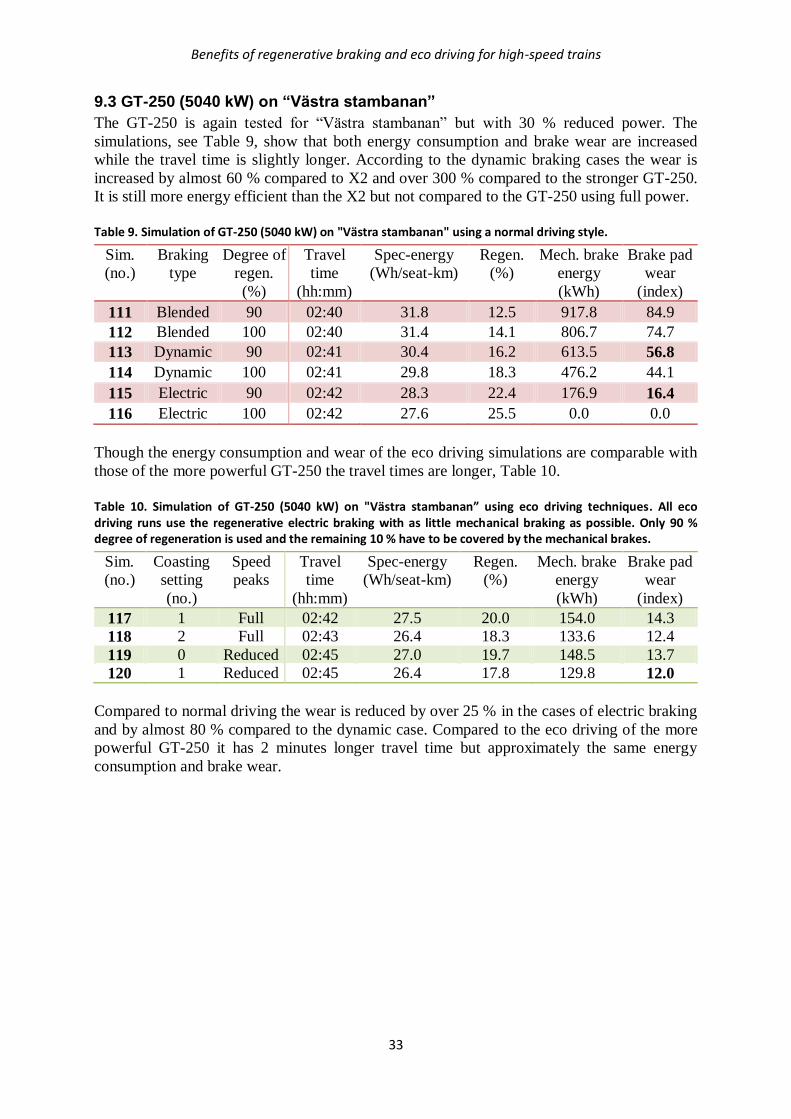
Benefits of regenerative braking and eco driving for high-speed trains
33
9.3 GT-250 (5040 kW) on “Västra stambanan”
The GT-250 is again tested for “Västra stambanan” but with 30 % reduced power. The
simulations, see Table 9, show that both energy consumption and brake wear are increased
while the travel time is slightly longer. According to the dynamic braking cases the wear is
increased by almost 60 % compared to X2 and over 300 % compared to the stronger GT-250.
It is still more energy efficient than the X2 but not compared to the GT-250 using full power.
Table 9. Simulation of GT-250 (5040 kW) on "Västra stambanan" using a normal driving style.
Sim.
(no.)
Braking
type
Degree of
regen.
(%)
Travel
time
(hh:mm)
Spec-energy
(Wh/seat-km)
Regen.
(%)
Mech. brake
energy
(kWh)
Brake pad
wear
(index)
111 Blended 90 02:40 31.8 12.5 917.8 84.9
112 Blended 100 02:40 31.4 14.1 806.7 74.7
113 Dynamic 90 02:41 30.4 16.2 613.5 56.8
114 Dynamic 100 02:41 29.8 18.3 476.2 44.1
115 Electric 90 02:42 28.3 22.4 176.9 16.4
116 Electric 100 02:42 27.6 25.5 0.0 0.0
Though the energy consumption and wear of the eco driving simulations are comparable with
those of the more powerful GT-250 the travel times are longer, Table 10.
Table 10. Simulation of GT-250 (5040 kW) on "Västra stambanan” using eco driving techniques. All eco driving runs use the regenerative electric braking with as little mechanical braking as possible. Only 90 % degree of regeneration is used and the remaining 10 % have to be covered by the mechanical brakes.
Sim.
(no.)
Coasting
setting
(no.)
Speed
peaks
Travel
time
(hh:mm)
Spec-energy
(Wh/seat-km)
Regen.
(%)
Mech. brake
energy
(kWh)
Brake pad
wear
(index)
117 1 Full 02:42 27.5 20.0 154.0 14.3
118 2 Full 02:43 26.4 18.3 133.6 12.4
119 0 Reduced 02:45 27.0 19.7 148.5 13.7
120 1 Reduced 02:45 26.4 17.8 129.8 12.0
Compared to normal driving the wear is reduced by over 25 % in the cases of electric braking
and by almost 80 % compared to the dynamic case. Compared to the eco driving of the more
powerful GT-250 it has 2 minutes longer travel time but approximately the same energy
consumption and brake wear.
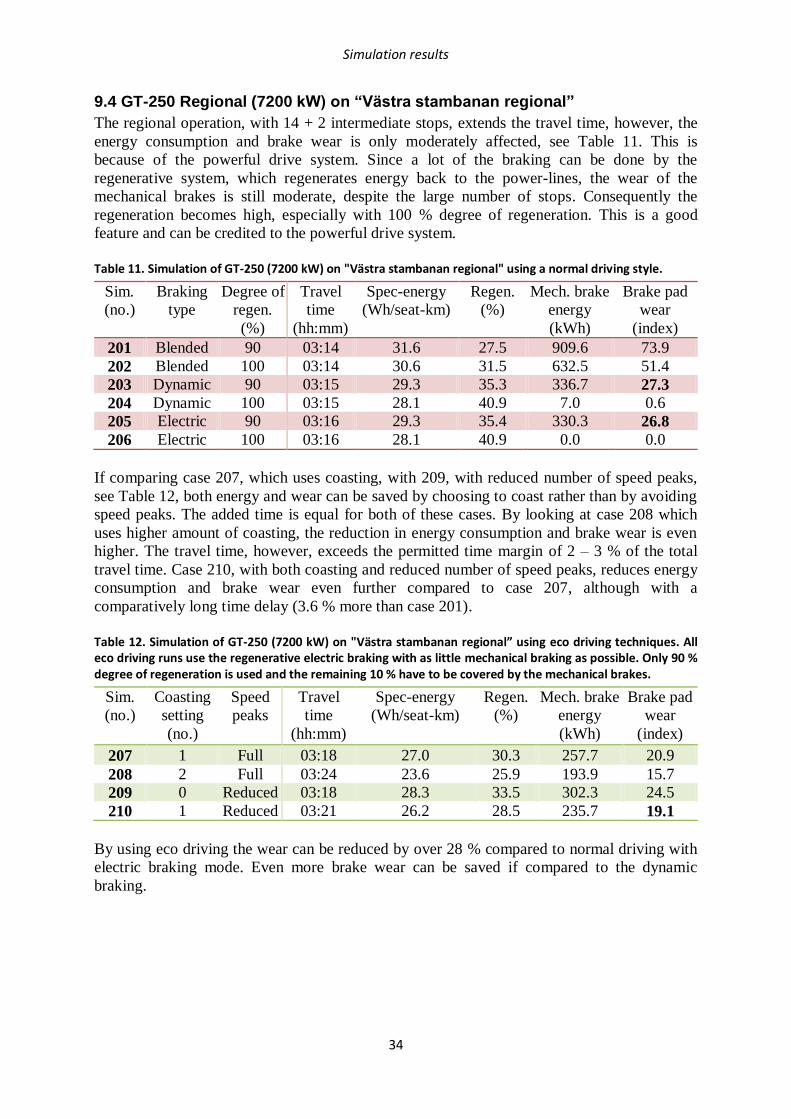
Simulation results
34
9.4 GT-250 Regional (7200 kW) on “Västra stambanan regional”
The regional operation, with 14 + 2 intermediate stops, extends the travel time, however, the
energy consumption and brake wear is only moderately affected, see Table 11. This is
because of the powerful drive system. Since a lot of the braking can be done by the
regenerative system, which regenerates energy back to the power-lines, the wear of the
mechanical brakes is still moderate, despite the large number of stops. Consequently the
regeneration becomes high, especially with 100 % degree of regeneration. This is a good
feature and can be credited to the powerful drive system.
Table 11. Simulation of GT-250 (7200 kW) on "Västra stambanan regional" using a normal driving style.
Sim.
(no.)
Braking
type
Degree of
regen.
(%)
Travel
time
(hh:mm)
Spec-energy
(Wh/seat-km)
Regen.
(%)
Mech. brake
energy
(kWh)
Brake pad
wear
(index)
201 Blended 90 03:14 31.6 27.5 909.6 73.9
202 Blended 100 03:14 30.6 31.5 632.5 51.4
203 Dynamic 90 03:15 29.3 35.3 336.7 27.3
204 Dynamic 100 03:15 28.1 40.9 7.0 0.6
205 Electric 90 03:16 29.3 35.4 330.3 26.8
206 Electric 100 03:16 28.1 40.9 0.0 0.0
If comparing case 207, which uses coasting, with 209, with reduced number of speed peaks,
see Table 12, both energy and wear can be saved by choosing to coast rather than by avoiding
speed peaks. The added time is equal for both of these cases. By looking at case 208 which
uses higher amount of coasting, the reduction in energy consumption and brake wear is even
higher. The travel time, however, exceeds the permitted time margin of 2 – 3 % of the total
travel time. Case 210, with both coasting and reduced number of speed peaks, reduces energy
consumption and brake wear even further compared to case 207, although with a
comparatively long time delay (3.6 % more than case 201).
Table 12. Simulation of GT-250 (7200 kW) on "Västra stambanan regional” using eco driving techniques. All eco driving runs use the regenerative electric braking with as little mechanical braking as possible. Only 90 % degree of regeneration is used and the remaining 10 % have to be covered by the mechanical brakes.
Sim.
(no.)
Coasting
setting
(no.)
Speed
peaks
Travel
time
(hh:mm)
Spec-energy
(Wh/seat-km)
Regen.
(%)
Mech. brake
energy
(kWh)
Brake pad
wear
(index)
207 1 Full 03:18 27.0 30.3 257.7 20.9
208 2 Full 03:24 23.6 25.9 193.9 15.7
209 0 Reduced 03:18 28.3 33.5 302.3 24.5
210 1 Reduced 03:21 26.2 28.5 235.7 19.1
By using eco driving the wear can be reduced by over 28 % compared to normal driving with
electric braking mode. Even more brake wear can be saved if compared to the dynamic
braking.
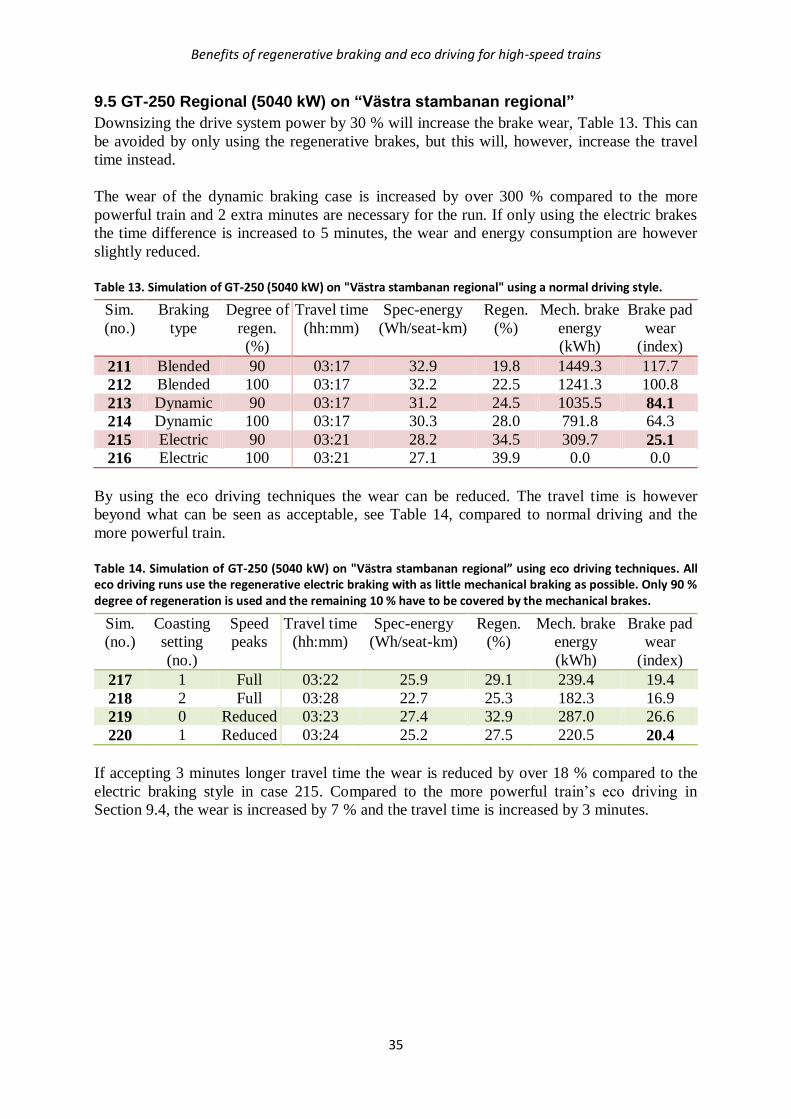
Benefits of regenerative braking and eco driving for high-speed trains
35
9.5 GT-250 Regional (5040 kW) on “Västra stambanan regional”
Downsizing the drive system power by 30 % will increase the brake wear, Table 13. This can
be avoided by only using the regenerative brakes, but this will, however, increase the travel
time instead.
The wear of the dynamic braking case is increased by over 300 % compared to the more
powerful train and 2 extra minutes are necessary for the run. If only using the electric brakes
the time difference is increased to 5 minutes, the wear and energy consumption are however
slightly reduced.
Table 13. Simulation of GT-250 (5040 kW) on "Västra stambanan regional" using a normal driving style.
Sim.
(no.)
Braking
type
Degree of
regen.
(%)
Travel time
(hh:mm)
Spec-energy
(Wh/seat-km)
Regen.
(%)
Mech. brake
energy
(kWh)
Brake pad
wear
(index)
211 Blended 90 03:17 32.9 19.8 1449.3 117.7
212 Blended 100 03:17 32.2 22.5 1241.3 100.8
213 Dynamic 90 03:17 31.2 24.5 1035.5 84.1
214 Dynamic 100 03:17 30.3 28.0 791.8 64.3
215 Electric 90 03:21 28.2 34.5 309.7 25.1
216 Electric 100 03:21 27.1 39.9 0.0 0.0
By using the eco driving techniques the wear can be reduced. The travel time is however
beyond what can be seen as acceptable, see Table 14, compared to normal driving and the
more powerful train.
Table 14. Simulation of GT-250 (5040 kW) on "Västra stambanan regional” using eco driving techniques. All eco driving runs use the regenerative electric braking with as little mechanical braking as possible. Only 90 % degree of regeneration is used and the remaining 10 % have to be covered by the mechanical brakes.
Sim.
(no.)
Coasting
setting
(no.)
Speed
peaks
Travel time
(hh:mm)
Spec-energy
(Wh/seat-km)
Regen.
(%)
Mech. brake
energy
(kWh)
Brake pad
wear
(index)
217 1 Full 03:22 25.9 29.1 239.4 19.4
218 2 Full 03:28 22.7 25.3 182.3 16.9
219 0 Reduced 03:23 27.4 32.9 287.0 26.6
220 1 Reduced 03:24 25.2 27.5 220.5 20.4
If accepting 3 minutes longer travel time the wear is reduced by over 18 % compared to the
electric braking style in case 215. Compared to the more powerful train’s eco driving in
Section 9.4, the wear is increased by 7 % and the travel time is increased by 3 minutes.
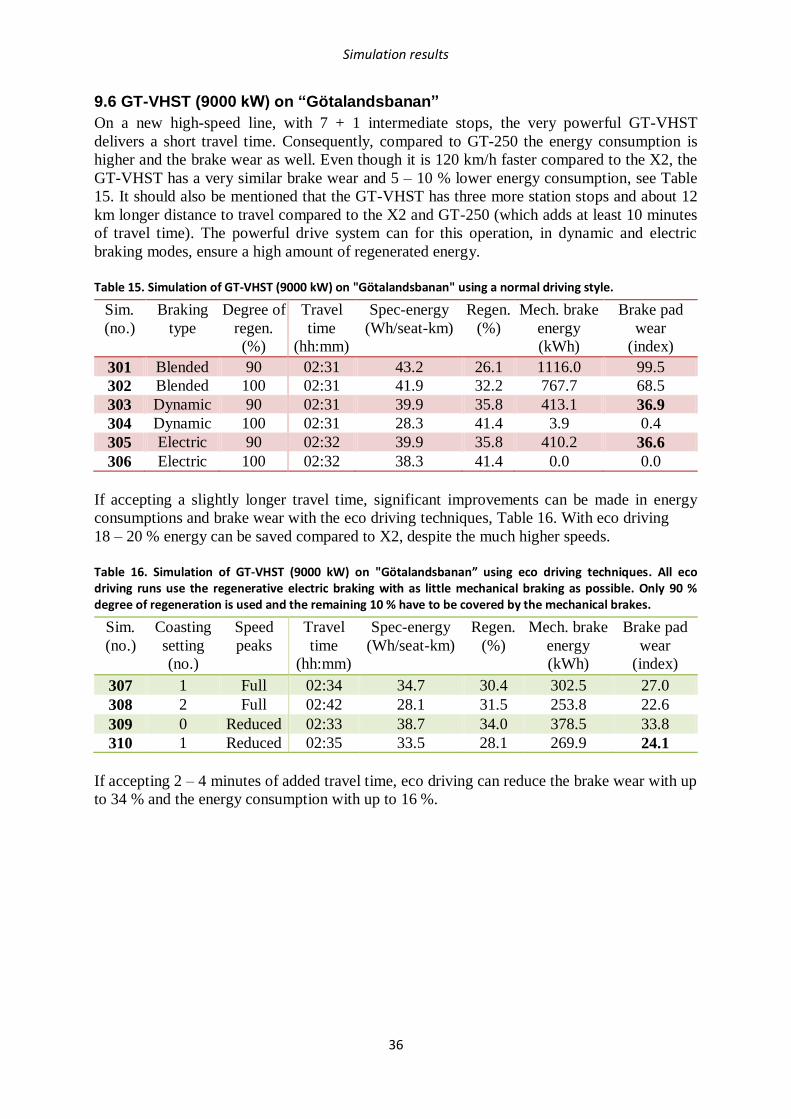
Simulation results
36
9.6 GT-VHST (9000 kW) on “Götalandsbanan”
On a new high-speed line, with 7 + 1 intermediate stops, the very powerful GT-VHST
delivers a short travel time. Consequently, compared to GT-250 the energy consumption is
higher and the brake wear as well. Even though it is 120 km/h faster compared to the X2, the
GT-VHST has a very similar brake wear and 5 – 10 % lower energy consumption, see Table
15. It should also be mentioned that the GT-VHST has three more station stops and about 12
km longer distance to travel compared to the X2 and GT-250 (which adds at least 10 minutes
of travel time). The powerful drive system can for this operation, in dynamic and electric
braking modes, ensure a high amount of regenerated energy.
Table 15. Simulation of GT-VHST (9000 kW) on "Götalandsbanan" using a normal driving style.
Sim.
(no.)
Braking
type
Degree of
regen.
(%)
Travel
time
(hh:mm)
Spec-energy
(Wh/seat-km)
Regen.
(%)
Mech. brake
energy
(kWh)
Brake pad
wear
(index)
301 Blended 90 02:31 43.2 26.1 1116.0 99.5
302 Blended 100 02:31 41.9 32.2 767.7 68.5
303 Dynamic 90 02:31 39.9 35.8 413.1 36.9
304 Dynamic 100 02:31 28.3 41.4 3.9 0.4
305 Electric 90 02:32 39.9 35.8 410.2 36.6
306 Electric 100 02:32 38.3 41.4 0.0 0.0
If accepting a slightly longer travel time, significant improvements can be made in energy
consumptions and brake wear with the eco driving techniques, Table 16. With eco driving
18 – 20 % energy can be saved compared to X2, despite the much higher speeds.
Table 16. Simulation of GT-VHST (9000 kW) on "Götalandsbanan” using eco driving techniques. All eco driving runs use the regenerative electric braking with as little mechanical braking as possible. Only 90 % degree of regeneration is used and the remaining 10 % have to be covered by the mechanical brakes.
Sim.
(no.)
Coasting
setting
(no.)
Speed
peaks
Travel
time
(hh:mm)
Spec-energy
(Wh/seat-km)
Regen.
(%)
Mech. brake
energy
(kWh)
Brake pad
wear
(index)
307 1 Full 02:34 34.7 30.4 302.5 27.0
308 2 Full 02:42 28.1 31.5 253.8 22.6
309 0 Reduced 02:33 38.7 34.0 378.5 33.8
310 1 Reduced 02:35 33.5 28.1 269.9 24.1
If accepting 2 – 4 minutes of added travel time, eco driving can reduce the brake wear with up
to 34 % and the energy consumption with up to 16 %.
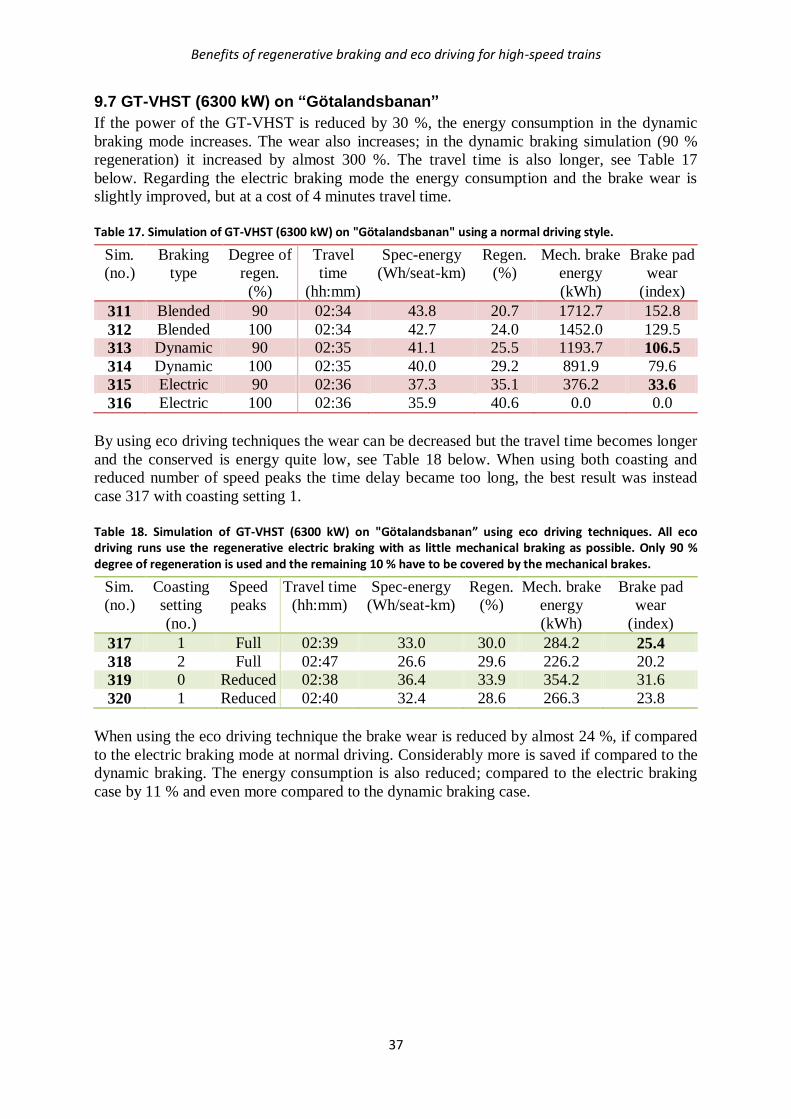
Benefits of regenerative braking and eco driving for high-speed trains
37
9.7 GT-VHST (6300 kW) on “Götalandsbanan”
If the power of the GT-VHST is reduced by 30 %, the energy consumption in the dynamic
braking mode increases. The wear also increases; in the dynamic braking simulation (90 %
regeneration) it increased by almost 300 %. The travel time is also longer, see Table 17
below. Regarding the electric braking mode the energy consumption and the brake wear is
slightly improved, but at a cost of 4 minutes travel time.
Table 17. Simulation of GT-VHST (6300 kW) on "Götalandsbanan" using a normal driving style.
Sim.
(no.)
Braking
type
Degree of
regen.
(%)
Travel
time
(hh:mm)
Spec-energy
(Wh/seat-km)
Regen.
(%)
Mech. brake
energy
(kWh)
Brake pad
wear
(index)
311 Blended 90 02:34 43.8 20.7 1712.7 152.8
312 Blended 100 02:34 42.7 24.0 1452.0 129.5
313 Dynamic 90 02:35 41.1 25.5 1193.7 106.5
314 Dynamic 100 02:35 40.0 29.2 891.9 79.6
315 Electric 90 02:36 37.3 35.1 376.2 33.6
316 Electric 100 02:36 35.9 40.6 0.0 0.0
By using eco driving techniques the wear can be decreased but the travel time becomes longer
and the conserved is energy quite low, see Table 18 below. When using both coasting and
reduced number of speed peaks the time delay became too long, the best result was instead
case 317 with coasting setting 1.
Table 18. Simulation of GT-VHST (6300 kW) on "Götalandsbanan” using eco driving techniques. All eco driving runs use the regenerative electric braking with as little mechanical braking as possible. Only 90 % degree of regeneration is used and the remaining 10 % have to be covered by the mechanical brakes.
Sim.
(no.)
Coasting
setting
(no.)
Speed
peaks
Travel time
(hh:mm)
Spec-energy
(Wh/seat-km)
Regen.
(%)
Mech. brake
energy
(kWh)
Brake pad
wear
(index)
317 1 Full 02:39 33.0 30.0 284.2 25.4
318 2 Full 02:47 26.6 29.6 226.2 20.2
319 0 Reduced 02:38 36.4 33.9 354.2 31.6
320 1 Reduced 02:40 32.4 28.6 266.3 23.8
When using the eco driving technique the brake wear is reduced by almost 24 %, if compared
to the electric braking mode at normal driving. Considerably more is saved if compared to the
dynamic braking. The energy consumption is also reduced; compared to the electric braking
case by 11 % and even more compared to the dynamic braking case.
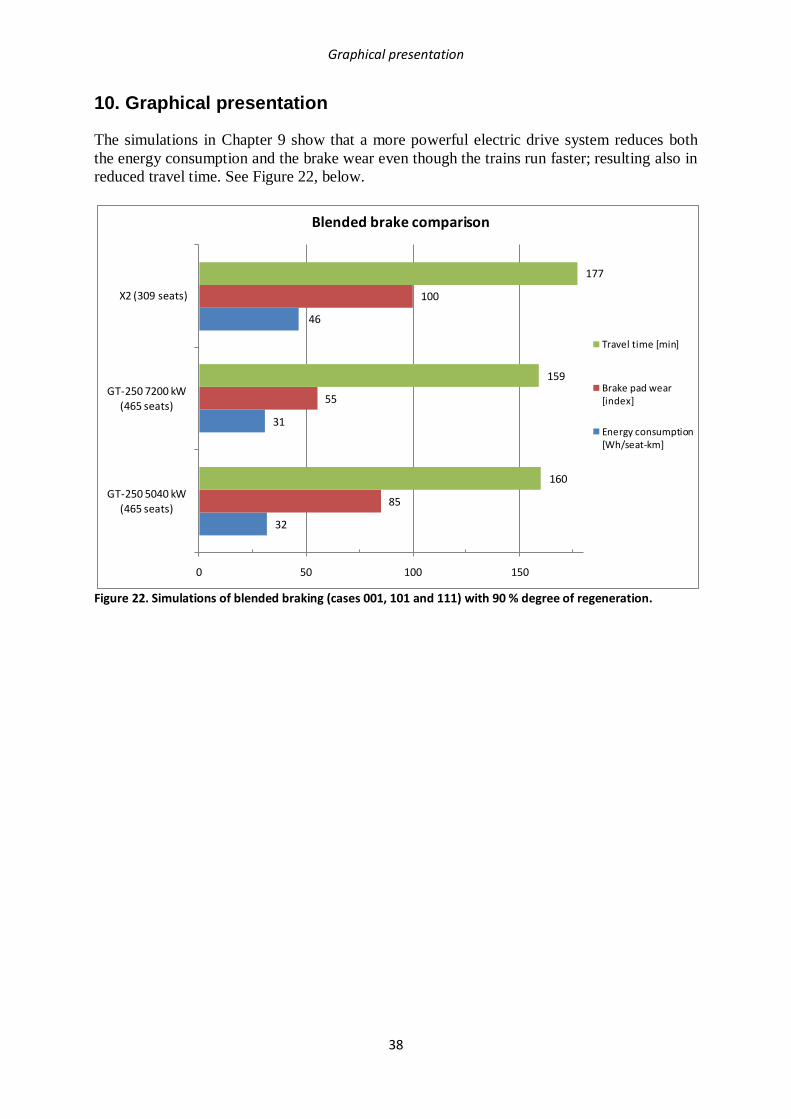
Graphical presentation
38
10. Graphical presentation
The simulations in Chapter 9 show that a more powerful electric drive system reduces both
the energy consumption and the brake wear even though the trains run faster; resulting also in
reduced travel time. See Figure 22, below.
Figure 22. Simulations of blended braking (cases 001, 101 and 111) with 90 % degree of regeneration.
32
31
46
85
55
100
160
159
177
0 50 100 150
GT-250 5040 kW (465 seats)
GT-250 7200 kW (465 seats)
X2 (309 seats)
Blended brake comparison
Travel time [min]
Brake pad wear [index]
Energy consumption [Wh/seat-km]
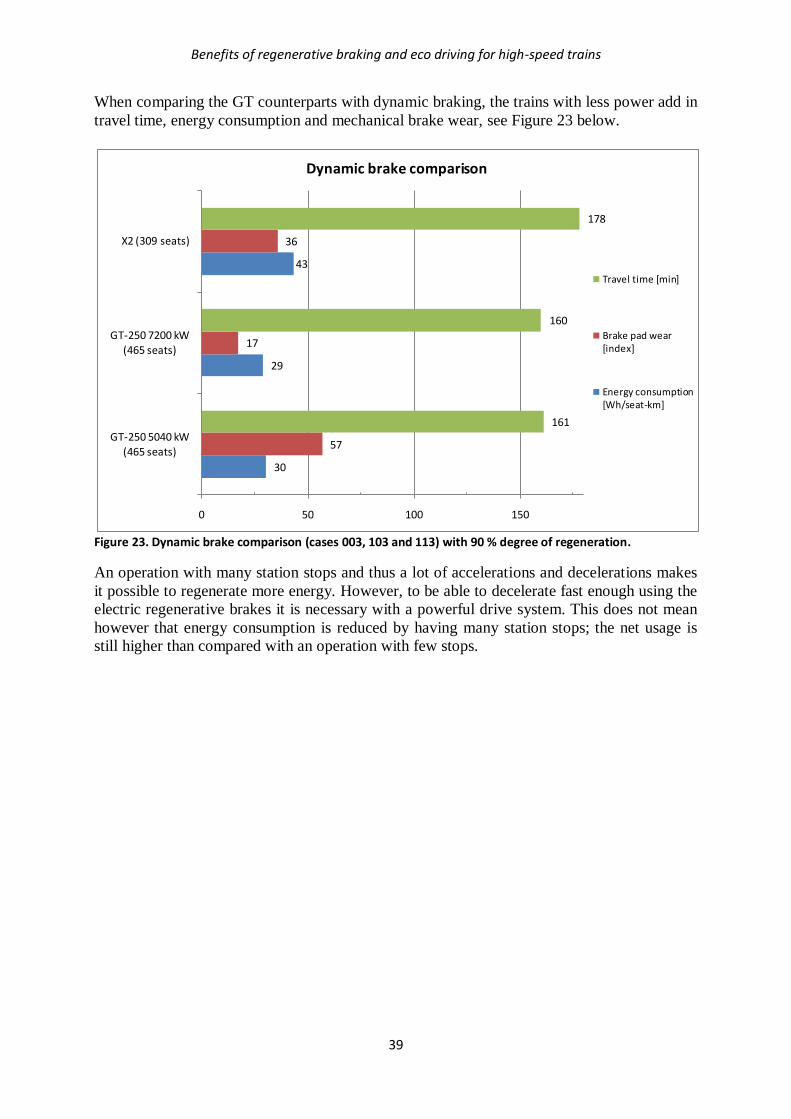
Benefits of regenerative braking and eco driving for high-speed trains
39
When comparing the GT counterparts with dynamic braking, the trains with less power add in
travel time, energy consumption and mechanical brake wear, see Figure 23 below.
Figure 23. Dynamic brake comparison (cases 003, 103 and 113) with 90 % degree of regeneration.
An operation with many station stops and thus a lot of accelerations and decelerations makes
it possible to regenerate more energy. However, to be able to decelerate fast enough using the
electric regenerative brakes it is necessary with a powerful drive system. This does not mean
however that energy consumption is reduced by having many station stops; the net usage is
still higher than compared with an operation with few stops.
30
29
43
57
17
36
161
160
178
0 50 100 150
GT-250 5040 kW (465 seats)
GT-250 7200 kW (465 seats)
X2 (309 seats)
Dynamic brake comparison
Travel time [min]
Brake pad wear [index]
Energy consumption [Wh/seat-km]
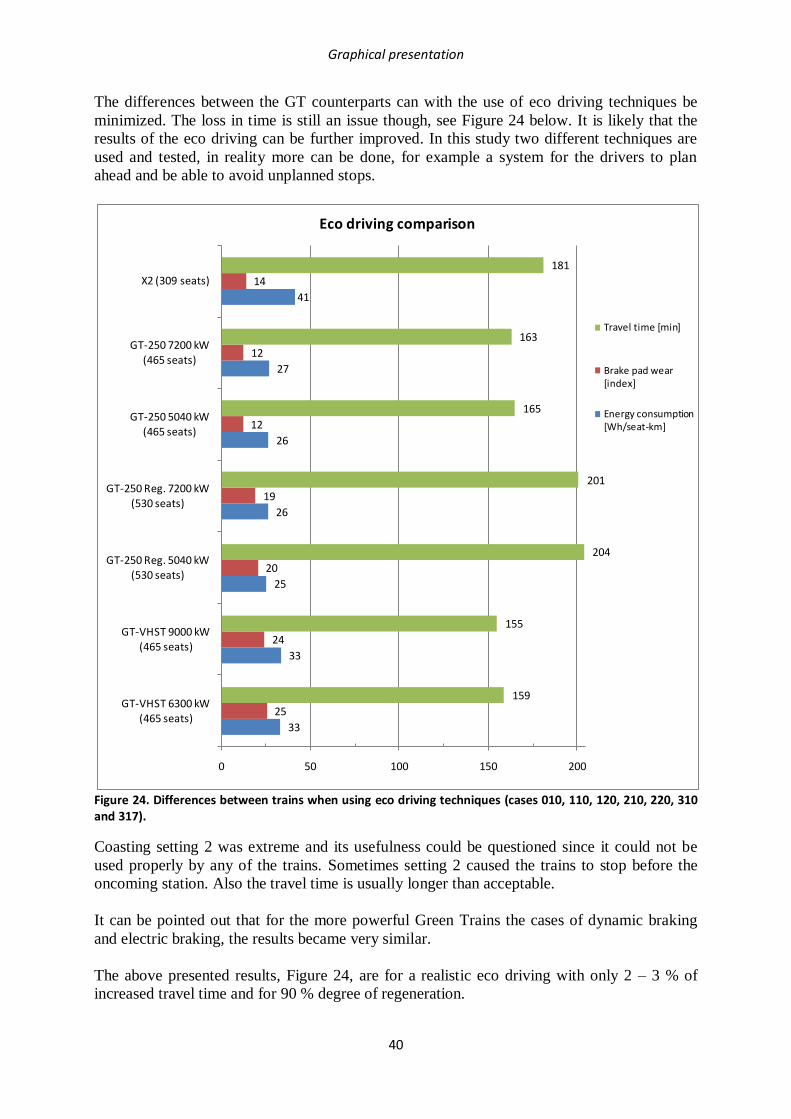
Graphical presentation
40
The differences between the GT counterparts can with the use of eco driving techniques be
minimized. The loss in time is still an issue though, see Figure 24 below. It is likely that the
results of the eco driving can be further improved. In this study two different techniques are
used and tested, in reality more can be done, for example a system for the drivers to plan
ahead and be able to avoid unplanned stops.
Figure 24. Differences between trains when using eco driving techniques (cases 010, 110, 120, 210, 220, 310 and 317).
Coasting setting 2 was extreme and its usefulness could be questioned since it could not be
used properly by any of the trains. Sometimes setting 2 caused the trains to stop before the
oncoming station. Also the travel time is usually longer than acceptable.
It can be pointed out that for the more powerful Green Trains the cases of dynamic braking
and electric braking, the results became very similar.
The above presented results, Figure 24, are for a realistic eco driving with only 2 – 3 % of
increased travel time and for 90 % degree of regeneration.
33
33
25
26
26
27
41
25
24
20
19
12
12
14
159
155
204
201
165
163
181
0 50 100 150 200
GT-VHST 6300 kW (465 seats)
GT-VHST 9000 kW (465 seats)
GT-250 Reg. 5040 kW (530 seats)
GT-250 Reg. 7200 kW (530 seats)
GT-250 5040 kW (465 seats)
GT-250 7200 kW (465 seats)
X2 (309 seats)
Eco driving comparison
Travel time [min]
Brake pad wear [index]
Energy consumption [Wh/seat-km]
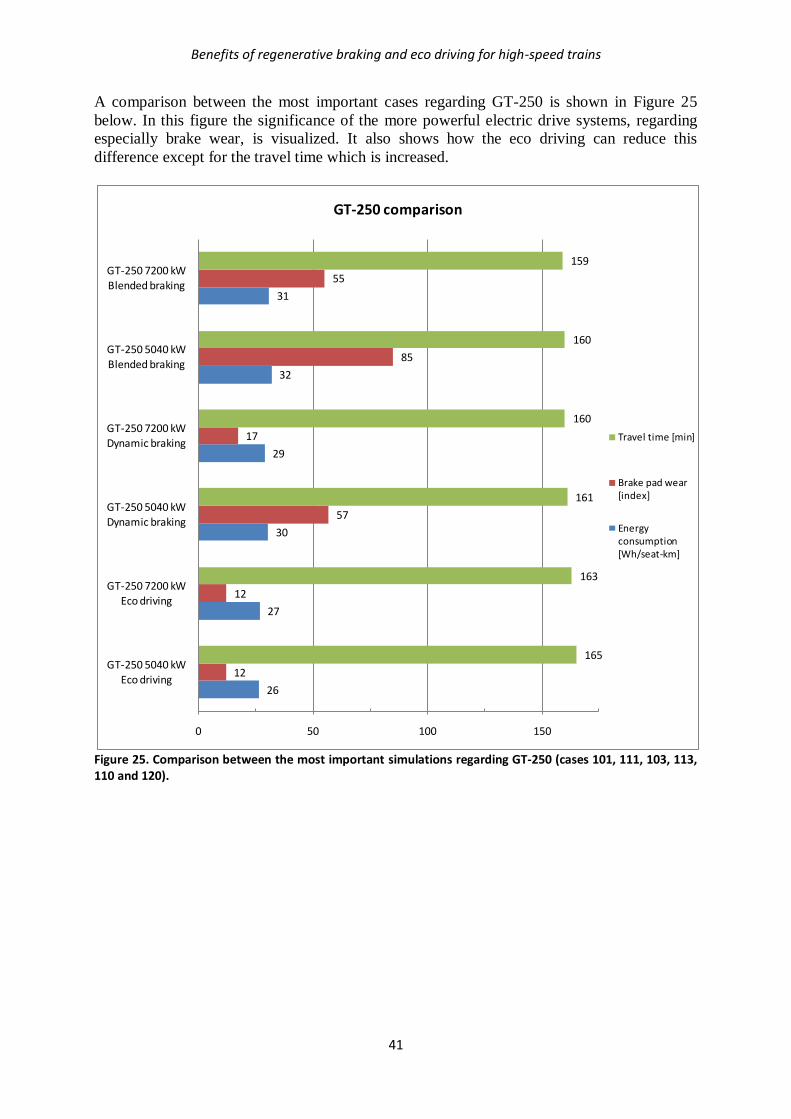
Benefits of regenerative braking and eco driving for high-speed trains
41
A comparison between the most important cases regarding GT-250 is shown in Figure 25
below. In this figure the significance of the more powerful electric drive systems, regarding
especially brake wear, is visualized. It also shows how the eco driving can reduce this
difference except for the travel time which is increased.
Figure 25. Comparison between the most important simulations regarding GT-250 (cases 101, 111, 103, 113, 110 and 120).
26
27
30
29
32
31
12
12
57
17
85
55
165
163
161
160
160
159
0 50 100 150
GT-250 5040 kW Eco driving
GT-250 7200 kW
Eco driving
GT-250 5040 kW Dynamic braking
GT-250 7200 kW Dynamic braking
GT-250 5040 kW
Blended braking
GT-250 7200 kW
Blended braking
GT-250 comparison
Travel time [min]
Brake pad wear [index]
Energy consumption [Wh/seat-km]
Conclusions and discussion
42
11. Conclusions and discussion
In this study, four different trains with different levels of tractive power have been
investigated regarding energy consumption, brake wear and travel time:
X2 (up to 4000 kW), as reference;
GT-250 (7200 and 5040 kW);
GT-250 Regional (7200 and 5040 kW);
GT-VHST (9000 and 6300 kW).
Each train has been simulated for three different braking modes, (1) blended, (2) dynamic and
(3) electric and also for two different driving styles; (A) normal and (B) eco driving.
GT-250 with the powerful drive system is superior regarding energy consumption, brake wear
and travel time compared to X2. Also the GT-250 with a 30 % power reduction shows better
results than X2, regarding travel time and energy consumption. This is not necessarily the
case with brake wear which in the dynamic brake mode actually is worse for the weaker GT-
250 than for X2. This shows the necessity of sufficient power.
Amongst the Green Trains, the trains with the more powerful drive systems are superior to the
trains with a 30 % power reduction, regarding energy consumption and brake wear in normal
driving.
The GT-250 Regional, with many station stops and accelerations along the line, loses,
depending on the braking mode, 2-5 minutes in travel time for “Västra stambanan” if the
power is reduced by 30 %. If using eco driving it loses even more, compared to the more
powerful version, particularly in blended and dynamic braking modes.
If the new high speed line “Götalandsbanan” were to be introduced in Sweden with a similar
train as the GT-VHST, we could expect similar brake wear as today for the X2 on “Västra
stambanan” but reduced energy consumption, in particular for eco driving. This is even
though GT-VHST has a 120 km/h higher top speed and cuts the travel time by 30 minutes.
Consider also that the GT-VHST has a somewhat longer travel distance and three more
station stops.
Eco driving can further reduce energy consumption and brake wear. If using 2-3 % of the total
travel time (about one third of the total time margin) as an average, the actual travel time in
passenger operations will likely not be affected. If using only electric braking, powerful drive
systems constitute an extra strong advantage, enhancing faster acceleration and braking as
well as more energy regeneration.
If energy consumption and brake wear are to be kept at a minimum it is also crucial that the
regenerative system works properly in all conditions. As the train driver survey showed, this
is not always the case today. Some particularly important properties were pointed out:
high electric braking power;
modest adhesion utilization;
a slip control system tuned also for electric braking under slippery conditions and
possibility to use electric brake only, independent of the mechanical brake.
Benefits of regenerative braking and eco driving for high-speed trains
43
The results in this report should be adequate regarding the energy consumption, since the
results of the software STEC have been validated through comparison with earlier work. The
brake wear calculations were carried out with no possibility of validation though. According
to the present study the brake pad wear is nearly proportional to the mechanical brake energy
in normal operational cases with modest deceleration and use of electric braking. This should
be sufficient as a relative measure.
Further studies should be made in order to validate the brake wear, in particular through full
scale tests. It would also be of value to know what economical effects reduced energy
consumption and brake pad wear would have for the operators. Moreover, it would be of
value to look into additional types of operations and driving styles as well as further analyze
what effects different eco driving techniques have. Most likely there are driving techniques
that work better than others with respect to reduced energy consumption and wear as function
of added travel time.
References
44
References
[1] E. Andersson and M. Berg: Railway systems and rail vehicles (in Swedish:
Spårtrafiksystem och spårfordon), KTH Rail Vehicles, Stockholm. ISBN 978-
91-7178-743-9, 2007.
[2] Y. Desplanques, O. Roussette, G. Degallaix, R. Copin and Y. Berthier: Analysis
of tribological behaviour of pad-disc contact in railway braking - Part 1, Wear,
262, pp. 582-591, 2007.
[3] A. Lönnermo, Bombardier Transportation : Personal communication. Autumn
2010.
[4] P. Flores: Modeling and simulation of wear in revolute clearance joints in
multibody systems, Mechanism and Machine Theory, 44, pp. 1211–1222, 2009.
[5] S. K. Rhee: Wear equation for polymers sliding against metal surfaces, Wear,
16, pp. 431-445, 1970.
[6] T. L. Ho and M. B. Peterson: Wear formulation for aircraft brake material
sliding against steel, Wear, 43, pp. 199-210, 1977.
[7] J. F. Archard: Contact and rubbing of flat surfaces, Journal of Applied Physics,
24, pp. 981-988, 1953.
[8] T. Vernersson and R. Lundén: Wear of disc brakes and block brakes – Influence
of design on modelled wear for repeated brake cycles.
[9] D. Thuresson: Influence of material properties on sliding contact braking
applications, Wear, 257, pp. 451-460, 2004.
[10] N. Fillot, I. Iordanoff and Y. Berthier: Wear modeling and the third body
concept, Wear, 262, pp. 949-957, 2007.
[11] A. Seidenschwang: Brake disc – Temperature calculation, Knorr-Bremse, report
701-70/08-2, 2010.
[12] UIC code 541-3: Brakes – Disc brakes and their application – General
conditions for the approval of brake pads, 6th edition, 2006.
[13] S. Abbasi, KTH: Personal communication. Autumn 2010.
[14] J. Förstberg: Ride comfort and motion sickness in tilting trains, Doctoral thesis,
KTH Railway Technology, Stockholm, 2000.
[15] STEC: MS Excel based software for Simulation of Train Energy Consumption
(version 2.7), Div. of Rail Vehicles, KTH, Stockholm, 2010.
[16] P. Furukrona, SJ AB: Personal communication. February 2011.
[17] S. Berndtsson, SJ AB: Personal communication. February 2011.
[18] P. Lukaszewicz and E. Andersson: Green Train energy consumption, KTH Rail
Vehicles, Stockholm. ISBN 978-91-7415-257-9, 2009.
[19] E. Andersson, KTH: Personal communication. Autumn 2010, spring 2011.
[20] PM Infrastrukturmodell av Götalandsbanan i RailSys. Banverket/Railize, Mats
Gunnervall 2006-01-03.
[21] Bandata Götalandsbanan 070515. KTH Internal document, Oskar Fröidh.
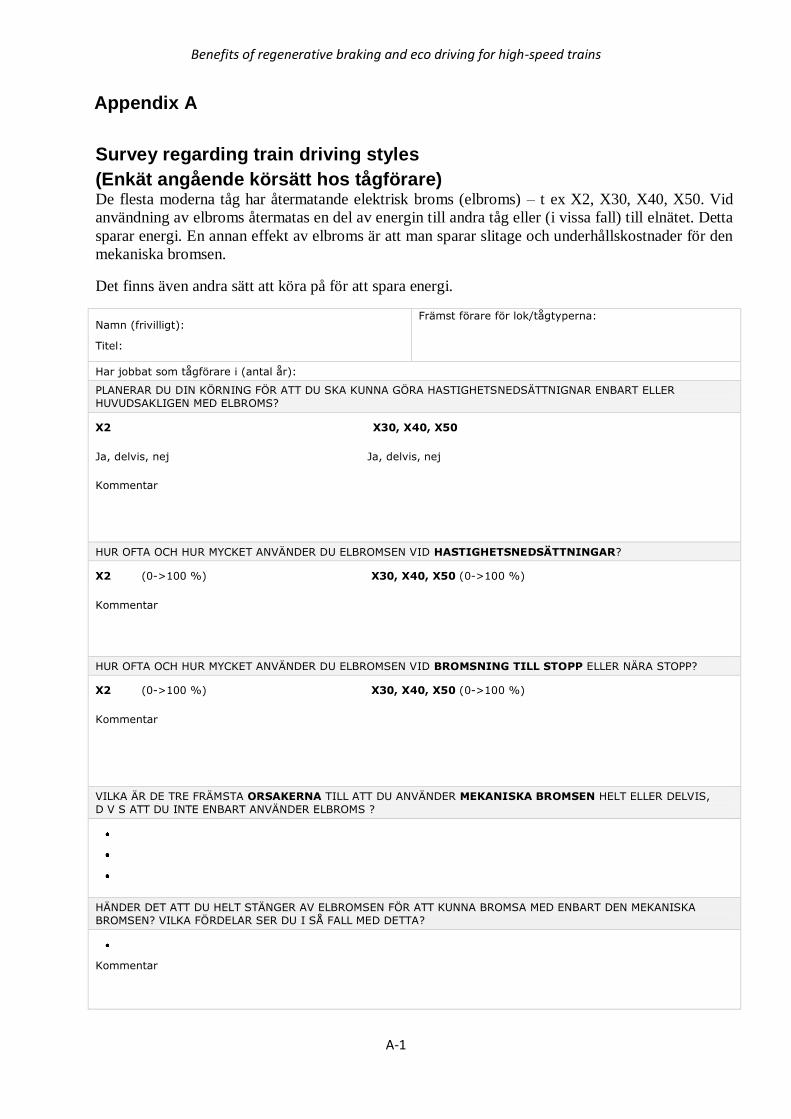
Benefits of regenerative braking and eco driving for high-speed trains
A-1
Appendix A
Survey regarding train driving styles
(Enkät angående körsätt hos tågförare) De flesta moderna tåg har återmatande elektrisk broms (elbroms) – t ex X2, X30, X40, X50. Vid
användning av elbroms återmatas en del av energin till andra tåg eller (i vissa fall) till elnätet. Detta
sparar energi. En annan effekt av elbroms är att man sparar slitage och underhållskostnader för den
mekaniska bromsen.
Det finns även andra sätt att köra på för att spara energi.
Namn (frivilligt):
Titel:
Främst förare för lok/tågtyperna:
Har jobbat som tågförare i (antal år):
PLANERAR DU DIN KÖRNING FÖR ATT DU SKA KUNNA GÖRA HASTIGHETSNEDSÄTTNIGNAR ENBART ELLER
HUVUDSAKLIGEN MED ELBROMS?
X2 X30, X40, X50
Ja, delvis, nej Ja, delvis, nej
Kommentar
HUR OFTA OCH HUR MYCKET ANVÄNDER DU ELBROMSEN VID HASTIGHETSNEDSÄTTNINGAR?
X2 (0->100 %) X30, X40, X50 (0->100 %)
Kommentar
HUR OFTA OCH HUR MYCKET ANVÄNDER DU ELBROMSEN VID BROMSNING TILL STOPP ELLER NÄRA STOPP?
X2 (0->100 %) X30, X40, X50 (0->100 %)
Kommentar
VILKA ÄR DE TRE FRÄMSTA ORSAKERNA TILL ATT DU ANVÄNDER MEKANISKA BROMSEN HELT ELLER DELVIS,
D V S ATT DU INTE ENBART ANVÄNDER ELBROMS ?
HÄNDER DET ATT DU HELT STÄNGER AV ELBROMSEN FÖR ATT KUNNA BROMSA MED ENBART DEN MEKANISKA
BROMSEN? VILKA FÖRDELAR SER DU I SÅ FALL MED DETTA?
Kommentar
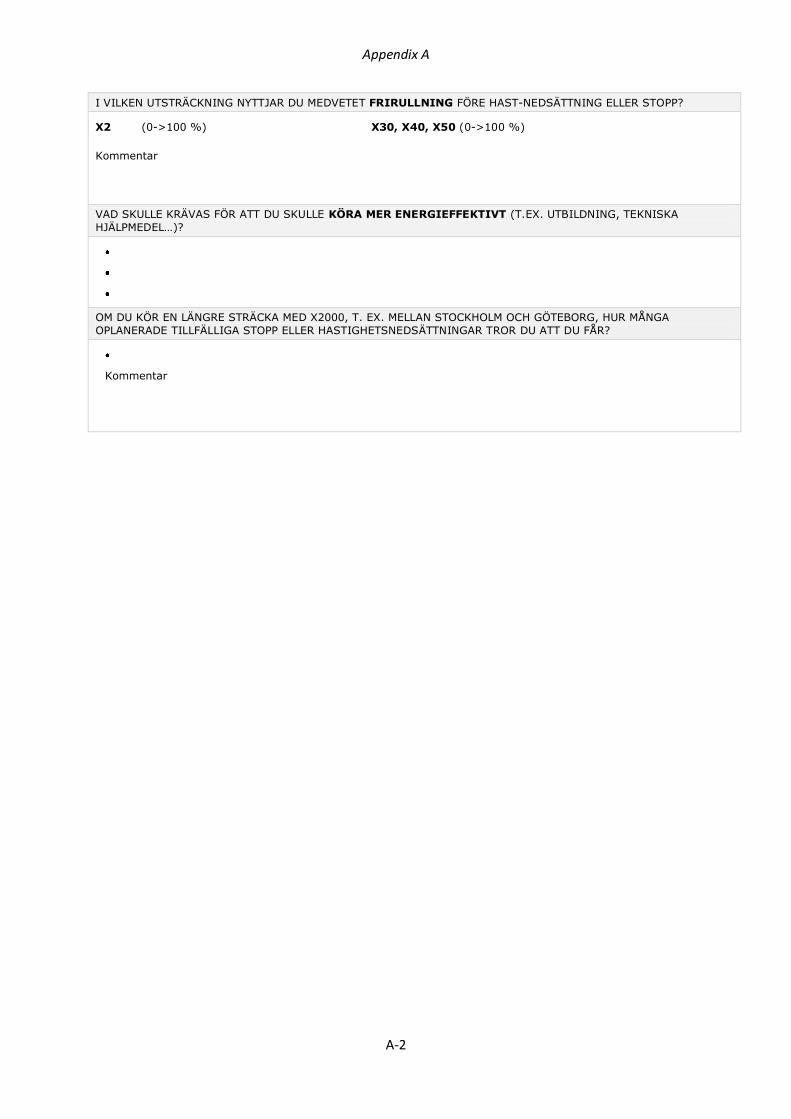
Appendix A
A-2
I VILKEN UTSTRÄCKNING NYTTJAR DU MEDVETET FRIRULLNING FÖRE HAST-NEDSÄTTNING ELLER STOPP?
X2 (0->100 %) X30, X40, X50 (0->100 %)
Kommentar
VAD SKULLE KRÄVAS FÖR ATT DU SKULLE KÖRA MER ENERGIEFFEKTIVT (T.EX. UTBILDNING, TEKNISKA
HJÄLPMEDEL…)?
OM DU KÖR EN LÄNGRE STRÄCKA MED X2000, T. EX. MELLAN STOCKHOLM OCH GÖTEBORG, HUR MÅNGA
OPLANERADE TILLFÄLLIGA STOPP ELLER HASTIGHETSNEDSÄTTNINGAR TROR DU ATT DU FÅR?
Kommentar
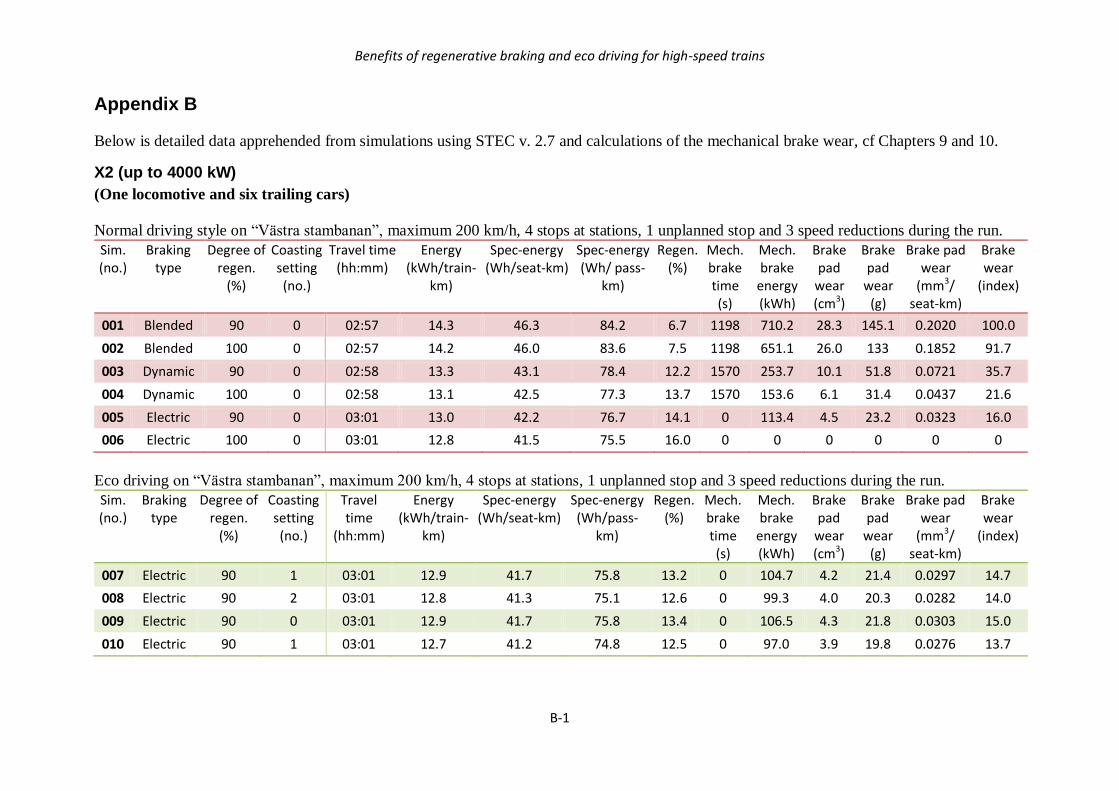
Benefits of regenerative braking and eco driving for high-speed trains
B-1
Appendix B
Below is detailed data apprehended from simulations using STEC v. 2.7 and calculations of the mechanical brake wear, cf Chapters 9 and 10.
X2 (up to 4000 kW)
(One locomotive and six trailing cars)
Normal driving style on “Västra stambanan”, maximum 200 km/h, 4 stops at stations, 1 unplanned stop and 3 speed reductions during the run.
Sim. (no.)
Braking type
Degree of regen.
(%)
Coasting setting (no.)
Travel time (hh:mm)
Energy (kWh/train-
km)
Spec-energy (Wh/seat-km)
Spec-energy (Wh/ pass-
km)
Regen. (%)
Mech. brake time (s)
Mech. brake
energy (kWh)
Brake pad
wear (cm3)
Brake pad
wear (g)
Brake pad wear
(mm3/ seat-km)
Brake wear
(index)
001 Blended 90 0 02:57 14.3 46.3 84.2 6.7 1198 710.2 28.3 145.1 0.2020 100.0
002 Blended 100 0 02:57 14.2 46.0 83.6 7.5 1198 651.1 26.0 133 0.1852 91.7
003 Dynamic 90 0 02:58 13.3 43.1 78.4 12.2 1570 253.7 10.1 51.8 0.0721 35.7
004 Dynamic 100 0 02:58 13.1 42.5 77.3 13.7 1570 153.6 6.1 31.4 0.0437 21.6
005 Electric 90 0 03:01 13.0 42.2 76.7 14.1 0 113.4 4.5 23.2 0.0323 16.0
006 Electric 100 0 03:01 12.8 41.5 75.5 16.0 0 0 0 0 0 0
Eco driving on “Västra stambanan”, maximum 200 km/h, 4 stops at stations, 1 unplanned stop and 3 speed reductions during the run.
Sim. (no.)
Braking type
Degree of regen.
(%)
Coasting setting (no.)
Travel time
(hh:mm)
Energy (kWh/train-
km)
Spec-energy (Wh/seat-km)
Spec-energy (Wh/pass-
km)
Regen. (%)
Mech. brake time (s)
Mech. brake
energy (kWh)
Brake pad
wear (cm3)
Brake pad
wear (g)
Brake pad wear
(mm3/ seat-km)
Brake wear
(index)
007 Electric 90 1 03:01 12.9 41.7 75.8 13.2 0 104.7 4.2 21.4 0.0297 14.7
008 Electric 90 2 03:01 12.8 41.3 75.1 12.6 0 99.3 4.0 20.3 0.0282 14.0
009 Electric 90 0 03:01 12.9 41.7 75.8 13.4 0 106.5 4.3 21.8 0.0303 15.0
010 Electric 90 1 03:01 12.7 41.2 74.8 12.5 0 97.0 3.9 19.8 0.0276 13.7
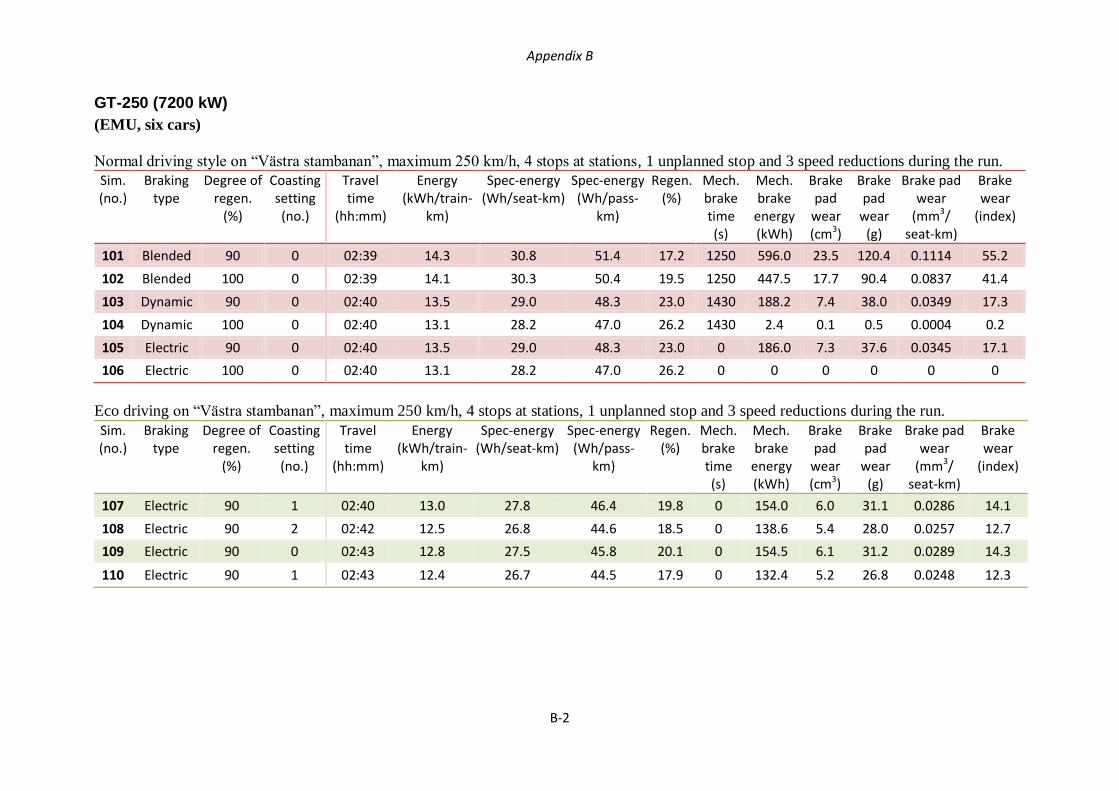
Appendix B
B-2
GT-250 (7200 kW)
(EMU, six cars)
Normal driving style on “Västra stambanan”, maximum 250 km/h, 4 stops at stations, 1 unplanned stop and 3 speed reductions during the run.
Sim. (no.)
Braking type
Degree of regen.
(%)
Coasting setting (no.)
Travel time
(hh:mm)
Energy (kWh/train-
km)
Spec-energy (Wh/seat-km)
Spec-energy (Wh/pass-
km)
Regen. (%)
Mech. brake time (s)
Mech. brake
energy (kWh)
Brake pad
wear (cm3)
Brake pad
wear (g)
Brake pad wear
(mm3/ seat-km)
Brake wear
(index)
101 Blended 90 0 02:39 14.3 30.8 51.4 17.2 1250 596.0 23.5 120.4 0.1114 55.2
102 Blended 100 0 02:39 14.1 30.3 50.4 19.5 1250 447.5 17.7 90.4 0.0837 41.4
103 Dynamic 90 0 02:40 13.5 29.0 48.3 23.0 1430 188.2 7.4 38.0 0.0349 17.3
104 Dynamic 100 0 02:40 13.1 28.2 47.0 26.2 1430 2.4 0.1 0.5 0.0004 0.2
105 Electric 90 0 02:40 13.5 29.0 48.3 23.0 0 186.0 7.3 37.6 0.0345 17.1
106 Electric 100 0 02:40 13.1 28.2 47.0 26.2 0 0 0 0 0 0
Eco driving on “Västra stambanan”, maximum 250 km/h, 4 stops at stations, 1 unplanned stop and 3 speed reductions during the run.
Sim. (no.)
Braking type
Degree of regen.
(%)
Coasting setting (no.)
Travel time
(hh:mm)
Energy (kWh/train-
km)
Spec-energy (Wh/seat-km)
Spec-energy (Wh/pass-
km)
Regen. (%)
Mech. brake time (s)
Mech. brake
energy (kWh)
Brake pad
wear (cm3)
Brake pad
wear (g)
Brake pad wear
(mm3/ seat-km)
Brake wear
(index)
107 Electric 90 1 02:40 13.0 27.8 46.4 19.8 0 154.0 6.0 31.1 0.0286 14.1
108 Electric 90 2 02:42 12.5 26.8 44.6 18.5 0 138.6 5.4 28.0 0.0257 12.7
109 Electric 90 0 02:43 12.8 27.5 45.8 20.1 0 154.5 6.1 31.2 0.0289 14.3
110 Electric 90 1 02:43 12.4 26.7 44.5 17.9 0 132.4 5.2 26.8 0.0248 12.3
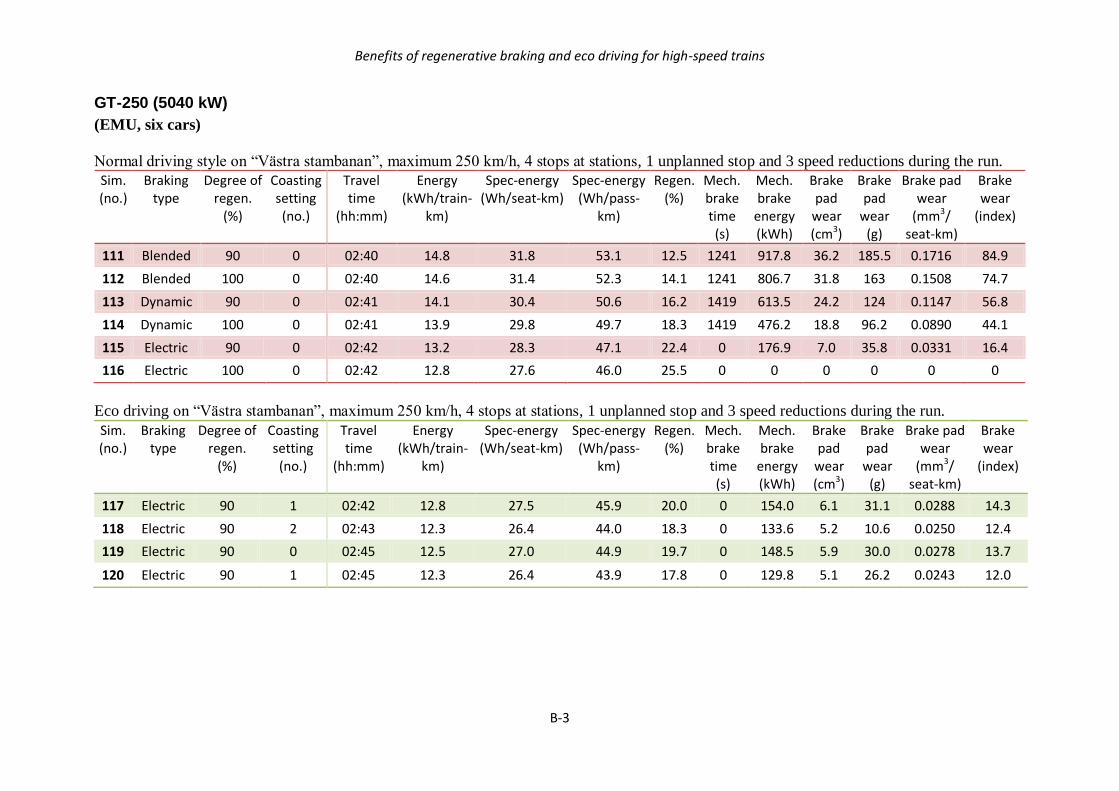
Benefits of regenerative braking and eco driving for high-speed trains
B-3
GT-250 (5040 kW)
(EMU, six cars)
Normal driving style on “Västra stambanan”, maximum 250 km/h, 4 stops at stations, 1 unplanned stop and 3 speed reductions during the run.
Sim. (no.)
Braking type
Degree of regen.
(%)
Coasting setting (no.)
Travel time
(hh:mm)
Energy (kWh/train-
km)
Spec-energy (Wh/seat-km)
Spec-energy (Wh/pass-
km)
Regen. (%)
Mech. brake time (s)
Mech. brake
energy (kWh)
Brake pad
wear (cm3)
Brake pad
wear (g)
Brake pad wear
(mm3/ seat-km)
Brake wear
(index)
111 Blended 90 0 02:40 14.8 31.8 53.1 12.5 1241 917.8 36.2 185.5 0.1716 84.9
112 Blended 100 0 02:40 14.6 31.4 52.3 14.1 1241 806.7 31.8 163 0.1508 74.7
113 Dynamic 90 0 02:41 14.1 30.4 50.6 16.2 1419 613.5 24.2 124 0.1147 56.8
114 Dynamic 100 0 02:41 13.9 29.8 49.7 18.3 1419 476.2 18.8 96.2 0.0890 44.1
115 Electric 90 0 02:42 13.2 28.3 47.1 22.4 0 176.9 7.0 35.8 0.0331 16.4
116 Electric 100 0 02:42 12.8 27.6 46.0 25.5 0 0 0 0 0 0
Eco driving on “Västra stambanan”, maximum 250 km/h, 4 stops at stations, 1 unplanned stop and 3 speed reductions during the run.
Sim. (no.)
Braking type
Degree of regen.
(%)
Coasting setting (no.)
Travel time
(hh:mm)
Energy (kWh/train-
km)
Spec-energy (Wh/seat-km)
Spec-energy (Wh/pass-
km)
Regen. (%)
Mech. brake time (s)
Mech. brake
energy (kWh)
Brake pad
wear (cm3)
Brake pad
wear (g)
Brake pad wear
(mm3/ seat-km)
Brake wear
(index)
117 Electric 90 1 02:42 12.8 27.5 45.9 20.0 0 154.0 6.1 31.1 0.0288 14.3
118 Electric 90 2 02:43 12.3 26.4 44.0 18.3 0 133.6 5.2 10.6 0.0250 12.4
119 Electric 90 0 02:45 12.5 27.0 44.9 19.7 0 148.5 5.9 30.0 0.0278 13.7
120 Electric 90 1 02:45 12.3 26.4 43.9 17.8 0 129.8 5.1 26.2 0.0243 12.0
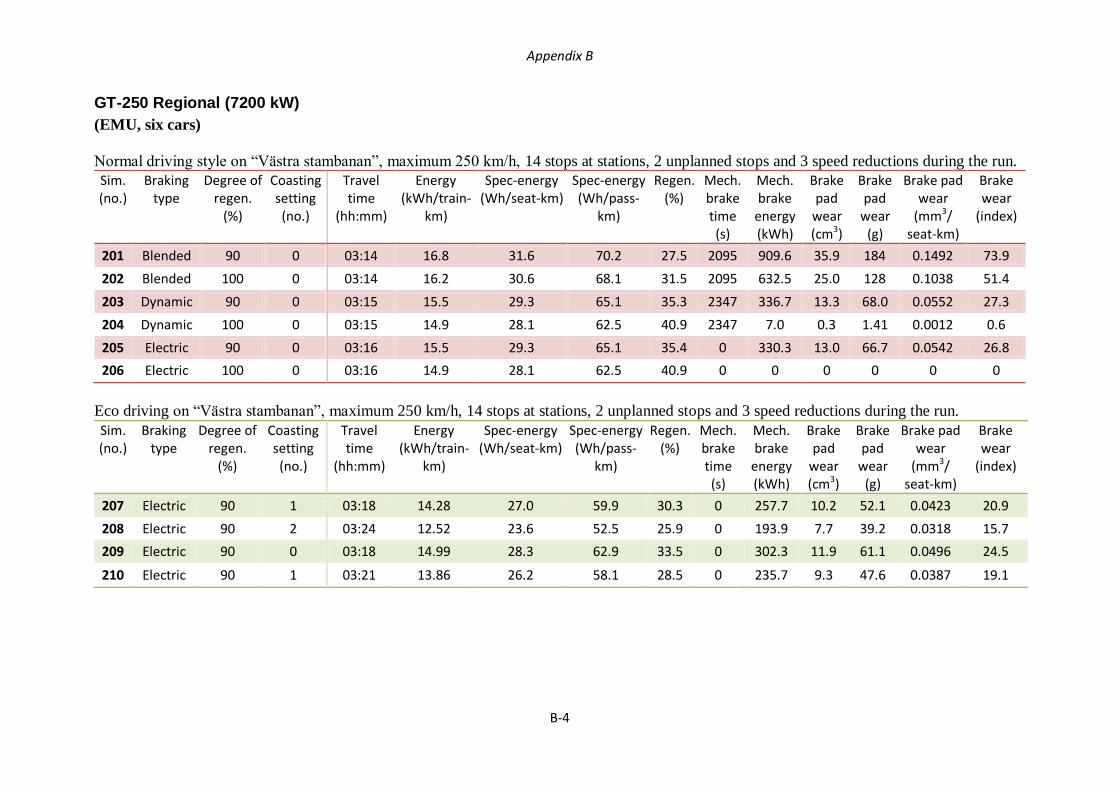
Appendix B
B-4
GT-250 Regional (7200 kW)
(EMU, six cars)
Normal driving style on “Västra stambanan”, maximum 250 km/h, 14 stops at stations, 2 unplanned stops and 3 speed reductions during the run.
Sim. (no.)
Braking type
Degree of regen.
(%)
Coasting setting (no.)
Travel time
(hh:mm)
Energy (kWh/train-
km)
Spec-energy (Wh/seat-km)
Spec-energy (Wh/pass-
km)
Regen. (%)
Mech. brake time (s)
Mech. brake
energy (kWh)
Brake pad
wear (cm3)
Brake pad
wear (g)
Brake pad wear
(mm3/ seat-km)
Brake wear
(index)
201 Blended 90 0 03:14 16.8 31.6 70.2 27.5 2095 909.6 35.9 184 0.1492 73.9
202 Blended 100 0 03:14 16.2 30.6 68.1 31.5 2095 632.5 25.0 128 0.1038 51.4
203 Dynamic 90 0 03:15 15.5 29.3 65.1 35.3 2347 336.7 13.3 68.0 0.0552 27.3
204 Dynamic 100 0 03:15 14.9 28.1 62.5 40.9 2347 7.0 0.3 1.41 0.0012 0.6
205 Electric 90 0 03:16 15.5 29.3 65.1 35.4 0 330.3 13.0 66.7 0.0542 26.8
206 Electric 100 0 03:16 14.9 28.1 62.5 40.9 0 0 0 0 0 0
Eco driving on “Västra stambanan”, maximum 250 km/h, 14 stops at stations, 2 unplanned stops and 3 speed reductions during the run.
Sim. (no.)
Braking type
Degree of regen.
(%)
Coasting setting (no.)
Travel time
(hh:mm)
Energy (kWh/train-
km)
Spec-energy (Wh/seat-km)
Spec-energy (Wh/pass-
km)
Regen. (%)
Mech. brake time (s)
Mech. brake
energy (kWh)
Brake pad
wear (cm3)
Brake pad
wear (g)
Brake pad wear
(mm3/ seat-km)
Brake wear
(index)
207 Electric 90 1 03:18 14.28 27.0 59.9 30.3 0 257.7 10.2 52.1 0.0423 20.9
208 Electric 90 2 03:24 12.52 23.6 52.5 25.9 0 193.9 7.7 39.2 0.0318 15.7
209 Electric 90 0 03:18 14.99 28.3 62.9 33.5 0 302.3 11.9 61.1 0.0496 24.5
210 Electric 90 1 03:21 13.86 26.2 58.1 28.5 0 235.7 9.3 47.6 0.0387 19.1
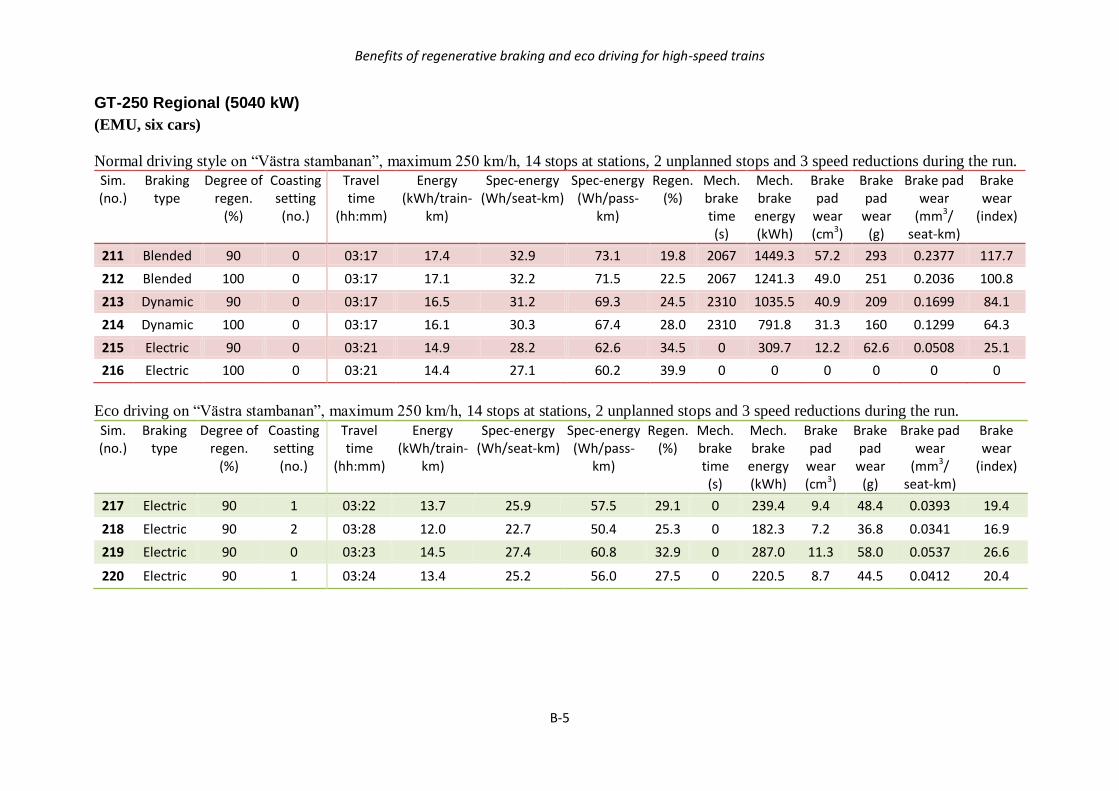
Benefits of regenerative braking and eco driving for high-speed trains
B-5
GT-250 Regional (5040 kW)
(EMU, six cars)
Normal driving style on “Västra stambanan”, maximum 250 km/h, 14 stops at stations, 2 unplanned stops and 3 speed reductions during the run.
Sim. (no.)
Braking type
Degree of regen.
(%)
Coasting setting (no.)
Travel time
(hh:mm)
Energy (kWh/train-
km)
Spec-energy (Wh/seat-km)
Spec-energy (Wh/pass-
km)
Regen. (%)
Mech. brake time (s)
Mech. brake
energy (kWh)
Brake pad
wear (cm3)
Brake pad
wear (g)
Brake pad wear
(mm3/ seat-km)
Brake wear
(index)
211 Blended 90 0 03:17 17.4 32.9 73.1 19.8 2067 1449.3 57.2 293 0.2377 117.7
212 Blended 100 0 03:17 17.1 32.2 71.5 22.5 2067 1241.3 49.0 251 0.2036 100.8
213 Dynamic 90 0 03:17 16.5 31.2 69.3 24.5 2310 1035.5 40.9 209 0.1699 84.1
214 Dynamic 100 0 03:17 16.1 30.3 67.4 28.0 2310 791.8 31.3 160 0.1299 64.3
215 Electric 90 0 03:21 14.9 28.2 62.6 34.5 0 309.7 12.2 62.6 0.0508 25.1
216 Electric 100 0 03:21 14.4 27.1 60.2 39.9 0 0 0 0 0 0
Eco driving on “Västra stambanan”, maximum 250 km/h, 14 stops at stations, 2 unplanned stops and 3 speed reductions during the run.
Sim. (no.)
Braking type
Degree of regen.
(%)
Coasting setting (no.)
Travel time
(hh:mm)
Energy (kWh/train-
km)
Spec-energy (Wh/seat-km)
Spec-energy (Wh/pass-
km)
Regen. (%)
Mech. brake time (s)
Mech. brake
energy (kWh)
Brake pad
wear (cm3)
Brake pad
wear (g)
Brake pad wear
(mm3/ seat-km)
Brake wear
(index)
217 Electric 90 1 03:22 13.7 25.9 57.5 29.1 0 239.4 9.4 48.4 0.0393 19.4
218 Electric 90 2 03:28 12.0 22.7 50.4 25.3 0 182.3 7.2 36.8 0.0341 16.9
219 Electric 90 0 03:23 14.5 27.4 60.8 32.9 0 287.0 11.3 58.0 0.0537 26.6
220 Electric 90 1 03:24 13.4 25.2 56.0 27.5 0 220.5 8.7 44.5 0.0412 20.4
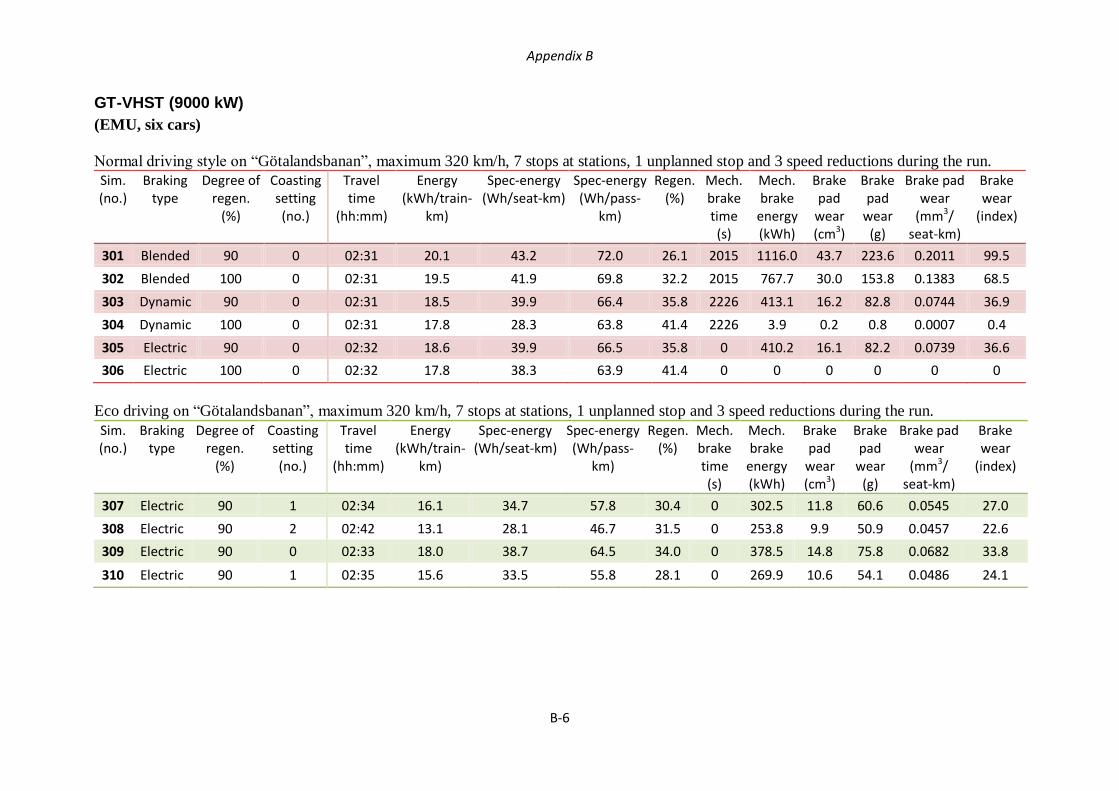
Appendix B
B-6
GT-VHST (9000 kW)
(EMU, six cars)
Normal driving style on “Götalandsbanan”, maximum 320 km/h, 7 stops at stations, 1 unplanned stop and 3 speed reductions during the run.
Sim. (no.)
Braking type
Degree of regen.
(%)
Coasting setting (no.)
Travel time
(hh:mm)
Energy (kWh/train-
km)
Spec-energy (Wh/seat-km)
Spec-energy (Wh/pass-
km)
Regen. (%)
Mech. brake time (s)
Mech. brake
energy (kWh)
Brake pad
wear (cm3)
Brake pad
wear (g)
Brake pad wear
(mm3/ seat-km)
Brake wear
(index)
301 Blended 90 0 02:31 20.1 43.2 72.0 26.1 2015 1116.0 43.7 223.6 0.2011 99.5
302 Blended 100 0 02:31 19.5 41.9 69.8 32.2 2015 767.7 30.0 153.8 0.1383 68.5
303 Dynamic 90 0 02:31 18.5 39.9 66.4 35.8 2226 413.1 16.2 82.8 0.0744 36.9
304 Dynamic 100 0 02:31 17.8 28.3 63.8 41.4 2226 3.9 0.2 0.8 0.0007 0.4
305 Electric 90 0 02:32 18.6 39.9 66.5 35.8 0 410.2 16.1 82.2 0.0739 36.6
306 Electric 100 0 02:32 17.8 38.3 63.9 41.4 0 0 0 0 0 0
Eco driving on “Götalandsbanan”, maximum 320 km/h, 7 stops at stations, 1 unplanned stop and 3 speed reductions during the run.
Sim. (no.)
Braking type
Degree of regen.
(%)
Coasting setting (no.)
Travel time
(hh:mm)
Energy (kWh/train-
km)
Spec-energy (Wh/seat-km)
Spec-energy (Wh/pass-
km)
Regen. (%)
Mech. brake time (s)
Mech. brake
energy (kWh)
Brake pad
wear (cm3)
Brake pad
wear (g)
Brake pad wear
(mm3/ seat-km)
Brake wear
(index)
307 Electric 90 1 02:34 16.1 34.7 57.8 30.4 0 302.5 11.8 60.6 0.0545 27.0
308 Electric 90 2 02:42 13.1 28.1 46.7 31.5 0 253.8 9.9 50.9 0.0457 22.6
309 Electric 90 0 02:33 18.0 38.7 64.5 34.0 0 378.5 14.8 75.8 0.0682 33.8
310 Electric 90 1 02:35 15.6 33.5 55.8 28.1 0 269.9 10.6 54.1 0.0486 24.1
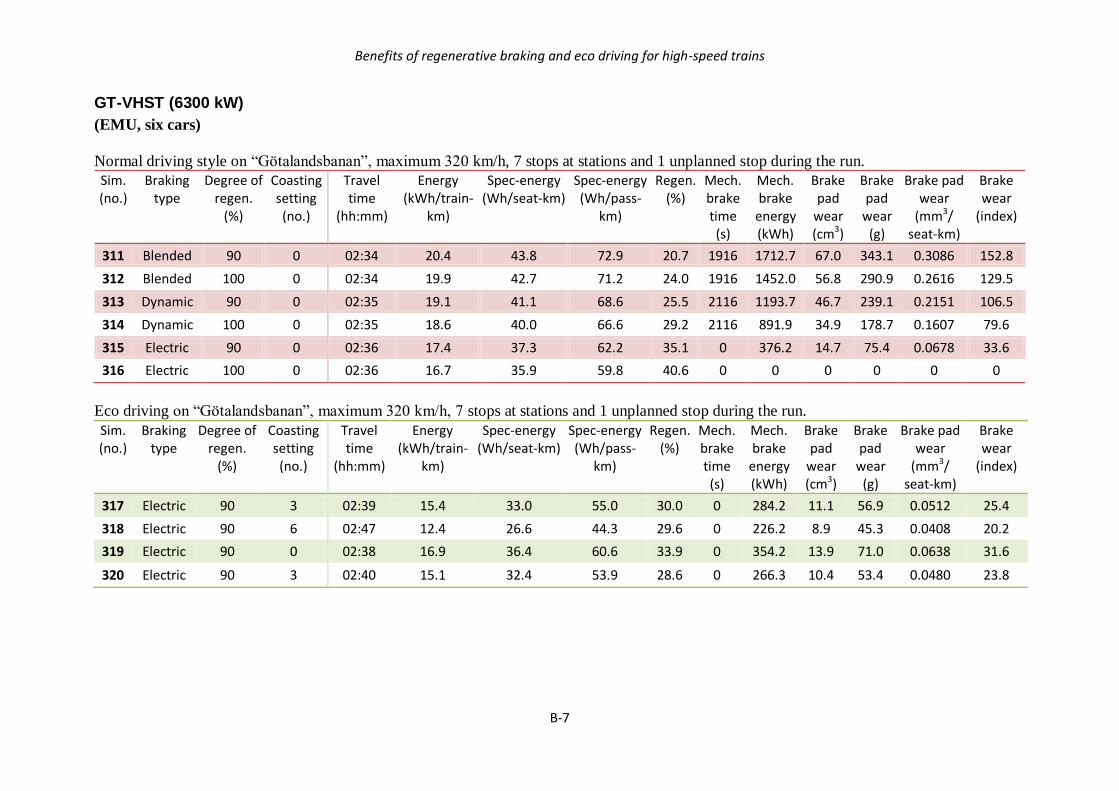
Benefits of regenerative braking and eco driving for high-speed trains
B-7
GT-VHST (6300 kW)
(EMU, six cars)
Normal driving style on “Götalandsbanan”, maximum 320 km/h, 7 stops at stations and 1 unplanned stop during the run.
Sim. (no.)
Braking type
Degree of regen.
(%)
Coasting setting (no.)
Travel time
(hh:mm)
Energy (kWh/train-
km)
Spec-energy (Wh/seat-km)
Spec-energy (Wh/pass-
km)
Regen. (%)
Mech. brake time (s)
Mech. brake
energy (kWh)
Brake pad
wear (cm3)
Brake pad
wear (g)
Brake pad wear
(mm3/ seat-km)
Brake wear
(index)
311 Blended 90 0 02:34 20.4 43.8 72.9 20.7 1916 1712.7 67.0 343.1 0.3086 152.8
312 Blended 100 0 02:34 19.9 42.7 71.2 24.0 1916 1452.0 56.8 290.9 0.2616 129.5
313 Dynamic 90 0 02:35 19.1 41.1 68.6 25.5 2116 1193.7 46.7 239.1 0.2151 106.5
314 Dynamic 100 0 02:35 18.6 40.0 66.6 29.2 2116 891.9 34.9 178.7 0.1607 79.6
315 Electric 90 0 02:36 17.4 37.3 62.2 35.1 0 376.2 14.7 75.4 0.0678 33.6
316 Electric 100 0 02:36 16.7 35.9 59.8 40.6 0 0 0 0 0 0
Eco driving on “Götalandsbanan”, maximum 320 km/h, 7 stops at stations and 1 unplanned stop during the run.
Sim. (no.)
Braking type
Degree of regen.
(%)
Coasting setting (no.)
Travel time
(hh:mm)
Energy (kWh/train-
km)
Spec-energy (Wh/seat-km)
Spec-energy (Wh/pass-
km)
Regen. (%)
Mech. brake time (s)
Mech. brake
energy (kWh)
Brake pad
wear (cm3)
Brake pad
wear (g)
Brake pad wear
(mm3/ seat-km)
Brake wear
(index)
317 Electric 90 3 02:39 15.4 33.0 55.0 30.0 0 284.2 11.1 56.9 0.0512 25.4
318 Electric 90 6 02:47 12.4 26.6 44.3 29.6 0 226.2 8.9 45.3 0.0408 20.2
319 Electric 90 0 02:38 16.9 36.4 60.6 33.9 0 354.2 13.9 71.0 0.0638 31.6
320 Electric 90 3 02:40 15.1 32.4 53.9 28.6 0 266.3 10.4 53.4 0.0480 23.8