benford’s law - why and how to use it - fraud conference · benford’s law - why and how to use...
TRANSCRIPT
Benford’s Law - Why And How To Use It
Gogi Overhoff, CPA, CFE
ACFE, San Diego - June 13, 2011

Definition
Known as the “first digit law”, Benford’s Law states that in
lists of numbers from many (but not all) real-life sources of
data, the leading digit is distributed in a specific, non-
uniform way.

1 2 3 4 5 6 7 8 9
Expected Digit Frequency Percentages:
1 - 30.103%
2 - 17.609%
3 - 12.494%
4 - 9.691%
5 - 7.918%
6 - 6.695%
7 - 5.799%
8 - 5.115%
9 - 4.576%
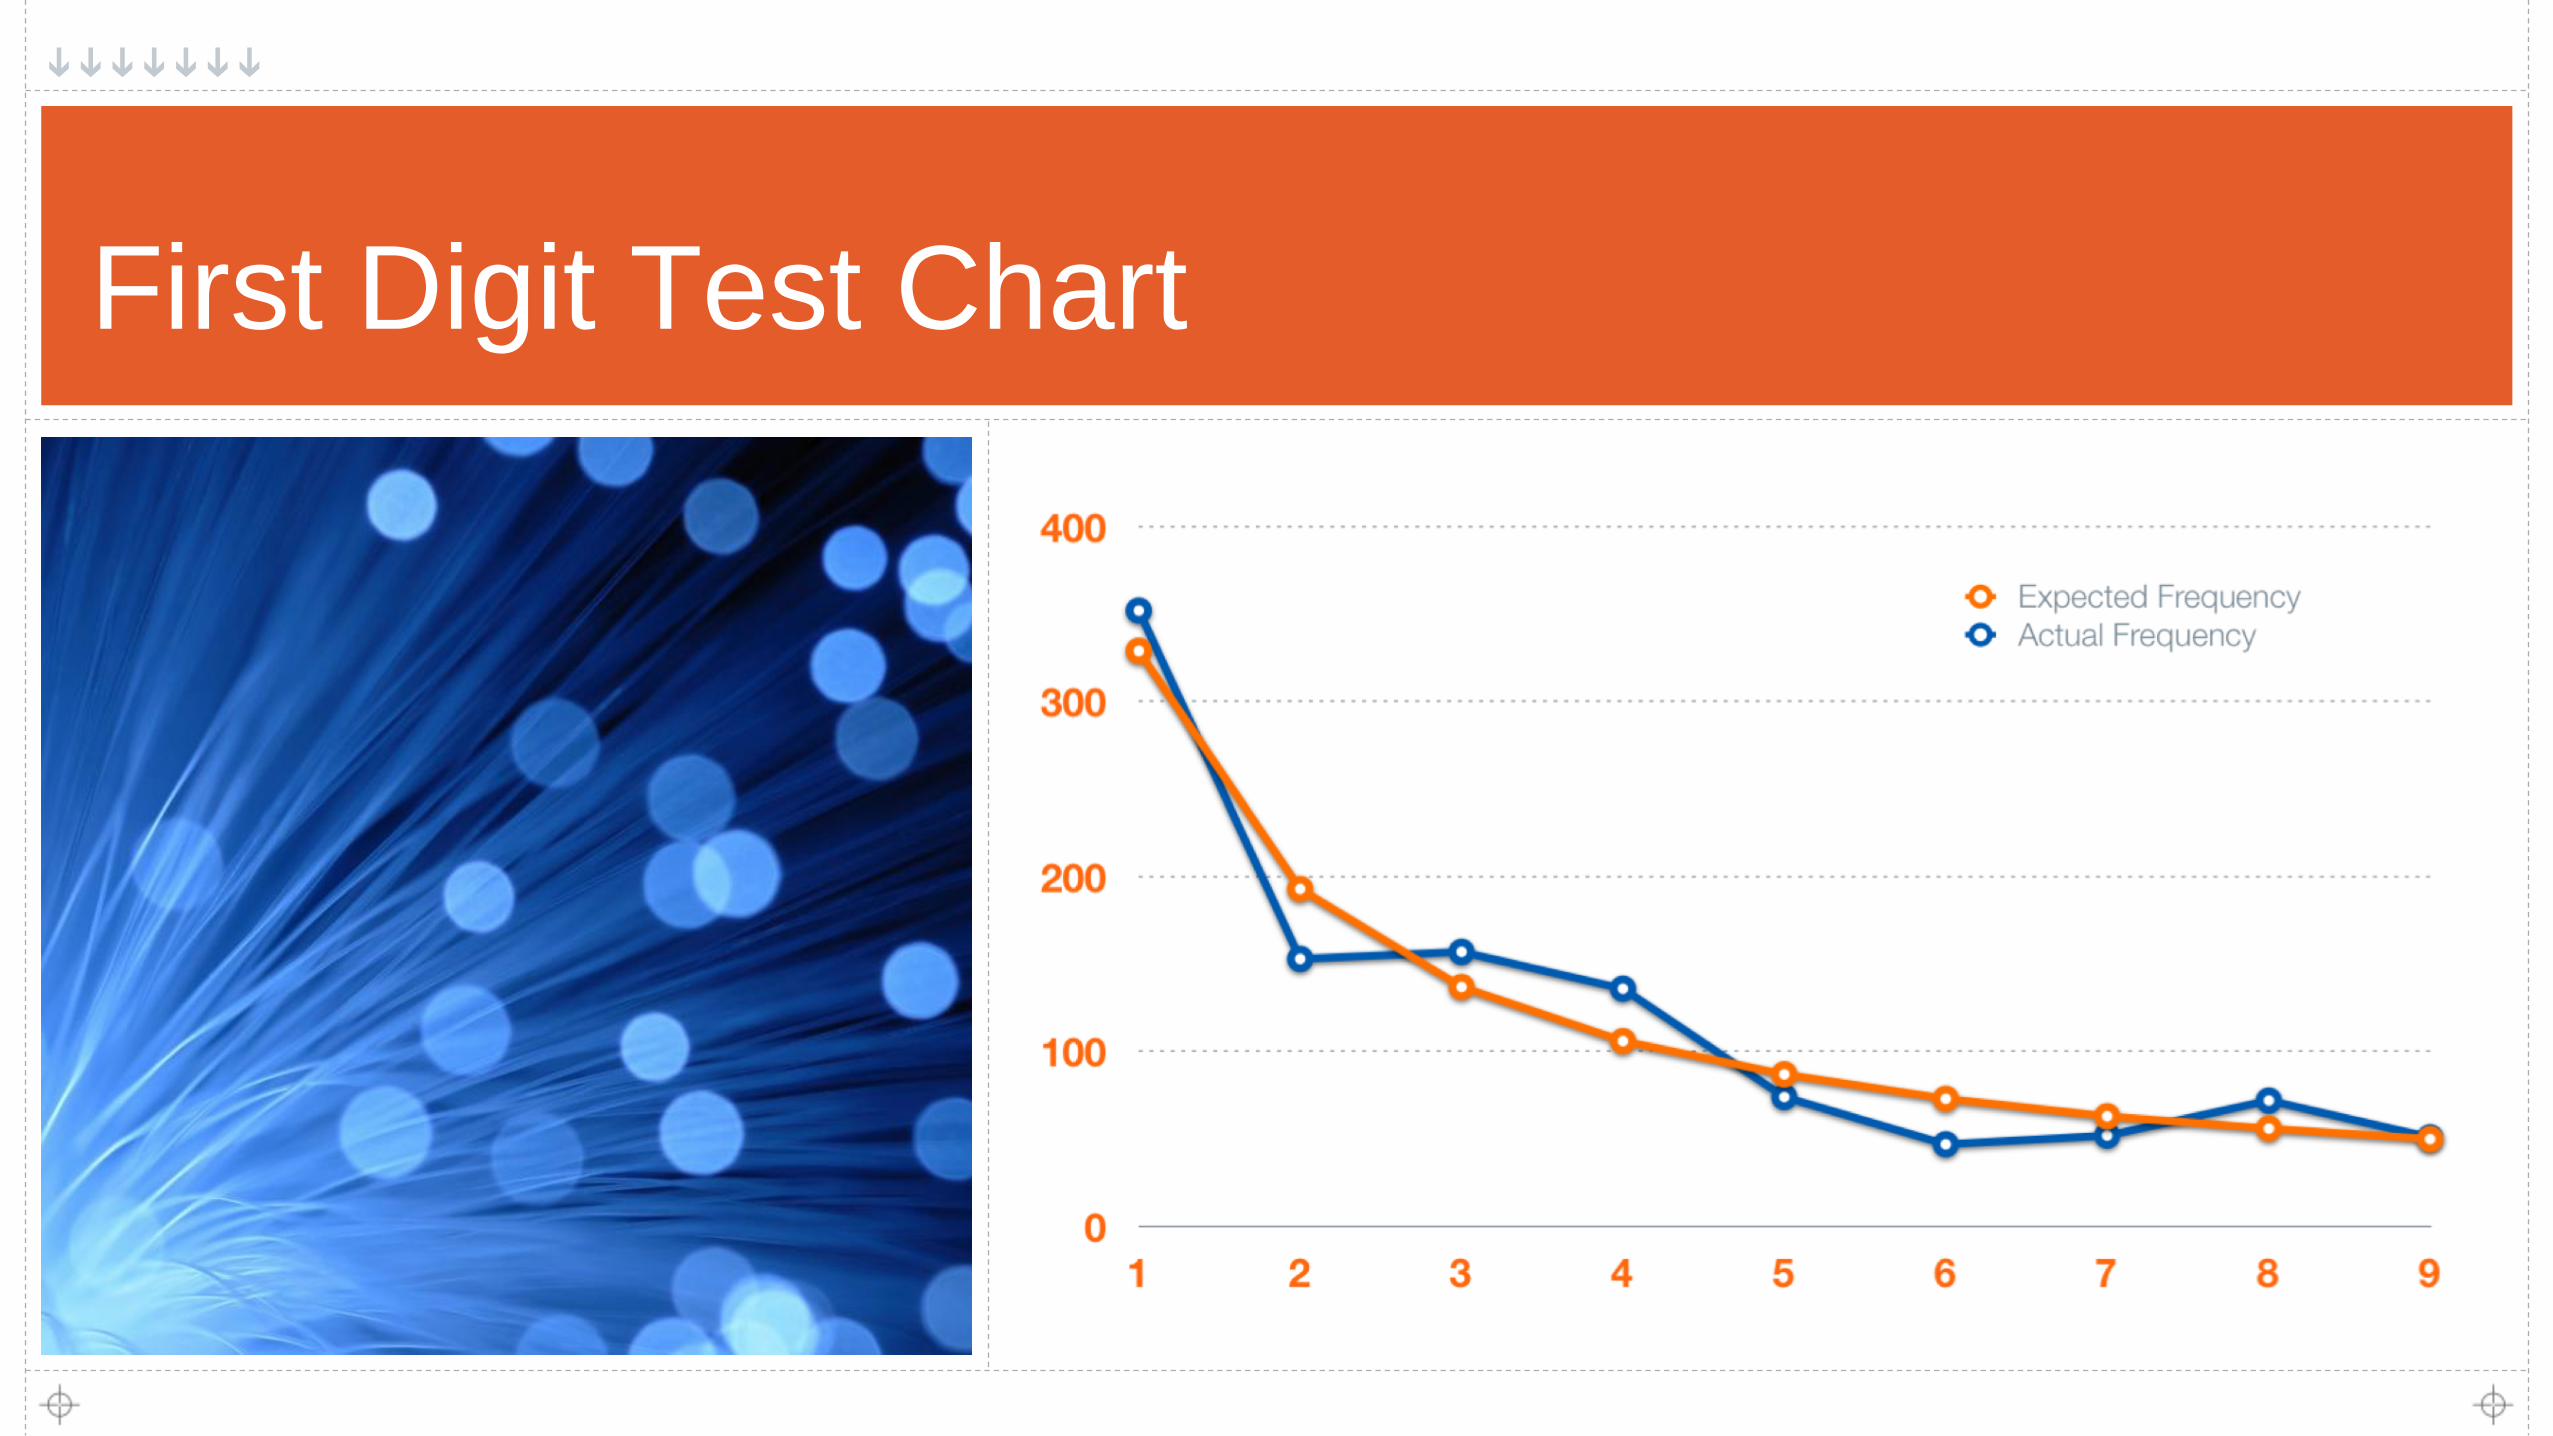
Benford’s First Digit Chart

Synopsis
Efficient way to apply the smell test
Easy to learn
No need for special software
Admissible in local, state, federal, and international
criminal cases
Disclaimer: Use together with other procedures

Early History
1881, Simon Newcomb
initial discovery, article in American Journal of Mathematics
1938, Frank Benford
initial testing took 6 years
total of 20,229 observations
More History
1961: Pinkham, scale invariant
1988: Carslaw, rounded numbers
1995: Hill, mathematical proof
1996: Nigrini, identified an accounting USE

Since 1996
Publications
Journal of Accountancy
New York Times
Proprietary Software
ACL, IDEA, Microsoft Access
Major Users
government authorities, litigators, bloggers and…
What It Does
Predicts the occurrence of digits
Counts frequencies of digits
Improves sampling selection process
Digits 1-3 should be > 60% of first digits
Identifies amounts that do not conform to
expectations
The digit 9 should appear 4.5% of the time
Frauds that became big after starting small
Uses
To find fraud
Percentages do not match expectations
To find inefficiency & errors
Multiple checks for the same amount
Same amount, same invoice, different
vendor
To find manipulative biases
Management’s educated guesses

10
How: Five Tests
First Digit Test
Count frequency of 1 – 9 as first digit
Second Digit Test
What are we counting here?
First Two Digits Test
First Three Digits Test
Last Two Digits Test

11
Examples
• Benford’s Law: “1” Appears More Often than
Any Other Number
$100 portfolio with a 10% rate of return
Dow Jones: the next order of magnitude (a new “1”!) is
reached faster and faster

12
First & Second Digit Tests
Both are high level
Both identify only obvious anomalies
1st digit checks reasonableness of data
2nd digit shows improper rounding

13
First Digit Actual Frequency Expected Freq. Variance # Actual % Freq. Expected % Freq. Variance %
0 0 0 0 0% 0% 0%
1 352 329 23 32.176% 30.103% 2.073%
2 153 193 -40 13.985% 17.609% -3.624%
3 157 137 20 14.351% 12.494% 1.857%
4 136 106 30 12.431% 9.691% 2.74%
5 74 87 -13 6.764% 7.918% -1.154%
6 47 73 -26 4.296% 6.695% -2.398%
7 52 63 -11 4.753% 5.799% -1.046%
8 72 56 16 6.581% 5.115% 1.466%
9 51 50 1 4.662% 4.576% 0.086%
First Digit Test Table
14
First Digit Test Chart

15
First Two Digits Test
More focused
Shows overused and underused digit patterns
Provides an efficient audit sample for testing

16
First Two Digits Test Chart
0
10
20
30
40
50
60
70
10 14 18 22 26 30 34 38 42 46 50 54 58 62 66 70 74 78 82 86 90 94 98
Expected Frequency Actual Frequency

17
• Multiple small payments for the
same amount to the same
vendor.
• Why is there a vendor with the
same name without the “Inc”?
• Notice the single check to C
Davis Co. for the same amount
as the Sparkles checks.
• The $8,775 check - is it real?
18
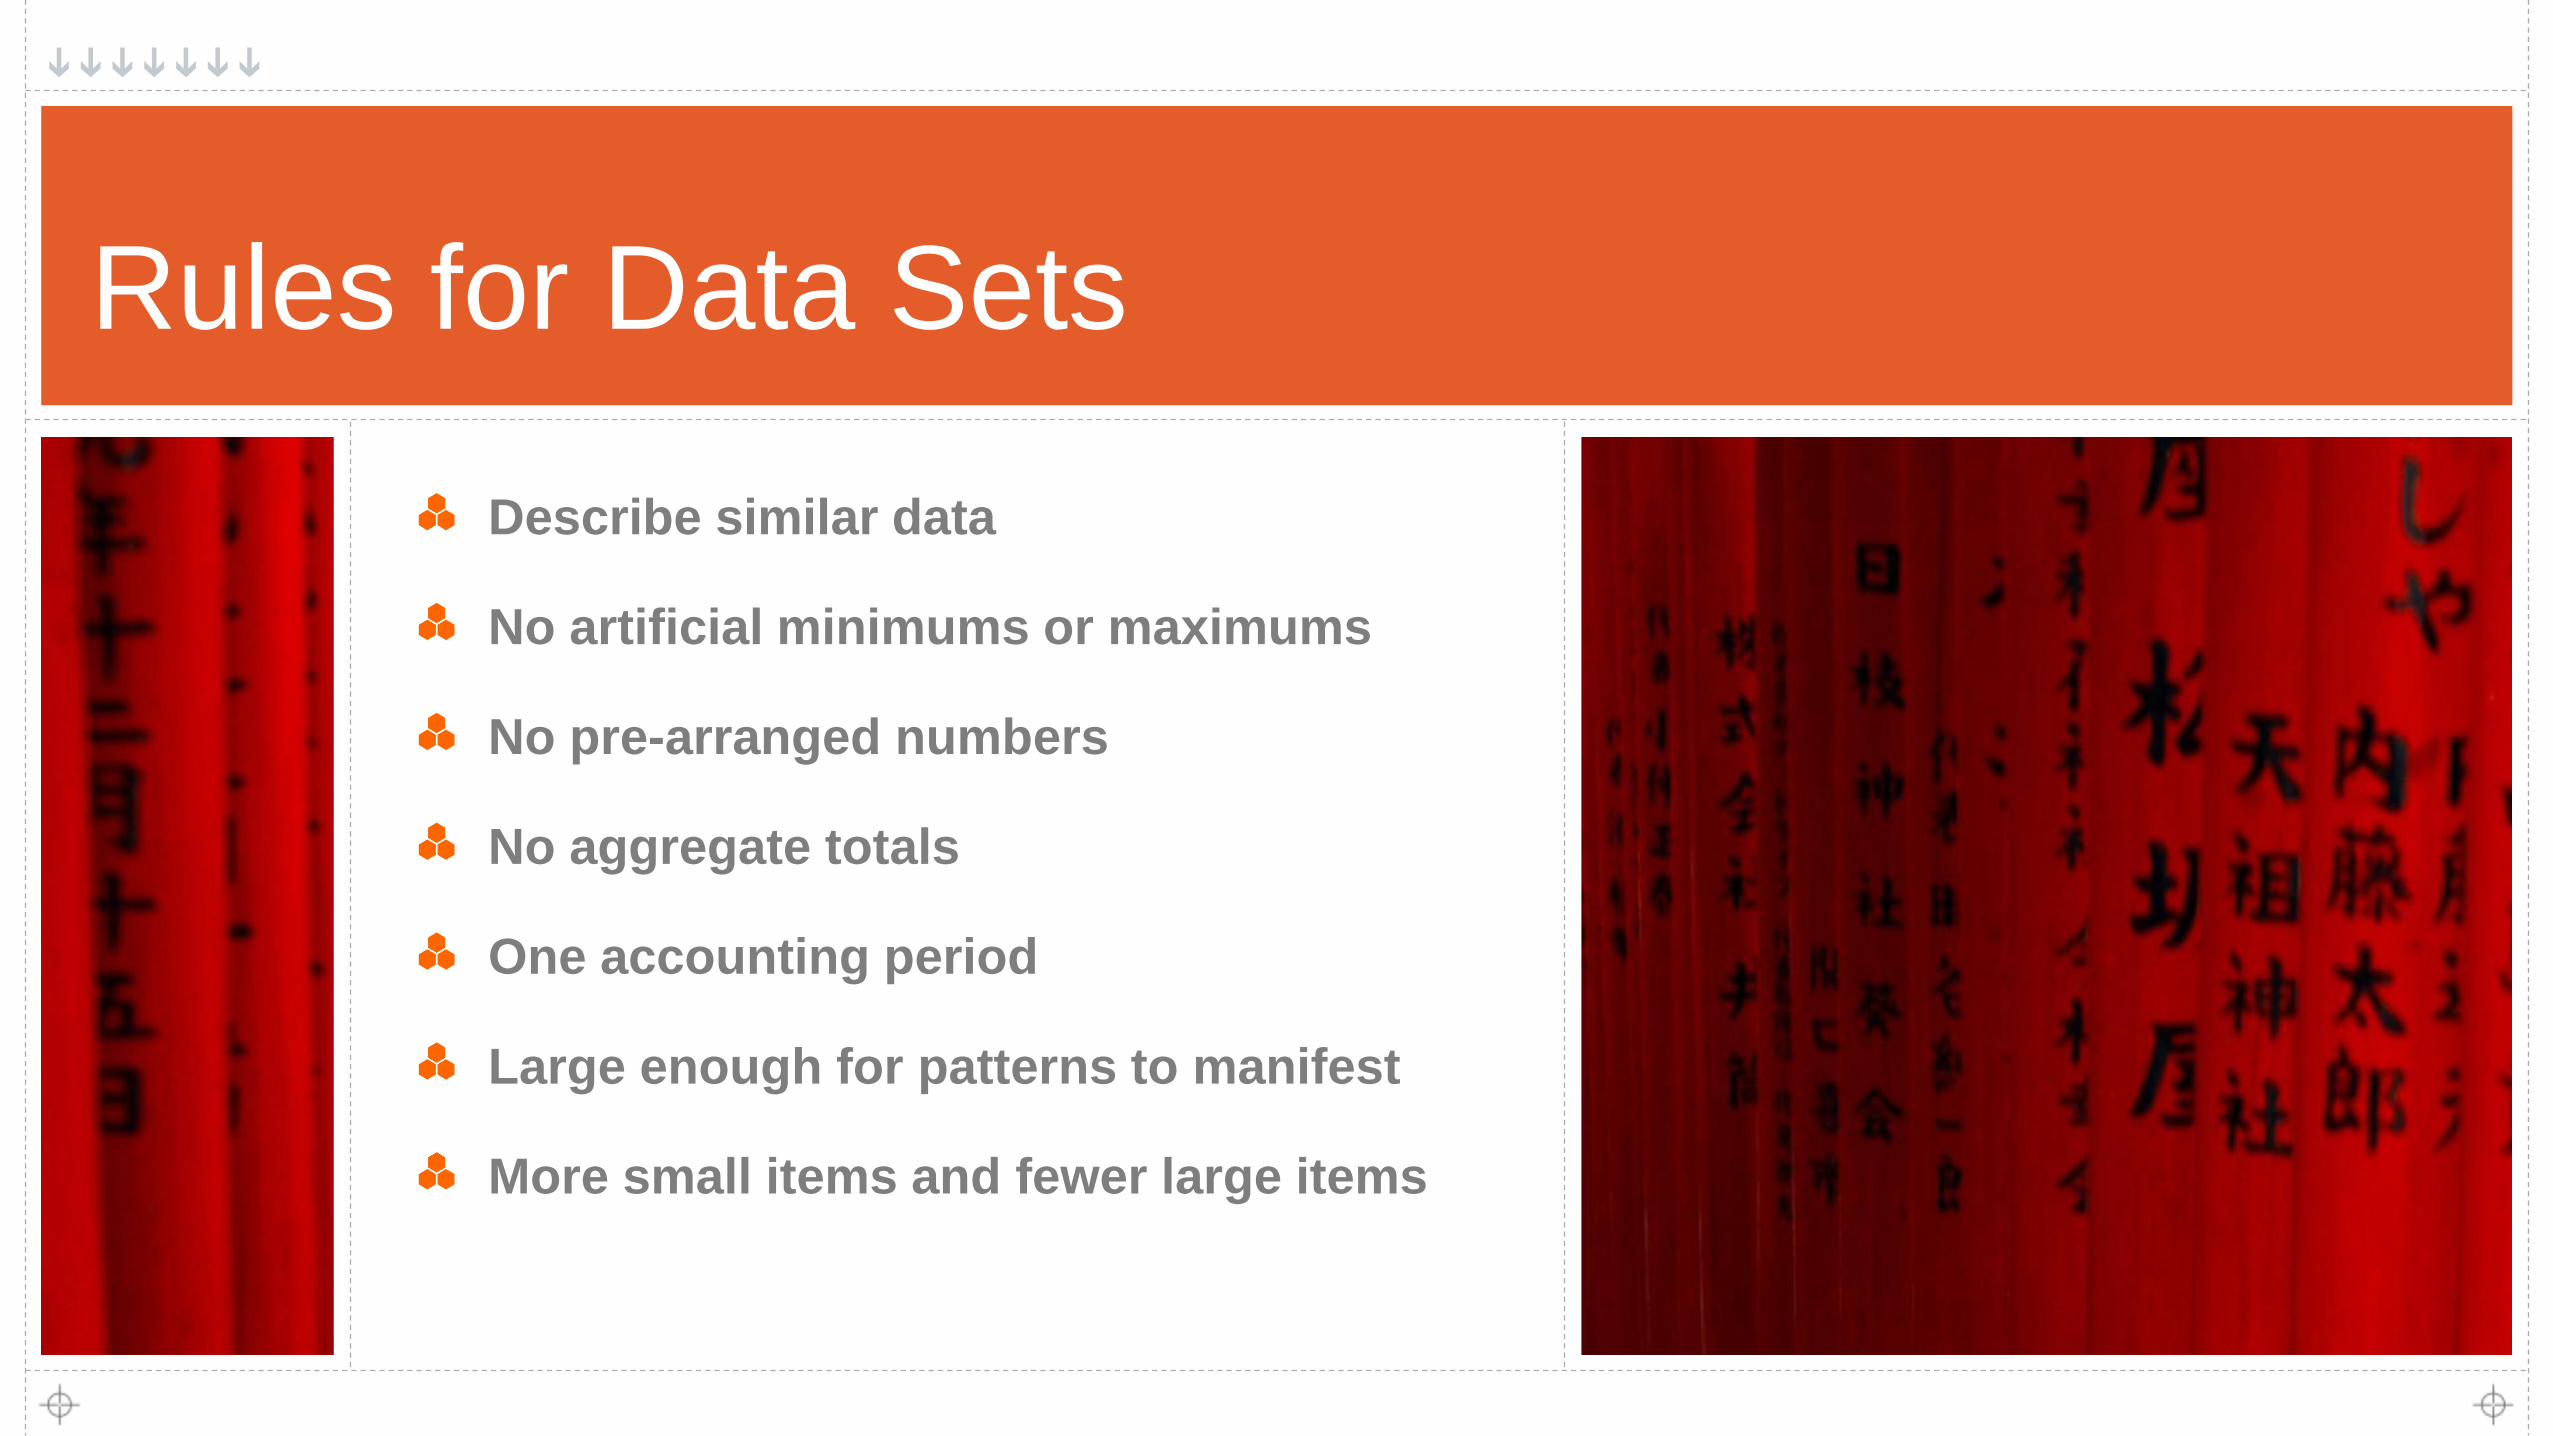
Rules for Data Sets
Describe similar data
No artificial minimums or maximums
No pre-arranged numbers
No aggregate totals
One accounting period
Large enough for patterns to manifest
More small items and fewer large items

19
Two Concerns
Intuitive
A few aberrations will not trigger a significant departure from expectations
Statistical
It takes smaller proportion of aberrations to trigger a departure when the data set has a large number of
transactions

20
Example A: 4,356 Items

21
Example B: 415 Items

22
Example C: 748 Items
23
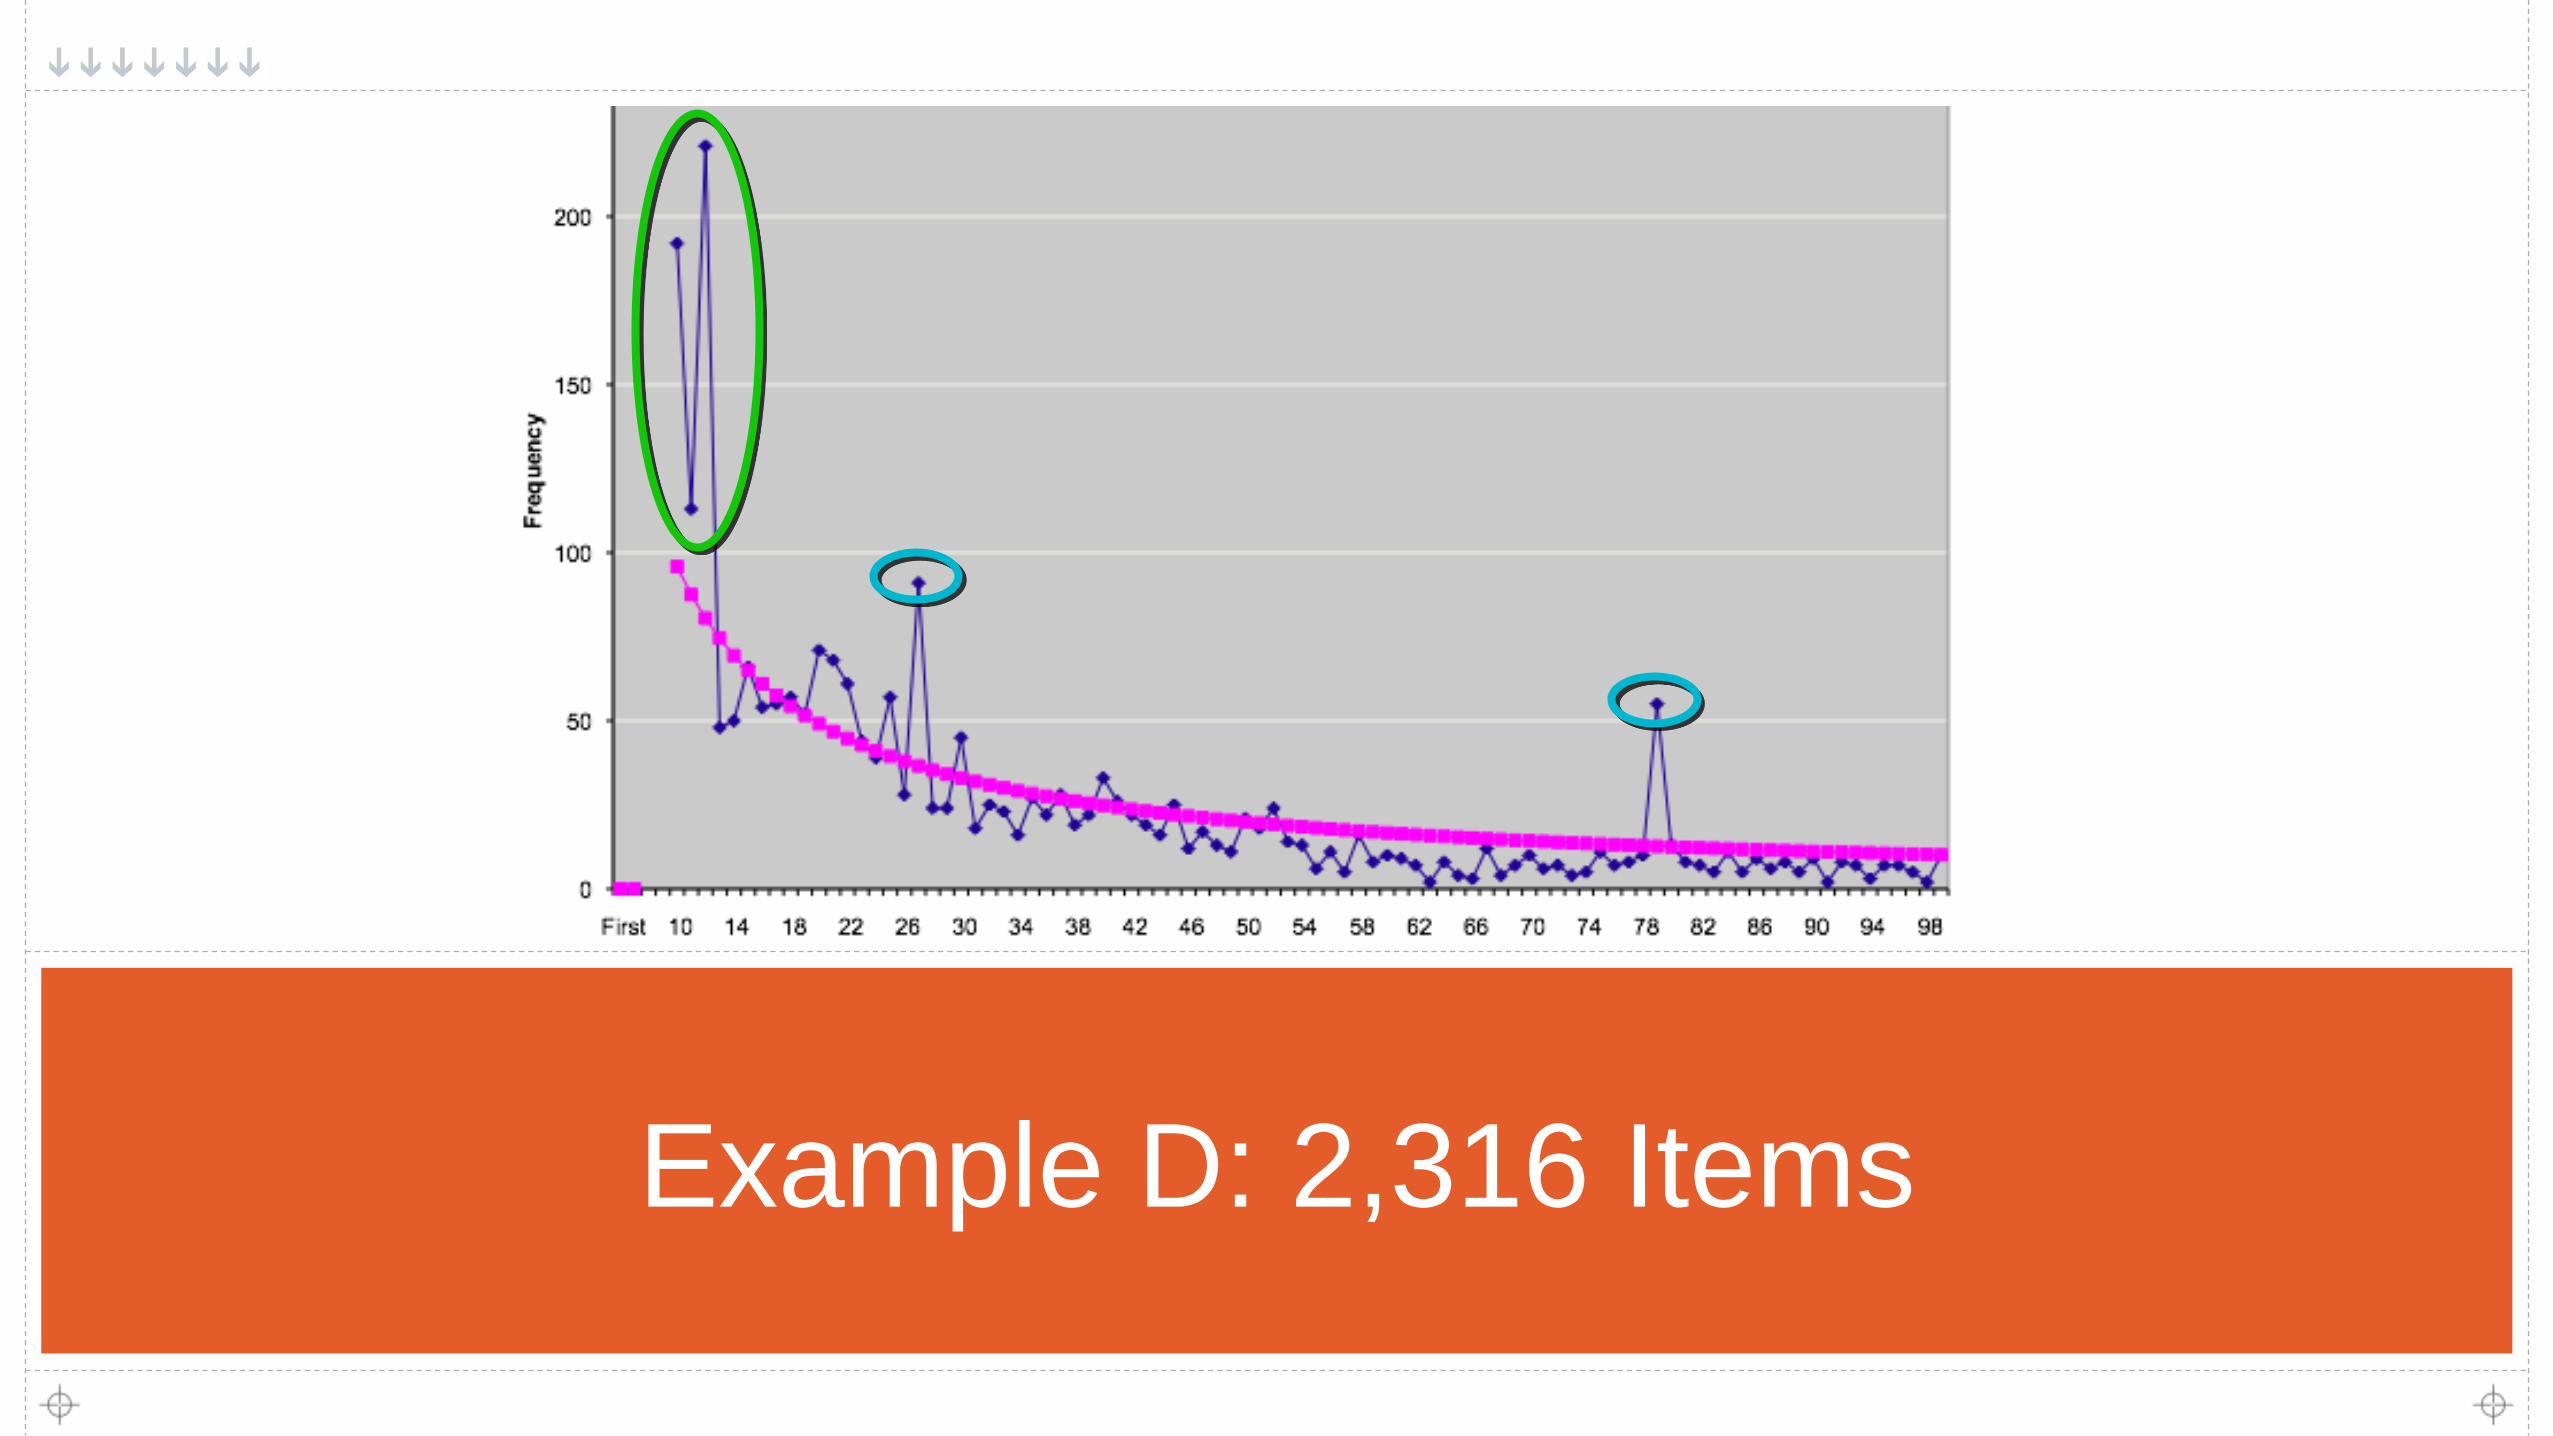
Example D: 2,316 Items
24
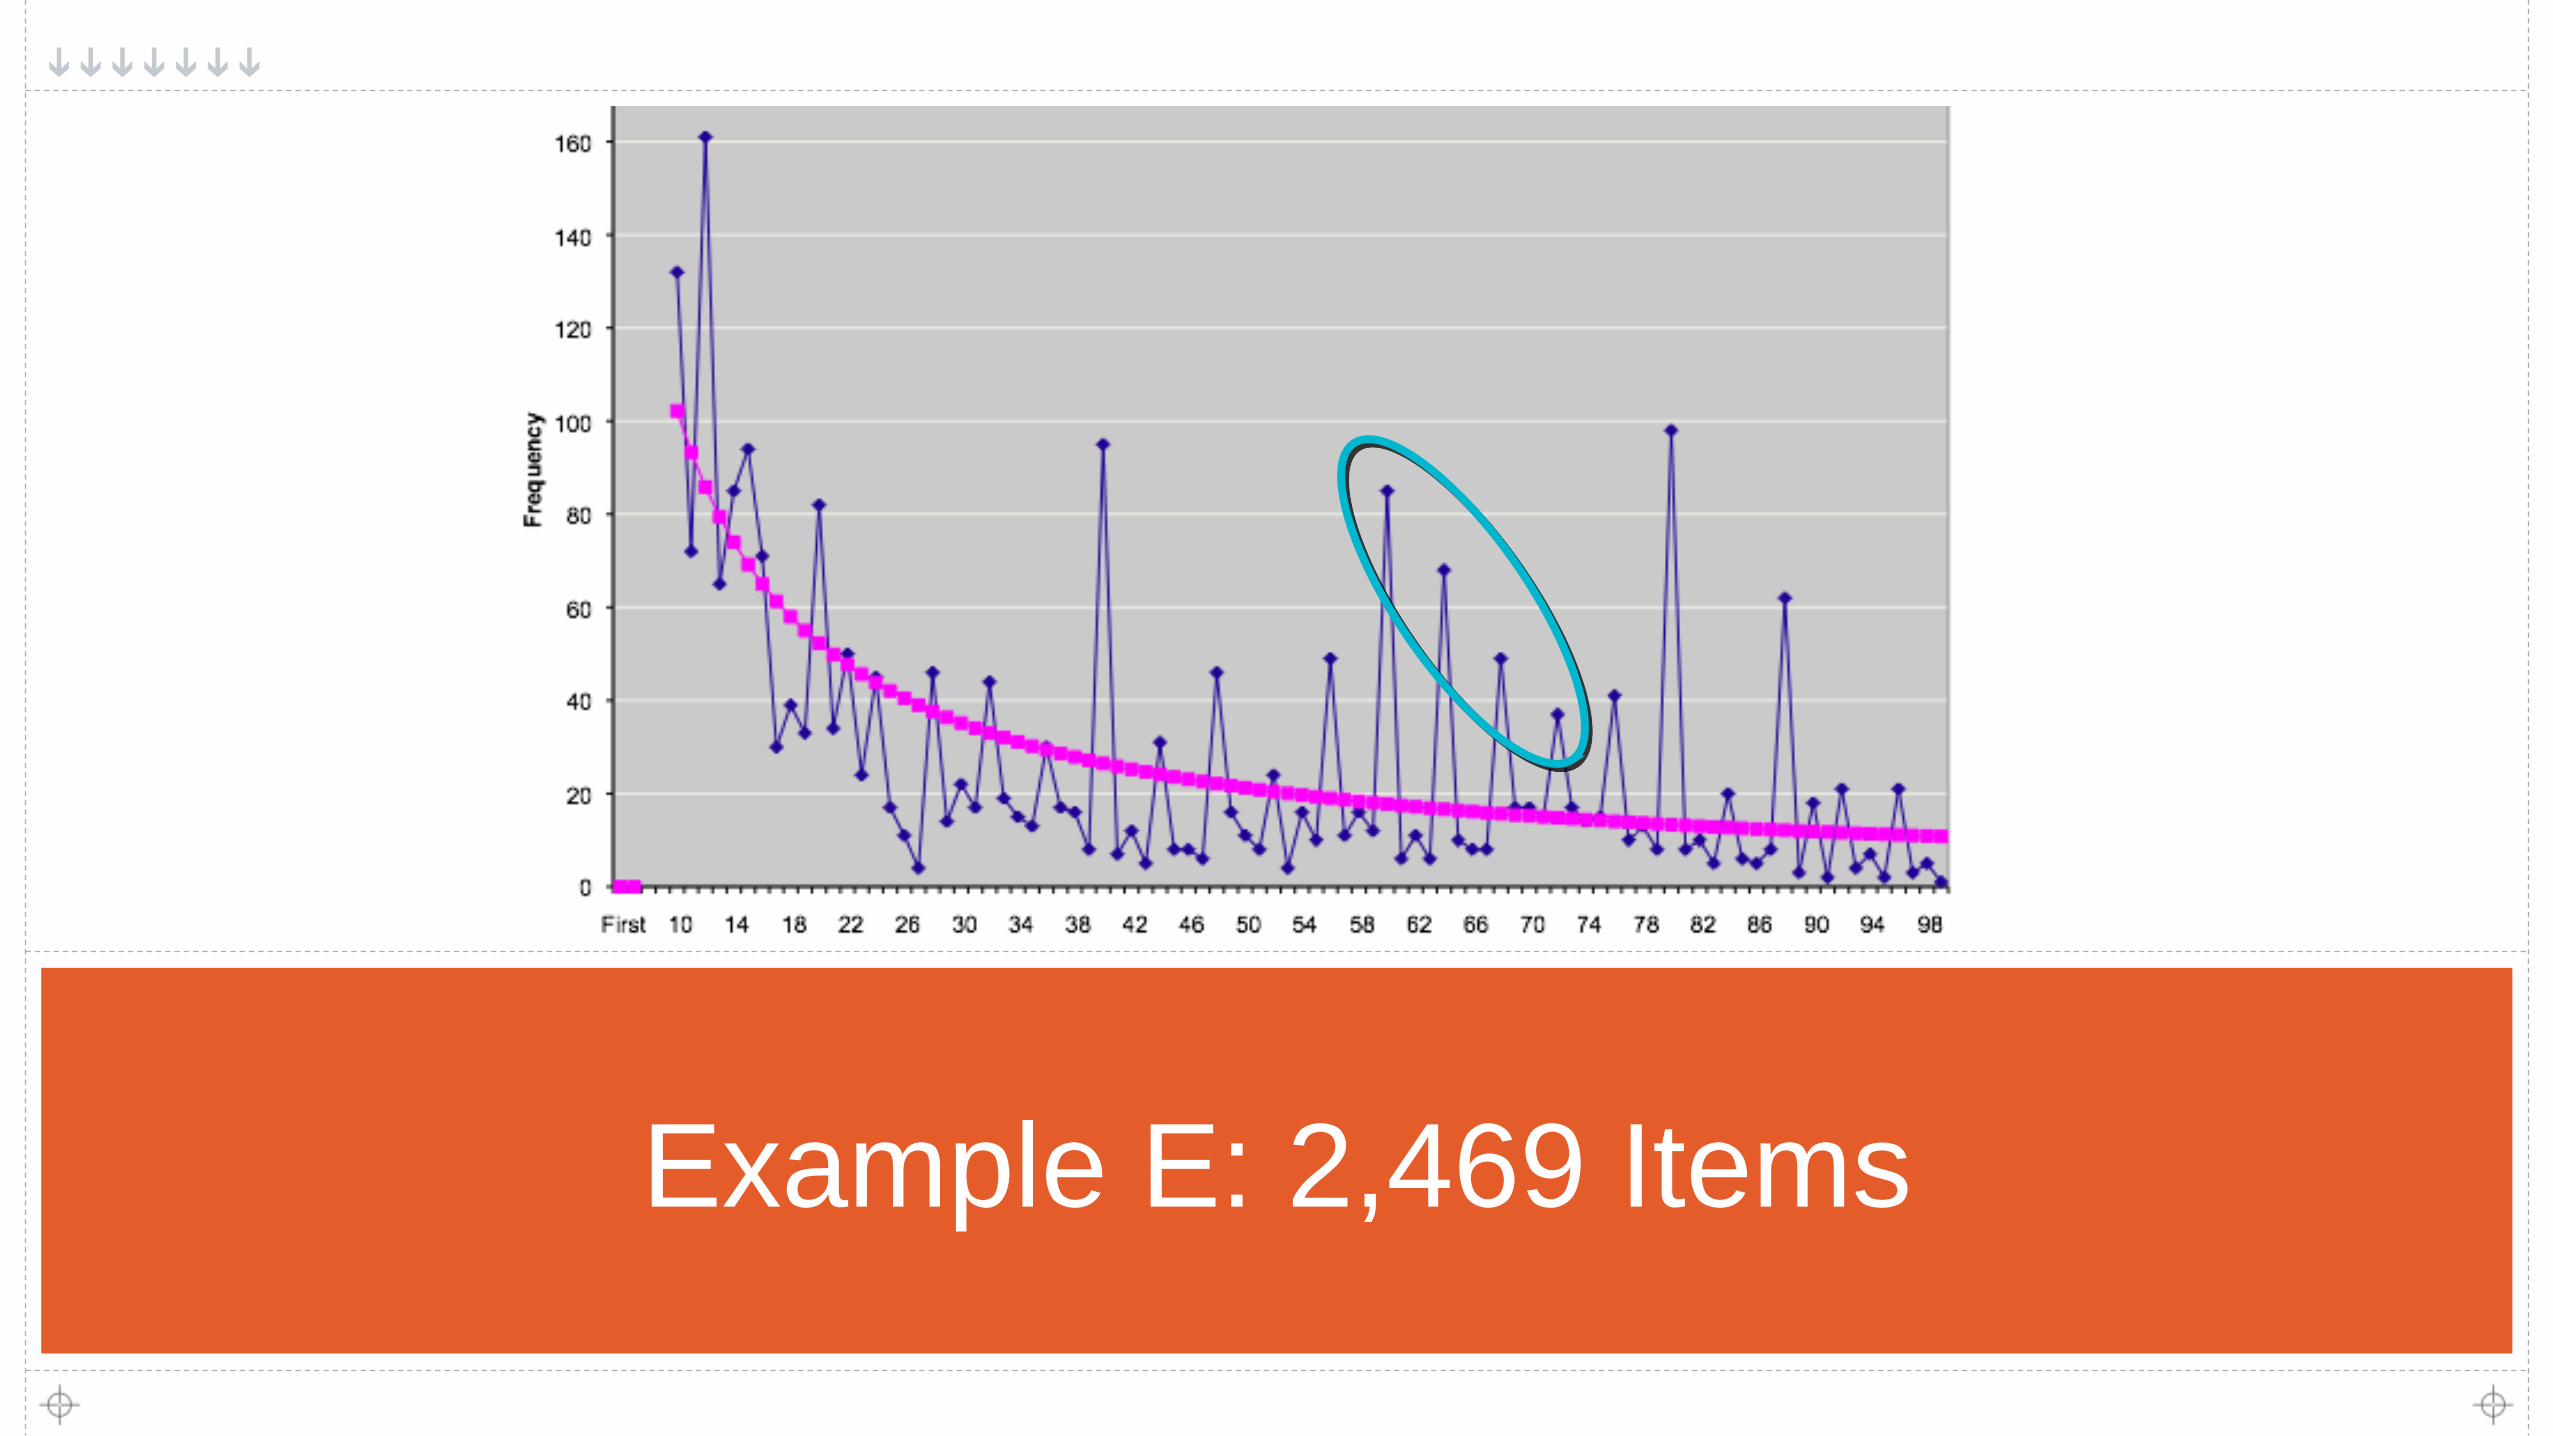
Example E: 2,469 Items

25
Good Uses
Fraud inquiries
Planning
Individual financial statement accounts
Scientific data, insurance claims, survey
data, campaign financing …

26
Three A’s
Adaptive Benford
Almost Benford
ANN
27
Additional Reading
Nigrini, Mark. Forensic Analystics: Methods and
Techniques; Wiley, 2011.
Ferraro, Eugene. Investigations in the Workplace;
Auerbach Publications, 2005.
Gibson, William. Pattern Recognition; Berkeley, 2005.
Numerous articles