bengaluru road safety & injury prevention programme ...s3.amazonaws.com/zanran_storage/ ·...
TRANSCRIPT
Bengaluru Road Safety &
Injury Prevention Programme:
Injury snapshots and activity
profile - 2009
National Institute of Mental Health & Neuro SciencesDepartment of Epidemiology
WHO Collaborating Centre for Injury Prevention
and Safety Promotion
Bengaluru – 560 029, India

World Health Organization,New Delhi
Ministry of Health &Family Welfare, New Delhi
Indian Council of Medical Research, New Delhi
In Collaboration with
SagarHospitals
BANGALORE
ESTD 1980
Bangalore CityTraffic Police
Bengaluru City PoliceBengaluru MetropolitanTransport Corporation
Victoria HospitalBowring & Lady Curzon
HospitalBruhat Bengaluru
Mahanagara Palike
St. John’s HospitalSanjay Gandhi Institute
of Trauma andOrthopaedics
M. S. RamaiahMemorial Medical
Hospital
Kempegowda Instituteof Medical Sciences &
Research Centre
Ambedkar MedicalCollege & Hospital
Rajarajeswari MedicalCollege & Hospital
Vydehi MedicalCollege & Hospital
MVJ Medical College &Research Hospital
ESI HospitalRajajinagar
Sri. Siddhartha MedicalCollege, Tumkur
St. Martha’s HospitalHOSMAT Hospital
St. Philomena’s HospitalChinmaya Mission
Hospital
Sagar Hospital Sparsh Hospital Bengaluru BaptistHospital
Columbia AsiaHospital
Manipal Hospital
Command Hospital Suguna Hospital Bhagwan Mahaveer JainHospital
District Hospital,Tumkur
Ravi Kirloskar MemorialHospital
D.G.Hospital Rajiv Gandhi Instituteof Chest Disease
Mallige Medical Centre Mallya Hospital K.R.Hospital
Bengaluru
Road Safety & Injury
Prevention Programme:
Injury snapshots and activity
profile - 2009
i
Bengaluru Road Safetyand
Injury Prevention Programme:Injury snapshots andActivity report 2009
NATIONAL INSTITUTE OF MENTAL HEALTH &NEURO SCIENCES
Department of EpidemiologyWHO Collaborating Centre for Injury Prevention and Safety Promotion
Bengaluru – 560 029, India
ii BRSIPP 2009
Title: Bengaluru Road safety and Injury Prevention Programme: Injury snapshots and Activity profile 2010
Copyright: NIMHANS
ISBN no: 81 - 86427 - 00 - X
Year of publication: 2010
Key words:
Injury; surveillance; Data; Mortality; Morbidity; Disability: Road Traffic Injury; Suicide; Burns;Poisoning; Injury Prevention and Care: Capacity strengthening; policy and Programme
Suggested citation:
Gururaj G and Bengaluru Injury surveillance collaborators group. Bengaluru Road safety and InjuryPrevention Programme: Injury snapshots and Activity profile 2010. National Institute of MentalHealth and Neuro Sciences, Publication No 72, Bengaluru, 2010
(For details, contact any of the Nodal Officers or Programme Co-ordinator)
Address for Correspondence:
Dr. G. GururajProgramme CoordinatorProfessor & HeadDepartment of EpidemiologyWHO Collaborating Centre for Injury Prevention and Safety PromotionNIMHANS, Bengaluru - 29Email: [email protected]; [email protected]
For further details about the programme, contact any of the programme nodal officers or –
Dr. G. GururajProgramme CoordinatorProfessor & HeadDepartment of EpidemiologyWHO Collaborating Centre for Injury Prevention and Safety PromotionNIMHANS, Bengaluru - 29Email: [email protected]

iii
Nodal Officers
N. D. Birje (Bangalore city police-traffic), V. Ramaiah (Bangalore city police-Law and
Order), Nitin Hegde (BMTC), Dr. Alfred C Roy and Dr. Niranjan (Bangalore Baptist Hospital),
Dr. Amarnath (Bowring & Lady Curzon Hospital), Dr. Rizwan Ali Khan (D.G. Hospital),
Dr. Ajith Benidict Rayan (HOSMAT Hospital), Dr. Manjunath B (Jayanagar General Hospital),
Dr. Harsha J. N (KR Hospital), Dr. Devaraj (Kemepegowda Institute of Medical Sciences),
Dr. Mali Manjunath (M. S. Ramaiah Medical College and Hospitals), Dr. Ramireddy, and
Dr.Sudharshini (Mallige Medical Centre), Dr. Rajeev Mathew (Sagar Hospitals),
Dr. Prabhakar ( Sanjay Gandhi Institue of Trauma and Orthopaedics), Dr. Mabel Vasnaik
(St. John's Medical College & Hospital), Dr. Mallikarjun V. Abdulpur (St. Martha's Hospital),
Dr. Riyaz Basha (Victoria Hospital), Dr. Ramesh and Dr. Muralidhar (Employee State
Insurance Model Hospital (ESI), Rajajinagar), Dr. Muralikumar (Chinmaya Mission
Hospital), Dr. Nithya A. (Suguna Hospital), Dr. Sathish Kumar (Vydehi institute of medical
science), Dr. Srividya V (Rajarajeshwari Medical College and Hospital), Dr. Nina Laxmikanth
(Columbia Asia Hospital), Dr. Mohd. Irshad Ahmed (Ambedkar Medical College and
Hospital), Dr. Ashok J and Dr. Venkatesh (Siddhartha Academy of Higher Education),
Gp. Capt. M. Shukla (Command Hospital, Airforce), Dr. Anjan Reddy (MVJ Medical Hospital
and Research Hospital), Dr. Sateesh V. L and Dr. Girish N. Rao (National Institute of Mental
health and Neurosciences).

iv BRSIPP 2009
Partners in Programme
State Crime Records Bureau: Sri. Sanjay Sahay, IPS, Inspector General of Police
Bengaluru City Police
� Sri. Shankar Bidari, IPS Commissioner of Police, Bengaluru City
� Sri. Praveen Sood, IPS Additional Commissioner of Police (Traffic and Road Safety)
� Sri M.N. Reddi, IPS Formerly Additional Commissioner of Police (Traffic and Security)
� Sri. M.R. Pujar, IPS Additional Commissioner of Police (Law and Order)
� Sri. Panduranga Rane, IPS Deputy Commissioner of Police (Traffic West)
� Sri. B. A. Muthanna, IPS Deputy Commissioner of Police (Traffic East)
� Sri. Shivakumar, IPS Deputy Commissioner of Police (West)
� Sri. B. K. Singh, IPS Deputy Commissioner of Police (Admin)
� Sri. M. Chandrashekar, IPS Deputy Commissioner of Police (EAST)
� Sri. T.G.Krishna Bhatta, IPS Deputy Commissioner of Police (South)
� Sri. B.N.S.Reddy, IPS Deputy Commissioner of Police (South East)
� Sri. H.S.Revanna, IPS Deputy Commissioner of Police (North)
� Sri. G.Ramesh, IPS Deputy Commissioner of Police (Central)
� Sri. Basavaraju Malagathi, IPS Deputy Commissioner of Police (North East)
� Sri. N. D. Birje, Nodal Officer and Assistant Commissioner of Police (Traffic & Planning)
� Sri. S. A. Pasha, Assistant Commissioner of Police, Traffic Training Institute, Bangalore
� Sri. V. Ramaiah, Nodal Officer (law and order) and Deputy Commissioner of Police, Public Relations Officer
� Sri Raghuveer, Assistant Commissioner of Police (Control room),
� Sri. Byrappa, Sri. Kulkarni, Sri. Vijaykumar: Traffic Training Institute
� City Crime Record Bureau: Sri. Vijaya Kumar, Assistant Commissioner of Police, Smt. Girija, Inspector ofPolice, Mr. Venkatarao , Sub Inspector, Sri. Mohemmed Sajjad Khan, Police Sub Inspector, Smt. Lalitha,Mr. Pradeepkumar, Mr. Ravi, Mr. Prasanna
� All the staff from Traffic and Law and Order stations of Bengaluru
Tumkur District
� Dr. Harsha, IPS Superintendent of Police,
� Sri. Nagarajaiah Assistant Sub Inspector, Sri. Narasimhaiah (Head Constable),Sri. Chandrashekar (Head Constable)
� All the staff from Police Department in Tumkur
Bengaluru Metropolitan Transport Corporation
Sri. Syed Zameer Pasha, Managing DirectorSri. K. S. Vishwanath, Chief Traffic ManagerSri. Nitin Hegde, Nodal Officer and Divisional Traffic Officer (Accident)Sri Shankara Bharathi, Assistant Traffic SuperintendentSmt. Mahadevamma, Smt. Komala, Smt. Anitha, Smt. Vinutha
Karnataka State Road Transport Corporation
Sri. Gowrav Guptha, Managing Director,Sri. Dastagir Shariff, Chief Traffic Manager,Sri. M. A. Saleem, Security and Vigilance officer,
v
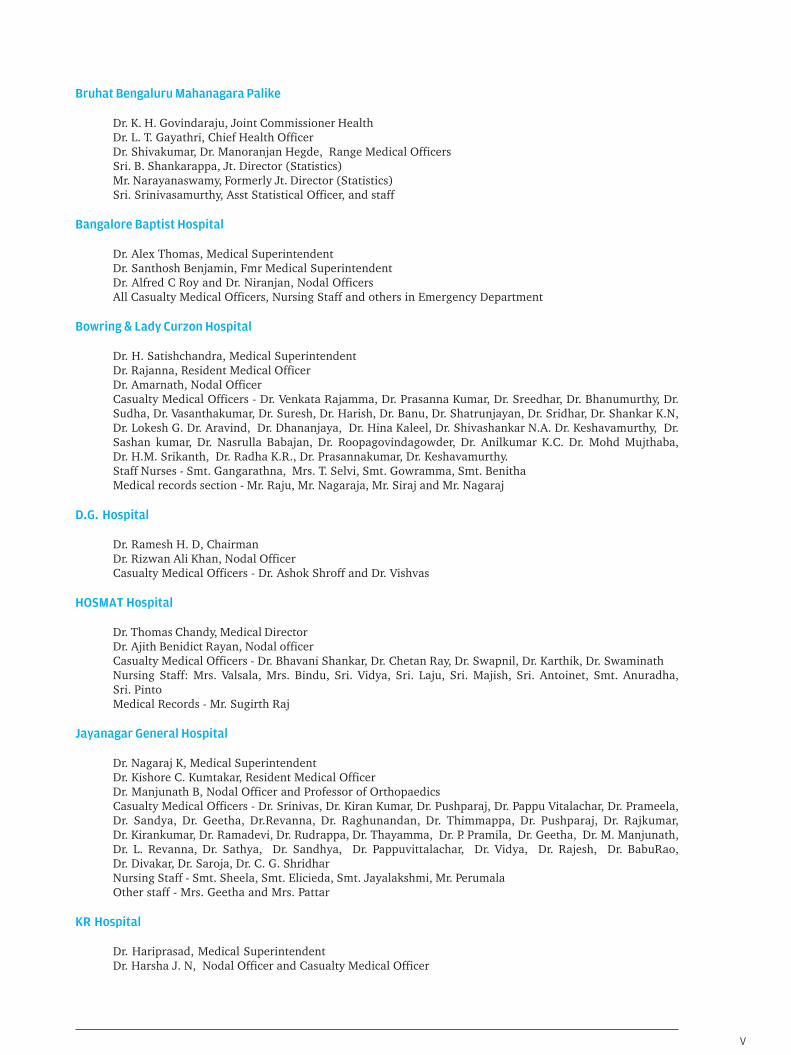
Bruhat Bengaluru Mahanagara Palike
Dr. K. H. Govindaraju, Joint Commissioner HealthDr. L. T. Gayathri, Chief Health OfficerDr. Shivakumar, Dr. Manoranjan Hegde, Range Medical OfficersSri. B. Shankarappa, Jt. Director (Statistics)Mr. Narayanaswamy, Formerly Jt. Director (Statistics)Sri. Srinivasamurthy, Asst Statistical Officer, and staff
Bangalore Baptist Hospital
Dr. Alex Thomas, Medical SuperintendentDr. Santhosh Benjamin, Fmr Medical SuperintendentDr. Alfred C Roy and Dr. Niranjan, Nodal OfficersAll Casualty Medical Officers, Nursing Staff and others in Emergency Department
Bowring & Lady Curzon Hospital
Dr. H. Satishchandra, Medical SuperintendentDr. Rajanna, Resident Medical OfficerDr. Amarnath, Nodal OfficerCasualty Medical Officers - Dr. Venkata Rajamma, Dr. Prasanna Kumar, Dr. Sreedhar, Dr. Bhanumurthy, Dr.Sudha, Dr. Vasanthakumar, Dr. Suresh, Dr. Harish, Dr. Banu, Dr. Shatrunjayan, Dr. Sridhar, Dr. Shankar K.N,Dr. Lokesh G. Dr. Aravind, Dr. Dhananjaya, Dr. Hina Kaleel, Dr. Shivashankar N.A. Dr. Keshavamurthy, Dr.Sashan kumar, Dr. Nasrulla Babajan, Dr. Roopagovindagowder, Dr. Anilkumar K.C. Dr. Mohd Mujthaba,Dr. H.M. Srikanth, Dr. Radha K.R., Dr. Prasannakumar, Dr. Keshavamurthy.Staff Nurses - Smt. Gangarathna, Mrs. T. Selvi, Smt. Gowramma, Smt. BenithaMedical records section - Mr. Raju, Mr. Nagaraja, Mr. Siraj and Mr. Nagaraj
D.G. Hospital
Dr. Ramesh H. D, ChairmanDr. Rizwan Ali Khan, Nodal OfficerCasualty Medical Officers - Dr. Ashok Shroff and Dr. Vishvas
HOSMAT Hospital
Dr. Thomas Chandy, Medical DirectorDr. Ajith Benidict Rayan, Nodal officerCasualty Medical Officers - Dr. Bhavani Shankar, Dr. Chetan Ray, Dr. Swapnil, Dr. Karthik, Dr. SwaminathNursing Staff: Mrs. Valsala, Mrs. Bindu, Sri. Vidya, Sri. Laju, Sri. Majish, Sri. Antoinet, Smt. Anuradha,Sri. PintoMedical Records - Mr. Sugirth Raj
Jayanagar General Hospital
Dr. Nagaraj K, Medical SuperintendentDr. Kishore C. Kumtakar, Resident Medical OfficerDr. Manjunath B, Nodal Officer and Professor of OrthopaedicsCasualty Medical Officers - Dr. Srinivas, Dr. Kiran Kumar, Dr. Pushparaj, Dr. Pappu Vitalachar, Dr. Prameela,Dr. Sandya, Dr. Geetha, Dr.Revanna, Dr. Raghunandan, Dr. Thimmappa, Dr. Pushparaj, Dr. Rajkumar,Dr. Kirankumar, Dr. Ramadevi, Dr. Rudrappa, Dr. Thayamma, Dr. P. Pramila, Dr. Geetha, Dr. M. Manjunath,Dr. L. Revanna, Dr. Sathya, Dr. Sandhya, Dr. Pappuvittalachar, Dr. Vidya, Dr. Rajesh, Dr. BabuRao,Dr. Divakar, Dr. Saroja, Dr. C. G. ShridharNursing Staff - Smt. Sheela, Smt. Elicieda, Smt. Jayalakshmi, Mr. PerumalaOther staff - Mrs. Geetha and Mrs. Pattar
KR Hospital
Dr. Hariprasad, Medical SuperintendentDr. Harsha J. N, Nodal Officer and Casualty Medical Officer
vi BRSIPP 2009
Kempegowda Institute of Medical Sciences and Research Centre
Dr. (Capt) Venkatesh, DirectorDr. M. K. Sudarshan, Dean and PrincipalDr. Anjanappa T. H, Medical SuperintendentDr. Ramachandra A, Formerly Administrative Medical OfficerDr. Devaraj, Nodal OfficerCasualty Medical Officers - Dr. Ramesh, Dr. Shankar, Dr. Roopak, Dr. Prasanna KumarMedical Records - Mr. E. Selwyn Jebasingh and Mr. LingappaDepartment of Community medicine, Dr. Ashwath Narayana D. H.
M. S. Ramaiah Medical College and Hospitals
Dr. S. Kumar, Dean and PrincipalDr. Sundaresh, Medical Director, M S Ramaiah Medical Teaching HospitalDr. Naresh Shetty, Medical Director, M S Ramaiah Memorial HospitalDr.Narendranath, Joint Medical Director, M S Ramaiah Memorial HospitalDr. Mali Manjunath, Nodal officerDepartment of Community medicine-Dr. Pruthvish, Dr. Suryanarayana S. P.Dr. Aruna Ramesh, Chief of Emergency ServicesCasualty Medical Officer - Dr. Satish Varma, Dr. Gopalappa, Dr. Anand Kumar C.Medical Records - Mrs. Wilbert Mary, Mrs. Padma, Mrs. Margaret Rosy, Mrs. Shyamala
Mallige Medical Centre
Dr. Sriram, Medical Director,Dr. Ramireddy, and Dr. Sudharshini, Nodal Officers,
Mallya Hospital
Comm. Indru Wadwani PresidentDr. Preethi Adoni, Medical SuperintendentCasualty Medical Officer- Dr. Sunil Kumar
Manipal Hospital
Mr. Rajan Padukone, Chief Executive OfficerDr. Sudarshan Ballal, Medical DirectorDr. Nagendra Swamy, Chief Operating Officer
Sagar Hospital
Dr. Hemachandra Sagar, ChairmanDr. Rajeev Mathew, Nodal OfficerCasualty Medical Officer - Dr. Dayananda, Dr. MuraliMedical Records Officer, Mr. W. Wellesly Stephen Sis. Mangala, Mr. Kumar
Sanjay Gandhi Institute of Trauma Care and Orthopaedics
Dr. K. Chandra shekara Naik, DirectorDr. Prabhakar, Nodal OfficerDr. Shivalingaiah, Resident Medical OfficerMedical records Department - Mr. Agilasithan, Mr. Yashvanth, Smt. Meera and Mr. Dhananjaya
Sparsh Hospital
Dr. Sharan Patil, Medical DirectorDr. Yohannan John, Director of Medical Services
vii
St. John’s Medical College & Hospital
Fr.Lawrence D.Souza, DirectorDr. Georgr D'souza, Medical SuperintendentDr. Prem Pais, DeanDr. Mabel Vasnaik, Nodal OfficerEmergency Department: Dr. Babu Palatti, Dr. Varghese, Dr.Shakunthala, Dr AnithaDepartment of Community Medicine - Dr. Arvind K, Dr. Bobby Joseph, Dr. Shilpa R.Medical Records Department - Mrs. Irine Jacob, Sr. Reeta
St. Martha’s Hospital
Surg.Cmde. A J Moraes, Medical SuperintendentSr. Dr. Teresita Fmr Medical SuperintendentDr. Mallikarjun V. Abdulpur, Nodal OfficerDr. Shashikanth, Legal Medical OfficerCasualty Medical Officers - Dr. Farid, Dr. Gopalaiah, Dr. Lucy Nora, Dr. Pai A GMedical Records Oofficer, Mr. Anthony
St. Philomena's Hospital
Dr. Shankar Prasad, Medical Superintendent,Casualty Medical Officer - Dr. Ramesh, Dr. Toby, Dr. Deepanjali, Dr. Subbalakshmi, Dr. Farah, Dr. Anusha,Dr. Sameer, Dr. Jayanand,Medical Records Officer, Mr. GeorgeNursing Staff - Sr. Mary Stella, Mini, Shashikala, Bincy, Honey, Teena, Monisha, Princy, Tintu, Rintu, Sumithra,Kathrine, Marcel
Victoria Hospital
Dr. Subhash G. T, Dean and DirectorDr. Tilak B. G, Medical SuperintendentDr. Shankarappa, Formerly Medical SuperintendentDr. Kantaraj J, Resident Medical OfficerDr. Riyaz Basha, Nodal OfficerCasualty Medical Officers - Dr. Rajareddy, Dr. Sankanal, Dr. Siddeshwar, Dr.B.Vishwanath, Dr. Cheluvanarayana,Dr. A.Vishwanath, Dr. Vijayashree, Dr.Thyagaraj, Dr. Shivakumar, Dr. Varalakshmi, Dr. B. Ramesh, Dr. R.Ramesh,Dr.Sathyanarayana, Dr. Pushpa, Dr. Manjula, Dr. Satish S.R., Dr. Mohankumar, Dr.Madhusudana Das,Dr. Priyadarshini, Dr. Pradeep, Dr. Rashmi, Dr. Shivanna, Dr.Shivakumar, Dr. Shailaja, Dr. Santhosh,Dr. Jagadish
Dr. Vasantha Kamat, Professor and Head, Department of MedicineDr. Shivaswamy, Professor and Head, Department of SurgeryDr. Nanjundappa, Professor and Head, Department of Orthopaedics
Employee State Insurance Model Hospital (ESI), Rajajinagar
Dr. Khokar, Medical SuperintendentDr. Padma Khokar, Dr. Malagi, Additional Medical SuperintendentsR. Kesavan, RegistrarCasualty Medical Officers -Dr. Rajeev Shetty, Dr. P. Selvakumar, Dr. Ramesh, Dr.Dhananjay S., Dr. RaghavendraB., Dr. Ravishankar M., Dr. Roopa B.N.Dr. Pankaj M.Deshmane, Dr. Prashanth B., Dr. Raghvendra G.Nursing Staff - Sri. Robinson P.M., Smt. Muttamma T.
Employee State Insurance (ESI)
Dr. Rehimmunnisa, DirectorDr.Gangadhara Swamy, Deputy Director

viii BRSIPP 2009
Chinmaya Mission Hospital
Dr. M.R. Chandrashekar, DirectorDr. A.S. Ramachandraiah, Resident Medical OfficerDr. Muralikumar, Nodal OfficerCasualty Medical Officer - Dr.A. Sathya DeviMedical Records Officer, Smt.Devaki,Staff Nurses - Shashikala, Suja, Rekha,Sony, Berly, Bincy, Geethu
Suguna Hospital
Dr. Ravindra, DirectorDr. Ranganath, Medical SuperintendentDr. Nithya A, AdministratorCasualty Medical Officer- Dr. Krishnaswamy
Vydehi institute of medical science
Dr. D. V. Chalapathy, Medical SuperintendentDr. Sandhya Belawadi, Principal and DeanDr. Sathish Kumar, Nodal OfficerDr. Jagadish, Professor and Head of Forensic Sciences
Rajarajeshwari Medical College and Hospital
Dr. Ramachandra, DirectorDr.Govindaraju K. M, Medical SuperintendentDr. Srividya V, Nodal OfficerCasualty Medical Offcier- Dr. P. LakshminarayanDepartment of Community Medicine - Dr. Shashikala M., Dr. K. JayanthkumarPublic Relation Officer-Sri. Hariharan
Columbia Asia Hospital
Dr. Suresh VaradarajuluDr. Aravind KasaragodDr. Nina Laxmikanth, Nodal OfficerDr. Ceema Sam, Dr. NischalMedical Records Supervisor, Mr. Yadunandana H.L.
Ambedkar Medical College and Hospital
Dr. S.V. Divakar, Medical SuperintendentDr. Mohd. Irshad Ahmed, Nodal Officer
Command Hospital, Airforce, Bangalore
Commandant AVM A.K. BehlSenior Registrar, Air Cmdr. R.R. NandaChief Co-ordinating Officer, Air Cmdr. A.K. PatraNodal Officer - Gp. Capt. M. ShuklaCasualty Medical Officers - Sqn. Ldr. N. Subramanyam, Wg. Cdr. A Mukherjee
MVJ Medical College and Research Hospital, Bangalore
Dr. T. Rajeshwari, Dean and DirectorDr. Mohan Rao, Executive DirectorDr. Vevai, Medical SuperintendentDr. Anjan Reddy, Chief CMO
ix
RURAL CENTERES
Siddartha Academy of Higher Education (Deemed to be University)
Dr. Shivaprasad, Director & ChancellorDr. Krishnamurthy K. A, Vice-ChancellorDr. Sudarshan H. P, RegistrarDr. Sreenivasamurthy, PrincipalDr. Ramesh Rao, Medical SuperintendentDr. Ashok J and Dr. Venkatesh, Nodal Officers and Dept of Community medicineCasulaty Medical Officers - Dr. Thimmaraju, Dr. Sreenath, Dr.MuddukrishnaProfessor & Head Dept. of Community Medicine, Dr. Rajanna M. S.
District Hospital, Tumkur
Dr. Sreedhara Murthy, District Health and Family Welfare OfficerDr. Pratap Surya, District SurgeonDr. Rangaswamy, Resident Medical Officer
Co-ordinating Centre: National Institute of Mental Health and Neuro Sciences
Dr. S. K. Shankar, Director / Vice ChancellorDr. Nagaraja D, Formerly Director / Vice ChancellorDr. B. N. Gangadhar, Medical SuperintendentDr. Sateesh V. L, Nodal Officer and Resident Medical OfficerDr. G Gururaj, Programme Coordinator
Department of EpidemiologyDr. Girish N Rao, Dr. Kavita RMr. Manjunath D. P., Mr. Girish B. G., Mr. Chandrashekara R.Mr. Basavaraju K.S, Mr. Lokesh M., Mr. Chandrashekar, Mr. Venkataramanappa, Mr. Ravichandra,Mr. Damodhara, Mr. Sombamadiah, Mr. Chandramohana, Ms. Manjula
Department of Neuro SurgeryDr. Indira Devi, Dr. Chandramouli, Dr. Sampath, and all units staff
Casualty Medical OfficersDr. Chandrashekharan, Dr. Muralidhara K., Dr. Neetha Nagaraj, Dr.Asgaribanu, Dr. Sridhara,Dr. Yashoda, Dr. Amit Acharya
Medical Records Department Mr. Pulla Reddy, Mr. Vivekappa, Mr. Nanjappachar, Mrs. Maria A.
And all other staff working in emergency rooms - medical record divisions of hospitals, Bengaluru MetropolitanTransport Corporation and in all police stations of Bengaluru city

x BRSIPP 2009
Table of Contents
Table of Contents xList of Abbreviations xiForeword xiiMessages xiii-xviiiAcknowledgements xixExecutive Summary xx
Section A: Understanding Injury & Programme descriptionA1. Introduction 2A 2. Understanding Injuries Is The Basis For Preventive Strategies 4A3. Injury In India 5A4 Injury In Karnataka 7A5. Underreporting Of Injuries 7A6. Information Requirements For Injury Prevention And Control 11A7. A Surveillance Approach 11
Bengaluru Road Safety And Injury Prevention Programme 12A8. Goals, Purpose And Objectives 12A9. Preparatory Phase (March – June 2007) 12A10. Focus Of Surveillance 13A11. Surveillance Mechanisms 13A12. Implementation Phase (June 2007 - June 2008) 17A13. Review Phase (June 2008 - December 2008) 18
Section B: Data and InformationThe City of Bengaluru 20B1. Injury deaths 21B2. Urban injuries 22B3. Rural Injuries 26B4. RTIs and suicides are major injury causes 27B5. Injuries affect young people 28B6. Injury deaths are distributed in phases 29B7. Road crashes, deaths and hospitalisations 29B8. Risk factor information 36B9. Solutions and strategies for road safety 42B10 Falls 43B11. Suicides 44B12. Burns and Fire Injuries 45B13. Poisoning 47B14. Animal Bites 47B15. Assault / Violence 49B16. Prehospital Care 50B17. Nature Of Injuries 54B18. Management And Outcome: 55
Section C: Profile of activitiesC1. Injury: Addressing the problem 57C2. Activity Profile of 2009 58Sustainability issues 64The way forward 65References 67Annexure - I 69Annexure - II 70
xi
List of Abbreviations
BRSIPP : Bengaluru Road Safety and Injury Prevetion Programme
CMO : Casualty Medical Officer
CC : Co-ordinating Centre
CCRB : City Crime Records Bureau
CDs : Communicable Diseases
ER : Emergency Room
FIR : First Information Report
HICs : High Income Countries
ICD : International Classification of Diseases
ICECI : International Classification of External Causes of Injuries
ICMR : Indian Council of Medical Research
IPC : Indian Penal Code
LMICs : Low and Middle Income Countries
MCCD : Medical Certification of Cause of Death
MLC : Medico-Legal Case
NCRB : National Crime Records Bureau
NIMHANS : National Institute of Mental Health & Neuro Sciences
NCDs : Non-Communicable Diseases
NGO : Non-Governmental Organization
OTC : Over The Counter
RMO : Resident Medical Officer
RTI : Road Traffic Injury
WHO : World Health Organization

xii BRSIPP 2009
Foreword
With increasing number of deaths and hospitalisations due to injuries inrecent years, the burden of injuries has been increasing significantly inBengaluru and other cities. The growth of Bengaluru in recent years and itstransformation as an international hub of activities has brought in hugechanges in our lives. Amidst these changes, safety on our roads, at homesand in work places has become an important issue for planners andpolicymakers. Hundreds of people are injured on our roads, at homes and in workplaces of Bengaluru everyday. There is a human face and a family behind every injury and death. The pain and agony of the sufferingfamilies goes beyond words.
Young people are becoming victims of road accidents at their formative and productive years of their life.With travel becoming an essential need for today's life, current efforts in addressing road safety are in earlystages. We need to build robust programmes based on scientific evidence to reduce this human suffering.Even though we have the knowledge and technology, our combined efforts are still far from satisfactory inaddressing this man made disaster.
I am happy to note that the Bengaluru Road safety and Injury Prevention Programme has progressedsatisfactorily in 2009. This has been possible due to the cooperation and support from all partners in theprogramme. Data for the year 2009 has once again confirmed that nearly 5,000 persons die and more than100,000 are hospitalized due to injuries every year in Bengaluru alone. From a phase of surveillance, it ismoving to the stage of programme development, and this year has seen a number of evidence and needbased activities. Road traffic injuries have seen a slight decline this year and we need to keep this momentumongoing and strong. We are aware that even with existing knowledge, there are several interventions,which, if properly implemented can save "lives and limbs".
Need for good-quality information does not require further emphasis. Robust and meaningful programmescan only be developed based on a good understanding of the current situation and identifying areas whereinterventions can be effective. Data plays a crucial role in monitoring and evaluation of activities as we goalong. A real change should be an actual decline in reduction of deaths and injuries. It is likely thatdecisions made in the absence of reliable data can only be adhoc and crisis oriented. All our programmesneeds to be sustained to make them effective in the long run.
The Bengaluru Road safety and Injury Prevention Programme has shown that it is possible to develop gooddata and lay a solid foundation for present and future activities. Political /administrative support andparticipation of institutions is crucial to develop these programmes further. I hope this collaborative programmewith involvement of hospitals, police, transport and legal sectors will make a dent in our rising injury graphand benefit the society. I wish the programme all success and strongly hope that this initiative will beconsidered in other parts of India as well.
Prof. S.K.ShankarDirector / Vice-chancellor, NIMHANS, Bengaluru.
xiii
Message
Bangalore city is known for its salubrious climate and pleasing environs. Several factors have resulted inmaking Bangalore the fastest growing metropolis in the country. This rapid pace of growth and developmenthas brought with it several challenges. Amidst the demographic and epidemiological transition, the newerchallenge is to understand the burden and impact of injuries. Studies reveal that an estimated 5,000 peopledie due to different types of injuries in Bangalore city: nearly one fifth of them due to Road traffic injuriesalone. It is indeed alarming that 20 times this number seek medical care.
The Bangalore Road Safety and Injury Prevention programme is a unique collaborative activity by NIMHANSwith Bangalore city police, 30 Hospitals, Transport department and NGO's. I am very happy to note thatactivities have been going on systematically for the last two years. On the occasion of 2nd stake holder'smeeting, I would like to compliment and congratulate all the partners in the initiative. On behalf of theGovernment of Karnataka, I would like to assure of the fullest and complete co-operation to undertakefocused and specific interventions in the city for preventing deaths and injures. I am sure the Bangaloremodel of injury surveillance would be replicable across not just our state of Karnataka but across the entirecountry.
(Dr. V.S. Acharya)
Dated: 22-02-2010

xiv BRSIPP 2009
MESSAGE
During the last two to three decades, India is going through a process of rapid motorisation. Bangalore citywith its 251akh two-wheeler population, contributing to nearly three-fourths of the total vehicular load, isthe highest compared to any other city in India. It is thus imperative that we need to make the roads safeparticularly to the Vulnerable Road Users. It is rather unfortunate that nearly 1000 people die due to roadtraffic injuries in Bangalore and majority are either pedestrians or two wheeler users. Thousands more areinjured and become disabled.
A key solution to this human made disaster is making the public transportation systems more robust andreliable. The transport department and the public sector transport corporations in Karnataka have launchednew initiatives in this regard. While we try to enhance and improve services there is a need to understandand evaluate the impact of these measures. I am extremely happy that Bangalore Road safety and Injuryprevention programme is bringing out the report for the year 2009. I am sure the suggestions andrecommendations of the data analysed from hospitals, police and BMTC will be very resourceful.
I would also like to take this occasion, when all the partners of the Bangalore Road Safety and Injurysurveillance programme are meeting, to convey my heartiest compliments for being involved in this veryimportant issue in the city of Bangalore. I am sure the daylong deliberations would be highly productiveand useful to plan and implement innovative solutions.
(R. Ashoka)
R. ASHOKA
Minister for TransportNo: Tm/O/Sms/136/2010
Telephone: Off:22253835 22033234
Room No. 317, 3rd FloorVidhana Soudha,
Bangalore
Dated: 26-02-2010
xv
MESSAGE
Over the last few decades there have been fundamental changes in diseasepatterns among the people of Member States of the WHO South-East AsiaRegion due to rapid urbanization and economic growth. The pattern ofmortality and morbidity with regards to communicable and noncommunicablediseases has changed. From being largely linked to infectious diseases earlier,it is now mainly related to noncommunicable diseases as well as injuries andviolence. Road traffic injuries have emerged as one of the leading causes ofdeath and disability in most countries of the Region.
World Health Organization estimates predict that road traffic injury will increase from being the ninthleading cause of death globally in 2004 to be the fifth leading cause of death by 2030.
Road traffic injuries are one of the fastest growing epidemics in the South-East Asia Region, and more than285 000 people are dying on the roads every year. The trend in road traffic deaths has also been on anupward spiral in recent years. Most of those killed on the roads in accidents are young and aged between 15and 44 years, thus corresponding to the most economically productive segment of the population. Hence,road traffic injuries lead to a colossal economic burden at both the family and community levels on MemberStates of the Region.
Almost three quarters of all road traffic deaths in South-East Asia occur among the most vulnerable roadusers, i.e., pedestrians, motorcyclists and cyclists. The rapid growth of motorized two-wheelers in theRegion is a major risk factor in road traffic injuries. These two critical issues should be prioritized duringpolicy decisions on road safety.
Although primary prevention is a far better option to address the huge toll from road traffic injuries thanother measures, only a few Member States in the Region have specific preventive measures on road trafficinjuries in place. Measures that will reduce injuries and contribute to a healthier future may include appropriateland use planning, setting safety standards for vehicles, designing infrastructure keeping the protection ofpedestrians and motorcyclists in mind, promoting safe public transport, and campaigning for the improvementof personal behaviour on roads. To realize this goal and implement these measures it is imperative todevelop and sustain strong intersectoral partnerships and collaboration.
To meet the challenge of the rapidly growing road traffic injuries, The WHO South East Asia RegionalOffice has supported trainings in injury surveillance, injury epidemiology, prevention and care, and roadsafety planning. This meeting is a very important effort to strengthen our workforce against RTI. Themeeting should focus on actions , based on data collected from different sources.
I look forward to the outcome of this meeting and assure you that WHO will continue assistance andcollaboration.
Dr Chamaiparn SantikarnRegional Advisor, Disability,
Injury Prevention and Rehabilitation, WHO/SEARO

xvi BRSIPP 2009
MESSAGE
Urbanisation, motorisation, industrialisation, infrastructure development arebecoming hallmarks of our growth and development in recent years. Indiancities are growing in a fast and unplanned manner and this is having a majorimpact on people' lives. Bengaluru city is no exception to this change andvisible changes are occurring all around us. Amidst these changes, safety ofpeople has become an important issue for planners and policymakers. In allour cities and in rural areas, road traffic accidents, stress related suicides and other injuries have become amajor public health problem and has been a matter of concern for all. Hundreds of people are killed andinjured on our roads, at homes and in workplaces of our cities on a daily basis. This human tragedy needsto be addressed by all stakeholders in growth and development, on a regular and continuous basis.
Unfortunately, in majority of the cases, young people in their formative and productive years of life are thevictims. The untimely death or hospitalisation of young people brings huge suffering to their families.Majority of these injuries can be prevented, if we aim at developing a proper understanding of injury profilesand patterns in our society, we need to address gaps in our information systems, develop mechanisms forprevention, trauma care and rehabilitation along with building robust policies and programmes for future.All concerned departments of police, transport, urban and rural development, health, law, information andbroadcasting, and others need to develop joint and coordinated mechanisms to address the problem.
I am happy to note that the Bengaluru Road safety and Injury Prevention Programme initiated in 2008 hasbeen working towards road safety and injury prevention on a scientific and systematic approach with allpartners in the city. Bruhat Bengaluru Mahanagara Palike is the central agency for all development andinfrastructure activities in the city and needs to include safety of people on roads, at homes, in schools andin work places.
The 2009 and 2010 programme reports, fact sheets, public health alerts, and strategy documents preparedfor the programme will help BBMP, Police, Transport, Urban Development and other city agencies to givedue importance for road safety and injury prevention initiatives. We are making efforts to give importancefor safety in all our activities.
The Bengaluru Road Safety and Injury Prevention Programme has shown that it is possible to develop gooddata and provide scientific basis for robust current and future interventions. I strongly hope that thiscollaborative programme with involvement of BBMP, police, transport, all major hospitals and other partnerswill be able to develop scientific and systematic road safety and injury prevention programmes to save ouryoung people. I take this opportunity to wish the programme all success and will be happy to extend allpossible support in its future activities.
Govinda Raju K H(IAS, Special Commissioner), BBMP, Bangalore.
xvii
MESSAGE
India and China have the largest number of deaths and injuries related to
road traffic accidents. More than 1,00,000 people die and 10,00,000 lget
injured on the roads every year in India. Unfortunately these incidents have
not attracted adequate amount of attention from policy makers and
enforcement agencies. Every time a person is dead or injured it leaves behind
pain and sufferings for the entire family. Unabated vehicular growth,
infrastructure enhancement and changing life styles have aggravated matters for the worse. Majority of
these deaths and injuries are preventable, if, road safety is given due importance in all our policies and
programmes. Also, the policies and programmes have to be based on scientifically collected data, evidence
and research.
Bangalore Road Safety and injury prevention programme initiated in 2008 an example of fruitful cooperation
between traffic police and medical fraternity.
This programme has two important elements; firstly, it uses information and data to plan and develop
activities. Secondly, it works with all stakeholders to develop and support interventions of all partners.
Bengaluru City Traffic Police are a major partner in this programme, by facilitating information development
and using information in all our activities. Year 2009 and 2010 programme reports, fact sheets, public
health alerts and strategy documents will help Police, Transport, Urban Development and other city agencies
to give importance for road safety and injury prevention. Fatalities on roads in Bangalore City have seen a
significant decline in past two years and we need to continue with this to reduce them further. A welcome
development would be a similar decline in number of injuries, primarily due to our interventions.
The Bangalore Road Safety and injury Prevention Programme has shown that it is possible to develop good
data and lay a good foundation for present and future activities. Despite limitations in resources and
manpower, we are giving major importance for road safety in both B-Trac 2010 and all other activities.
I hope this collaborative programme with involvement of traffic police and all major hospitals and other
stake holders will be able to develop scientific and systematic road safety and injury prevention programmes
to save young lives in the years to come. I also wish that similar programmes come up in other parts of
India. I wish the programme all success and will be happy to extend all possible support for the programme.
Mr. Praveen Sood, IPS,Addl. Commissioner of Police,
Traffic Bangalore City
xviii BRSIPP 2009
MESSAGE
At the outset, I extend my warm greetings and it gives me great pleasure to share my views in the Road
safety and Injury Surveillance Report being brought out by NIMHANS.
An efficient transport system is the first step in the direction of building a stable and secure State contributing
towards economic and cultural ties. Roads and Transport System not only binds people but also plays a
crucial role in nation building process.
Road safety is a process and transport department is a major partner in this process. The transport department
is building driving tracks in all its regional transport offices to ensure objectivity in testing driving licence
aspirants.
The Transport Department aims to establish the following:
� Institute of Drivers Training & Research (IDTR) to impart scientific training especially to drivers
transporting hazardous goods to ensure Road Safety.
� Automated vehicle testing centre for issue of fitness certificate to vehicles.
� Electronic driving track for stringent testing before issue of driving licences.
� Networking of emission testing centres to monitor air and noise pollution for cleaner and greener
environment.
These developments would yield the desired results if civil infrastructure, like wide Roads, multi-lane roads
with dividers, safe pedestrian crosses & improvement in public transport are also brought about by other
departments. We in the department, place road safety high on our agenda and wish to undertake all activities
for saving lives and prevent injuries.
We extend our whole hearted co-operation to the Bangalore Road safety and Injury Prevention Programme,
initiated by NIMHANS along with all other partners.
Bhaskar Rao, IPS,Commissioner for Transport & Road Safety,
Government of Karnataka

xix
Acknowledgements
The Bengaluru Road Safety and Injury Prevention Programme is a large collaborative and partnership
programme with the participation of Bengaluru city police, 30 leading hospitals, Bengaluru Metropolitan
Transport Corporation, Bruhat Bengaluru Mahanagara Palike and NGO's. Nearly 500 people from all these
organisations have taken keen interest and participated in several activities during 2008 and 2009. Listing
all individual names will run into several pages, but we would like to place our immense gratitude to all for
building this partnership programme. Specially, thanks to all heads of institutions and nodal officers for
taking leadership role in their respective organisations.
Thanks to Prof. D. Nagaraja, Former Director / Vice Chancellor and Prof.S.K.Shankar, Director/Vice
Chancellor of NIMHANS for extending all support and encouragement along with taking keen interest in
the programme.
Sincere thanks to World Health Organisation, India country office and Indian Council of Medical Research
(Department of Health Research, Ministry of Health and family welfare, Government of India) for facilitating
Phase 1 of the programme. We are thankful to Dr. Bela Shah, Deputy Director General, Indian Council of
Medical research and Dr. J S. Thakur, Cluster focal person for NCDs in WHO, India office, for all help and
support in developing the programme. Our sincere thanks to Dr.Margie Peden, Coordinator, Department of
Violence and Injury Prevention, World Health organisation, Geneva, and, Dr. Ann Dellinger of the
Epidemiology Division of Centre for Disease Control and prevention, Atlanta, USA for all support and
encouragement.
We are immensely thankful to Sri. Sanjay Sahay, IGP, State Crime Records Bureau, Sri. Shankar Bidari,
Commissioner of Police; Sri Praveen Sood and Sri. M.R. Pujar - Additional Commissioners of Police,
Sri. Bhaskar Rao - Commissioner for Transport ; Sri Govinda Raju, Special Commissioner of BBMP; Sri.
Zameer pasha, Managing Director of BMTC for all help and support. We thank all their staff for taking
keen interest in all activities under the programme.
Special thanks to all our field coordinators (Sri. Manjunath and Sri. Lokesh) and all our field research
officers spending tireless hours in police stations and casualty departments of hospitals in facilitating data
collection. Sincere thanks to my colleagues Dr. Girish N Rao and Dr. G. Kavita Rajesh for all help from the
beginning of the programme. Thanks to Sri. Girish BG and Sri.Chandrashekar for efficient data management
and analysis.
xx BRSIPP 2009
Executive Summary
The city of Bengaluru has changed phenomenally during the last decade. The "peaceful and cosy Bengaluru"
of 90's has changed to a "Bruhat Bengaluru" in 2010, embracing a population of more than 8 million into
its day to day activities. As a senior citizen remarked "the city is a living testimony to what technological
and socioeconomic changes can make for a one time peaceful city". The city takes pride in many positive
developments of education, information technology, raising living standards, vibrancy and hope for millions.
At the same time, the dark side of this growth and development are also serious issues for city planners and
administrators.
With marginal and gradual decline of communicable and infectious diseases, injuries, hitherto, referred to
as accidents, have emerged as a major public health problem in the country. Injuries have only moved from
fifth or third pages of our newspapers to the front page. All television channels continuously beam episode
after episode of violence and injury throughout the day; most of the times, the "Breaking news" is nothing
but deaths and injuries among people. Even though there is regular public outrage on these issues, injuries
are only increasing day after day. Commonly, these are considered as accidents, events due to bad times, or
simply act of fate. High Income Countries (HICs) of the world had similar understanding of injuries and
were doing, what we are doing today in 1960’s and 70’s. Research, knowledge, evidence and data changed
this understanding and resulted in significant changes in the way problems were addressed. Today, it is well
acknowledged that injuries are predictable and preventable.
This knowledge and information came from years of research that resulted in a better understanding of
injury phenomenon in terms of burden, characteristics, causes, risk factors, determinants, impact and
outcome. Surveillance is one such activity that will help in recognizing the burden of injuries, identifying
broad risk factors and causes, prioritizing activities, monitoring and evaluating interventions, capacity
development, and stimulating further research. Even though India has considerable experience in
Communicable Disease (CD) surveillance, Injury and Road Traffic Injury surveillance are new and its
importance is only recently gaining recognition.
Bengaluru Road Safety and Injury Prevention Programme is a collaborative programme between National
Institute of Mental Health & Neuro Sciences, Bengaluru City Police, 30 leading health care institutions,
Bengaluru Metropolitan Transport Corporation, Bruhat Bengaluru Mahanagara Palike and was facilitated
by Indian Council of Medical Research and WHO, India office in 2008. The programme aims at reducing /
preventing injuries, improving trauma care and strengthening rehabilitation services using a surveillance
approach.
The programme started in 2008 began on a surveillance basis, and has become an ongoing and a continuous
activity. In 2008, the major focus was on developing systematic mechanisms for uniform and standardised
xxi
data collection from all partner institutions. This phase streamlined number of discrepancies and a systematic
approach was developed. Surveillance was developed with available resources and within existing systems
along with appropriate strengthening at different levels.
Information gathered during 2009 reveals that - nearly 4,500 individuals died and more than 100,000 were
hospitalised due to an injury in the city. Majority of those killed and injured were in younger age groups of
16 to 45 years and predominantly men. Road traffic injuries and suicides are two major injury problems in
the city of Bengaluru. Pedestrians, two wheeler riders and pillions, and pedal cyclists were involved in
greater numbers. Suicides were commonly due to consumption of organophosphorus compounds and drugs,
occurring at a time when the person was alone and at home. Burns, poisoning, falls were other major
injuries responsible for deaths and hospitalisations. Trauma care was found to be inadequate and poor
requiring immediate strengthening.
In 2009, the major emphasis was on application and utilisation of data to develop programmes, and to
provide inputs for policies and programmes. Systematic applications of data can always make a difference
to strengthen activities. Number of inputs has been provided for regulatory, engineering, educational and
other activities during 2009. Discussions with policymakers and professionals have indicated that the data
developed will be useful to develop new activities as well as monitor existing programmes.
It is hoped that 2010 will see a combination of data gathering and data application and also development
of focussed activities. Plans are already afoot in this direction. Using surveillance as the first level of
activity, additional research activities such as trauma registries, risk factors studies, and multidisciplinary
crash and injury investigations are being considered. Capacity development of all sectors related to road
safety and injury prevention along with other focussed interventions are planned for 2010 and the coming
years. Injury/RTI surveillance data will be a useful tool in the prioritisation process, resource allocation,
and monitoring ongoing activities. There are several opportunities to develop and use data to develop
scientific programmes for injury prevention and control. It is hoped that this experience and learning will
help professionals across the country to initiate activities for road safety and injury prevention on a scientific
basis using evidence based approaches. Recognition of the problem, administrative support, training of
personnel, monitoring and regular feedback, availability of resources and, most importantly, cooperation
of all partners will be the building blocks for our future activities.
Preventing road crashes, suicides and other injuries requires a "proactive approach" rather than a "reactive
approach". It requires action to be taken by police, transport, health, urban - rural development, land
development authorities, product and vehicle manufacturers, civic authorities, NGOs, public, media and
others to see that these injuries do not occur; even if it occurs, it should not lead to deaths and disabilities.
Information - data - and evidence is a powerful tool in this process to bring people together for collective
actions.

1
Section AUnderstanding Injury & Programme description
Bengaluru Road Safety and Injury Prevention Programme is a collaborative
programme between 30 hospitals, Bengaluru City Police, Bengaluru
Metropolitan Transport Corporation, Bruhat Bengaluru Mahanagara Palike
and was facilitated by Indian Council of Medical Research and WHO, India
office in 2008. The programme is coordinated by the WHO Collaborating
Centre and the department of Epidemiology at NIMHANS. The programme
aims at reducing / preventing road traffic injuries, suicides and other
injuries, improving trauma care and strengthening rehabilitation services
using a surveillance approach.

2 BRSIPP 2009
The “Incredible India” is on the move and changingat a fast pace. In recent years, we have witnessed anincrease in motorization, industrialization,migration, urbanization and feeling the impact ofoverall globalisation. The influence of print andvisual media is also much larger today, comparedto the past. Consequently, our life styles along withhabits and value systems are changing fast.
This change has seen a decline of somecommunicable diseases, while Noncommunicablediseases and injuries are on the increase. In thischanging scenario, Injury and violence is a leadingcause of death and disability. This change is palpableacross the country and Bengaluru is no exception tothis change.
Everyday, we read, listen or witness, injuries in ourday to day lives. Over time, it has moved from 5th to3rd to 1st page of our newspapers. Some days, it isnot uncommon to see the entire page of ournewspapers filled with news about injury andviolence. On television channels, even on prime time,injury and violence has occupied the centre stage.Many times, the “Breaking News” is only deaths dueto road crashes, suicides, mass burns and bloodloaded violence. It has become common to see bloodand broken limbs on our roads, at homes or in workplaces. No single day passes in our lives withoutinjuries making a direct or indirect appearance.
Naturally so, because, Injuries are common and affectall people, more so the productive age groups andsections of our society. Road traffic injuries, falls,burns, poisoning, occupational / work relatedinjuries, suicides, violence / assault and animal bitesare all common injuries. Individuals in 5-44 yearsand men are affected most. Greater vulnerability isseen among people in middle and lower incomestrata of society and injuries make them poorerfurther due to its economic impact and lack of accessto quality care. The maximum brunt of injuries isfelt by the health sector as it has to provide care foraffected individuals and families. As India is yet torecognise injury and violence as a public healthproblem, there are no visible policies andprogrammes to effectively address this problem. Injuryprevention and control in India is publicly glaring,
A1. Introductionpolitically invisible and professionally missing.
It is only recently, injuries are acknowledged as amajor killer in our society, more through mediaand occasionally (now becoming frequent) inprofessional circles. Systematic and scientific effortsin injury prevention and control are yet to begin.Among several injuries, Road traffic Injuries (RTIs)and suicides have been recognised as major injuryproblems. As injuries are linked to number ofsociocultural issues and happen at individual andfamily level, they are treated as individual issues.As police and judiciary are involved, they areconsidered as police and legal problems. Sinceeveryone uses roads and vehicles, they have becomeroad and transport problems. With its relation toinfrastructure development and expansion, they areurban problems. Despite the health sector bearingthe maximum impact due to policies andprogrammes of other sectors, they are still notconsidered as public health problems.
While injuries have declined in many developed partsof the world, it has been steadily rising in India. Theneed to adopt and suitably modify lessons from HICsis crucial for injury prevention and control in India toavoid repetition of mistakes and to make appropriatedecisions by recognition of principles. The last fourdecades of research and policy developments acrossthe world have shown that injuries are predictable,preventable, and needs a systems approach. Due tonon-recognition of the problem and absence ofcoordinated, integrated and intersectoral approaches,injury prevention and control is at cross roads andwithout direction in India.
Recognition of the problem requires good quality,reliable and representative information; and this isvital to formulate injury prevention programmes. Injuryprevention and control should be evidence based anddata driven. However, in India, comprehensiveinformation is often lacking or, at best, patchy. Thoughpolice data on injuries are available to a limitedextent, health sector information has been totallymissing. Further, even the collected information isnot systematically and scientifically analysed todevelop a better understanding of injury pattern,profile and determinants. The available data are not

3
aptly utilized in policy and programme development.Nevertheless, the scenario has begun to change andtime is appropriate to give a major push and directionfor this area.
There have been several initiatives at different levelsin India to address the growing problem, and someof this is happening in the area of road safety.International and national developments have pavedthe way for this change. The World report on RoadTraffic Injury Prevention (1), World report onViolence & Health (2) and few national reports(3, 4, 5) have brought to light a number of activitiesto be undertaken for control of injuries. Road Trafficinjury surveillance initiatives in 2007 / 08 in selectcities of India on a pilot basis by the Indian Councilof Medical Research (6), activities in suicide andviolence prevention, an active judiciary and NGOnetwork, report of the National Commission onFarmers (http://krishakayog.gov.in/) and Preventionof Domestic Violence Act (http://ncw.nic.in/DomesticViolenceBill2005.pdf) are some examples.Although road safety has been acknowledged as animportant issue in many states and cities, other safetyissues like home safety, work safety, safety aspectsat public places etc. have not been given dueimportance and also need to be addressed.
With this in view, the present Bengaluru Road safetyand Injury Prevention programme was initiated in2008 to develop systematic activities in prevention,trauma care and rehabilitation programme for RTIsand other injuries based on data and evidence.
A 1.1 Injuries are biomechanical innature and not accidents
Historically, injuries have always been referred to asaccidents and the term “accident” implies theinevitable nature of the event and connotes thatnothing can be done about it. ‘Injury’ by definitionmeans that there is a body lesion due to an externalcause, either intentional or unintentional, resultingfrom a sudden exposure to energy (mechanical,electrical, thermal, chemical or radiant) generatedby agent - host and environmental interaction (9).When this generated energy is transferred and exceedsthe physiological tolerance of an individual it leadsto tissue damage. Apart from this, injury can alsooccur due to the sudden withdrawal of a vital
requirement of the body like oxygen in case ofdrowning, asphyxiation etc. In short, injury is thedamage caused to the body due to a rapid and suddenexposure to energy beyond his / her tolerance levels.It is an acute event, occurs in varying severities andwith chances of repeated occurrence. Prevention ofinjuries is possible by acting on one or all three areasof this interaction and thus can be modified,predicted, and prevented.
A 1.2 Injuries can be classifiedFirstly, injuries are classified as intentional,unintentional and undetermined injuries, based onintent of injury occurrence. Unintentional injuriesare also referred to as accidental injuries though notreally accidental in nature, while intentional injuriesare self-inflicted or caused by others. The latterinclude suicides, homicides, injuries due to violenceagainst women, children and elderly, those due towars, riots and conflicts, etc.,
A second common method of classifying injuries isaccording to the mechanism which caused the injury,like road traffic crashes, poisoning, falls, fires/burns,drowning, fall of external objects and others.
A third method of classifying injuries is according toplace of occurrence like road injuries, home injuries,sports injuries and work related injuries based onplace of occurrence of injury.
The fourth method is based on anatomical types andlocation of injuries depending on body organs injuredlike head injuries, facial injuries, injury to long bonesetc. The nature and type of injuries are documentedas fractures, contusions, haemorrhage for care andmanagement.
International Classification of Diseases (11) andInternational Classification of External Causes of Injuries(12) are commonly used for systematic and scientificclassification of injuries all over the world. A particularclassification chosen is primarily determined by thepurpose of a (or more) programme(s), research focusand availability of resources. Commonly, the first threemethods (viz., intent, mechanism, and place) arepreferred for prevention, as changes can be made inproducts and environment, and injury occurrence canbe prevented for future.

4 BRSIPP 2009
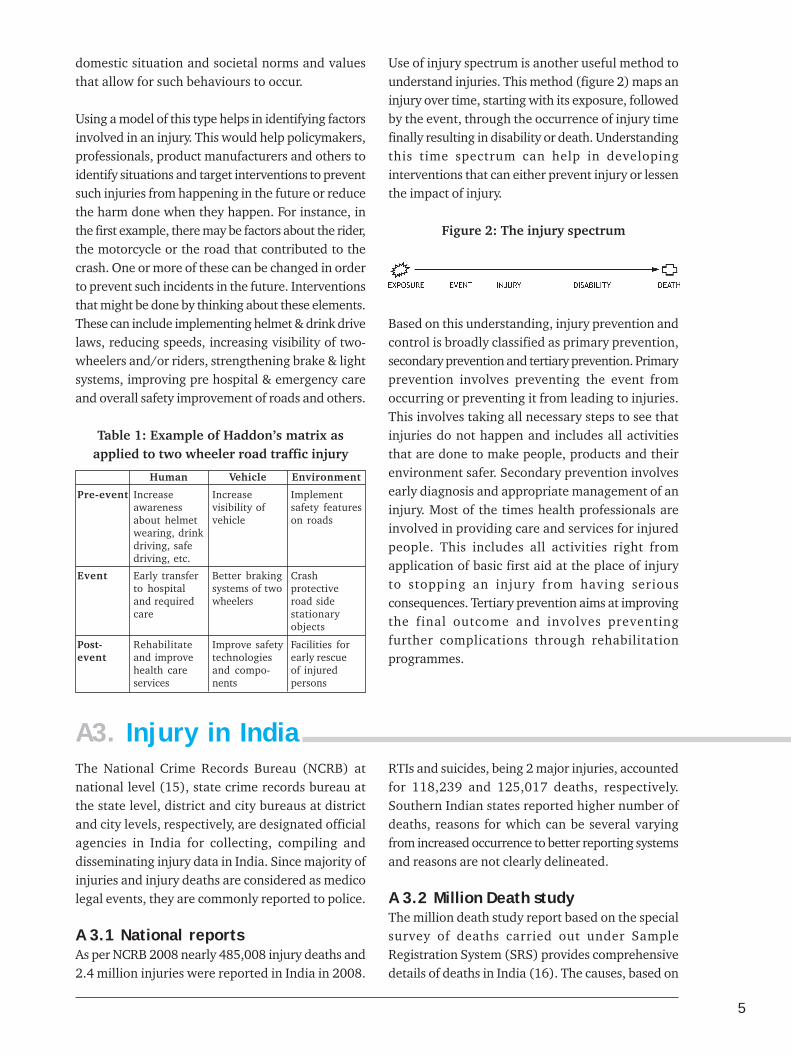
Historically, in 1970, William Haddon Jr., proposeda matrix for consideration of all factors involved ininjury causation at different time periods and atvarious levels (13). This involved identifying whatcan be done for people, products and the environmentbefore injury, during an injury and after its occurrence(Table 1). This concept has revolutionized injuryprevention since 1970s all over the world, and canbe used to analyze any type of injury, identifyinterventions that might prevent such an event fromhappening again or reducing the harm done.
Injuries occur due to a combination of agent, host,vector and environment factors. The epidemiologicaltriad of agent, host and environment has been usedin our understanding of communicable diseasesearlier, and injuries too have similar dimensions likeany other public health problem. There is a clearneed to understand injury mechanisms to developintervention programmes.
A2. Understanding injuries is the basis forpreventive strategies
HOSTRider
VECTORMotorcycle
AGENTCollision (mechanical
force or energy)
ENVIRONMENTSlippery roadway
Ref.: 14
Some of the professional concerns that have been raised about lay beliefs in the field of modern injurycontrol have not held up to scientific scrutiny. One example has to do with the word “accident”. For thelast few decades of the twentieth century, national and international safety advocates lamented the public’spersistent use of that term.The magnitude of the automotive injury problem in the pediatric population remains as great as it islargely because of the perpetuation of a societal ethic that automotive injuries are accidents. The wordaccident suggests that the injury event was determined by fate and, therefore, was unpredictable andunavoidable [Rosenberg, Rodriguez, & Chobra 1990, p.1086].The most important reason for this delay in the use of science to control injuries, and one which persiststo some degree even today, is the sense of fatalism towards trauma. Injuries are still called accidents….[Rivara, 2001, p.3].
The term accident has been banned by the U.S. National Highway Traffic Safety Administration(National Highway Traffic safety Administration, 1997), as well as the British Medical Journal (Davis
& Pless, 2001). At meetings of injury control professionals, audiences have been known to hiss, if aninvited speaker from another field inadvertently included the word in his or her remarks. In 1996, I
addressed this issue by fielding a national random-digit-dialled telephone survey that assessed adult ininterpretation of the word accident.Eighty-three percent of respondents associated preventability with
the term (Girasek, 1999). Scores of studies have now established that most adults believe a majority ofaccidents and injuries are preventable (Chiappone & Kroes, 1979; Colver, Hutchinson, & Judson, 1982;
Duan, 2004; Green, 1997; Hooper, Coggan, & Adams, 2003; Hu, Wesson, Parkin, & Rootman, 1996;Roberts, Smith, & Bryce, 1995).
Reproduced from 10.
Figure 1: Epidemiological model of an injurycaused by a motorcycle collision
Table 1 shows the case of an injury to a motorcyclerider involved in a motorcycle collision. Here, thehost is the rider, vector is a motorcycle, agent is themechanical force or energy and environment is theroad. Similarly, in an act of interpersonal domesticviolence in which a man causes injury to his wife,the host is the injured person, the agent is the energy(physical assault), the vector is also the personinflicting injury and, the environment include
5
domestic situation and societal norms and valuesthat allow for such behaviours to occur.
Using a model of this type helps in identifying factorsinvolved in an injury. This would help policymakers,professionals, product manufacturers and others toidentify situations and target interventions to preventsuch injuries from happening in the future or reducethe harm done when they happen. For instance, inthe first example, there may be factors about the rider,the motorcycle or the road that contributed to thecrash. One or more of these can be changed in orderto prevent such incidents in the future. Interventionsthat might be done by thinking about these elements.These can include implementing helmet & drink drivelaws, reducing speeds, increasing visibility of two-wheelers and/or riders, strengthening brake & lightsystems, improving pre hospital & emergency careand overall safety improvement of roads and others.
Table 1: Example of Haddon’s matrix asapplied to two wheeler road traffic injury
Human Vehicle Environment
Pre-event Increaseawarenessabout helmetwearing, drinkdriving, safedriving, etc.
Increasevisibility ofvehicle
Implementsafety featureson roads
Event Early transferto hospitaland requiredcare
Better brakingsystems of twowheelers
Crashprotectiveroad sidestationaryobjects
Post-event
Rehabilitateand improvehealth careservices
Improve safetytechnologiesand compo-nents
Facilities forearly rescueof injuredpersons
Use of injury spectrum is another useful method tounderstand injuries. This method (figure 2) maps aninjury over time, starting with its exposure, followedby the event, through the occurrence of injury timefinally resulting in disability or death. Understandingthis time spectrum can help in developinginterventions that can either prevent injury or lessenthe impact of injury.
Figure 2: The injury spectrum
Based on this understanding, injury prevention andcontrol is broadly classified as primary prevention,secondary prevention and tertiary prevention. Primaryprevention involves preventing the event fromoccurring or preventing it from leading to injuries.This involves taking all necessary steps to see thatinjuries do not happen and includes all activitiesthat are done to make people, products and theirenvironment safer. Secondary prevention involvesearly diagnosis and appropriate management of aninjury. Most of the times health professionals areinvolved in providing care and services for injuredpeople. This includes all activities right fromapplication of basic first aid at the place of injuryto stopping an injury from having seriousconsequences. Tertiary prevention aims at improvingthe final outcome and involves preventingfurther complications through rehabilitationprogrammes.
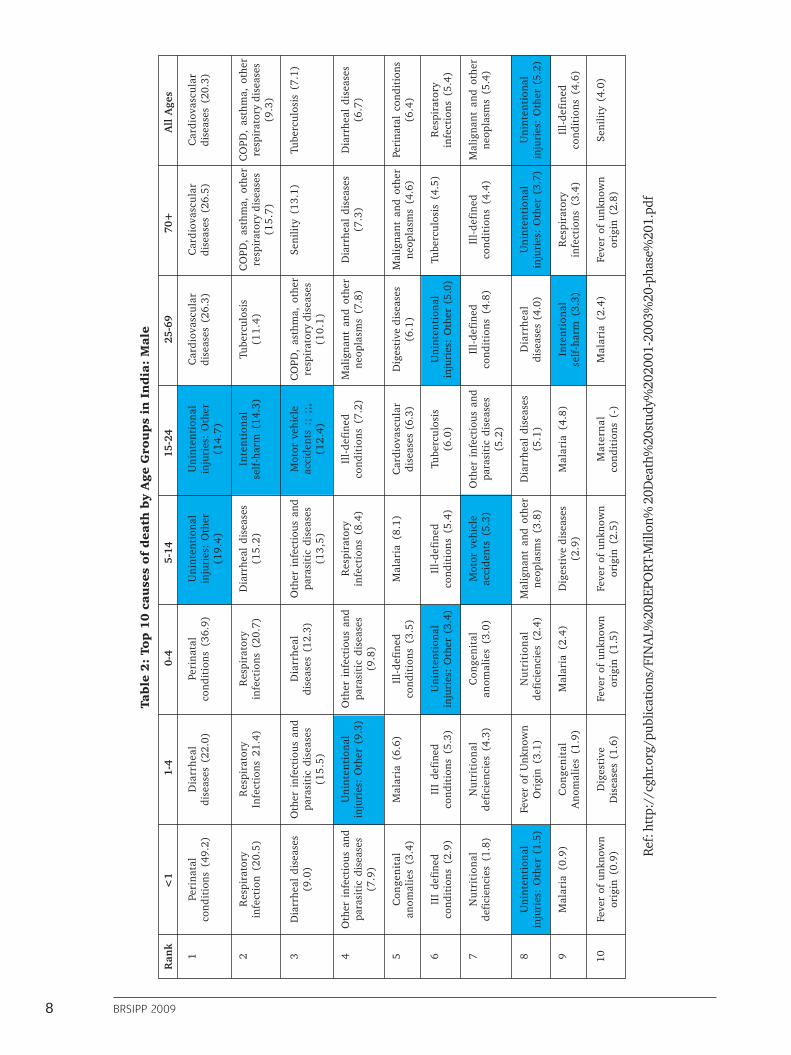
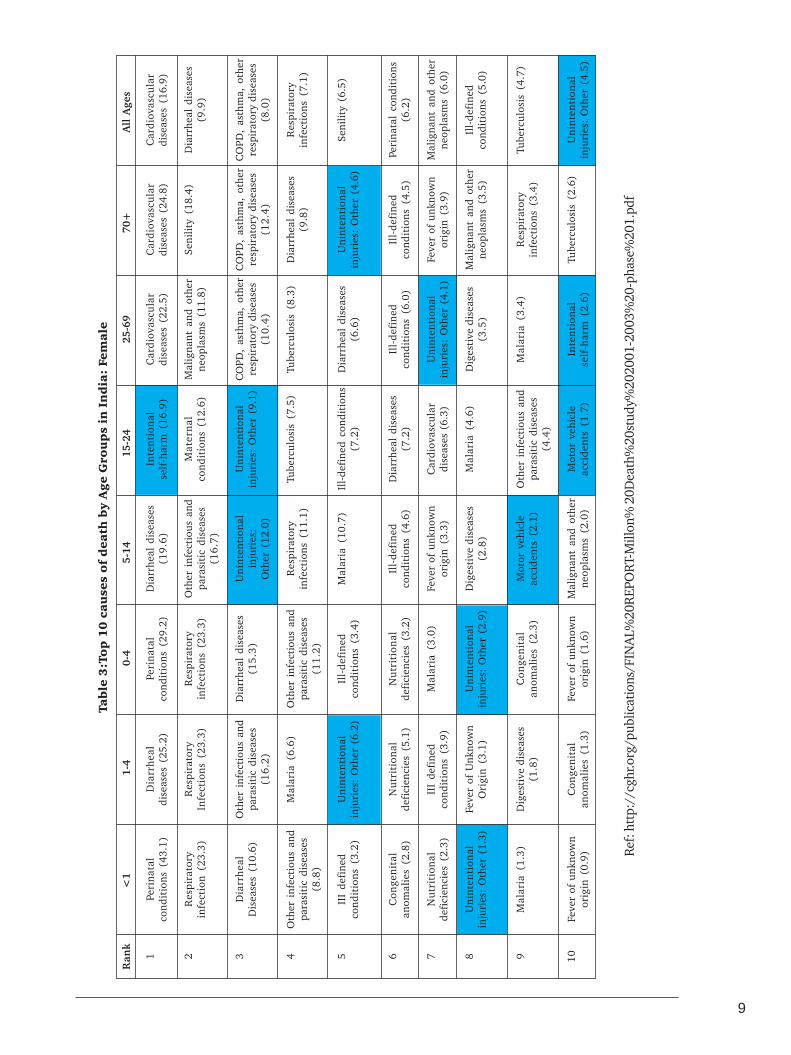
A3. Injury in IndiaThe National Crime Records Bureau (NCRB) atnational level (15), state crime records bureau atthe state level, district and city bureaus at districtand city levels, respectively, are designated officialagencies in India for collecting, compiling anddisseminating injury data in India. Since majority ofinjuries and injury deaths are considered as medicolegal events, they are commonly reported to police.
A 3.1 National reportsAs per NCRB 2008 nearly 485,008 injury deaths and2.4 million injuries were reported in India in 2008.
RTIs and suicides, being 2 major injuries, accountedfor 118,239 and 125,017 deaths, respectively.Southern Indian states reported higher number ofdeaths, reasons for which can be several varyingfrom increased occurrence to better reporting systemsand reasons are not clearly delineated.
A 3.2 Million Death studyThe million death study report based on the specialsurvey of deaths carried out under SampleRegistration System (SRS) provides comprehensivedetails of deaths in India (16). The causes, based on
6 BRSIPP 2009
State RateGoa 20.3Haryana 19.6Tamil Nadu 19.2Andhra Pradesh 17.2Karnataka 15.3Chandigarh 13.6Chhattisgarh 13.6Sikkim 13.2Rajasthan 12.9Delhi 12.2Himachal Pradesh 12.1Maharashtra 12.1Kerala 11.5Gujarat 11.3Uttaranchal 11.2
State RateMadhya Pradesh 10.8Arunachal Pradesh 10.4Mizoram 8.0Jammu & Kashmir 7.8Orissa 7.8Punjab 7.7Uttar Pradesh 6.3Tripura 6.3Meghalaya 5.8Assam 5.7West Bengal 5.4Nagaland 5.3Jharkhand 5.2Manipur 5.0Bihar 3.7
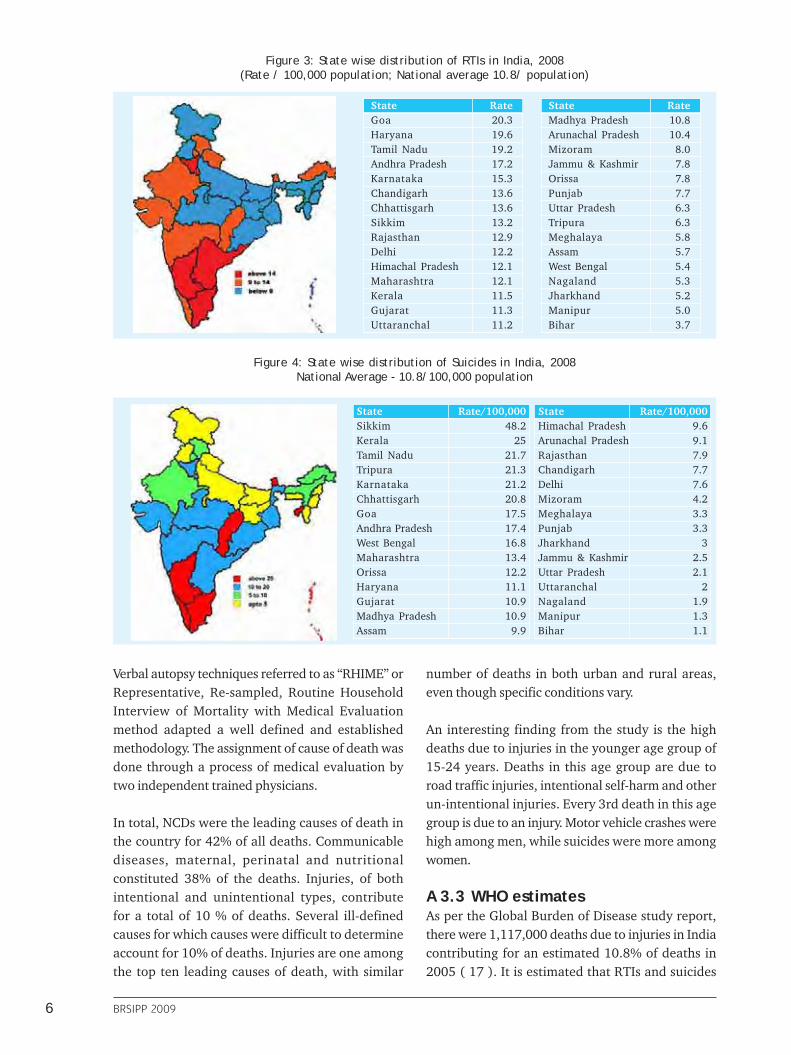
Figure 3: State wise distribution of RTIs in India, 2008(Rate / 100,000 population; National average 10.8/ population)
Figure 4: State wise distribution of Suicides in India, 2008National Average - 10.8/100,000 population
State Rate/100,000Sikkim 48.2Kerala 25Tamil Nadu 21.7Tripura 21.3Karnataka 21.2Chhattisgarh 20.8Goa 17.5Andhra Pradesh 17.4West Bengal 16.8Maharashtra 13.4Orissa 12.2Haryana 11.1Gujarat 10.9Madhya Pradesh 10.9Assam 9.9
State Rate/100,000Himachal Pradesh 9.6Arunachal Pradesh 9.1Rajasthan 7.9Chandigarh 7.7Delhi 7.6Mizoram 4.2Meghalaya 3.3Punjab 3.3Jharkhand 3Jammu & Kashmir 2.5Uttar Pradesh 2.1Uttaranchal 2Nagaland 1.9Manipur 1.3Bihar 1.1
Verbal autopsy techniques referred to as “RHIME” orRepresentative, Re-sampled, Routine HouseholdInterview of Mortality with Medical Evaluationmethod adapted a well defined and establishedmethodology. The assignment of cause of death wasdone through a process of medical evaluation bytwo independent trained physicians.
In total, NCDs were the leading causes of death inthe country for 42% of all deaths. Communicablediseases, maternal, perinatal and nutritionalconstituted 38% of the deaths. Injuries, of bothintentional and unintentional types, contributefor a total of 10 % of deaths. Several ill-definedcauses for which causes were difficult to determineaccount for 10% of deaths. Injuries are one amongthe top ten leading causes of death, with similar
number of deaths in both urban and rural areas,even though specific conditions vary.
An interesting finding from the study is the highdeaths due to injuries in the younger age group of15-24 years. Deaths in this age group are due toroad traffic injuries, intentional self-harm and otherun-intentional injuries. Every 3rd death in this agegroup is due to an injury. Motor vehicle crashes werehigh among men, while suicides were more amongwomen.
A 3.3 WHO estimatesAs per the Global Burden of Disease study report,there were 1,117,000 deaths due to injuries in Indiacontributing for an estimated 10.8% of deaths in2005 ( 17 ). It is estimated that RTIs and suicides

7
contributed for 202000 and 188000 deaths,respectively. Nearly 66.7% of deaths occurred inyounger age groups, predominantly among men.
A 3.4 Independent studiesA recent national review (17) has estimated that amillion injury deaths and 30 million hospitalizationsoccur every year. The review highlighted andestimated that in 2005, 8, 50,000 (nearly a million)persons lost their lives and 17,000,000 hospitalized(Figure 5). If unchecked, numbers are likely toincrease to 1,200,000 deaths and 24,000,000hospitalizations of serious injuries by 2015. Roadtraffic Injuries, suicides, burns, poisoning, violenceare all major causes of deaths and disabilities. Recentstudies (18,19,20) using verbal autopsy methods haveshown that injury deaths contribute for 13–18% oftotal deaths varying from place to place.
India: A National Perspective” (17). In Bengaluru,few studies have been undertaken by NIMHANS onepidemiological, preventive and public health aspectsof road traffic injuries, brain injuries, suicides andviolence (www.nimhans.kar.nic.in/epidem/WHO).In New Delhi, TRIPP at IIT has made significantcontributions in road safety and transportmanagement (http://web.iitd.ac.in/~tripp/). Fewmedical colleges and engineering and transportdepartments have also undertaken studies in theirrespective areas of interest. Individual researchershave also undertaken studies on Road traffic Injuries(20, 21), suicides (23) and violence (24). A fewnational studies and surveys have been carried outby Ministries (25). Studies and reports available fromindependent agencies like WHO, World Bank,IndiaClen, NGO’s and other agencies have addedsubstantial information. However, these have beenstand alone - one time studies and provided usefulinformation for policy making process and torecommend interventions. Regular, continuous andtimely information has not been available for anyIndian city or for the country. The Bangalore Roadsafety and Injury Prevention Programme is thefirst of its kind being undertaken in India . Detailsof the programme are available at http://www.nimhans.kar.nic.in/epidemiology/bisp/sr1.pdfand in the recently published report from IndianCouncil of Medical Research (6).
Deaths (1)
Serious Injuries (20)
Minor Injuries (50)
8,50,000 (upto 10,00,000)
17,000,000 (upto 20,00,000)
42,500,000 (upto 50,00,000)
Figure 5: India Injury Pyramid, 2005
Limited studies have been undertaken in recent yearsby individual researchers. A summary of Indianstudies is available in the report entitled “Injuries in
A4. Injury in KarnatakaAs per data from NCRB, a total of 12,222 suicides and 8,814 RTI deaths followed by 1,844 homicidal deathswere reported for the year 2008 in Karnataka. In the same year, 184,226 persons were injured as per policereports with a ratio of nearly 1:6.
A5. Underreporting of InjuriesInjuries are underreported in all parts of the world(26) due to several reasons. In India, while officialstatistics are able to capture large majority of deaths,non-fatal injuries of various severities are highlyunderreported. For each death from injury, there aremany more injures that result in hospitalization,treatment in emergency departments or treatmentby practitioners in formal and/or informal healthsectors. Data from HICs & studies from India
indicate that for every person killed by injury,approximately 30 persons are hospitalized androughly 50 - 100 more are treated in hospital emer-gency rooms (1, 17). Studies in Bengaluru andHaryana have shown that injury problems are muchhigher in the community than officially reportedfigures (26, 27). Thus, it is essential to realise thatin the country, number of deaths due to injuries couldbe much higher than official figures.
8 BRSIPP 2009
Ref:
htt
p://
cghr
.org
/pub
licat
ions
/FIN
AL%
20R
EPO
RT-M
illon
% 2
0Dea
th%
20st
udy%
2020
01-2
003%
20-p
hase
%20
1.pd
f
Ran
k<
11-
40-
45-
1415
-24
25-6
970
+A
ll A
ges
1 2 3 4 5 6 7 8 9 10
Peri
nata
lco
ndit
ions
(49
.2)
Res
pira
tory
infe
ctio
n (2
0.5)
Dia
rrhe
al d
isea
ses
(9.0
)
Oth
er i
nfec
tiou
s an
dpa
rasi
tic
dise
ases
(7.9
)
Con
geni
tal
anom
alie
s (3
.4)
III
defi
ned
cond
itio
ns (
2.9)
Nut
riti
onal
defi
cien
cies
(1.
8)
Uni
nten
tion
alin
juri
es:
Oth
er (
1.5)
Mal
aria
(0.
9)
Feve
r of
unk
now
nor
igin
(0.
9)
Dia
rrhe
aldi
seas
es (
22.0
)
Res
pira
tory
Infe
ctio
ns 2
1.4)
Oth
er i
nfec
tiou
s an
dpa
rasi
tic
dise
ases
(15
.5)
Uni
nten
tion
alin
juri
es:
Oth
er (
9.3)
Mal
aria
(6.
6)
III
defi
ned
cond
itio
ns (
5.3)
Nut
riti
onal
defi
cien
cies
(4.
3)
Feve
r of
Unk
now
nO
rigi
n (3
.1)
Con
geni
tal
Ano
mal
ies
(1.9
)
Dig
esti
veD
isea
ses
(1.6
)
Peri
nata
lco
ndit
ions
(36
.9)
Res
pira
tory
infe
ctio
ns (
20.7
)
Dia
rrhe
aldi
seas
es (
12.3
)
Oth
er i
nfec
tiou
s an
dpa
rasi
tic
dise
ases
(9.8
)
Ill-
defi
ned
cond
itio
ns (
3.5)
Uni
nten
tion
alin
juri
es:
Oth
er (
3.4)
Con
geni
tal
anom
alie
s (3
.0)
Nut
riti
onal
defi
cien
cies
(2.
4)
Mal
aria
(2.
4)
Feve
r of
unk
now
nor
igin
(1.
5)
Uni
nten
tion
alin
juri
es:
Oth
er(1
9.4
)
Dia
rrhe
al d
isea
ses
(15
.2)
Oth
er i
nfec
tiou
s an
dpa
rasi
tic
dise
ases
(13
,5)
Res
pira
tory
infe
ctio
ns (
8.4)
Mal
aria
(8.
1)
Ill-
defi
ned
cond
itio
ns (
5.4)
Mot
or v
ehic
leac
cide
nts
(5.3
)
Mal
igna
nt a
nd o
ther
neop
lasm
s (3
.8)
Dig
esti
ve d
isea
ses
(2.9
)
Feve
r of
unk
now
nor
igin
(2.
5)
Uni
nten
tion
alin
juri
es:
Oth
er(1
4.7
)
Inte
ntio
nal
self
-har
m (
14.3
)
Mot
or v
ehic
leac
cide
nts
:; ;
;,(1
2.4
)
Ill-
defi
ned
cond
itio
ns (
7.2)
Car
diov
ascu
lar
dise
ases
(6.
3)
T ube
rcul
osis
(6.0
)
Oth
er i
nfec
tiou
s an
dpa
rasi
tic
dise
ases
(5.2
)
Dia
rrhe
al d
isea
ses
(5.1
)
Mal
aria
(4.
8)
Mat
ern
alco
ndit
ions
(-)
Car
diov
ascu
lar
dise
ases
(26
.3)
Tube
rcul
osis
(11
.4)
CO
PD,
asth
ma,
oth
erre
spir
ator
y di
seas
es(1
0.1
)
Mal
igna
nt a
nd o
ther
neop
lasm
s (7
.8)
Dig
esti
ve d
isea
ses
(6.1
)
Uni
nten
tion
alin
juri
es:
Oth
er (
5.0)
Ill-
defi
ned
cond
itio
ns (
4.8)
Dia
rrhe
aldi
seas
es (
4.0)
Inte
ntio
nal
self
-har
m (
3.3)
Mal
aria
(2.
4)
Car
diov
ascu
lar
dise
ases
(26
.5)
CO
PD,
asth
ma,
oth
erre
spir
ator
y di
seas
es(1
5.7
)
Seni
lity
(13.
1)
Dia
rrhe
al d
isea
ses
(7.3
)
Mal
igna
nt a
nd o
ther
neop
lasm
s (4
.6)
Tube
rcul
osis
(4.
5)
Ill-
defi
ned
cond
itio
ns (
4.4)
Uni
nten
tion
alin
juri
es:
Oth
er (
3.7)
Res
pira
tory
infe
ctio
ns (
3.4)
Feve
r of
unk
now
nor
igin
(2.
8)
Car
diov
ascu
lar
dise
ases
(20
.3)
CO
PD,
asth
ma,
oth
erre
spir
ator
y di
seas
es(9
.3)
Tube
rcul
osis
(7.
1)
Dia
rrhe
al d
isea
ses
(6.7
)
Peri
nata
l co
ndit
ions
(6.4
)
Res
pira
tory
infe
ctio
ns (
5.4)
Mal
igna
nt a
nd o
ther
neop
lasm
s (5
.4)
Uni
nten
tion
alin
juri
es:
Oth
er (
5.2)
Ill-
defi
ned
cond
itio
ns (
4.6)
Seni
lity
(4.0
)
Tab
le 2
: To
p 1
0 c
au
ses
of
dea
th b
y A
ge
Gro
up
s in
In
dia
: M
ale
9
Ref:
htt
p://
cghr
.org
/pub
licat
ions
/FIN
AL%
20R
EPO
RT-M
illon
% 2
0Dea
th%
20st
udy%
2020
01-2
003%
20-p
hase
%20
1.pd
f
Ran
k<
11-
40-
45-
1415
-24
25-6
970
+A
ll A
ges
1 2 3 4 5 6 7 8 9 10
Peri
nata
lco
ndit
ions
(43
.1)
Res
pira
tory
infe
ctio
n (2
3.3)
Dia
rrhe
alD
isea
ses
(10.
6)
Oth
er i
nfec
tiou
s an
dpa
rasi
tic
dise
ases
(8.8
)
III
defi
ned
cond
itio
ns (
3.2)
Con
geni
tal
anom
alie
s (2
.8)
Nut
riti
onal
defi
cien
cies
(2.
3)
Uni
nten
tion
alin
juri
es:
Oth
er (
1.3)
Mal
aria
(1.
3)
Feve
r of
unk
now
nor
igin
(0.
9)
Dia
rrhe
aldi
seas
es (
25.2
)
Res
pira
tory
Infe
ctio
ns (
23.3
)
Oth
er i
nfec
tiou
s an
dpa
rasi
tic
dise
ases
(16
.2)
Mal
aria
(6.
6)
Uni
nten
tion
alin
juri
es:
Oth
er (
6.2)
Nut
riti
onal
defi
cien
cies
(5.
1)
III
defi
ned
cond
itio
ns (
3.9)
Feve
r of
Unk
now
nO
rigi
n (3
.1)
Dig
esti
ve d
isea
ses
(1.8
)
Con
geni
tal
anom
alie
s (1
.3)
Peri
nata
lco
ndit
ions
(29
.2)
Res
pira
tory
infe
ctio
ns (
23.3
)
Dia
rrhe
al d
isea
ses
(15
.3)
Oth
er i
nfec
tiou
s an
dpa
rasi
tic
dise
ases
(11
.2)
Ill-
defi
ned
cond
itio
ns (
3.4)
Nut
riti
onal
defi
cien
cies
(3.
2)
Mal
aria
(3.
0)
Uni
nten
tion
alin
juri
es:
Oth
er (
2.9)
Con
geni
tal
anom
alie
s (2
.3)
Feve
r of
unk
now
nor
igin
(1.
6)
Dia
rrhe
al d
isea
ses
(19
.6)
Oth
er i
nfec
tiou
s an
dpa
rasi
tic
dise
ases
(16
.7)
Uni
nten
tion
alin
juri
es:
Oth
er (
12.0
)
Res
pira
tory
infe
ctio
ns (
11.1
)
Mal
aria
(10
.7)
Ill-
defi
ned
cond
itio
ns (
4.6)
Feve
r of
unk
now
nor
igin
(3.
3)
Dig
esti
ve d
isea
ses
(2.8
)
Mot
or v
ehic
leac
cide
nts
(2.1
)
Mal
igna
nt a
nd o
ther
neop
lasm
s (2
.0)
Inte
ntio
nal
self
-har
m (
16.9
)
Mat
ern
alco
ndit
ions
(12
.6)
Uni
nten
tion
alin
juri
es:
Oth
er (
9.1)
Tube
rcul
osis
(7.
5)
Ill-
defi
ned
cond
itio
ns(7
.2)
Dia
rrhe
al d
isea
ses
(7.2
)
Car
diov
ascu
lar
dise
ases
(6.
3)
Mal
aria
(4.
6)
Oth
er i
nfec
tiou
s an
dpa
rasi
tic
dise
ases
(4.4
)
Mot
or v
ehic
leac
cide
nts
(1.7
)
Car
diov
ascu
lar
dise
ases
(22
.5)
Mal
igna
nt a
nd o
ther
neop
lasm
s (1
1.8)
CO
PD,
asth
ma,
oth
erre
spir
ator
y di
seas
es(1
0.4
)
T ube
rcul
osis
(8.
3)
Dia
rrhe
al d
isea
ses
(6.6
)
Ill-
defi
ned
cond
itio
ns (
6.0)
Uni
nten
tion
alin
juri
es:
Oth
er (
4.1)
Dig
esti
ve d
isea
ses
(3.5
)
Mal
aria
(3.
4)
Inte
ntio
nal
self
-har
m (
2.6)
Car
diov
ascu
lar
dise
ases
(24
.8)
Seni
lity
(18.
4)
CO
PD,
asth
ma,
oth
erre
spir
ator
y di
seas
es(1
2.4
)
Dia
rrhe
al d
isea
ses
(9.8
)
Uni
nten
tion
alin
juri
es:
Oth
er (
4.6)
Ill-
defi
ned
cond
itio
ns (
4.5)
Feve
r of
unk
now
nor
igin
(3.
9)
Mal
igna
nt a
nd o
ther
neop
lasm
s (3
.5)
Res
pira
tory
infe
ctio
ns (
3.4)
T ube
rcul
osis
(2.
6)
Car
diov
ascu
lar
dise
ases
(16
.9)
Dia
rrhe
al d
isea
ses
(9.9
)
CO
PD,
asth
ma,
oth
erre
spir
ator
y di
seas
es(8
.0)
Res
pira
tory
infe
ctio
ns (
7.1)
Seni
lity
(6.5
)
Peri
nata
l co
ndit
ions
(6.2
)
Mal
igna
nt a
nd o
ther
neop
lasm
s (6
.0)
Ill-
defi
ned
cond
itio
ns (
5.0)
Tube
rcul
osis
(4.
7)
Uni
nten
tion
alin
juri
es:
Oth
er (
4.5)
Tab
le 3
:To
p 1
0 c
au
ses
of
dea
th b
y A
ge
Gro
up
s in
In
dia
: Fe
male
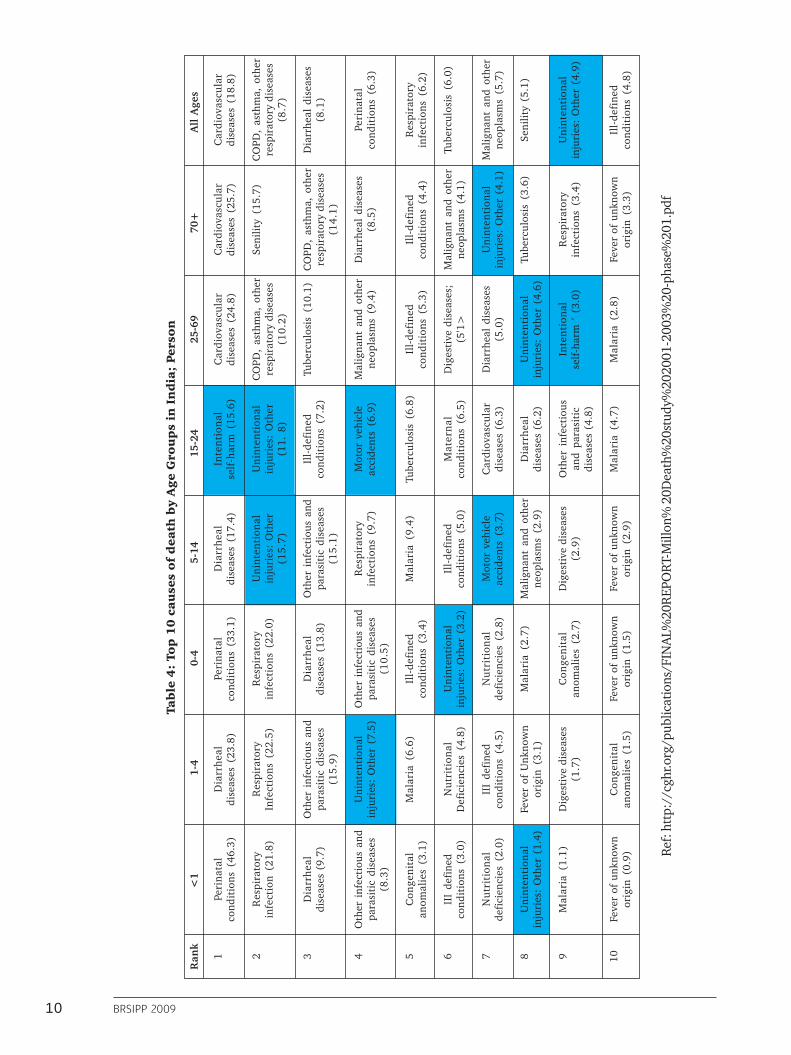
10 BRSIPP 2009
Ref:
htt
p://
cghr
.org
/pub
licat
ions
/FIN
AL%
20R
EPO
RT-M
illon
% 2
0Dea
th%
20st
udy%
2020
01-2
003%
20-p
hase
%20
1.pd
f
Ran
k<
11-
40-
45-
1415
-24
25-6
970
+A
ll A
ges
1 2 3 4 5 6 7 8 9 10
Peri
nata
lco
ndit
ions
(46
.3)
Res
pira
tory
infe
ctio
n (2
1.8)
Dia
rrhe
aldi
seas
es (
9.7)
Oth
er i
nfec
tiou
s an
dpa
rasi
tic
dise
ases
(8.3
)
Con
geni
tal
anom
alie
s (3
.1)
III
defi
ned
cond
itio
ns (
3.0)
Nut
riti
onal
defi
cien
cies
(2.
0)
Uni
nten
tion
alin
juri
es:
Oth
er (
1.4)
Mal
aria
(1.
1)
Feve
r of
unk
now
nor
igin
(0.
9)
Dia
rrhe
aldi
seas
es (
23.8
)
Res
pira
tory
Infe
ctio
ns (
22.5
)
Oth
er i
nfec
tiou
s an
dpa
rasi
tic
dise
ases
(15
.9)
Uni
nten
tion
alin
juri
es:
Oth
er (
7.5)
Mal
aria
(6.
6)
Nut
riti
onal
Def
icie
ncie
s (4
.8)
III
defi
ned
cond
itio
ns (
4.5)
Feve
r of
Unk
now
nor
igin
(3.
1)
Dig
esti
ve d
isea
ses
(1.7
)
Con
geni
tal
anom
alie
s (1
.5)
Peri
nata
lco
ndit
ions
(33
.1)
Res
pira
tory
infe
ctio
ns (
22.0
)
Dia
rrhe
aldi
seas
es (
13.8
)
Oth
er i
nfec
tiou
s an
dpa
rasi
tic
dise
ases
(10
.5)
Ill-
defi
ned
cond
itio
ns (
3.4)
Uni
nten
tion
alin
juri
es:
Oth
er (
3.2)
Nut
riti
onal
defi
cien
cies
(2.
8)
Mal
aria
(2.
7)
Con
geni
tal
anom
alie
s (2
.7)
Feve
r of
unk
now
nor
igin
(1.
5)
Dia
rrhe
aldi
seas
es (
17.4
)
Uni
nten
tion
alin
juri
es:
Oth
er(1
5.7
)
Oth
er i
nfec
tiou
s an
dpa
rasi
tic
dise
ases
(15
.1)
Res
pira
tory
infe
ctio
ns (
9.7)
Mal
aria
(9.
4)
Ill-
defi
ned
cond
itio
ns (
5.0)
Mot
or v
ehic
leac
cide
nts
(3.7
)
Mal
igna
nt a
nd o
ther
neop
lasm
s (2
.9)
Dig
esti
ve d
isea
ses
(2.9
)
Feve
r of
unk
now
nor
igin
(2.
9)
Inte
ntio
nal
self
-har
m (
15.6
)
Uni
nten
tion
alin
juri
es:
Oth
er(1
1. 8
)
Ill-
defi
ned
cond
itio
ns (
7.2)
Mot
or v
ehic
leac
cide
nts
(6.9
)
T ube
rcul
osis
(6.
8)
Mat
ern
alco
ndit
ions
(6.
5)
Car
diov
ascu
lar
dise
ases
(6.
3)
Dia
rrhe
aldi
seas
es (
6.2)
Oth
er i
nfec
tiou
san
d pa
rasi
tic
dise
ases
(4.
8)
Mal
aria
(4.
7)
Car
diov
ascu
lar
dise
ases
(24
.8)
CO
PD,
asth
ma,
oth
erre
spir
ator
y di
seas
es(1
0.2
)
Tube
rcul
osis
(10
.1)
Mal
igna
nt a
nd o
ther
neop
lasm
s (9
.4)
Ill-
defi
ned
cond
itio
ns (
5.3)
Dig
esti
ve d
isea
ses;
(5'1
>
Dia
rrhe
al d
isea
ses
(5.0
)
Uni
nten
tion
alin
juri
es:
Oth
er (
4.6)
Inte
ntio
nal
self
-har
m '
(3.
0)
Mal
aria
(2.
8)
Car
diov
ascu
lar
dise
ases
(25
.7)
Seni
lity
(15.
7)
CO
PD,
asth
ma,
oth
erre
spir
ator
y di
seas
es(1
4.1
)
Dia
rrhe
al d
isea
ses
(8.5
)
Ill-
defi
ned
cond
itio
ns (
4.4)
Mal
igna
nt a
nd o
ther
neop
lasm
s (4
.1)
Uni
nten
tion
alin
juri
es:
Oth
er (
4.1)
T ube
rcul
osis
(3.
6)
Res
pira
tory
infe
ctio
ns (
3.4)
Feve
r of
unk
now
nor
igin
(3.
3)
Car
diov
ascu
lar
dise
ases
(18
.8)
CO
PD,
asth
ma,
oth
erre
spir
ator
y di
seas
es(8
.7)
Dia
rrhe
al d
isea
ses
(8.1
)
Peri
nata
lco
ndit
ions
(6.
3)
Res
pira
tory
infe
ctio
ns (
6.2)
Tube
rcul
osis
(6.
0)
Mal
igna
nt a
nd o
ther
neop
lasm
s (5
.7)
Seni
lity
(5.1
)
Uni
nten
tion
alin
juri
es:
Oth
er (
4.9)
Ill-
defi
ned
cond
itio
ns (
4.8)
Tab
le 4
: To
p 1
0 c
au
ses
of
dea
th b
y A
ge
Gro
up
s in
In
dia
; Per
son

11
A6. Information requirements for injuryprevention and control
Information available through national reportsindicates the number of fatal and nonfatal injuries,age – sex profiles, state and city wise distribution,education and occupation levels, road user categoriesfor RTIs and a vague distribution of causes.Information reported is based on informationreceived from different places. Detailed examinationinto some of this data reveals that much of therequired information (especially with causes or riskfactors) is unavailable or remains unclassified.
In India, as RTIs and other injuries are medico legalevents, a lot of information is collected in detail aspart of routine police investigation. However, thecollected information is not used for prevention andcontrol, but more for administrative and legalpurposes. Numbers are also collected by differentagencies like transport department, City Corporation
and others for their own use. In addition, totalinformation is not available in the public domainfor researchers and policy analysts. Thus, informationis piecemeal, fragmented and not integrated.
To formulate effective injury prevention and control(IPC) programmes, information is required on whattypes of injuries are occurring? Who are the affectedpeople? What are their characteristics? Where areinjuries occurring? How are injuries occurring? Whatare the risk factors and causes? What are the agent– host – environment factors that can be modified?and other detailed information. This is a similarunderstanding developed for many other publichealth problems like malaria, tuberculosis, HIV/Aidsand others. This will facilitate designing programmesfor prevention, improving trauma care andrehabilitation in IPC activities.
A7. A Surveillance approach“Surveillance” is a public health activity, referringto ongoing, continuous and systematic collection,analysis, interpretation and dissemination of healthinformation (14). Injury surveillance, in a similarcontext refers to collection, analysis, interpretationand dissemination of injury data with the overallaim of developing policies and programmes foreffective prevention and control of injuries. It includesgathering information on individual cases orassembling information from records, analyzing andinterpreting information, reporting and providingfeedback into programmes. Surveillance is acontinuous activity with an inbuilt feedbackmechanism and an action component. It helps inrecognising existing and changing burden andpattern of injuries, identifying new / emergingproblems, prioritising and selecting interventions andmeasuring the impact of interventions in a timelymanner. Surveillance data can be a meaningful inputto several programmes and activities of variousministries, government departments, healthprofessionals, transport, police, NGOs, and all othersinterested in injury prevention.
Importance of injury surveillanceReliable information on the burden, pattern, trendsand causes of injuries are required to developsystematic policies, programmes and interventions.In India, lack of reliable information on injury burden& impact has been one of the major barriers forabsence of systematic programmes for injuryprevention and control. Consequently, ad hoc, andat times, unscientific interventions are proposed andimplemented, and so far, these have not made anysignificant change. Injury problem has not beendefined due to absence of systematic information.Systematic activities like allocation of resources,human resource and capacity development,systematic efforts for care and management, injuryprevention interventions, and others have not receivedmuch importance. Hence, injuries have been aclearly neglected problem and a hidden epidemicfor many decades, even though evidence exists thatthe burden is huge (17).
Surveillance generates data that helps inunderstanding the:� Magnitude of the problem and its
characteristics
12 BRSIPP 2009
� Changing trends� Populations at risk� General and select risk factors, and� Impact of interventions
Local, regional and national injury surveillancesystems can provide data required for planning anddelivering effective injury prevention programmesto communities and to the country at large. It willhelp planners and administrators to take appropriateaction on a continuous and regular basis. Further, ithelps societies to advocate for positive changes thatare required for safety of everyone.
� Often, it is thought that RTI / Injury surveillancerequires building entirely new systems involvinghuge resources. This is not true. Alternatively,it can be built within existing systems usingavailable resources. The existing systemsand methods can be improved, strengthenedand utilized to develop information that isrequired for injury prevention and controlprogrammes.
Any surveillance programme has to be operationaland sustainable, and hence, should be� Simple� Acceptable� Sensitive� Reliable� Representative� Sustainable� Timely� Cost effective and, most importantly,� Useful� It is crucial to highlight that injury surveillance
provides broad and specific information(depending on the extent and depth ofsurveillance) and should be supplemented withdata from focussed, targeted and specificstudies (like trauma registries, risk factorstudies etc.) to obtain further insights. Thus,injury surveillance is often the first step in thelarger information systems.
����� The essence of surveillance is to collect smallquantities of good, reliable and usefulinformation (by well defined methods) andapply it to develop policies, programmes andinterventions.
Bengaluru Road safety and InjuryPrevention ProgrammeDetails of the surveillance programme undertaken in 2007 – 08 have been reported earlier and are availableat http://www.nimhans.kar.nic.in/epidemiology/bisp/sr1.pdf and only salient points are highlighted below.
A8. Goals, purpose and objectivesThe overall goal of BRSIPP is to achieve a reductionin injury (RTI and others) deaths, hospitalisationsand disabilities in Bengaluru.
The purpose and objectives of Bengaluru Injury /Road traffic Injury Surveillance Programme are to:� Collect and analyse data from selected
participating health care institutions, policesources and transport sector on specific aspectsof RTIs, sucides and other injuries.
� Facilitate application and utilization of datafor planning and implementing interventionprogrammes through various policies andprogrammes.
A9. Preparatory Phase (March – June 2007)Stake holder’s involvementAll stakeholders in injury prevention and controlincluding ministries of health, police, transport,urban and rural development, social welfare,
education, industries and commerce, media, NGOsand others need to be involved in surveillance,prevention and control activities. In Bengaluru,stakeholders from - Police (Traffic, Crime and Law

13
and Order), Health (Directorate of Health Services,Directorate of Medical Education, officials fromIntegrated Disease Surveillance Programme and allhospital administrators), Heads of major hospitals(Directors, Chief Executive Officers, Senioradministrators), Transport (transport departmentand Bengaluru Metropolitan TransportCorporation), Bruhat Bengaluru MahanagaraPalike, social welfare, urban development, NationalHighway Authority and Non-GovernmentalOrganizations working with injury issues were
contacted, sensitised and involved in theprogramme.
As it is an inter-sectoral and coordinated activity,stake holders contribution in terms of need for data,what type of data is required, how will it be collected, steps involved in the development and mechanismsof data collection and utilisation - application werediscussed in preliminary discussions during themeeting. The roles and responsibilities were specifiedand agreed upon by all stake holders.
A10. Focus of surveillanceUnder the present programme, data is being collectedon Road traffic injuries, falls, burns, poisoning,suicides and assault/violence. While the focus is onall injury causes, the major thrust is on road trafficinjuries and suicides as identified by stakeholders. Itwas decided to include occupational and otherinjuries in later stages of the programme.
Designing and building a surveillance system
1. Identifystakeholders
2. Define systemobjectives
3. Define“ a case ”
4. Identifydata sources
5. Assess availableresources
6. Inform and involvestakeholders
7. Definedata needs
8. Collect data
9. Establish a dataprocessing system
10. Design anddistribute reports
11. Train staff andactivate system
12. Monitor andevaluate
Ref.: 14
A11. Surveillance MechanismsThe different agencies collecting injury relatedinformation in the city of Bengaluru are police,hospitals, transport, city corporation vital registrydivision, and NGOs. Accordingly, these sources arestrengthened and are being used to collect data on aregular basis. The sources of data under the presentprogramme include police records for RTI and otherinjury mortality information - BMTC data for fatalbus crashes - vital division records for deaths in thecity for injury mortality information – and hospitaldata for nonfatal injuries.
Figure 6: Sources of information for injury
BRSIPP
Policesources
Transportsector
Vital DeathRegistration
UrbanHospitals
RuralHospitals
14 BRSIPP 2009
A11.1. Data on fatal injuriesData on injury mortality is collected from policesources as previous studies had shown that majorityof deaths are reported to police. Bengaluru City Policecollect information on various aspects of RTIs andother injuries (any unnatural death) under the“medico-legal” rubric. All deaths due to road crashes,suicides, homicides and other unnatural (suspicious)deaths are considered medico-legal and police areentrusted with the primary responsibility ofdocumenting information. Information is based onthe formats provided by NCRB. A review of the roadcrash death and other injury death records revealedthat large body of information is collected on everycase and processed as per administrative and legalrequirements.
The review of police information system revealed:� Lack of a uniform reporting format for injuries� Information systems are piecemeal and
fragmentary� Different types of records received from casualty
rooms of hospitals for reporting injuries topolice (along with duplication of work)
� Manual handling of data� Frequent transfer of Officials and personnel� Lack of analysis of data� Absence of linkage of records between police
and health� Absence of a centralized agency to process,
analyse and utilize data� Absence of systematic reporting to concerned
stakeholders, society at large and others, and� Medico legal problems of a continuous
nature.
A major limitation of this approach has been thatinformation on preventive aspects that can be helpfulfor planners and policymakers are not clearlyavailable. Secondly, the collected data is notcompiled and analyzed systematically at the city orstate level. Thirdly, information is distributed acrossthe 39 traffic and 106 law and order police stationsof the city and is not available in any systematicformat in a central place for examination. Fourthly,information is not brought to the attention of allstakeholders and is not applied for programmes. Aspecified format was developed based on review ofrecords, piloted in few stations, and has been widelyadapted in the programme.
A11.2. Data on nonfatal injuries fromhospitals
Since hospitals and health professionals (doctors,nurses, specialists, technicians, medical recordstaff, etc.,) provide care for injured persons acrossthe city and round-the-clock, information isgathered in medical records as per the practicesfollowed by individual hospitals. An inventory offew hospitals prior to the beginning of thesurveillance programme revealed that themethods, practices and procedures varied fromhospital to hospital. The way information isrecorded is often dependant on practice of thedoctor and huge variations and discrepancies areseen. A review of the system indicated thatinformation is not collected on injury nature,causes, situation, circumstances, and use ofprotective equipments or pre-hospital care details,except the source of referral. The diagnostic andmanagement details are written in detail todocument care for patients. There is no centralagency or organization within the health sectorthat collects information from all the hospitals,analyses and processes data and brings it on acommon format to develop interventionprogrammes. As there was no uniformity, it wasdecided in the stakeholders meeting that allhospitals will adopt a system of documentinginformation in a uniform manner using a commonformat of “Emergency Trauma Care Record”,supplemented by training and sensitisationprogrammes.
A11.3. Selection of surveillance sitesAs per the decision in the stakeholders reviewmeeting it was decided that injury death informationwill be extracted from 39 traffic as all RTI deathsare reported to police authorities on a regular basissoon after the occurrence of an event. In addition,data from BBMP and BMTC crashes are collectedseparately and pooled together to make finalconclusions. For nonfatal injuries, data is beingcollected from 30 urban hospitals and 1 rural hospitaland it was estimated that these hospitals would covernearly 60-70% of injury registrations andhospitalisations. The hospitals were chosen basedon the criteria of geographical coverage, availabilityof round the clock trauma care, location of thehospitals and willingness to participate. Participationis purely voluntary in the programme (Fig. 7).
15
Figure 7: Map of Bengaluru showing the location of various partner hospitals and
Traffic Police Stations
Limitations of Health Sector Information� Rudimentary information systems on RTIs and other injuries� No uniform data formats in the hospitals� The death certificate does not mention injury as associate or antecedent condition, even
when injury has been cause of death; injury deaths are reported to police separately� Information on injury patterns, profile and causes not available� Data on pre-hospital care factors not elicited� Data on injury care and disability details are not available, analyzed or reported� Hospitals do not use ICD-10 classification or the ICECI classificatory systems� Overburdened and overstretched emergency staff in hospitals (more so in public sector
hospitals)� Injury surveillance system is absent in the country� No information system with in the health sector� Lack of resources (money, manpower, time and other facilities)� Very few hospital based studies
A11.4 Inventory of hospitals andscoping study
To identify the caseload in emergency rooms,type and nature of personnel available, type ofdocuments maintained, information flow and otheraspects, a scoping study was undertaken in thebeginning. The study highlighted that variouscategories of personnel were available in institutionsdepending on the type of organization. Commonly,in medical college teaching hospitals - casualtymedical officers, nurses, residents, postgraduatestudents, interns and medical record personnel workround the clock to provide care for patients. In otherhospitals, primarily of a private nature, casualty
medical officers and nurses are the only routinepersonnel.
A11.5 Time of data collectionFor injury deaths, the point of information collectionwas the individual police stations (35 traffic and103 law and order) and the first information report,summary sheet and available extracts were chosenas the source of information. At present, nodocuments are being reviewed by the centralteam.
In the hospitals, data was collected from casualtydepartments, as it is the first point of contact for
16 BRSIPP 2009
� Details of road traffic deaths (where, who, howand selected risk factors)
� Details of other types of injury and deaths(intent, place, type),
� Pre-hospital care (first aid, transport, referral)� Management and outcome
It was decided to focus on core data elements withscope for expansion in due course of time. Theresponsibility of identifying personnel to completethe surveillance form was left to individualhospitals. An operation-training manual (availableon request) was developed for training of allinvolved personnel from police and health. Themanual included description of purpose ofcollecting information, various variables – briefdescription – coding patterns - methods of fillingup of the forms. The collected and analyzedinformation should be able to unravel injurycharacteristics and dimensions and, help indeveloping intervention programmes.
A11.7 Pilot studyA pilot study was undertaken in both police stationsand hospitals over a one month period to examinefeasibility, identify problems, find remedial solutionsand develop logistics for future work. The pilot studyshowed that it is possible and feasible to transferand collect data in a uniform format. Trained stafffrom NIMHANS did data collection during thisphase. On an average, it took 3 - 5 minutes tocomplete a form depending on the experience of theperson filling up the proforma.
Following the pilot phase, the findings were discussedwith stakeholders and nodal officers. The proformawas revised accordingly. The revised police andhospital format was accepted as the core data elementform with provision for addition of information atlater stages of the programme.
injury patients. Data is collected in the form of an“Emergency Trauma Care Record”. It was also agreedthat data would be collected uniformly in a standardformat along with training of all involved personnel.Information was collected as part of the history takingprocess or soon after treatment procedures werecompleted.
The review of the existing hospital informationsystem revealed that:� Information collected in detail on patient care
and management� Information collection depends on attending
physician� Different types of records maintained in
casualty rooms with duplication of work( number of records maintained for injuriesvaried from 1 – 15 across hospitals)
� No central processing of data even in hospitals� Absence of systematic reporting to any agency,
as there is no designated agency� Lack of a uniform reporting format for
injuries� Transfer and turnover of staff at repeat, regular
and frequent intervals� Medico legal problems of a continuous
nature� Reluctance on the part of some hospitals to
undertake shared responsibility. Informationis piecemeal and fragmentary
� No information on preventive aspects
A11.6 Focus of information collectionAny injury surveillance programme should outlinecore data for the programme and include optionalitems depending on the need. The focus ofinformation gathering was on� Basic identification and brief socio-
demographic details� Information on Injury and death (place, type,
activity, intent)
17
A12.Implementation Phase(June 2007 - June 2008)
Information was collected from Police, transport,city corporation and hospital sources from January- December 2007 (police and transport) and April2007- 2008 (hospitals), respectively, by combinationof different methods. Overall mortality information(all cause deaths) was also collected from the vitalstatistics division of Bengaluru Mahanagara Palikefor the year 2005 (latest year for which data wasavailable). Injury mortality information was collectedfrom police sources. Since the transport departmentcollects data from most of the fatal and serious non-fatal road traffic injuries and since the focus isdifferent, it was collected separately, even thoughsome of it is captured in police records. Morbiditydata was captured from emergency rooms of 25participating hospitals. During the 1 year period datawas collected from 4334 injury deaths and 68498non-fatal injuries. Details are available at http://www.nimhans.kar.nic.in/epidemiology/bisp/sr1.pdfand in the report (28). The type and volume of datathat was collected has been discussed in our previousreport (28).
A12.1. Training of Police and healthpersonnel
In the beginning, the field officers from NIMHANSwere trained in data collection. These people hadbasic qualifications in sociology, social work, ruraldevelopment, or in other areas and had prior researchexperience in health. Gradually, the CC staffs werewithdrawn encouraging institutions to take up theactivity on their own.
In the police department, the writers of policestations were invited for training programmes.Since capacity development is a systematic activity,repeat programmes were done to improve contentsand quality of data. The training focussed onunderstanding contents of proforma, definitions used,method of entering and coding, checking forcompleteness and other aspects.
In the hospitals, training of casualty staff (casualtymedical officers, nursing personnel and medicalrecords staff) was crucial to ensure completeness,coverage and uniformity in data collection. It was
essential to do this in a phased manner, as therewere large numbers of people to be trained (due tofrequent change of personnel). The training focussedon purpose of the programme, persons responsiblefor data collection, nature of information beingcollected, coding patterns, and ensuring safety ofcompleted forms to be collected. Training was alsooffered to different personnel depending on rolesand responsibilities of the personnel. In the ruralareas, staffs from district hospital and SiddharthaMedical College hospital were trained on thevarious aspects of the programme in a similarmanner. Series of training programmes have beenconducted under the programme for both police andhospital staff.
Consensus was reached on many of the items andmethodology of data collection - pooling - transfer -analysis - reporting and feedback of the programme.
The training was held in the local language and ina simple way using local examples and colloquialterms. Several questions that came up were answeredand changes incorporated.
A12.2. Data collection logisticsWith continuation of activities, all hospitals haveprinted their own forms with their names and logoin duplicate carbon copy formats (essential to notethat ER departments have not been computerised inany hospital). With the evolution of the programme,it is proposed to shift from paper-based forms toonline transmission depending upon the availabilityof computer facilities. In the hospitals, informationis being collected from injury patients in emergencyrooms. It was agreed that data would be collectedin casualty departments soon after completingtreatment procedures or as part of history takingprocess. Different modalities of operations wereevolved in different situations.
From the police records and primarily from FIRs,the station staff completed the forms soon afterinvestigations were completed or during the courseof investigation. These trained staff send thecompleted forms to the nodal officer in police
18 BRSIPP 2009
A13. Review Phase(June 2008 - December 2008)
After the initial implementation of programme forone year different aspects were reviewed with allinstitutions and stake holders on various aspects.Many practical solutions were developed to overcomeproblems. Hospitals were encouraged to implementthe programme with involvement of local staff. Theprogress during this time could be termed as mixed,as some improved, while few did not evince keeninterest. The activities with traffic police and fewhospitals improved due to interest and leadership bythe department. The sustenance of interest was also
due to the fact that they could use data for improvinglocal activities. Many changes were made based onfeedback from participating institutions. The revisedprogramme has been implemented from Jan 2009.It is important to note that institutions wereencouraged to strengthen and sustain the programmeon their own. Hence, the data reported in the nextsections are not comprehensive and total, thus, onlyindicating profile and pattern and any extrapolationmade has to be done with caution.
department, who in turn, send all completed formsto the CC on a monthly basis. The forms reach theCC before 10th of every month for computerisation.Quality control mechanisms have been establishedthrough cross checks, sampling records for reliabilityand validity checks, and for completeness.
A12.3. Data management stepsAll collected forms are checked by the CC staff forcompleteness, coverage and quality. The CC staffmakes random checks and check the process. Anydeficiencies observed are brought to the notice ofconcerned authorities for immediate corrections.Quality control at different stages of data collection,transfer and entry is crucial to obtain quality dataunder the surveillance programme.
A team of data manager and data entry operatorwas constituted in the beginning and trained in allaspects. A data entry format on EPI INFO windowsversion 3.3 was developed, tested and used for dataentry and analysis purposes.
A12.4. Data pooling from othersourcesIn addition to information collected from police andhospital sources, data is also collected from the statisticsdivision of health dept of BBMP, transport department,NGOs, and others for a comprehensive examination ofinjury scenario in the city of Bengaluru.
A12.5. Monitoring and Feedback stepsInbuilt mechanisms through internal verifications,record reviews, weekly meetings of project team,checking all records for completeness and quality have
been developed to ensure systematic monitoring ofthe programme. Meeting with all nodal officers oncein 3 months helped in reviewing progress, identifyingremedial measures for problems, ensured bettercooperation, and to work out future steps.
Continuous contact of the CC staff with all institutionswas an inbuilt activity under the programme.Periodical visits and communication on a regularbasis was undertaken to ensure completion of allactivities as per time schedule. The programmecoordinator and the team visit police and hospitaldepartments at periodical intervals and discussionsare held with nodal officers, ER staff, medical recordstaff and hospital administrators.
A12.6 Sharing and disseminating ofinformation
As surveillance is an ongoing continuous activity, theanalyzed data has to be shared with all the partners,and hence, feedback becomes a regular feature of theprogramme. All reports are developed, circulated anddisseminated under the title of "Bengaluru Road safetyand Injury Prevention Programme" .Individualinstitutions are provided with their respective datafor the previous 3 months (on a CD) on a regularbasis. Member institutions are encouraged to examine,use and develop reports for their institutional activities.Data is constantly reviewed in the nodal officersmeeting and used in all training programmes.Information has been made available to memberinstitutions as and when required. Mechanisms havebeen evolved to ensure that all partnering institutionshave access to data at any time.
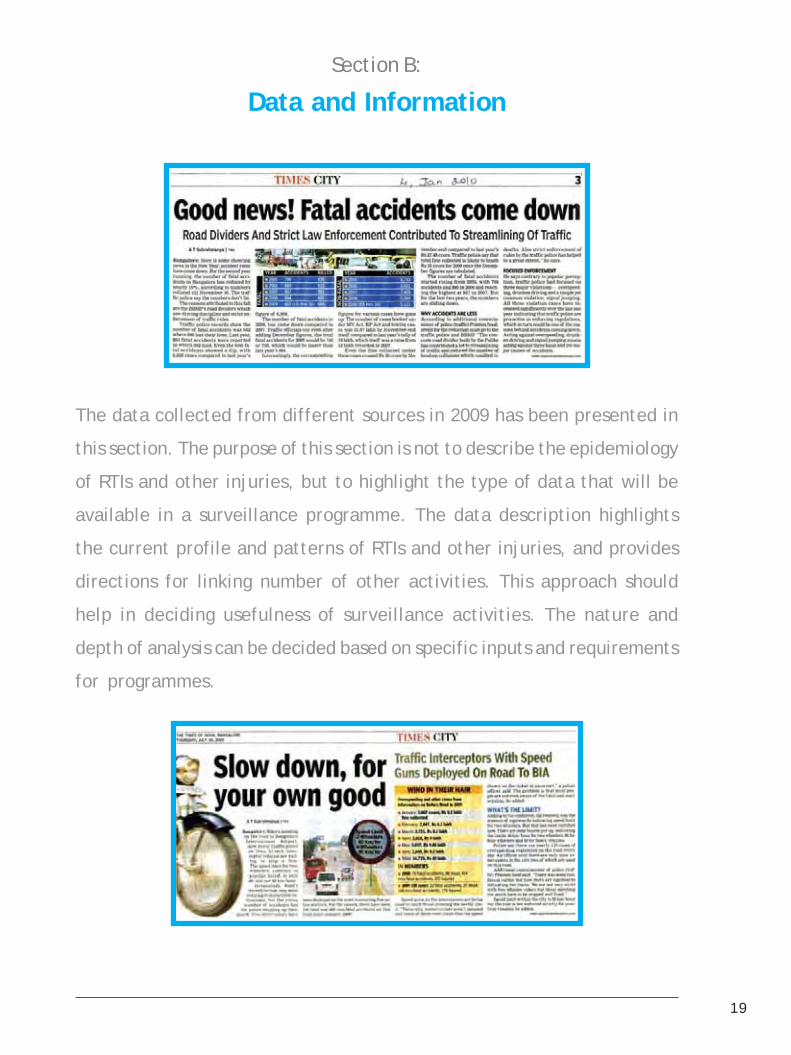
19
Section B:
Data and Information
The data collected from different sources in 2009 has been presented in
this section. The purpose of this section is not to describe the epidemiology
of RTIs and other injuries, but to highlight the type of data that will be
available in a surveillance programme. The data description highlights
the current profile and patterns of RTIs and other injuries, and provides
directions for linking number of other activities. This approach should
help in deciding usefulness of surveillance activities. The nature and
depth of analysis can be decided based on specific inputs and requirements
for programmes.

20 BRSIPP 2009
The City of BengaluruThe city of Bengaluru is a recognizable landmarkon the national and global map for its technological,educational and economic growth. The city ofBengaluru, as per the boundaries delineated by BBMPwas identified for the programme and a brief profileof the city is given in Table 5.
What changed in Bengaluru in 2009
The city of Bengaluru moved ahead in several areas.Some important changes that are of relevance toinjuries are highlighted below as illustrativeexamples.
� In the year 2009, the city added 348,707vehicles onto its roads. Among them, 233,699were two wheelers, 122,910 were cars and othervehicles like buses, trucks etc., accounted forthe rest.
� The BMTC added 571 new buses, increasingits total fleet strength to 5344. Correspondingly,the trips and schedules increased by 9%. Thesystem transports approximately 40, 00,000people every day, an increase of 2% comparedwith 2008.
� A few infrastructure projects were completedand opened for public. Important among them
Table 5: Bengaluru City – A Socio Demographic Profile – update in select areas andshow 2008 and 2009 together
SI. No Parameters 20091 Area 800 sq. kms 1
2 Population 7 million 1
2 Density 2980/sq.km 2
3 Contribution to Karnataka state population 11%4 Sex Ratio (Females/1000 males) 915 3
5 Life expectancy at birth 64.2 years6 Crude birth rate/1000 19.1 2
7 Crude death rate/1000 7.2 2
8 Decennial growth rate 1.3%9 Total number of slums 733 4
10 Total population in slums 4,30,501 5
11 Slum population% 10 2
12 Socially disadvantaged population (%) 4013 Literacy rate% 83.91 6
14 Total number of schools and colleges 7674 7
15 Total number of factories 6024 8
16 Total number of police stations 142 9
17 Total number of hospitals (including public, private hospitals & nursing homes) 572 10
18 Total number of Drug stores 4445 11
19 Total number of General practitioners H” 5000 10
20 Total length of roads 1500 kms 1
21 Total number of police personnel (traffic) 3,10222 Total number of police personnel (law and order) 11,90823 Total number of registered vehicles 3.4 million 12
24 Number of alcohol selling outlets (CL-2, 4, 5, 6, 6A, 7, 9, 14 & 15) Licensees H” 2400 13
25 Indian Made Liquor sold for the year 2007 – 2008 325.48 lakh CBs 13
26 Total revenue from IML & Beer Rs.3478cr 13
Source:1 http://www.bmponline.org2 www.bangaloreit.com3 http://www.experiencefestival.com/slum4 http://www.hindu.com/2007/04/28/stories/
2007042802250200.htm5 www.censusindia.com6 www.des.kar.nic.in7 Karnataka Education Departments
8 Small, Medium and Large scale industries Corporation9 BCP Bengaluru City Police10 KSPCB Karnataka State Pollution Control Board11 Karnataka state Drugs control General12 www.rto.kar.nic.in/bng-veh-stat.htm13 Karnataka State Beverages Corporation Limited
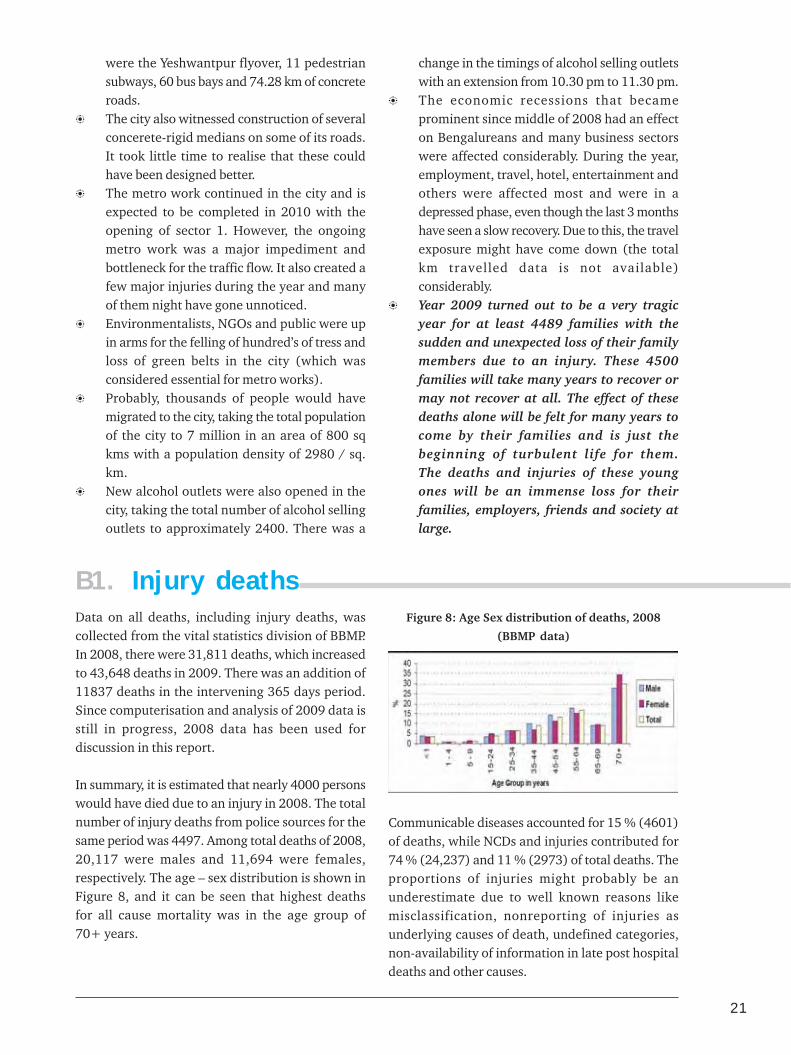
21
were the Yeshwantpur flyover, 11 pedestriansubways, 60 bus bays and 74.28 km of concreteroads.
� The city also witnessed construction of severalconcerete-rigid medians on some of its roads.It took little time to realise that these couldhave been designed better.
� The metro work continued in the city and isexpected to be completed in 2010 with theopening of sector 1. However, the ongoingmetro work was a major impediment andbottleneck for the traffic flow. It also created afew major injuries during the year and manyof them night have gone unnoticed.
� Environmentalists, NGOs and public were upin arms for the felling of hundred’s of tress andloss of green belts in the city (which wasconsidered essential for metro works).
� Probably, thousands of people would havemigrated to the city, taking the total populationof the city to 7 million in an area of 800 sqkms with a population density of 2980 / sq.km.
� New alcohol outlets were also opened in thecity, taking the total number of alcohol sellingoutlets to approximately 2400. There was a
change in the timings of alcohol selling outletswith an extension from 10.30 pm to 11.30 pm.
� The economic recessions that becameprominent since middle of 2008 had an effecton Bengalureans and many business sectorswere affected considerably. During the year,employment, travel, hotel, entertainment andothers were affected most and were in adepressed phase, even though the last 3 monthshave seen a slow recovery. Due to this, the travelexposure might have come down (the totalkm travelled data is not available)considerably.
� Year 2009 turned out to be a very tragicyear for at least 4489 families with thesudden and unexpected loss of their familymembers due to an injury. These 4500families will take many years to recover ormay not recover at all. The effect of thesedeaths alone will be felt for many years tocome by their families and is just thebeginning of turbulent life for them.The deaths and injuries of these youngones will be an immense loss for theirfamilies, employers, friends and society atlarge.
B1. Injury deathsData on all deaths, including injury deaths, wascollected from the vital statistics division of BBMP.In 2008, there were 31,811 deaths, which increasedto 43,648 deaths in 2009. There was an addition of11837 deaths in the intervening 365 days period.Since computerisation and analysis of 2009 data isstill in progress, 2008 data has been used fordiscussion in this report.
In summary, it is estimated that nearly 4000 personswould have died due to an injury in 2008. The totalnumber of injury deaths from police sources for thesame period was 4497. Among total deaths of 2008,20,117 were males and 11,694 were females,respectively. The age – sex distribution is shown inFigure 8, and it can be seen that highest deathsfor all cause mortality was in the age group of70+ years.
Figure 8: Age Sex distribution of deaths, 2008
(BBMP data)
Communicable diseases accounted for 15 % (4601)of deaths, while NCDs and injuries contributed for74 % (24,237) and 11 % (2973) of total deaths. Theproportions of injuries might probably be anunderestimate due to well known reasons likemisclassification, nonreporting of injuries asunderlying causes of death, undefined categories,non-availability of information in late post hospitaldeaths and other causes.

22 BRSIPP 2009
Figure 9: Major causes of death, 2008 TTTTTable 6: Table 6: Table 6: Table 6: Table 6: Top 10 causes of death in Bengaluruop 10 causes of death in Bengaluruop 10 causes of death in Bengaluruop 10 causes of death in Bengaluruop 10 causes of death in Bengaluru
SrSrSrSrSr..... Cause of DeathCause of DeathCause of DeathCause of DeathCause of Death Number ofNumber ofNumber ofNumber ofNumber ofN oN oN oN oN o DeathsDeathsDeathsDeathsDeaths
1 Ischemic Heart Disease 50152 Neoplasm 32703 Injury 29734 Diabetes mellitus 24835 Respiratory Diseases 23206 Hypertensive disease 19727 Liver Diseases 16088 Cerebrovascular diseases 16039 Tuberculosis 1329
10 Pulmonary heart Disease 1238
11 Other causes 8000
Detailed analysis was performed to identify top 15leading causes of death in different age groups andboth sexes. Tables 7,8,9 indicate that� Injuries are leading cause of death in younger
age groups of 15-44 years.� Traffic crashes are the leading cause of death
in 25-34 yrs age groups.� Burns are the foremost cause among women
in 15 – 34 yrs age groups.� Intentional self harm accounted for 9.35%
deaths in 25-34yrs.
Comparison of injury causes between police and vitalstatistics division data showed major differences,reflecting information gathering practices. Transportaccidents were higher in BBMP data ( based on deathcertificates), while suicides were more in police data.Our previous research in suicides has shown thatsuicidal deaths are not properly documented inhospital deaths for medico legal reasons. Similarly,some unspecified and unclassified deaths are includedin police sources as suicides. If RTIs are theunderlying cause of death, they are not documentedin death certificates. This shows that there isconsiderable scope for improving vital statistics databased on death registration systems.
Injuries9.4%
CommunicableDiseases
14.5%
Non communicableDiseases
76.1%
Specific analysis of injury deaths revealed thatmore than two thirds of injury deaths (64.4 %)occurred in 15 – 44 years, with variation asper causes. Proportionately, more injury deathsoccurred among women in the 15 – 34 yrs agegroup, with preponderance of males in later agegroups.
Figure 10: Age sex distribution of
injury deaths, 2008
The top 10 conditions that lead to death in 2008 aregiven in Table 6. Examination of contribution ofinjury causes for deaths revealed that injuriesoccupied the 3rd leading condition for deaths.Disaggregated data showed that traffic accident,burns, suicides and other injury causes occupied 10th,12th, 15th and 17th rank, respectively. In total, RTIsand suicides accounted for 2.9% and 2 % of totaldeaths, respectively.
B2. Urban injuriesAfter intense data gathering activities in 2008, 2009was devoted primarily for review, streamlining andconsolidation of activities in all institutions. Afterthe stake holder’s consultation meeting on Jan 28,2009, all partners were encouraged to discuss withtheir heads of institutions and colleagues to improveand strengthen mechanisms for data collection.Consequently, data collection continued at different
points of time and data on nonfatal injuries is notavailable from all institutions uniformly for theentire 12 month period in a uniform manner. In2010, the mechanisms have been strengthened inall partner hospitals and 8 new partner institutionshave joined the programme. Hence, the data onnonfatal injuries indicates only the broad trendsand patterns.

23
Sl N
o.0-
4 yr
s5
- 14
yrs
15 -
24
yrs
25 -
34
yrs
35 -
44y
rs45
- 5
4yrs
55 -
64
yrs
Abo
ve 6
5 yr
sTo
tal
1 2 3 4 5 6 7 8 9 10 11 12 13 14 15
Tota
l
Peri
nata
lde
aths
Con
geni
tal
mal
form
atio
ns
CN
S In
fect
ions
Dia
rrho
eal
dise
ases
Vir
al d
isea
ses
Neo
plas
ms
Res
pira
tory
diso
rder
s
Bur
ns
Tran
spor
tC
rash
es
Tube
rcul
osis
Rhe
umat
iche
art
dise
ase
Oth
er in
jury
caus
es
Mal
nutr
itio
n
Hae
mop
oeit
icdi
sord
ers
Mis
cella
neou
s
1382
Tabl
e 7:
Top
15
Lead
ing
Cau
ses
of D
eath
in B
enga
luru
Cit
y :
Pers
ons
Neo
plas
ms
Vir
al I
nfec
tion
s
Bur
ns
Tran
spor
tC
rash
es
Res
pira
tory
diso
rder
s
Dig
esti
ve S
ytem
diso
rder
s
CN
S in
fect
ions
Rhe
umat
iche
art
dise
ase
Con
geni
tal
mal
form
atio
ns
Tube
rcul
osis
Bac
teri
aldi
seas
es
Oth
er in
jury
caus
es
Hae
mop
oeit
icdi
sord
ers
Car
diov
ascu
lar
dise
ases
Mis
cella
neou
s
348
Bur
ns
Suic
ide
Tran
spor
tC
rash
es
Tube
rcul
osis
Neo
plas
m
Dig
esti
ve S
ytem
diso
rder
s
Oth
er in
jury
caus
es
Res
pira
tory
Infe
ctio
ns
Preg
nanc
y &
Chi
ldbi
rth
Rhe
umat
iche
art
dise
ase
CN
S in
feti
ons
Vir
al d
isea
ses
Uri
nary
Sys
tem
diso
rder
s
Bac
teri
al d
isea
ses
Mis
cella
neou
s
1285
Bur
ns
Tran
spor
tC
rash
es
Suic
ide
Tube
rcul
osis
Neo
plas
ms
Live
r D
isea
ses
Res
pira
tory
diso
rder
s
Isch
emic
Hea
rtD
isea
se
Oth
er in
jury
caus
es
CN
S in
fect
ions
Uri
nary
Sys
tem
diso
rder
s
Cer
ebro
vasc
ular
dise
ases
Vir
al d
isea
ses
CN
S in
fect
ions
Mis
cella
neou
s
2128
Live
r di
seas
es
Neo
plas
ms
Isch
emic
Hea
rtD
isea
se
Tube
rcul
osis
Res
pira
tory
diso
rder
s
Tran
spor
tC
rash
es
Cer
ebro
vasc
ular
dise
ases
Bur
ns
Dia
bete
s M
ellit
us
Suic
ide
Hyp
erte
nsiv
edi
seas
es
Pul
mon
ary
hear
t di
seas
es
Uri
nary
Sys
tem
diso
rder
s
Vir
al d
isea
ses
Mis
cella
neou
s
2829
Neo
plas
ms
Isch
emic
hea
rtdi
seas
e
Live
r di
seas
es
Dia
bete
s M
ellit
us
Tube
rcul
osis
Res
pira
tory
diso
rder
s
Cer
ebro
vasc
ular
dise
ases
Hyp
erte
nsiv
edi
seas
es
Pulm
onar
yhe
art
dise
ases
Tran
spor
tC
rash
es
Uri
nary
Sys
tem
diso
rder
s
CN
S in
fect
ions
Suic
ide
Vir
al d
isea
ses
Mis
cella
neou
s
4200
Isch
aem
ic h
eart
dise
ases
Neo
plas
ms
Dia
bete
s M
ellit
us
Hyp
erte
nsiv
edi
seas
es
Res
pira
tory
diso
rder
s
Live
r D
isea
ses
Cer
ebro
vasc
ular
dise
ases
Pulm
onar
yhe
art
dise
ases
Dis
ease
s of
urin
ary
syst
em
Tube
rcul
osis
Tran
spor
tcr
ashe
s
CN
S di
sord
ers
Oth
er b
acte
rial
dise
ases
Oth
er d
isea
ses
ofth
e ci
rcul
ator
ysy
stem
Mis
cella
neou
s
5323
Isch
aem
ic h
eart
dise
ases
Dia
bete
s M
ellit
us
Hyp
erte
nsiv
edi
seas
es
Neo
plas
ms
Res
pira
tory
diso
rder
s
Cer
ebro
vasc
ular
dise
ases
Pulm
onar
y he
art
dise
ases
Uri
nary
Sys
tem
diso
rder
s
Live
r di
seas
es
Tube
rcul
osis
Dis
ease
s of
the
Ner
vous
Sys
tem
Inte
stin
alin
fect
ious
dis
ease
s
Oth
er b
acte
rial
dise
ases
Tran
spor
tcr
ashe
s
Mis
cella
neou
s
1239
0
Isch
aem
ic h
eart
dise
ases
Neo
plas
ms
Dia
bete
s M
ellit
us
Res
pira
tory
diso
rder
s
Live
r di
seas
es
Hyp
erte
nsiv
edi
seas
es
Cer
ebro
vasc
ular
dise
ases
Tube
rcul
osis
Pulm
onar
y he
art
dise
ases
Uri
nary
Sys
tem
diso
rder
s
Tran
spor
tC
rash
es
Peri
nata
l de
aths
Bur
ns
CN
S di
sord
ers
Mis
cella
neou
s
3181
1
Mis
cella
neou
s in
clud
es a
ll ot
her
cond
itio
ns w
ith
smal
ler
num
bers
aft
er t
he f
irst
14
caus
es
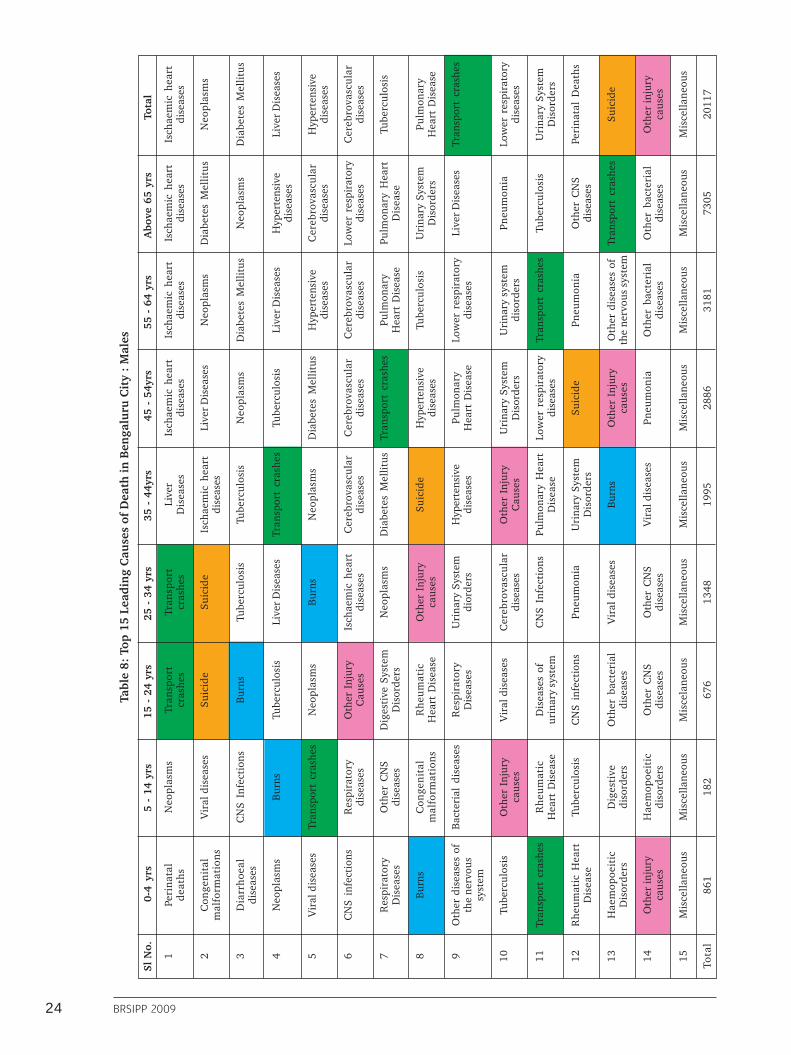
24 BRSIPP 2009
Sl N
o.0-
4 yr
s5
- 14
yrs
15 -
24
yrs
25 -
34
yrs
35 -
44y
rs45
- 5
4yrs
55 -
64
yrs
Abo
ve 6
5 yr
sTo
tal
1 2 3 4 5 6 7 8 9 10 11 12 13 14 15
Tota
l
Peri
nata
lde
aths
Con
geni
tal
mal
form
atio
ns
Dia
rrho
eal
dise
ases
Neo
plas
ms
Vir
al d
isea
ses
CN
S in
fect
ions
Res
pira
tory
Dis
ease
s
Bur
ns
Oth
er d
isea
ses
ofth
e ne
rvou
ssy
stem
Tube
rcul
osis
Tran
spor
t cr
ashe
s
Rhe
umat
ic H
eart
Dis
ease
Hae
mop
oeit
icD
isor
ders
Oth
er in
jury
caus
es
Mis
cella
neou
s
861
Tabl
e 8:
Top
15
Lead
ing
Cau
ses
of D
eath
in B
enga
luru
Cit
y :
Mal
es
Neo
plas
ms
Vir
al d
isea
ses
CN
S In
fect
ions
Bur
ns
Tran
spor
t cr
ashe
s
Res
pira
tory
dise
ases
Oth
er C
NS
dise
ases
Con
geni
tal
mal
form
atio
ns
Bac
teri
al d
isea
ses
Oth
er I
njur
yca
uses
Rhe
umat
icH
eart
Dis
ease
Tube
rcul
osis
Dig
esti
vedi
sord
ers
Hae
mop
oeit
icdi
sord
ers
Mis
cella
neou
s
182
Tran
spor
tcr
ashe
s
Suic
ide
Bur
ns
Tube
rcul
osis
Neo
plas
ms
Oth
er I
njur
yC
ause
s
Dig
esti
ve S
yste
mD
isor
ders
Rhe
umat
icH
eart
Dis
ease
Res
pira
tory
Dis
ease
s
Vir
al d
isea
ses
Dis
ease
s of
urin
ary
syst
em
CN
S in
fect
ions
Oth
er b
acte
rial
dise
ases
Oth
er C
NS
dise
ases
Mis
cela
neou
s
676
Tran
spor
tcr
ashe
s
Suic
ide
Tube
rcul
osis
Live
r D
isea
ses
Bur
ns
Isch
aem
ic h
eart
dise
ases
Neo
plas
ms
Oth
er I
njur
yca
uses
Uri
nary
Sys
tem
dior
ders
Cer
ebro
vasc
ular
dise
ases
CN
S In
fect
ions
Pneu
mon
ia
Vir
al d
isea
ses
Oth
er C
NS
dise
ases
Mis
cella
neou
s
1348
Live
rD
isea
ses
Isch
aem
ic h
eart
dise
ases
Tube
rcul
osis
Tran
spor
t cr
ashe
s
Neo
plas
ms
Cer
ebro
vasc
ular
dise
ases
Dia
bete
s M
ellit
us
Suic
ide
Hyp
erte
nsiv
edi
seas
es
Oth
er I
njur
yC
ause
s
Pulm
onar
y H
eart
Dis
ease
Uri
nary
Sys
tem
Dis
orde
rs
Bur
ns
Vir
al d
isea
ses
Mis
cella
neou
s
1995
Isch
aem
ic h
eart
dise
ases
Live
r D
isea
ses
Neo
plas
ms
Tube
rcul
osis
Dia
bete
s M
ellit
us
Cer
ebro
vasc
ular
dise
ases
Tran
spor
t cr
ashe
s
Hyp
erte
nsiv
edi
seas
es
Pulm
onar
yH
eart
Dis
ease
Uri
nary
Sys
tem
Dis
orde
rs
Low
er r
espi
rato
rydi
seas
es
Suic
ide
Oth
er I
njur
yca
uses
Pneu
mon
ia
Mis
cella
neou
s
2886
Isch
aem
ic h
eart
dise
ases
Neo
plas
ms
Dia
bete
s M
ellit
us
Live
r D
isea
ses
Hyp
erte
nsiv
edi
seas
es
Cer
ebro
vasc
ular
dise
ases
Pulm
onar
yH
eart
Dis
ease
Tube
rcul
osis
Low
er r
espi
rato
rydi
seas
es
Uri
nary
sys
tem
diso
rder
s
Tran
spor
t cr
ashe
s
Pneu
mon
ia
Oth
er d
isea
ses
ofth
e ne
rvou
s sy
stem
Oth
er b
acte
rial
dise
ases
Mis
cella
neou
s
3181
Isch
aem
ic h
eart
dise
ases
Dia
bete
s M
ellit
us
Neo
plas
ms
Hyp
erte
nsiv
edi
seas
es
Cer
ebro
vasc
ular
dise
ases
Low
er r
espi
rato
rydi
seas
es
Pulm
onar
y H
eart
Dis
ease
Uri
nary
Sys
tem
Dis
orde
rs
Live
r D
isea
ses
Pneu
mon
ia
Tube
rcul
osis
Oth
er C
NS
dise
ases
Tran
spor
t cr
ashe
s
Oth
er b
acte
rial
dise
ases
Mis
cella
neou
s
7305
Isch
aem
ic h
eart
dise
ases
Neo
plas
ms
Dia
bete
s M
ellit
us
Live
r D
isea
ses
Hyp
erte
nsiv
edi
seas
es
Cer
ebro
vasc
ular
dise
ases
Tube
rcul
osis
Pulm
onar
yH
eart
Dis
ease
Tran
spor
t cr
ashe
s
Low
er r
espi
rato
rydi
seas
es
Uri
nary
Sys
tem
Dis
orde
rs
Peri
nata
l D
eath
s
Suic
ide
Oth
er in
jury
caus
es
Mis
cella
neou
s
2011
7

25
Sl N
o.0-
4 yr
s5
- 14
yrs
15 -
24
yrs
25 -
34
yrs
35 -
44y
rs45
- 5
4yrs
55 -
64
yrs
Abo
ve 6
5 yr
sTo
tal
1 2 3 4 5 6 7 8 9 10 11 12 13 14 15
Tota
l
Peri
nata
l de
aths
Con
geni
tal
mal
form
atio
ns
Dia
rrho
eal
Dis
ease
s
CN
S in
fect
ions
Vir
al d
isea
ses
Bur
ns
Neo
plas
ms
Oth
er C
NS
dise
ases
Pneu
mon
ia
Tran
spor
t cr
ashe
s
Oth
er I
njur
yca
uses
Tube
rcul
osis
Mal
nutr
itio
n
Rhe
umat
ic H
eart
Dis
ease
Mis
cella
neou
s
521
Tabl
e 9:
Top
15
Lead
ing
Cau
ses
of D
eath
in B
enga
luru
Cit
y :
Fem
ales
Vir
al d
isea
ses
Bur
ns
Neo
plas
ms
Tran
spor
t cr
ashe
s
Dia
rrho
eal
Dis
ease
s
Rhe
umat
icH
eart
Dis
ease
Tube
rcul
osis
Oth
er C
NS
Dis
ease
s
Pneu
mon
ia
Hae
mop
oeit
icD
isor
ders
Con
geni
tal
mal
form
atio
ns
Oth
er b
acte
rial
dise
ases
CN
S in
fect
ions
Mal
aria
Mis
cella
neou
s
Bur
ns
Suic
ide
Mat
erna
l D
eath
s
Tube
rcul
osis
Res
pira
tory
Dis
ease
s
Neo
plas
ms
Live
r D
isea
ses
Rhe
umat
icH
eart
Dis
ease
Tran
spor
t cr
ashe
s
Uri
nary
Sys
tem
Dis
orde
rs
Hae
mop
oeit
icD
isor
ders
Vir
al d
isea
ses
Oth
er I
njur
yC
ause
s
Oth
er b
acte
rial
dise
ases
Mis
cella
neou
s
609
Bur
ns
Suic
ide
Neo
plas
m
Tube
rcul
osis
Res
pira
tory
Dis
ease
s
Mat
erna
l D
eath
s
Isch
aem
ic h
eart
dise
ases
Rhe
umat
iche
art
Dis
ease
Pneu
mon
ia
Dia
bete
s M
ellit
us
Cer
ebro
vasc
ular
dise
ases
Live
r D
isea
ses
Vir
al d
isea
ses
Hae
mop
oeit
icD
isor
ders
Mis
cella
neou
s
780
Neo
plas
ms
Bur
ns
Tube
rcul
osis
Isch
emic
hea
rtdi
seas
es
Live
r D
isea
ses
Dia
bete
s M
ellit
us
Vir
al d
isea
ses
Pneu
mon
ia
Oth
er b
acte
rial
dise
ases
Cer
ebro
vasc
ular
dise
ases
Hyp
erte
nsiv
edi
seas
es
Pulm
onar
y H
eart
Dis
ease
Rhe
umat
ic H
eart
Dis
ease
Uri
nary
Sys
tem
diso
rder
s
Mis
cella
neou
s
727
Neo
plas
ms
Isch
aem
ic h
eart
dise
ases
Dia
bete
s M
ellit
us
Hyp
erte
nsiv
edi
seas
es
Live
r D
isea
ses
Tube
rcul
osis
Cer
ebro
vasc
ular
dise
ases
Pulm
onar
yH
eart
Dis
ease
Uri
nary
Syt
emD
isor
ders
Low
er r
espi
rato
rydi
seas
es
Vir
al d
isea
ses
Bur
ns
Oth
er b
acte
rial
dise
ases
Oth
er C
NS
Dis
ease
s
Mis
cella
neou
s
1314
Neo
plas
ms
Isch
aem
ic h
eart
dise
ases
Dia
bete
s M
ellit
us
Hyp
erte
nsiv
edi
seas
es
Cer
ebro
vasc
ular
dise
ases
Uri
nary
Sys
tem
Dis
orde
rs
Mal
ign
ant
neop
lasm
s of
geni
tour
inar
yor
gan
s
Pulm
onar
y he
art
Dis
ease
Tube
rcul
osis
Low
er r
espi
rato
rydi
seas
es
Live
r D
isea
ses
Pneu
mon
ia
Oth
er b
acte
rial
dise
ases
Oth
er C
ircu
lato
rydi
sord
ers
Mis
cella
neou
s
1663
Isch
aem
ic h
eart
dise
ases
Dia
bete
s M
ellit
us
Hyp
erte
nsiv
edi
seas
es
Neo
plas
ms
Cer
ebro
vasc
ular
dise
ases
Low
er r
espi
rato
rydi
seas
es
Pulm
onar
y H
eart
Dis
ease
Uri
nary
Sys
tem
Dis
orde
rs
Pneu
mon
ia
Oth
er C
NS
Dis
ease
s
Live
r D
isea
ses
Tube
rcul
osis
Dia
rrho
eal
Dis
ease
s
Hae
mop
oeit
icD
isor
ders
Mis
cella
neou
s
5085
Isch
aem
ic h
eart
dise
ases
Neo
plas
ms
Dia
bete
s m
ellit
us
Hyp
erte
nsiv
edi
seas
es
Bur
ns
Cer
ebro
vasc
ular
dise
ases
Pulm
onar
y he
art
Dis
ease
Uri
nary
Sys
tem
Dis
orde
rs
Tube
rcul
osis
Low
er r
espi
rato
rydi
seas
es
Peri
nata
l D
eath
s
Live
r D
isea
ses
Suic
ide
Pneu
mon
ia
Mis
cella
neou
s
1169
4
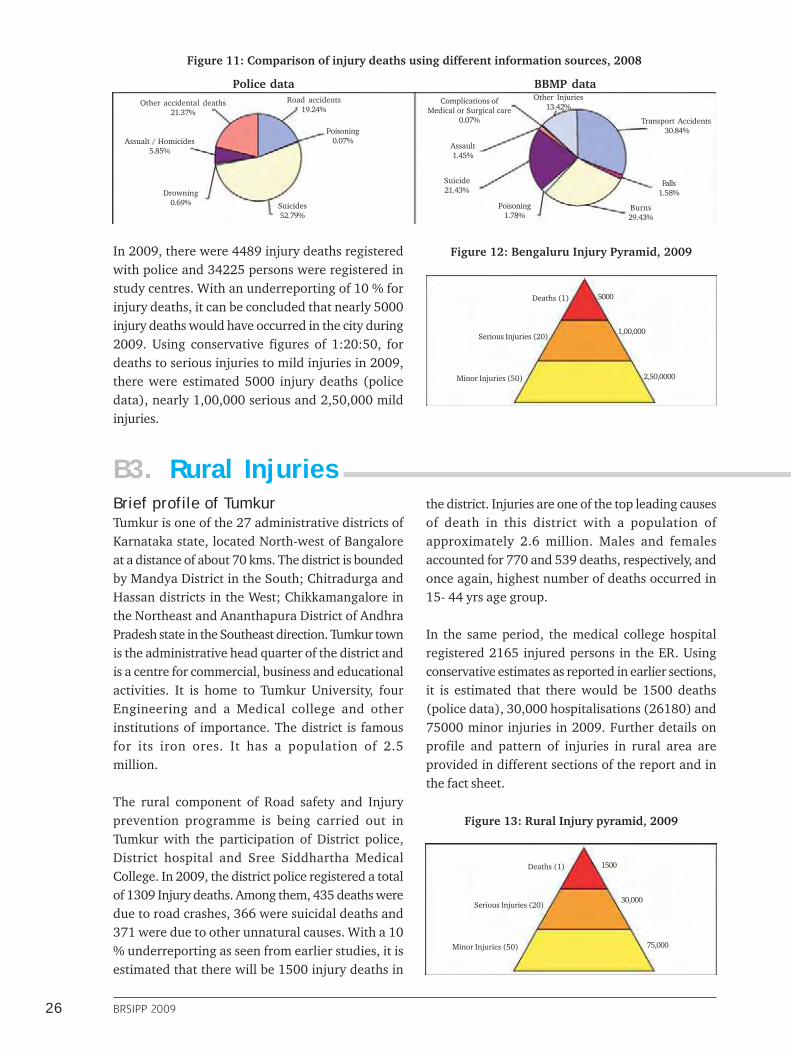
26 BRSIPP 2009
Figure 11: Comparison of injury deaths using different information sources, 2008
Road accidents19.24%
Poisoning0.07%
Suicides52.79%
Drowning0.69%
Assualt / Homicides5.85%
Other accidental deaths21.37%
Transport Accidents30.84%
Falls1.58%
Burns29.43%
Poisoning1.78%
Suicide21.43%
Assault1.45%
Complications ofMedical or Surgical care
0.07%
Other Injuries13.42%
Police data BBMP data
Deaths (1)
Serious Injuries (20)
Minor Injuries (50)
5000
1,00,000
2,50,0000
Deaths (1)
Serious Injuries (20)
Minor Injuries (50)
1500
30,000
75,000
B3. Rural Injuries
In 2009, there were 4489 injury deaths registeredwith police and 34225 persons were registered instudy centres. With an underreporting of 10 % forinjury deaths, it can be concluded that nearly 5000injury deaths would have occurred in the city during2009. Using conservative figures of 1:20:50, fordeaths to serious injuries to mild injuries in 2009,there were estimated 5000 injury deaths (policedata), nearly 1,00,000 serious and 2,50,000 mildinjuries.
Figure 12: Bengaluru Injury Pyramid, 2009
Brief profile of TumkurTumkur is one of the 27 administrative districts ofKarnataka state, located North-west of Bangaloreat a distance of about 70 kms. The district is boundedby Mandya District in the South; Chitradurga andHassan districts in the West; Chikkamangalore inthe Northeast and Ananthapura District of AndhraPradesh state in the Southeast direction. Tumkur townis the administrative head quarter of the district andis a centre for commercial, business and educationalactivities. It is home to Tumkur University, fourEngineering and a Medical college and otherinstitutions of importance. The district is famousfor its iron ores. It has a population of 2.5million.
The rural component of Road safety and Injuryprevention programme is being carried out inTumkur with the participation of District police,District hospital and Sree Siddhartha MedicalCollege. In 2009, the district police registered a totalof 1309 Injury deaths. Among them, 435 deaths weredue to road crashes, 366 were suicidal deaths and371 were due to other unnatural causes. With a 10% underreporting as seen from earlier studies, it isestimated that there will be 1500 injury deaths in
the district. Injuries are one of the top leading causesof death in this district with a population ofapproximately 2.6 million. Males and femalesaccounted for 770 and 539 deaths, respectively, andonce again, highest number of deaths occurred in15- 44 yrs age group.
In the same period, the medical college hospitalregistered 2165 injured persons in the ER. Usingconservative estimates as reported in earlier sections,it is estimated that there would be 1500 deaths(police data), 30,000 hospitalisations (26180) and75000 minor injuries in 2009. Further details onprofile and pattern of injuries in rural area areprovided in different sections of the report and inthe fact sheet.
Figure 13: Rural Injury pyramid, 2009

27
B4. RTIs and suicides are major injury causesAmong the various causes of injuries, RTIs are aleading cause of deaths and hospitalisations. RTIsaccounted for 31% of deaths as per data of vitalstatistics division, 20% as per police records and62.7% of hospitalisations in Bangalore. In the ruralarea the contribution was 34.4% and 51.5 %,respectively (Fig. 14).
Suicides or Deliberate self harm was the secondleading cause with 1325 deaths (CCRB data) and1509 hospital contacts. The intent is thedifferentiating factor between natural, suicidal andhomicidal deaths and requires skills withinvestigative agencies and systematic documentationand review of events prior to death.
Burns can be accidental, suicidal or homicidal andonce again requires a careful scrutiny of intent. As
per data in table 9, burns were the leading cause ofmortality among women in 15- 24yrs and 25 – 34yrs age groups (BBMP data).
Poisoning due to a variety of substances (commonones being Organophosphorus compounds anddrugs) is a common contributor for suicides. It isimportant to differentiate the intent here to separatesuicidal and accidental (occasional homicidalones).
Even though work related / occupational injuriesare quite common, their contributions for deaths werenot exactly available in the official reports.
There were no major disasters that contributedfor deaths and injuries during the year 2009 in thecity.
Figure 14: Comparison of the distribution of causes of injury deaths in urban and rural areas 2009
RuralUrban
Poisoning14.96%
Drowning13.06%
Hanging12.51%Work place injury
0.55%
Others14.89%
Road Traffic Injury34.44%
Fall2.14%
Assault/Violence0.08%
Burns7.36%
Transport Accidents30.84%
Falls1.58%
Burns29.43%
Poisoning1.78%
Suicide21.43%
Assault1.45%
Complications ofMedical or Surgical care
0.07%
Other Injuries13.42%
Fatal Injuries
Road trafficinjury
62.70%
Fall17.30%
Assault7.40%
Poisoning4.20%
Animal bites4%
Fall of object1.80%
Others2.70%
Road traffic injury51.50%
Animal bites4.70%
Fall of object2.00%
Others3.20% Fall
5.00%
Assault19.40%
Burns2.20%
Poisoning12.00%
Non-fatal Injuries
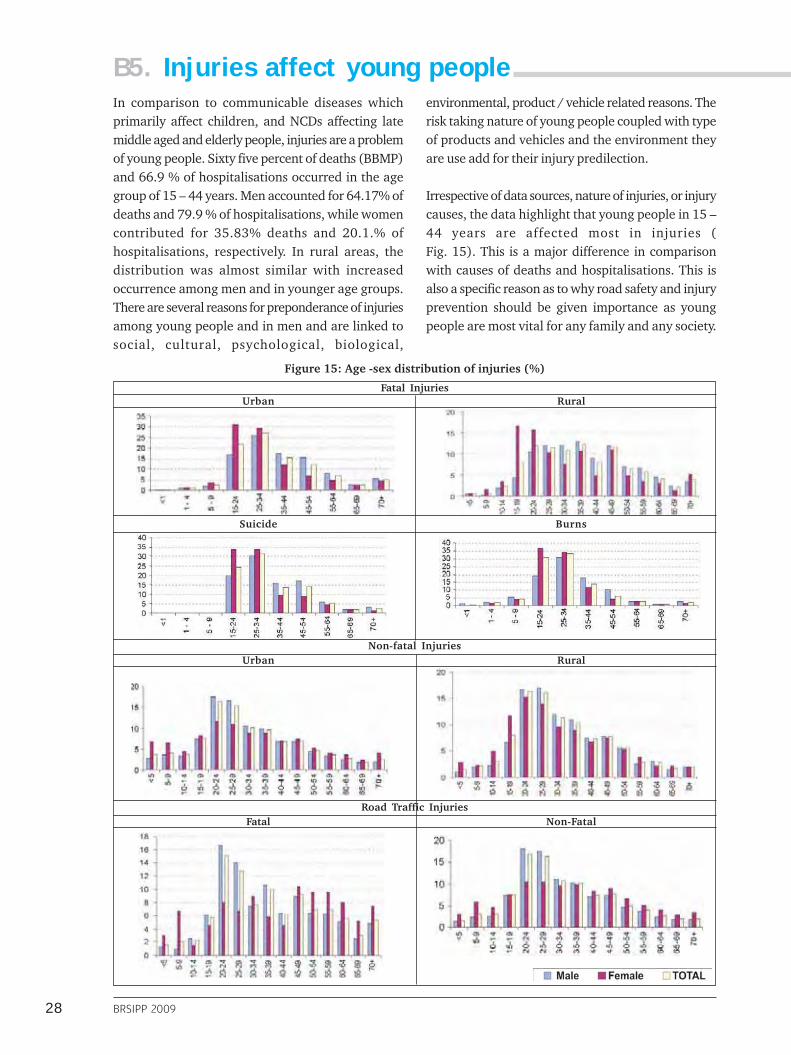
28 BRSIPP 2009
B5. Injuries affect young peopleIn comparison to communicable diseases whichprimarily affect children, and NCDs affecting latemiddle aged and elderly people, injuries are a problemof young people. Sixty five percent of deaths (BBMP)and 66.9 % of hospitalisations occurred in the agegroup of 15 – 44 years. Men accounted for 64.17% ofdeaths and 79.9 % of hospitalisations, while womencontributed for 35.83% deaths and 20.1.% ofhospitalisations, respectively. In rural areas, thedistribution was almost similar with increasedoccurrence among men and in younger age groups.There are several reasons for preponderance of injuriesamong young people and in men and are linked tosocial, cultural, psychological, biological,
environmental, product / vehicle related reasons. Therisk taking nature of young people coupled with typeof products and vehicles and the environment theyare use add for their injury predilection.
Irrespective of data sources, nature of injuries, or injurycauses, the data highlight that young people in 15 –44 years are affected most in injuries (Fig. 15). This is a major difference in comparisonwith causes of deaths and hospitalisations. This isalso a specific reason as to why road safety and injuryprevention should be given importance as youngpeople are most vital for any family and any society.
Figure 15: Age -sex distribution of injuries (%)
Fatal InjuriesUrban Rural
Suicide Burns
Non-fatal InjuriesUrban Rural
Road Traffic InjuriesFatal Non-Fatal
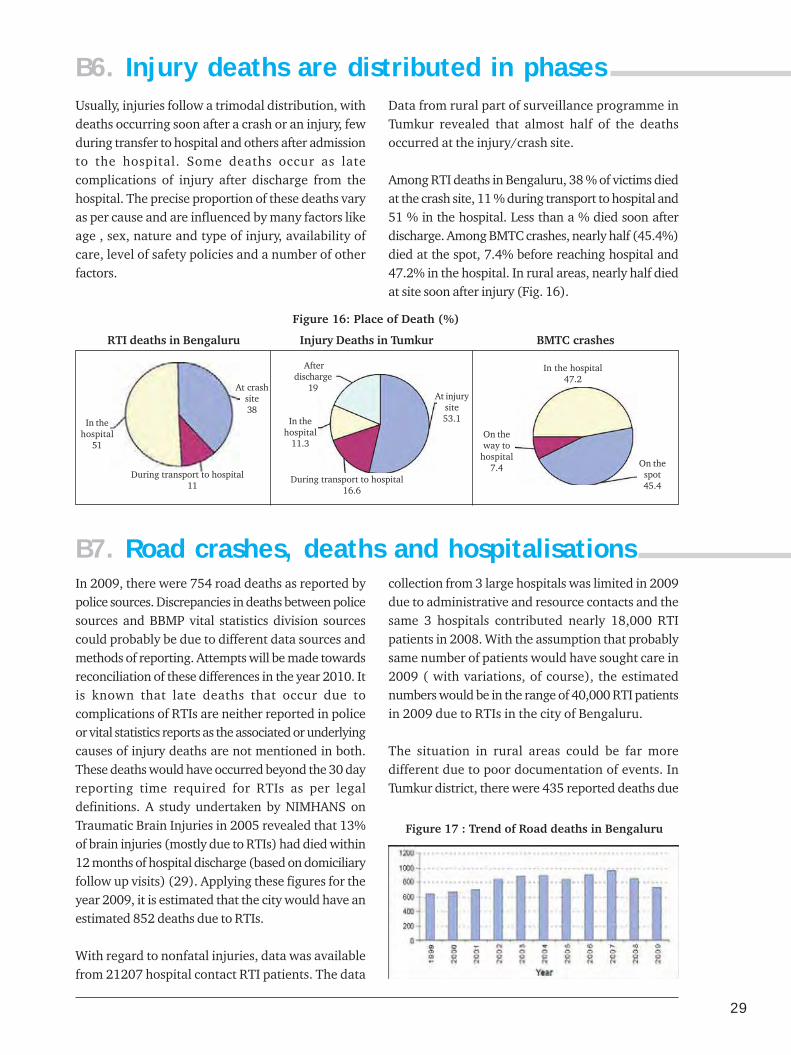
29
Usually, injuries follow a trimodal distribution, withdeaths occurring soon after a crash or an injury, fewduring transfer to hospital and others after admissionto the hospital. Some deaths occur as latecomplications of injury after discharge from thehospital. The precise proportion of these deaths varyas per cause and are influenced by many factors likeage , sex, nature and type of injury, availability ofcare, level of safety policies and a number of otherfactors.
Data from rural part of surveillance programme inTumkur revealed that almost half of the deathsoccurred at the injury/crash site.
Among RTI deaths in Bengaluru, 38 % of victims diedat the crash site, 11 % during transport to hospital and51 % in the hospital. Less than a % died soon afterdischarge. Among BMTC crashes, nearly half (45.4%)died at the spot, 7.4% before reaching hospital and47.2% in the hospital. In rural areas, nearly half diedat site soon after injury (Fig. 16).
B6. Injury deaths are distributed in phases
Figure 16: Place of Death (%)
RTI deaths in Bengaluru Injury Deaths in Tumkur BMTC crashes
On thespot45.4
On theway to
hospital7.4
In the hospital47.2
At injurysite53.1
During transport to hospital16.6
In thehospital
11.3
Afterdischarge
19At crashsite38
During transport to hospital11
In thehospital
51
In 2009, there were 754 road deaths as reported bypolice sources. Discrepancies in deaths between policesources and BBMP vital statistics division sourcescould probably be due to different data sources andmethods of reporting. Attempts will be made towardsreconciliation of these differences in the year 2010. Itis known that late deaths that occur due tocomplications of RTIs are neither reported in policeor vital statistics reports as the associated or underlyingcauses of injury deaths are not mentioned in both.These deaths would have occurred beyond the 30 dayreporting time required for RTIs as per legaldefinitions. A study undertaken by NIMHANS onTraumatic Brain Injuries in 2005 revealed that 13%of brain injuries (mostly due to RTIs) had died within12 months of hospital discharge (based on domiciliaryfollow up visits) (29). Applying these figures for theyear 2009, it is estimated that the city would have anestimated 852 deaths due to RTIs.
With regard to nonfatal injuries, data was availablefrom 21207 hospital contact RTI patients. The data
collection from 3 large hospitals was limited in 2009due to administrative and resource contacts and thesame 3 hospitals contributed nearly 18,000 RTIpatients in 2008. With the assumption that probablysame number of patients would have sought care in2009 ( with variations, of course), the estimatednumbers would be in the range of 40,000 RTI patientsin 2009 due to RTIs in the city of Bengaluru.
The situation in rural areas could be far moredifferent due to poor documentation of events. InTumkur district, there were 435 reported deaths due
B7. Road crashes, deaths and hospitalisations
Figure 17 : Trend of Road deaths in Bengaluru
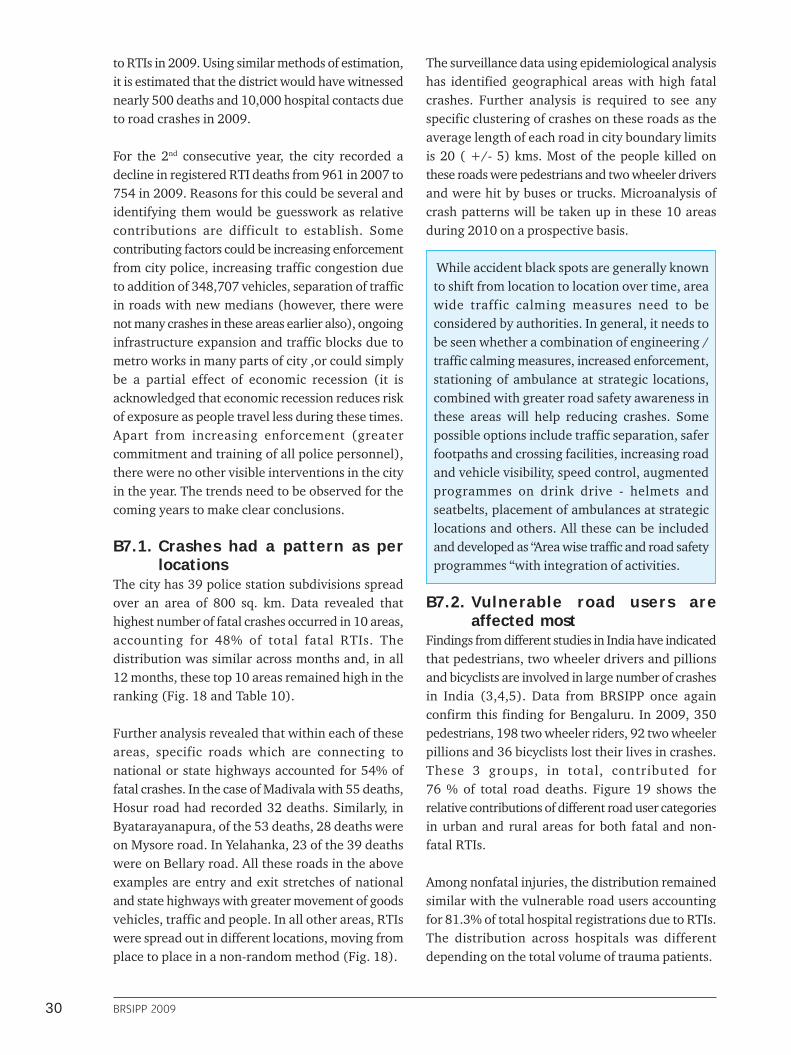
30 BRSIPP 2009
to RTIs in 2009. Using similar methods of estimation,it is estimated that the district would have witnessednearly 500 deaths and 10,000 hospital contacts dueto road crashes in 2009.
For the 2nd consecutive year, the city recorded adecline in registered RTI deaths from 961 in 2007 to754 in 2009. Reasons for this could be several andidentifying them would be guesswork as relativecontributions are difficult to establish. Somecontributing factors could be increasing enforcementfrom city police, increasing traffic congestion dueto addition of 348,707 vehicles, separation of trafficin roads with new medians (however, there werenot many crashes in these areas earlier also), ongoinginfrastructure expansion and traffic blocks due tometro works in many parts of city ,or could simplybe a partial effect of economic recession (it isacknowledged that economic recession reduces riskof exposure as people travel less during these times.Apart from increasing enforcement (greatercommitment and training of all police personnel),there were no other visible interventions in the cityin the year. The trends need to be observed for thecoming years to make clear conclusions.
B7.1. Crashes had a pattern as perlocations
The city has 39 police station subdivisions spreadover an area of 800 sq. km. Data revealed thathighest number of fatal crashes occurred in 10 areas,accounting for 48% of total fatal RTIs. Thedistribution was similar across months and, in all12 months, these top 10 areas remained high in theranking (Fig. 18 and Table 10).
Further analysis revealed that within each of theseareas, specific roads which are connecting tonational or state highways accounted for 54% offatal crashes. In the case of Madivala with 55 deaths,Hosur road had recorded 32 deaths. Similarly, inByatarayanapura, of the 53 deaths, 28 deaths wereon Mysore road. In Yelahanka, 23 of the 39 deathswere on Bellary road. All these roads in the aboveexamples are entry and exit stretches of nationaland state highways with greater movement of goodsvehicles, traffic and people. In all other areas, RTIswere spread out in different locations, moving fromplace to place in a non-random method (Fig. 18).
The surveillance data using epidemiological analysishas identified geographical areas with high fatalcrashes. Further analysis is required to see anyspecific clustering of crashes on these roads as theaverage length of each road in city boundary limitsis 20 ( +/- 5) kms. Most of the people killed onthese roads were pedestrians and two wheeler driversand were hit by buses or trucks. Microanalysis ofcrash patterns will be taken up in these 10 areasduring 2010 on a prospective basis.
While accident black spots are generally knownto shift from location to location over time, areawide traffic calming measures need to beconsidered by authorities. In general, it needs tobe seen whether a combination of engineering /traffic calming measures, increased enforcement,stationing of ambulance at strategic locations,combined with greater road safety awareness inthese areas will help reducing crashes. Somepossible options include traffic separation, saferfootpaths and crossing facilities, increasing roadand vehicle visibility, speed control, augmentedprogrammes on drink drive - helmets andseatbelts, placement of ambulances at strategiclocations and others. All these can be includedand developed as “Area wise traffic and road safetyprogrammes “with integration of activities.
B7.2. Vulnerable road users areaffected most
Findings from different studies in India have indicatedthat pedestrians, two wheeler drivers and pillionsand bicyclists are involved in large number of crashesin India (3,4,5). Data from BRSIPP once againconfirm this finding for Bengaluru. In 2009, 350pedestrians, 198 two wheeler riders, 92 two wheelerpillions and 36 bicyclists lost their lives in crashes.These 3 groups, in total, contributed for76 % of total road deaths. Figure 19 shows therelative contributions of different road user categoriesin urban and rural areas for both fatal and non-fatal RTIs.
Among nonfatal injuries, the distribution remainedsimilar with the vulnerable road users accountingfor 81.3% of total hospital registrations due to RTIs.The distribution across hospitals was differentdepending on the total volume of trauma patients.
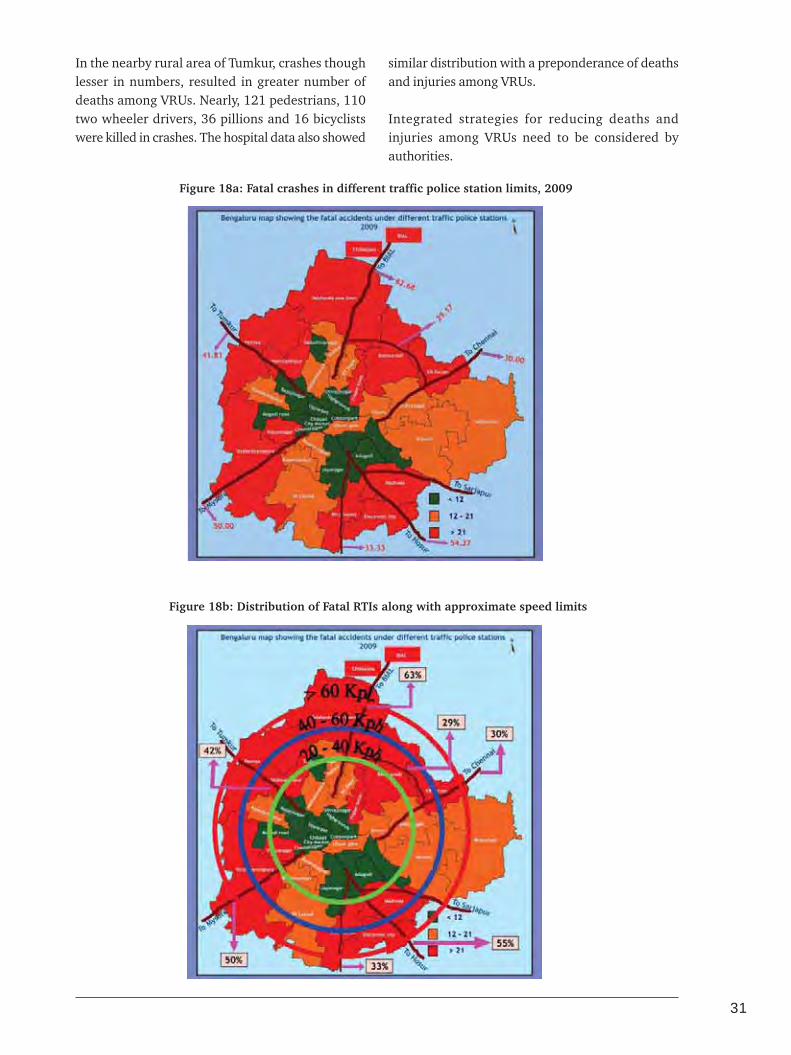
31
In the nearby rural area of Tumkur, crashes thoughlesser in numbers, resulted in greater number ofdeaths among VRUs. Nearly, 121 pedestrians, 110two wheeler drivers, 36 pillions and 16 bicyclistswere killed in crashes. The hospital data also showed
similar distribution with a preponderance of deathsand injuries among VRUs.
Integrated strategies for reducing deaths andinjuries among VRUs need to be considered byauthorities.
Figure 18a: Fatal crashes in different traffic police station limits, 2009
Figure 18b: Distribution of Fatal RTIs along with approximate speed limits

32 BRSIPP 2009
Sl N
oA
rea
Tota
lD
eath
s20
08
Tota
lD
eath
s20
09M
ajor
Roa
ds
Tota
lPe
dest
rian
sTw
oW
heel
ers
Cyc
list
sC
arD
rive
rsLo
rry
Dri
vers
Oth
ers
1B
yata
raya
napu
ra4
85
6M
ysor
e R
oad
28
23
24
10
44
Ken
geri
Rin
g R
oad
5N
ice
Roa
d6
80Fe
et R
oad
4O
ther
s1
32
Mad
ival
a5
65
5H
osur
Roa
d3
22
82
33
10
0R
ing
Roa
d1
3O
ther
s1
03
K.R
. Pur
am9
84
0O
ld M
adra
s R
oad
12
12
24
12
01
Rin
g R
oad
11
ITPL
Roa
d3
Oth
ers
14
4Ye
laha
nka
45
39
Bel
lary
Roa
d2
32
01
22
20
3D
odda
balla
pur
Roa
d9
Oth
ers
75
Elec
tron
ic C
ity
37
Hos
ur R
oad
18
19
12
22
02
Kon
ena
Agr
ahar
a ga
te6
Oth
ers
13
6Ye
shw
anta
pura
49
30
Tum
kur
Roa
d1
11
51
30
02
Jala
halli
7H
MT
Mai
n R
oad
5O
ther
s7
7D
evan
ahal
li2
8B
ella
ry R
oad
19
15
10
01
11
Oth
ers
98
Peen
ya5
02
5Tu
mku
r R
oad
12
71
13
00
4H
esar
agha
tta
Roa
d3
Oth
ers
10
9B
anas
awad
i3
22
4R
ing
Roa
d7
13
81
00
2O
ld M
adra
s R
oad
4O
ther
s1
31
0M
ico
Layo
ut2
62
4B
anne
rgha
tta
Roa
d8
11
92
10
1B
TM L
ayou
t5
Hos
ur R
oad
3O
ther
s8
Tabl
e 10
: L
ocat
ion
of
cras
hes
in
hig
h r
isk
area
s of
Ban
galo
re

33
Figure 19: Road User categories in RTI deaths and injuries (%), 2009
UrbanFatal Non-fatal
RuralFatal Non-fatal
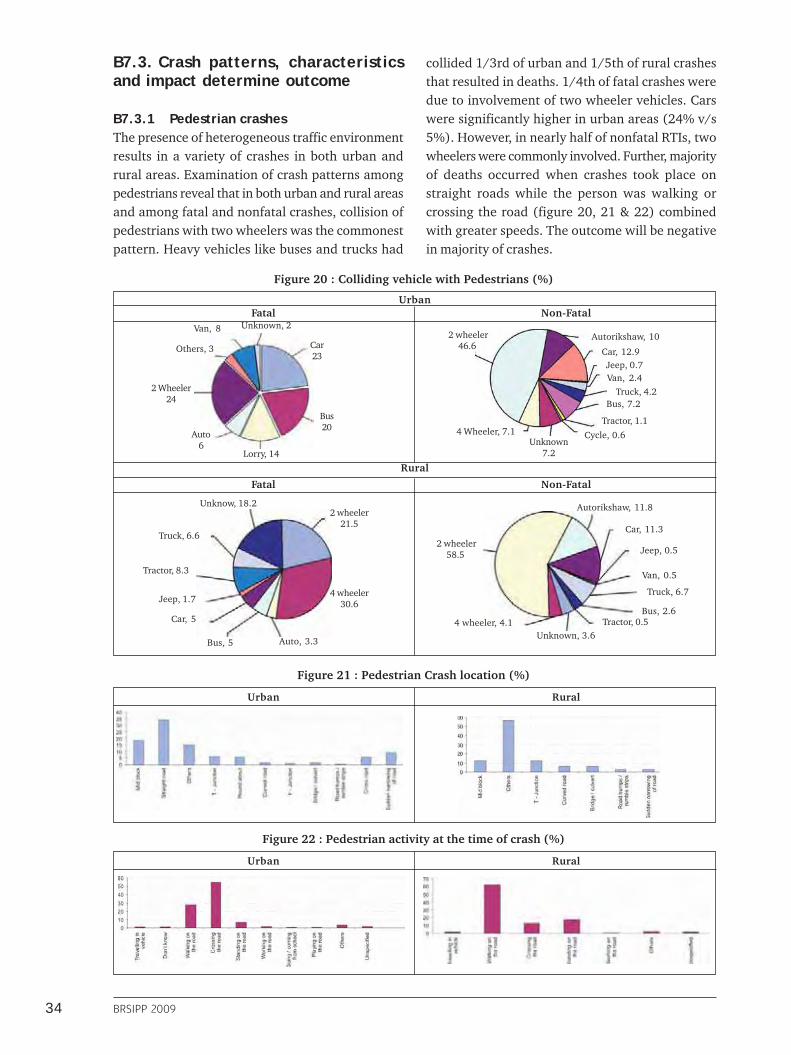
34 BRSIPP 2009
Figure 21 : Pedestrian Crash location (%)
Urban Rural
Figure 22 : Pedestrian activity at the time of crash (%)
Urban Rural
B7.3. Crash patterns, characteristicsand impact determine outcome
B7.3.1 Pedestrian crashesThe presence of heterogeneous traffic environmentresults in a variety of crashes in both urban andrural areas. Examination of crash patterns amongpedestrians reveal that in both urban and rural areasand among fatal and nonfatal crashes, collision ofpedestrians with two wheelers was the commonestpattern. Heavy vehicles like buses and trucks had
Figure 20 : Colliding vehicle with Pedestrians (%)
Fatal Non-Fatal
Cycle, 0.6Unknown
7.2
4 Wheeler, 7.1
2 wheeler46.6
Autorikshaw, 10
Car, 12.9Jeep, 0.7Van, 2.4
Truck, 4.2Bus, 7.2
Tractor, 1.1
2 wheeler21.5
4 wheeler30.6
Auto, 3.3Bus, 5
Car, 5
Jeep, 1.7
Tractor, 8.3
Truck, 6.6
Unknow, 18.2
Unknown, 3.6 4 wheeler, 4.1
2 wheeler58.5
Autorikshaw, 11.8
Car, 11.3
Jeep, 0.5
Van, 0.5
Truck, 6.7
Bus, 2.6Tractor, 0.5
collided 1/3rd of urban and 1/5th of rural crashesthat resulted in deaths. 1/4th of fatal crashes weredue to involvement of two wheeler vehicles. Carswere significantly higher in urban areas (24% v/s5%). However, in nearly half of nonfatal RTIs, twowheelers were commonly involved. Further, majorityof deaths occurred when crashes took place onstraight roads while the person was walking orcrossing the road (figure 20, 21 & 22) combinedwith greater speeds. The outcome will be negativein majority of crashes.
Urban
Fatal Non-Fatal
Rural
Car23
Bus20
Lorry, 14
Auto6
2 Wheeler24
Others, 3
Van, 8 Unknown, 2