bentonite/argillite interface
TRANSCRIPT
Sealing efficiency of an argillite-bentonite plug subjected to gas pressure, in the context of deep underground radioactive waste storage
FORGE Report D3-08; D3-24, D3-30 and D3-35 – VER.0
Name Organisation Signature Date
Compiled Dr. Jiang Feng Liu; Pr. Frédéric Skoczylas; Dr. Catherine Davy
Ecole Centrale de Lille – LML 4th December 2013
Verified RP Shaw BGS
7th December 2015
Approved RP Shaw BGS
7th December 2015
Keywords Bentonite; argillite; Callovo-oxfordian, gas
Bibliographical reference
Dr. Jiang Feng Liu; Pr. Frédéric Skoczylas; Dr. Catherine Davy. 2013. Sealing efficiency of an argillite-bentonite plug subjected to gas pressure, in the context of deep underground radioactive waste storage.
FORGE Report D3-08; D3-24, D3-30 and D3-35. 112pp.
Euratom 7th Framework Programme Project: FORGE
FORGE Report: D3-08; D3-24, D3-30 and D3-35 – VER.0
i
Fate of repository gases (FORGE)
The multiple barrier concept is the cornerstone of all proposed schemes for underground disposal of radioactive wastes. The concept invokes a series of barriers, both engineered and natural, between the waste and the surface. Achieving this concept is the primary objective of all disposal programmes, from site appraisal and characterisation to repository design and construction. However, the performance of the repository as a whole (waste, buffer, engineering disturbed zone, host rock), and in particular its gas transport properties, are still poorly understood. Issues still to be adequately examined that relate to understanding basic processes include: dilational versus visco-capillary flow mechanisms; long-term integrity of seals, in particular gas flow along contacts; role of the EDZ as a conduit for preferential flow; laboratory to field up-scaling. Understanding gas generation and migration is thus vital in the quantitative assessment of repositories and is the focus of the research in this integrated, multi-disciplinary project. The FORGE project is a pan-European project with links to international radioactive waste management organisations, regulators and academia, specifically designed to tackle the key research issues associated with the generation and movement of repository gasses. Of particular importance are the long-term performance of bentonite buffers, plastic clays, indurated mudrocks and crystalline formations. Further experimental data are required to reduce uncertainty relating to the quantitative treatment of gas in performance assessment. FORGE will address these issues through a series of laboratory and field-scale experiments, including the development of new methods for up-scaling allowing the optimisation of concepts through detailed scenario analysis. The FORGE partners are committed to training and CPD through a broad portfolio of training opportunities and initiatives which form a significant part of the project. Further details on the FORGE project and its outcomes can be accessed at www.FORGEproject.org.
Contact details: Dr. Catherine Davy Maître de conférences HDR/ Lecturer Ecole Centrale de Lille Cité Scientifique CS 20048 F-59651 Villeneuve d'Ascq Cedex France E-mail: [email protected] Tél: (+33).3.20.33.53.62 Fax: (+33).3.20.33.53.52 Page web (version francaise): http://cdavy.ec-lille.fr/ Webpage (English version): http://cdavy.ec-lille.fr/davyev.html Profil Viadeo : http://www.viadeo.com/invitation/catherine-a..davy
Date: December, 4th, 2013 Deliverables D3-08, D3-24, D3-30 and D3-35
1
WP3 FORGE PROJECT
Report corresponding to deliverables n. :
D3-08; D3-24, D3-30 and D3-35
Sealing efficiency of an argillite-bentonite plug subjected
to gas pressure, in the context of deep underground
radioactive waste storage
Dr. Jiang Feng Liu
Pr. Frédéric Skoczylas
Dr. Catherine Davy
Ecole Centrale de Lille – LML, UMR CNRS 8107
Date: December, 4th, 2013 Deliverables D3-08, D3-24, D3-30 and D3-35
2
Contents I - Introduction: scientific context .............................................................................................. 5
II – Materials and experimental methods ................................................................................... 9
II.1 Materials and sample preparation .................................................................................. 10
II.2 Water retention experiments .......................................................................................... 11
II.2.1 Analysis of in situ problem .................................................................................................. 11
II.2.2 Water retention tests under constant volume and free swelling conditions ......................... 11
II.3 Swelling of compacted bentonite (into tube) with gas pressure and water contact ....... 15
II.3.1 Analysis of in situ problem and mock-up description ......................................................... 15
II.3.2 Definition of total equilibrium swelling pressure and effective swelling pressure .............. 18
II.4 Gas breakthrough test .................................................................................................... 18
II.4.1 Why performing the GBT? .................................................................................................. 18
II.4.2 Introduction of experimental method to measure the gas passage ....................................... 18
II.4.3 Definition of discontinuous/continuous gas breakthrough .................................................. 20
III - Water retention tests under constant volume and free swelling conditions ...................... 21
Introduction .......................................................................................................................... 22
III.1 Water retention tests under constant volume conditions .............................................. 23
III.2 Water retention tests under free swelling conditions ................................................... 25
III.2.1 Water retention tests under free swelling conditions and just after compaction ................ 25
III.2.2 Water retention tests under free swelling conditions (after gas permeability tests) ........... 29
III.3 Comparison of water retention tests under free swelling and constant volume
conditions (just after compaction) ........................................................................................ 32
III.4 Conclusion .................................................................................................................... 34
IV - Sealing ability of partially water-saturated bentonite/sand plugs under the effect of
confinement .............................................................................................................................. 35
Introduction .......................................................................................................................... 36
IV.1 Relative gas permeability – preliminary test results .................................................... 36
IV.2 Relative gas permeability study – second series of tests.............................................. 40
IV. 2.1 Mass and volume changes ................................................................................................. 40
IV. 2.2 Initial sample gas permeability.......................................................................................... 45
IV. 2.3 Coupled effects of saturation and confining pressure upon gas permeability ................... 47
Date: December, 4th, 2013 Deliverables D3-08, D3-24, D3-30 and D3-35
3
IV. 2.4 Dry permeability ............................................................................................................... 53
IV.3 Complementary tests (third test series) ........................................................................ 54
IV. 3.1 Mass and volume changes ................................................................................................. 54
IV. 3.2 Effective gas permeability at given RH ............................................................................ 57
IV. 3.3 Dry gas permeability ......................................................................................................... 59
IV. 3.4 Pore volume variation of an oven-dried bentonite/sand plug ............................................ 60
IV.4 Conclusion ................................................................................................................... 62
V - Swelling of compacted bentonite/sand plug (into tube) submitted to gas pressure ........... 64
Introduction .......................................................................................................................... 65
V. 1 Bentonite-sand plug swelling without gas pressure ..................................................... 66
V.1.1 Swelling pressure (SWP) ..................................................................................................... 66
V.1.2 Gas breakthrough test (GBT) .............................................................................................. 68
V.2 Bentonite-sand plug swelling with gas pressure ........................................................... 70
V.2.1 Effect of gas pressure on the swelling pressure of bentonite-sand plug .............................. 70
V.2.2 Effect of gas pressure on the gas breakthrough pressure ..................................................... 72
V.2.3 Effect of re-saturation and/or a decrease in gas pressure..................................................... 73
V.2.4 Effect of gas pressure on plug-tube interface contact pressure ........................................... 77
V. 3 Effect of sample height upon swelling and GBP.......................................................... 78
V. 3.1 Swelling pressure (SWP) .................................................................................................... 79
V. 3.2 Coupling effect between gas pressure and deformation of bentonite-sand plug ................ 80
V. 3.4 Re-saturation of the sample ................................................................................................ 82
V. 3.3 Gas breakthrough test ......................................................................................................... 83
V. 4 Conclusion .................................................................................................................... 84
VI - Swelling and GBP of argillite, bentonite and argillite / bentonite interface ..................... 86
Introduction .......................................................................................................................... 87
VI.1 Swelling and GBP of bentonite/sand plug without tube (samples D1and D2) ............ 87
VI.1.1 Water injection test of plugs D1 and D2 ............................................................................ 87
VI.1.2 Gas breakthrough test of plugs D1 and D2 ........................................................................ 89
VI.2 Swelling and GBP of a bentonite-sand plug with a grooved tube (plugs E1 and E2) . 90
VI. 2.1 Water injection test of plugs E1 and E2 ............................................................................ 90
VI. 2.2 Gas breakthrough test of plugs E1 and E2 ........................................................................ 93
VI.3 Swelling and GBP of bentonite/sand plug+smooth argillite tube ................................ 96
Date: December, 4th, 2013 Deliverables D3-08, D3-24, D3-30 and D3-35
4
VI. 3.1 Water injection tests of plugs F1-1, F1-2 and F1-3 ........................................................... 96
VI. 3.2 Gas breakthrough tests of plugs F1-1, F1-2 and F1-3 ....................................................... 97
VI.4 Swelling and GBP of bentonite/sand plug+grooved argillite tube .............................. 99
VI.4.1 Water injection test of plugs F2-1, F2-2............................................................................. 99
VI.4.2 Gas breakthrough tests of plugs F2-1, F2-2 ..................................................................... 100
V. 5 Conclusion .................................................................................................................. 103
General Conclusion ................................................................................................................ 105
Reference: ............................................................................................................................... 107
Annex 1 .................................................................................................................................. 110
Annex 2 .................................................................................................................................. 111
Date: December, 4th, 2013 Deliverables D3-08, D3-24, D3-30 and D3-35
5
I - Introduction: scientific context
Date: December, 4th, 2013 Deliverables D3-08, D3-24, D3-30 and D3-35
6
The design of long term nuclear waste repositories includes the building of an engineered
barrier around the waste containers, which aims to create a “low permeable zone” around
them (Komine, 2004; Alonso et al., 2006). Bentonite clay has been chosen by several
industrialized countries as a buffer and backfill material to separate radioactive waste from the
surrounding host rock. Its main properties are an extremely low permeability, a self-healing
ability, low ion transport capacity and high chemical stability, together with high
expandability (Kaufhold et al., 2007).
In situ, after water uptake from the host rock, sealing will be obtained due to bentonite
swelling. It will fill the space between the buffer material and the disposal pit wall.
Meanwhile, formation of gas, mainly hydrogen, due to humid corrosion, degradation of
organic matter or water radiolysis, is unavoidable within galleries (Birgersson et al., 2008).
During this process, several questions should be answered to understand the sealing efficiency
of an argillite-bentonite plug subjected to gas pressure, and more specifically:
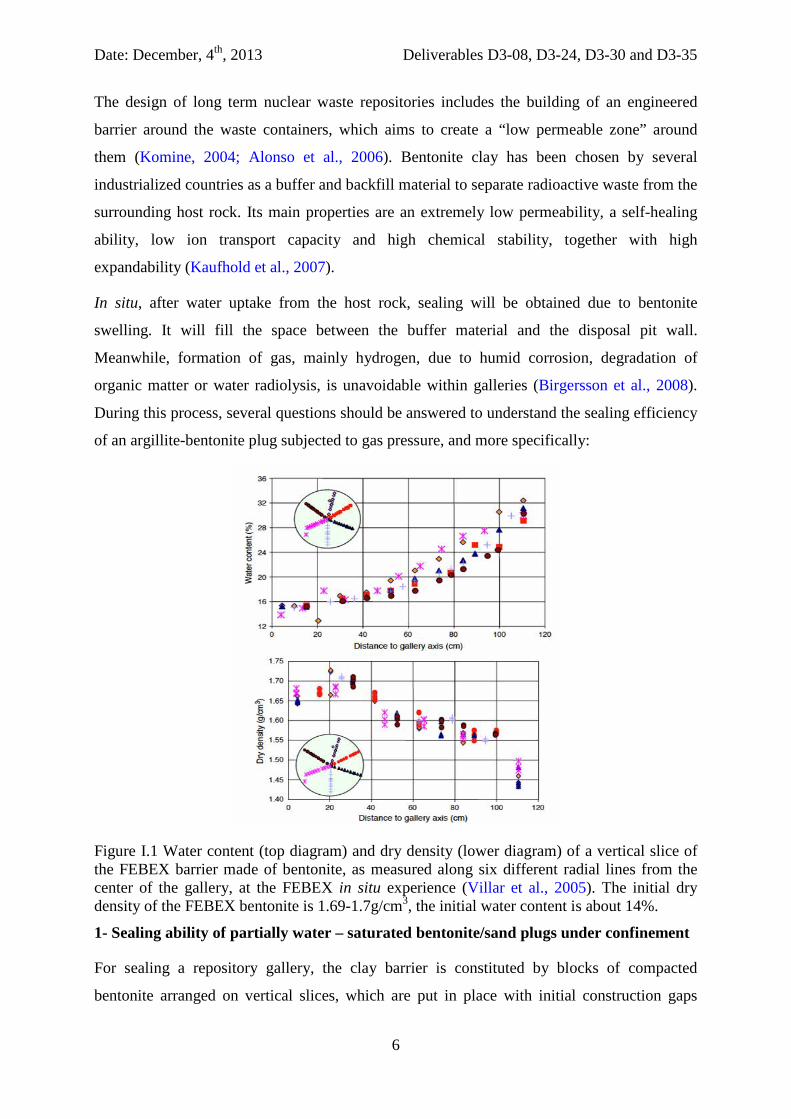
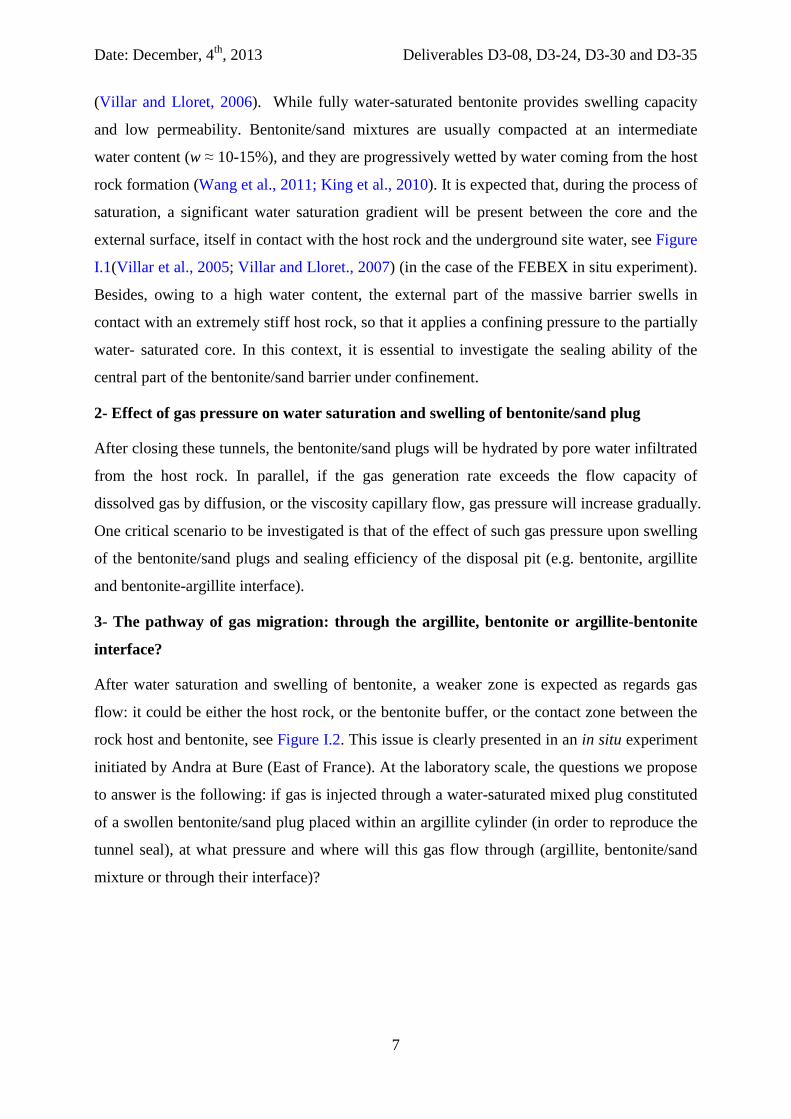
Figure I.1 Water content (top diagram) and dry density (lower diagram) of a vertical slice of the FEBEX barrier made of bentonite, as measured along six different radial lines from the center of the gallery, at the FEBEX in situ experience (Villar et al., 2005). The initial dry density of the FEBEX bentonite is 1.69-1.7g/cm3, the initial water content is about 14%.
1- Sealing ability of partially water – saturated bentonite/sand plugs under confinement
For sealing a repository gallery, the clay barrier is constituted by blocks of compacted
bentonite arranged on vertical slices, which are put in place with initial construction gaps
Date: December, 4th, 2013 Deliverables D3-08, D3-24, D3-30 and D3-35
7
(Villar and Lloret, 2006). While fully water-saturated bentonite provides swelling capacity
and low permeability. Bentonite/sand mixtures are usually compacted at an intermediate
water content (w ≈ 10-15%), and they are progressively wetted by water coming from the host
rock formation (Wang et al., 2011; King et al., 2010). It is expected that, during the process of
saturation, a significant water saturation gradient will be present between the core and the
external surface, itself in contact with the host rock and the underground site water, see Figure
I.1(Villar et al., 2005; Villar and Lloret., 2007) (in the case of the FEBEX in situ experiment).
Besides, owing to a high water content, the external part of the massive barrier swells in
contact with an extremely stiff host rock, so that it applies a confining pressure to the partially
water- saturated core. In this context, it is essential to investigate the sealing ability of the
central part of the bentonite/sand barrier under confinement.
2- Effect of gas pressure on water saturation and swelling of bentonite/sand plug
After closing these tunnels, the bentonite/sand plugs will be hydrated by pore water infiltrated
from the host rock. In parallel, if the gas generation rate exceeds the flow capacity of
dissolved gas by diffusion, or the viscosity capillary flow, gas pressure will increase gradually.
One critical scenario to be investigated is that of the effect of such gas pressure upon swelling
of the bentonite/sand plugs and sealing efficiency of the disposal pit (e.g. bentonite, argillite
and bentonite-argillite interface).
3- The pathway of gas migration: through the argillite, bentonite or argillite-bentonite
interface?
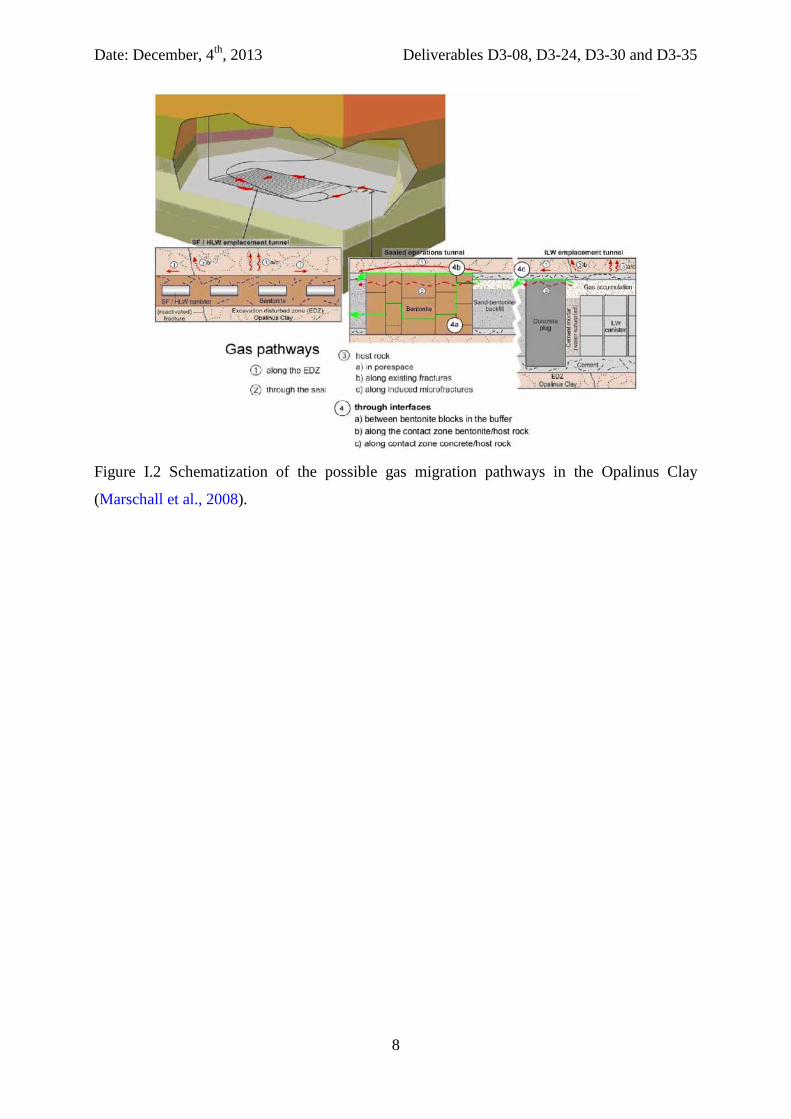
After water saturation and swelling of bentonite, a weaker zone is expected as regards gas
flow: it could be either the host rock, or the bentonite buffer, or the contact zone between the
rock host and bentonite, see Figure I.2. This issue is clearly presented in an in situ experiment
initiated by Andra at Bure (East of France). At the laboratory scale, the questions we propose
to answer is the following: if gas is injected through a water-saturated mixed plug constituted
of a swollen bentonite/sand plug placed within an argillite cylinder (in order to reproduce the
tunnel seal), at what pressure and where will this gas flow through (argillite, bentonite/sand
mixture or through their interface)?
Date: December, 4th, 2013 Deliverables D3-08, D3-24, D3-30 and D3-35
8
Figure I.2 Schematization of the possible gas migration pathways in the Opalinus Clay
(Marschall et al., 2008).
Date: December, 4th, 2013 Deliverables D3-08, D3-24, D3-30 and D3-35
9
II – Materials and experimental methods
Date: December, 4th, 2013 Deliverables D3-08, D3-24, D3-30 and D3-35
10
II.1 Materials and sample preparation
Based on preliminary studies performed by Andra (Bosgiraud, 2004), a single bentonite/sand
mix is used throughout this study. It consists of 30%wt TH1000 silica sand and 70%wt
GELCLAY WH2 sodic bentonite, taken from a single powder mix provided by the CEA
(France), of batch reference RE08015. GELCLAY WH2, also called MX80 WH2 which
consists of a pure sodium bentonite from Wyoming (USA). Its average chemical analysis is:
62.90 % SiO2, 19.70 % Al2O3, 4.09 % Fe2O3, 2.32 % MgO, 2.32 % Na2O, 1.28 % CaO, 0.58 %
K2O and 5.86 % loss on ignition. TH1000 sharp silica sand is made of 99.0 % SiO2 (quartz);
its grain size distribution is in the range [0.2-2mm], which is similar to that of GELCLAY
WH2. The sand solid density is of 2.65 g/cm3, that of GELCLAY WH2 is of 2.78 g/cm3.
More details on the mix characteristics are given in Gatabin (2005).
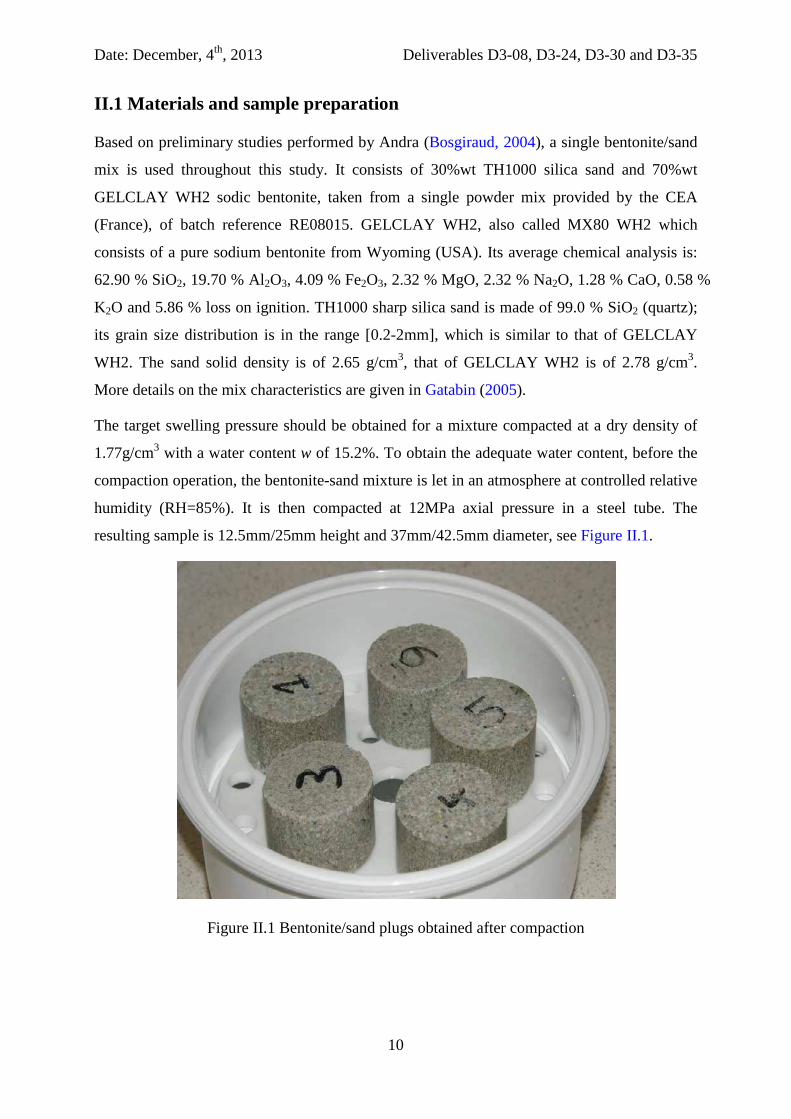
The target swelling pressure should be obtained for a mixture compacted at a dry density of
1.77g/cm3 with a water content w of 15.2%. To obtain the adequate water content, before the
compaction operation, the bentonite-sand mixture is let in an atmosphere at controlled relative
humidity (RH=85%). It is then compacted at 12MPa axial pressure in a steel tube. The
resulting sample is 12.5mm/25mm height and 37mm/42.5mm diameter, see Figure II.1.
Figure II.1 Bentonite/sand plugs obtained after compaction
Date: December, 4th, 2013 Deliverables D3-08, D3-24, D3-30 and D3-35
11
II.2 Water retention experiments
II.2.1 Analysis of in situ problem
In order to assess the safety of the storage system, it is essential to develop appropriate model
to predict the long-term behavior of the buffer materials. During the process of long
term storage, the saturation kinetics of the bentonite barrier is one of the most important
features. Consequently, in order to model the hydration of the buffer material, it is essential to
investigate the water retention property of partially saturated bentonite/sand plug and its
permeability. In addition, water infiltration into bentonite was not only dependent on the
initial state of the compacted materials but also on the boundary conditions. Therefore, this
part focuses on the water retention properties of compacted bentonite/sand plugs under both
free swelling and constant volume conditions (Wang et al., 2012; Cui et al., 2008).
II.2.2 Water retention tests under constant volume and free swelling conditions
II.2.2.1 PlexiglassTM-aluminium tube and their calibration
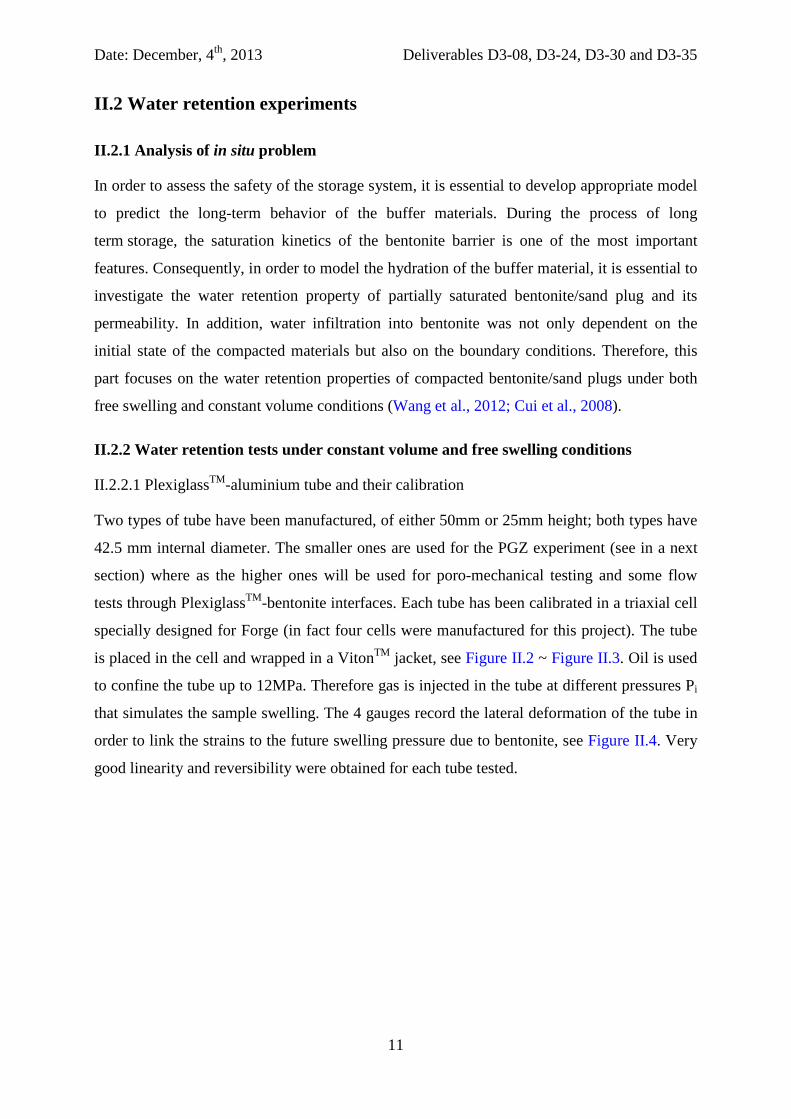
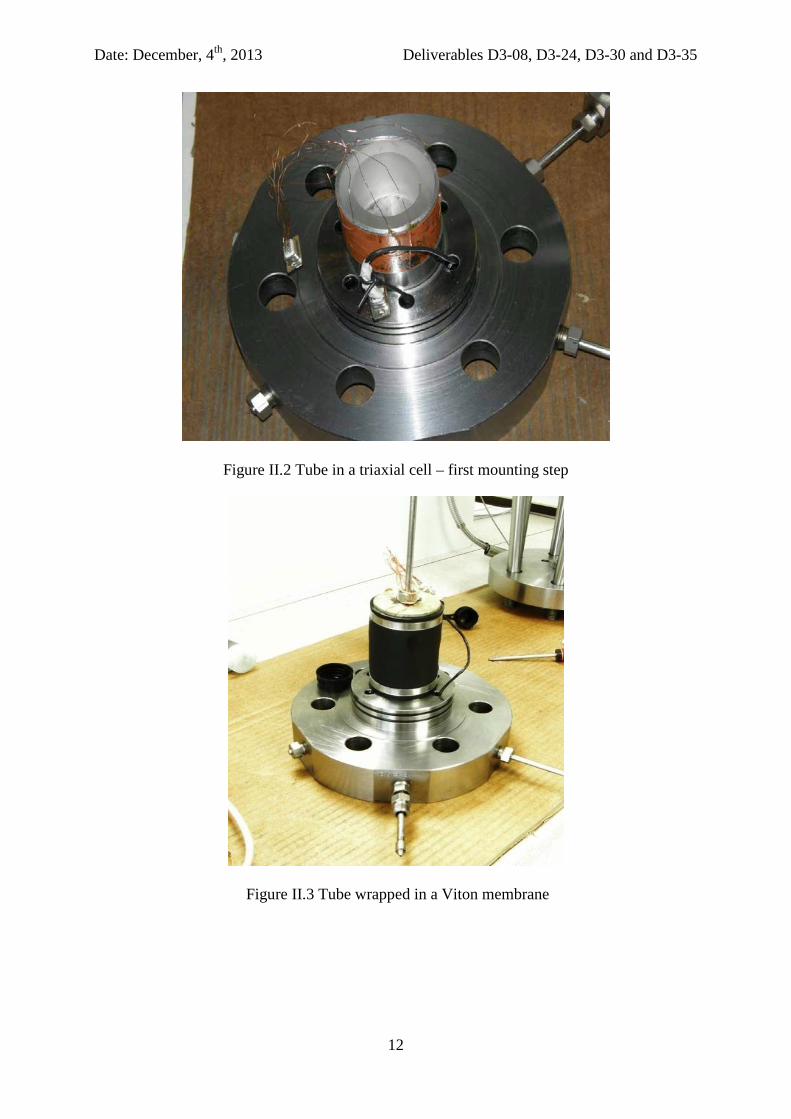
Two types of tube have been manufactured, of either 50mm or 25mm height; both types have
42.5 mm internal diameter. The smaller ones are used for the PGZ experiment (see in a next
section) where as the higher ones will be used for poro-mechanical testing and some flow
tests through PlexiglassTM-bentonite interfaces. Each tube has been calibrated in a triaxial cell
specially designed for Forge (in fact four cells were manufactured for this project). The tube
is placed in the cell and wrapped in a VitonTM jacket, see Figure II.2 ~ Figure II.3. Oil is used
to confine the tube up to 12MPa. Therefore gas is injected in the tube at different pressures Pi
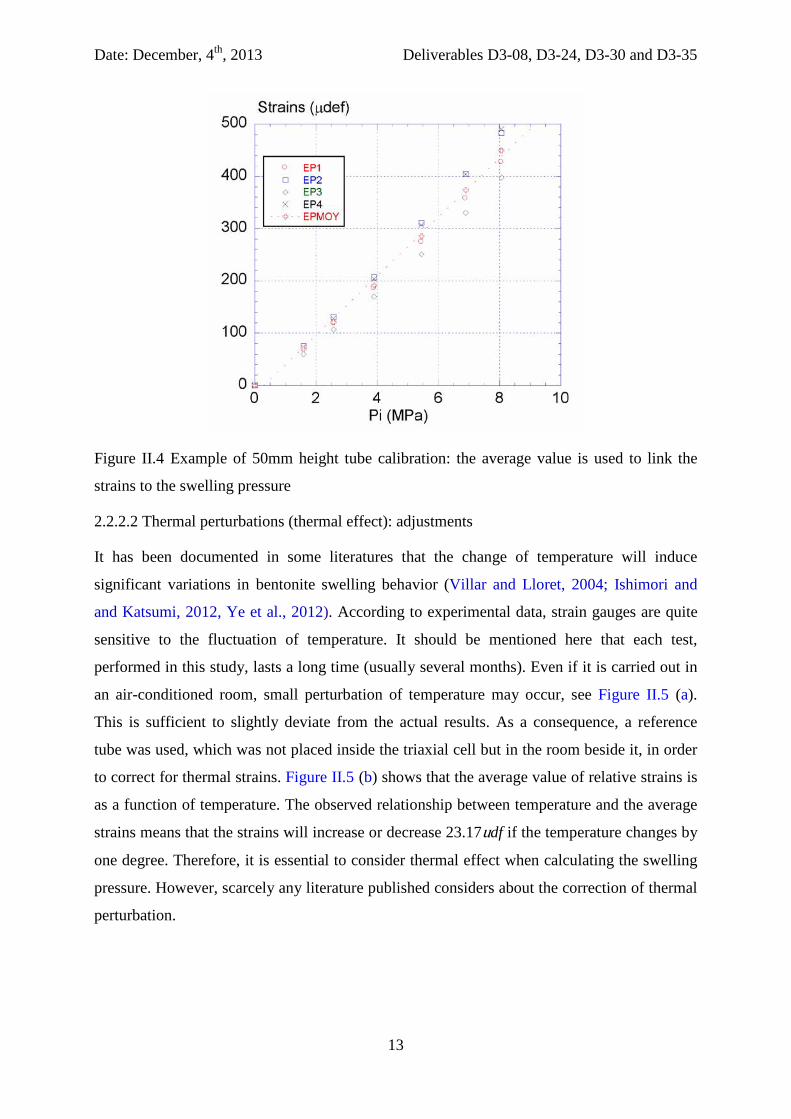
that simulates the sample swelling. The 4 gauges record the lateral deformation of the tube in
order to link the strains to the future swelling pressure due to bentonite, see Figure II.4. Very
good linearity and reversibility were obtained for each tube tested.
Date: December, 4th, 2013 Deliverables D3-08, D3-24, D3-30 and D3-35
12
Figure II.2 Tube in a triaxial cell – first mounting step
Figure II.3 Tube wrapped in a Viton membrane
Date: December, 4th, 2013 Deliverables D3-08, D3-24, D3-30 and D3-35
13
Figure II.4 Example of 50mm height tube calibration: the average value is used to link the
strains to the swelling pressure
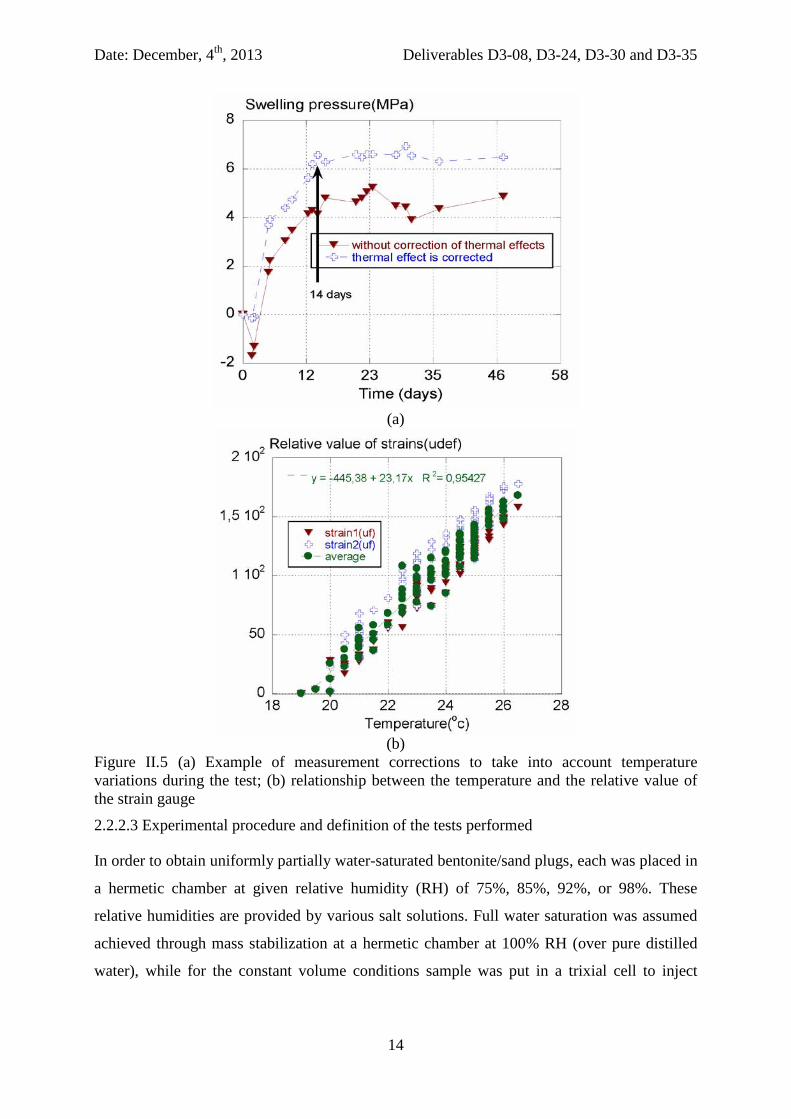
2.2.2.2 Thermal perturbations (thermal effect): adjustments
It has been documented in some literatures that the change of temperature will induce
significant variations in bentonite swelling behavior (Villar and Lloret, 2004; Ishimori and
and Katsumi, 2012, Ye et al., 2012). According to experimental data, strain gauges are quite
sensitive to the fluctuation of temperature. It should be mentioned here that each test,
performed in this study, lasts a long time (usually several months). Even if it is carried out in
an air-conditioned room, small perturbation of temperature may occur, see Figure II.5 (a).
This is sufficient to slightly deviate from the actual results. As a consequence, a reference
tube was used, which was not placed inside the triaxial cell but in the room beside it, in order
to correct for thermal strains. Figure II.5 (b) shows that the average value of relative strains is
as a function of temperature. The observed relationship between temperature and the average
strains means that the strains will increase or decrease 23.17udf if the temperature changes by
one degree. Therefore, it is essential to consider thermal effect when calculating the swelling
pressure. However, scarcely any literature published considers about the correction of thermal
perturbation.
Date: December, 4th, 2013 Deliverables D3-08, D3-24, D3-30 and D3-35
14
(a)
(b)
Figure II.5 (a) Example of measurement corrections to take into account temperature variations during the test; (b) relationship between the temperature and the relative value of the strain gauge
2.2.2.3 Experimental procedure and definition of the tests performed
In order to obtain uniformly partially water-saturated bentonite/sand plugs, each was placed in
a hermetic chamber at given relative humidity (RH) of 75%, 85%, 92%, or 98%. These
relative humidities are provided by various salt solutions. Full water saturation was assumed
achieved through mass stabilization at a hermetic chamber at 100% RH (over pure distilled
water), while for the constant volume conditions sample was put in a trixial cell to inject
Date: December, 4th, 2013 Deliverables D3-08, D3-24, D3-30 and D3-35
15
water directly to accelerate the saturation process. Within each hermetic chamber, the sample
was put right above the water surface, where the actual RH was closest to the required value.
The methodology used was as follow for both tests:
• Samples compaction as described above. • Weighing of the different samples and pieces of the experimental mounting (tube,
plates, etc…). • Equilibrium at RH=70 (for samples SO1 and SO2), 75, 85, 92, 98 % (until mass
stabilization) and then full water saturation in order to obtain saturated mass and to deduce the degree of saturation.
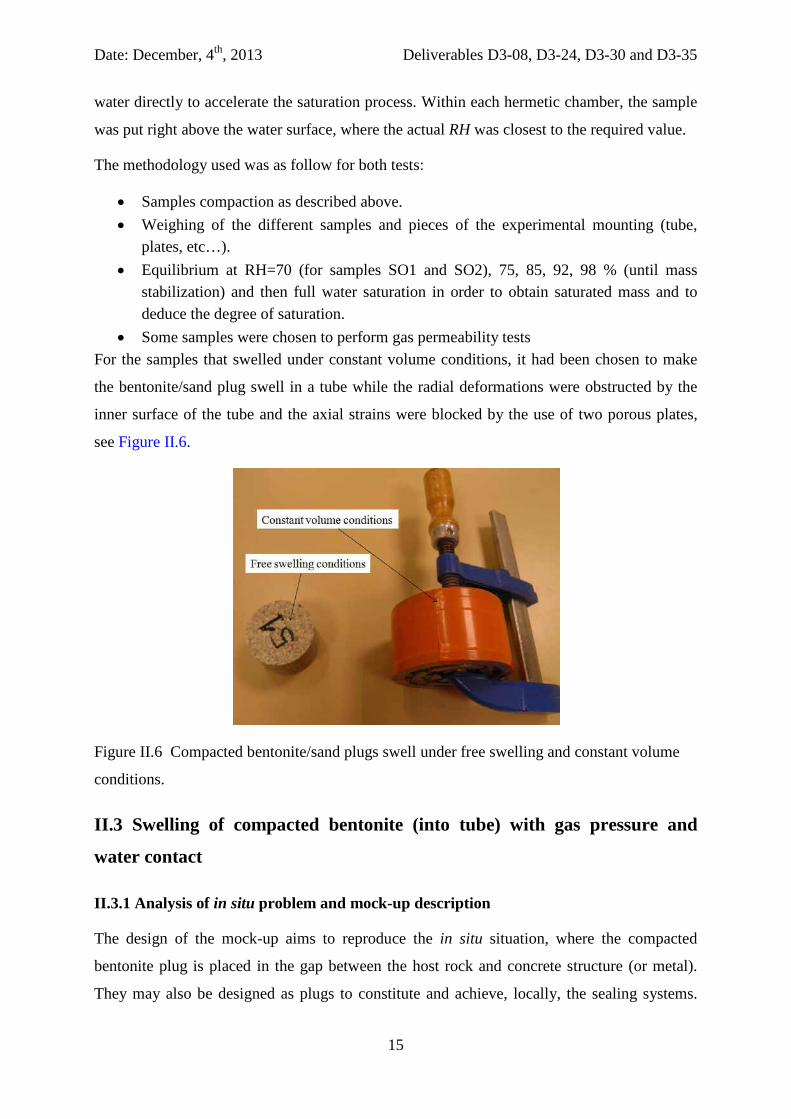
• Some samples were chosen to perform gas permeability tests For the samples that swelled under constant volume conditions, it had been chosen to make
the bentonite/sand plug swell in a tube while the radial deformations were obstructed by the
inner surface of the tube and the axial strains were blocked by the use of two porous plates,
see Figure II.6.
Figure II.6 Compacted bentonite/sand plugs swell under free swelling and constant volume
conditions.
II.3 Swelling of compacted bentonite (into tube) with gas pressure and
water contact
II.3.1 Analysis of in situ problem and mock-up description
The design of the mock-up aims to reproduce the in situ situation, where the compacted
bentonite plug is placed in the gap between the host rock and concrete structure (or metal).
They may also be designed as plugs to constitute and achieve, locally, the sealing systems.
Date: December, 4th, 2013 Deliverables D3-08, D3-24, D3-30 and D3-35
16
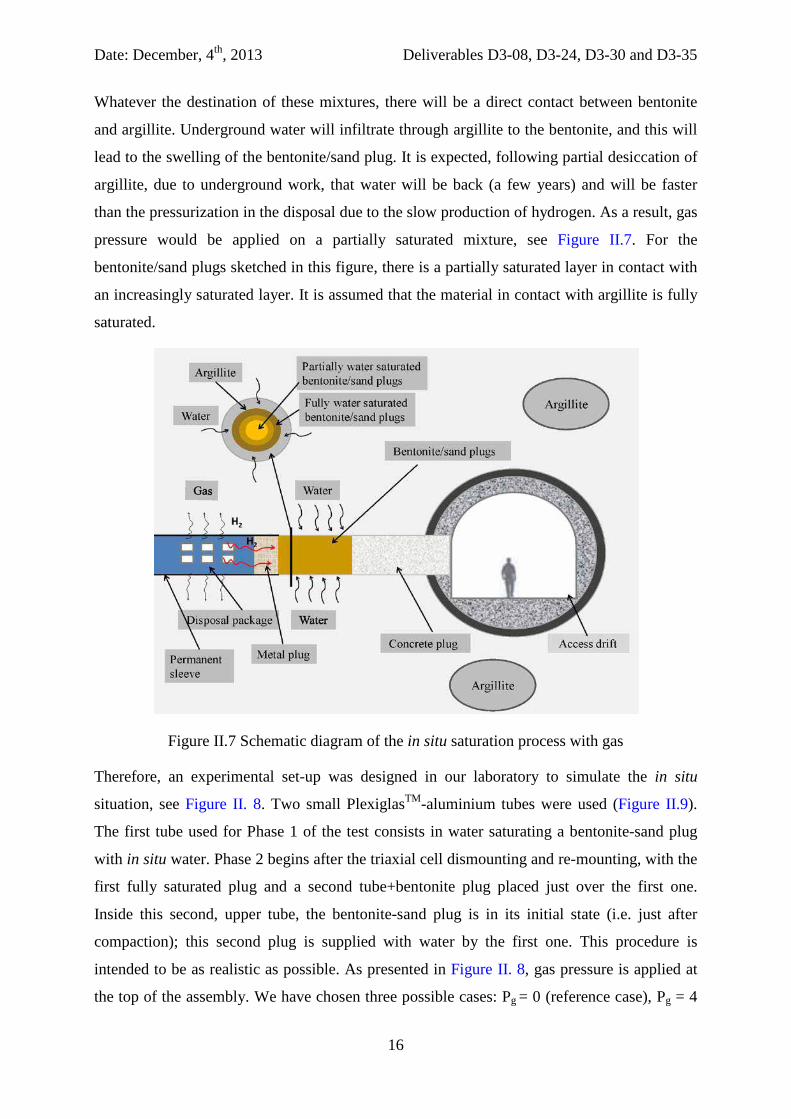
Whatever the destination of these mixtures, there will be a direct contact between bentonite
and argillite. Underground water will infiltrate through argillite to the bentonite, and this will
lead to the swelling of the bentonite/sand plug. It is expected, following partial desiccation of
argillite, due to underground work, that water will be back (a few years) and will be faster
than the pressurization in the disposal due to the slow production of hydrogen. As a result, gas
pressure would be applied on a partially saturated mixture, see Figure II.7. For the
bentonite/sand plugs sketched in this figure, there is a partially saturated layer in contact with
an increasingly saturated layer. It is assumed that the material in contact with argillite is fully
saturated.
Figure II.7 Schematic diagram of the in situ saturation process with gas
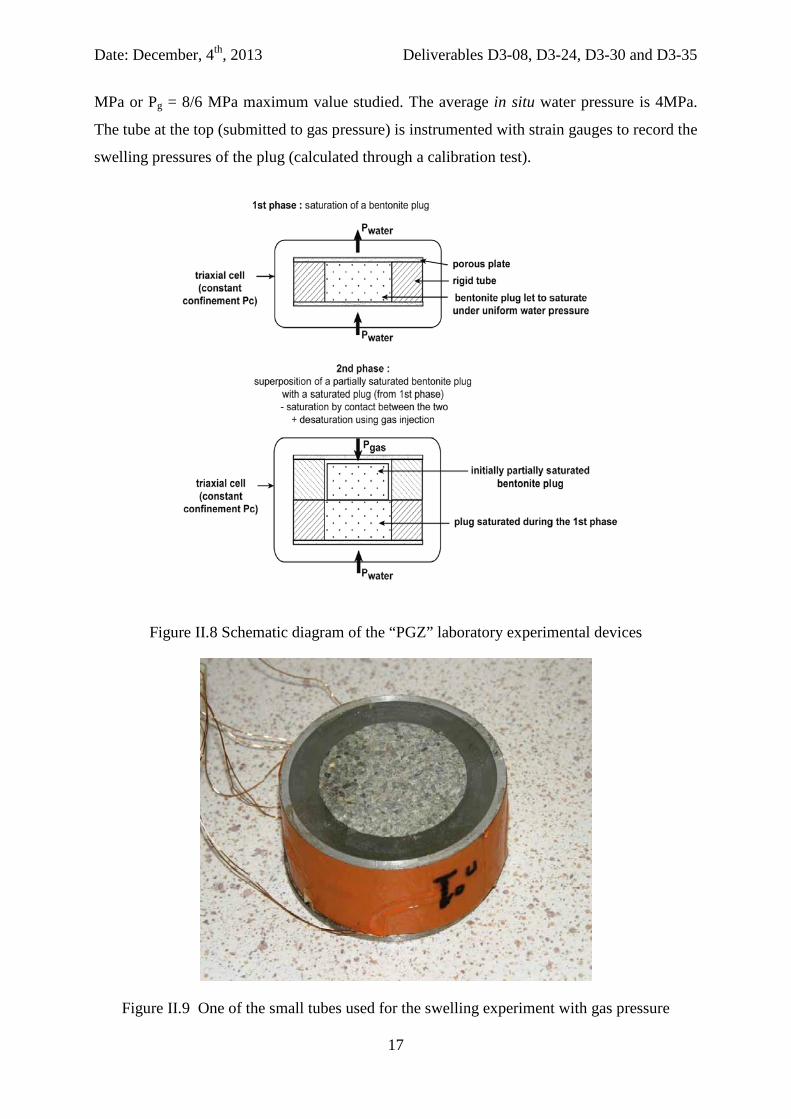
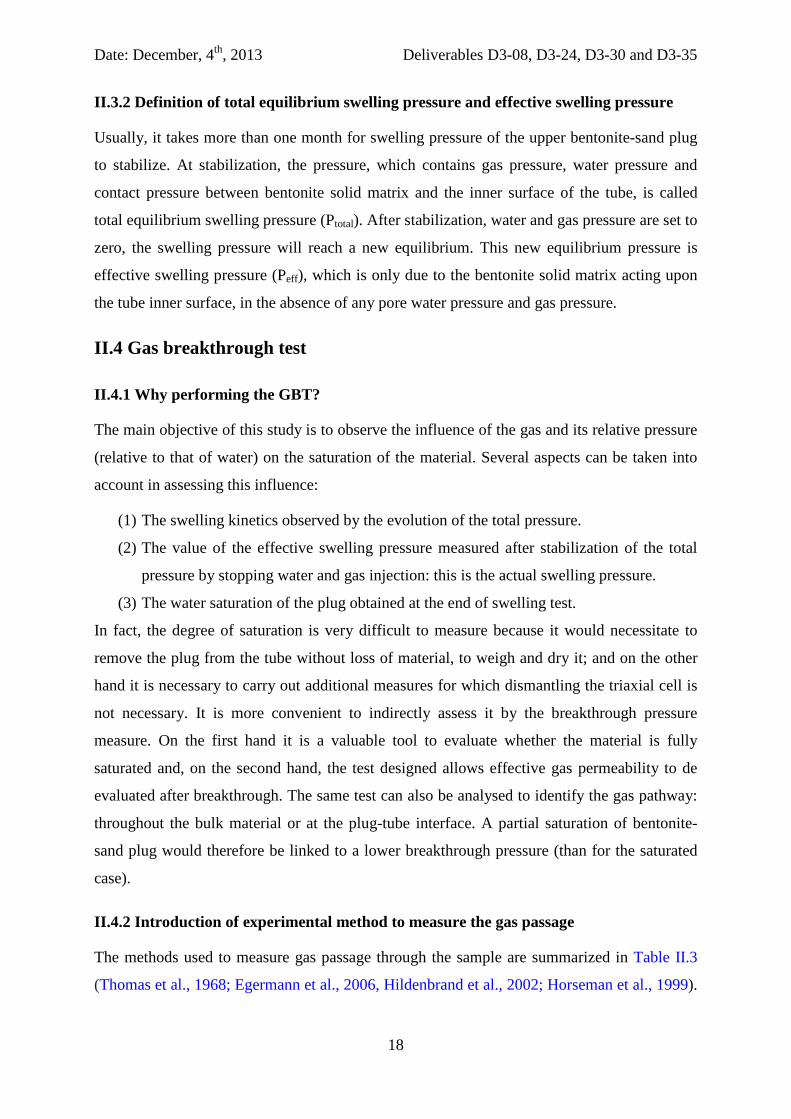
Therefore, an experimental set-up was designed in our laboratory to simulate the in situ
situation, see Figure II. 8. Two small PlexiglasTM-aluminium tubes were used (Figure II.9).
The first tube used for Phase 1 of the test consists in water saturating a bentonite-sand plug
with in situ water. Phase 2 begins after the triaxial cell dismounting and re-mounting, with the
first fully saturated plug and a second tube+bentonite plug placed just over the first one.
Inside this second, upper tube, the bentonite-sand plug is in its initial state (i.e. just after
compaction); this second plug is supplied with water by the first one. This procedure is
intended to be as realistic as possible. As presented in Figure II. 8, gas pressure is applied at
the top of the assembly. We have chosen three possible cases: Pg = 0 (reference case), Pg = 4
Date: December, 4th, 2013 Deliverables D3-08, D3-24, D3-30 and D3-35
17
MPa or Pg = 8/6 MPa maximum value studied. The average in situ water pressure is 4MPa.
The tube at the top (submitted to gas pressure) is instrumented with strain gauges to record the
swelling pressures of the plug (calculated through a calibration test).
Figure II.8 Schematic diagram of the “PGZ” laboratory experimental devices
Figure II.9 One of the small tubes used for the swelling experiment with gas pressure
Date: December, 4th, 2013 Deliverables D3-08, D3-24, D3-30 and D3-35
18
II.3.2 Definition of total equilibrium swelling pressure and effective swelling pressure
Usually, it takes more than one month for swelling pressure of the upper bentonite-sand plug
to stabilize. At stabilization, the pressure, which contains gas pressure, water pressure and
contact pressure between bentonite solid matrix and the inner surface of the tube, is called
total equilibrium swelling pressure (Ptotal). After stabilization, water and gas pressure are set to
zero, the swelling pressure will reach a new equilibrium. This new equilibrium pressure is
effective swelling pressure (Peff), which is only due to the bentonite solid matrix acting upon
the tube inner surface, in the absence of any pore water pressure and gas pressure.
II.4 Gas breakthrough test
II.4.1 Why performing the GBT?
The main objective of this study is to observe the influence of the gas and its relative pressure
(relative to that of water) on the saturation of the material. Several aspects can be taken into
account in assessing this influence:
(1) The swelling kinetics observed by the evolution of the total pressure.
(2) The value of the effective swelling pressure measured after stabilization of the total
pressure by stopping water and gas injection: this is the actual swelling pressure.
(3) The water saturation of the plug obtained at the end of swelling test.
In fact, the degree of saturation is very difficult to measure because it would necessitate to
remove the plug from the tube without loss of material, to weigh and dry it; and on the other
hand it is necessary to carry out additional measures for which dismantling the triaxial cell is
not necessary. It is more convenient to indirectly assess it by the breakthrough pressure
measure. On the first hand it is a valuable tool to evaluate whether the material is fully
saturated and, on the second hand, the test designed allows effective gas permeability to de
evaluated after breakthrough. The same test can also be analysed to identify the gas pathway:
throughout the bulk material or at the plug-tube interface. A partial saturation of bentonite-
sand plug would therefore be linked to a lower breakthrough pressure (than for the saturated
case).
II.4.2 Introduction of experimental method to measure the gas passage
The methods used to measure gas passage through the sample are summarized in Table II.3
(Thomas et al., 1968; Egermann et al., 2006, Hildenbrand et al., 2002; Horseman et al., 1999).
Date: December, 4th, 2013 Deliverables D3-08, D3-24, D3-30 and D3-35
19
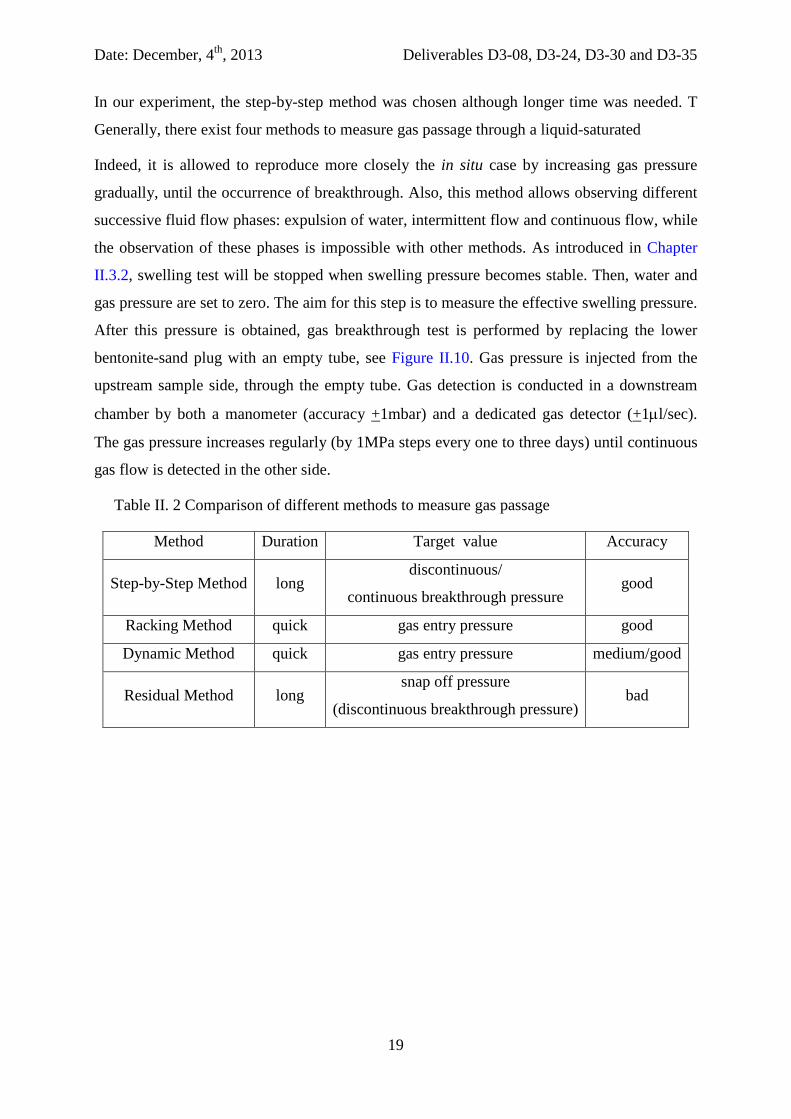
In our experiment, the step-by-step method was chosen although longer time was needed. T
Generally, there exist four methods to measure gas passage through a liquid-saturated
Indeed, it is allowed to reproduce more closely the in situ case by increasing gas pressure
gradually, until the occurrence of breakthrough. Also, this method allows observing different
successive fluid flow phases: expulsion of water, intermittent flow and continuous flow, while
the observation of these phases is impossible with other methods. As introduced in Chapter
II.3.2, swelling test will be stopped when swelling pressure becomes stable. Then, water and
gas pressure are set to zero. The aim for this step is to measure the effective swelling pressure.
After this pressure is obtained, gas breakthrough test is performed by replacing the lower
bentonite-sand plug with an empty tube, see Figure II.10. Gas pressure is injected from the
upstream sample side, through the empty tube. Gas detection is conducted in a downstream
chamber by both a manometer (accuracy +1mbar) and a dedicated gas detector (+1µl/sec).
The gas pressure increases regularly (by 1MPa steps every one to three days) until continuous
gas flow is detected in the other side.
Table II. 2 Comparison of different methods to measure gas passage
Method Duration Target value Accuracy
Step-by-Step Method long discontinuous/
continuous breakthrough pressure good
Racking Method quick gas entry pressure good
Dynamic Method quick gas entry pressure medium/good
Residual Method long snap off pressure
(discontinuous breakthrough pressure) bad
Date: December, 4th, 2013 Deliverables D3-08, D3-24, D3-30 and D3-35
20
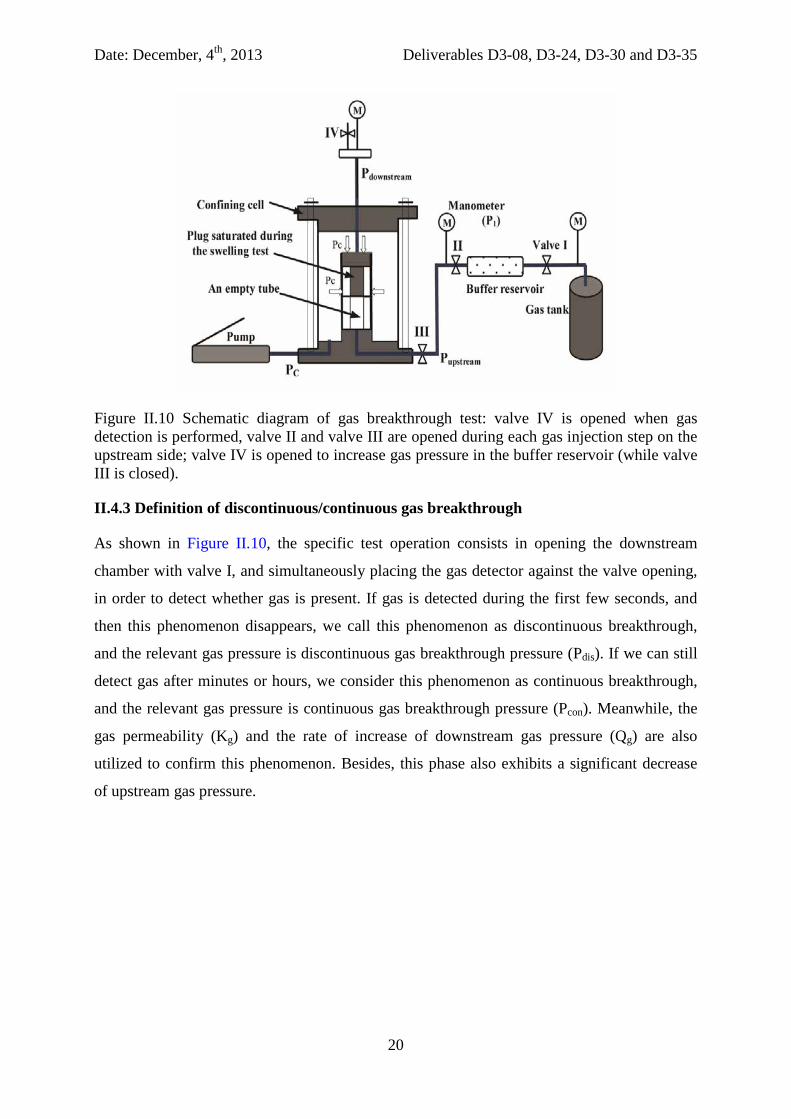
Figure II.10 Schematic diagram of gas breakthrough test: valve IV is opened when gas detection is performed, valve II and valve III are opened during each gas injection step on the upstream side; valve IV is opened to increase gas pressure in the buffer reservoir (while valve III is closed).
II.4.3 Definition of discontinuous/continuous gas breakthrough
As shown in Figure II.10, the specific test operation consists in opening the downstream
chamber with valve I, and simultaneously placing the gas detector against the valve opening,
in order to detect whether gas is present. If gas is detected during the first few seconds, and
then this phenomenon disappears, we call this phenomenon as discontinuous breakthrough,
and the relevant gas pressure is discontinuous gas breakthrough pressure (Pdis). If we can still
detect gas after minutes or hours, we consider this phenomenon as continuous breakthrough,
and the relevant gas pressure is continuous gas breakthrough pressure (Pcon). Meanwhile, the
gas permeability (Kg) and the rate of increase of downstream gas pressure (Qg) are also
utilized to confirm this phenomenon. Besides, this phase also exhibits a significant decrease
of upstream gas pressure.
Date: December, 4th, 2013 Deliverables D3-08, D3-24, D3-30 and D3-35
21
III - Water retention tests under constant
volume and free swelling conditions
Date: December, 4th, 2013 Deliverables D3-08, D3-24, D3-30 and D3-35
22
Introduction
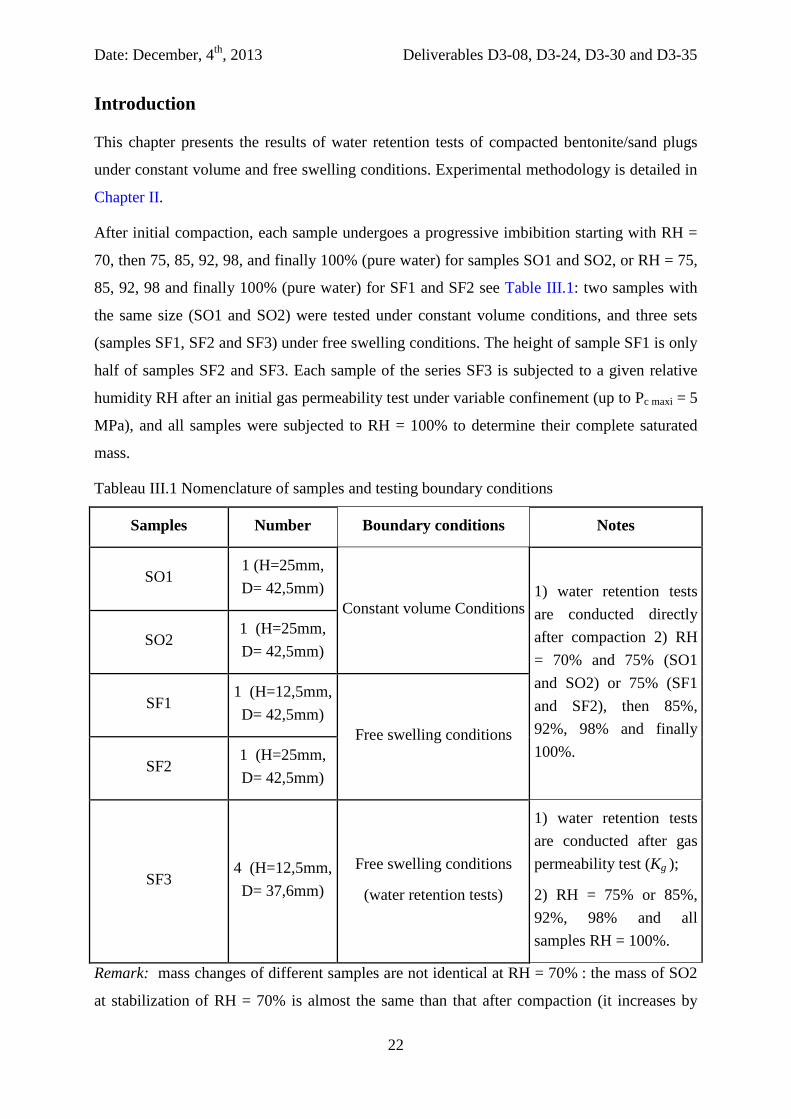
This chapter presents the results of water retention tests of compacted bentonite/sand plugs
under constant volume and free swelling conditions. Experimental methodology is detailed in
Chapter II.
After initial compaction, each sample undergoes a progressive imbibition starting with RH =
70, then 75, 85, 92, 98, and finally 100% (pure water) for samples SO1 and SO2, or RH = 75,
85, 92, 98 and finally 100% (pure water) for SF1 and SF2 see Table III.1: two samples with
the same size (SO1 and SO2) were tested under constant volume conditions, and three sets
(samples SF1, SF2 and SF3) under free swelling conditions. The height of sample SF1 is only
half of samples SF2 and SF3. Each sample of the series SF3 is subjected to a given relative
humidity RH after an initial gas permeability test under variable confinement (up to Pc maxi = 5
MPa), and all samples were subjected to RH = 100% to determine their complete saturated
mass.
Tableau III.1 Nomenclature of samples and testing boundary conditions
Samples Number Boundary conditions Notes
SO1 1 (H=25mm, D= 42,5mm)
Constant volume Conditions 1) water retention tests are conducted directly after compaction 2) RH = 70% and 75% (SO1 and SO2) or 75% (SF1 and SF2), then 85%, 92%, 98% and finally 100%.
SO2 1 (H=25mm, D= 42,5mm)
SF1 1 (H=12,5mm, D= 42,5mm)
Free swelling conditions
SF2 1 (H=25mm, D= 42,5mm)
SF3 4 (H=12,5mm, D= 37,6mm)
Free swelling conditions
(water retention tests)
1) water retention tests are conducted after gas permeability test (Kg );
2) RH = 75% or 85%, 92%, 98% and all samples RH = 100%.
Remark: mass changes of different samples are not identical at RH = 70% : the mass of SO2
at stabilization of RH = 70% is almost the same than that after compaction (it increases by
Date: December, 4th, 2013 Deliverables D3-08, D3-24, D3-30 and D3-35
23
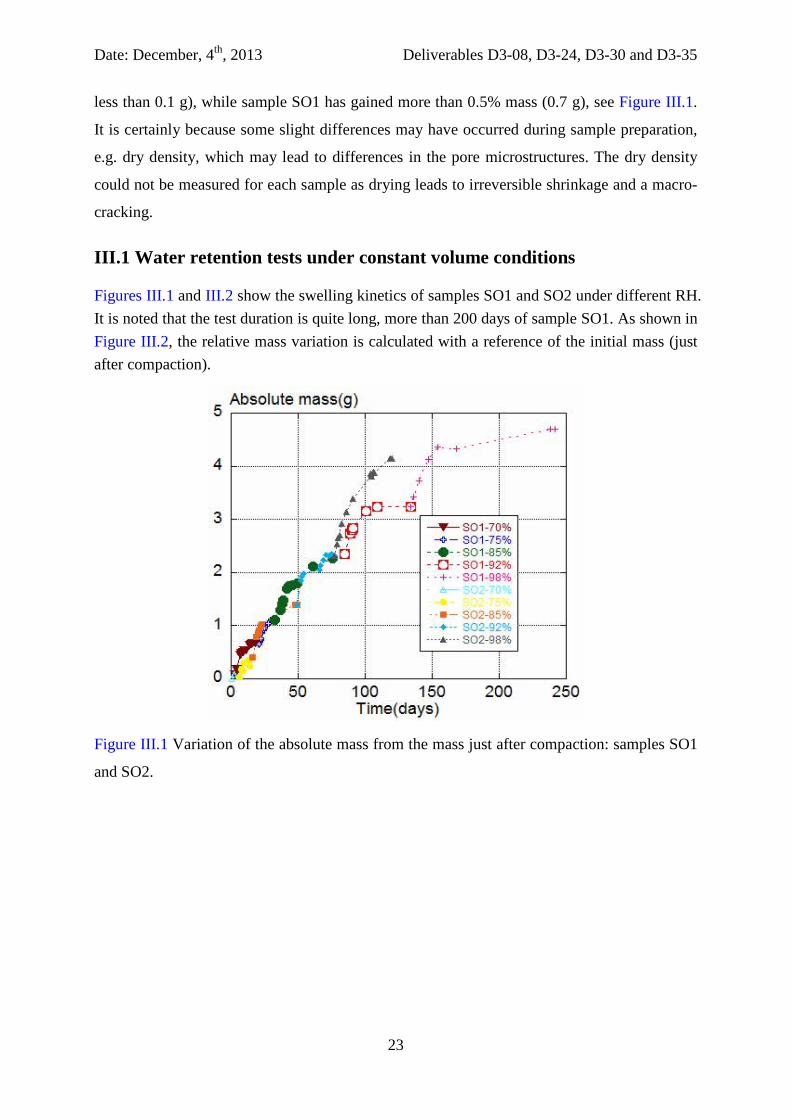
less than 0.1 g), while sample SO1 has gained more than 0.5% mass (0.7 g), see Figure III.1.
It is certainly because some slight differences may have occurred during sample preparation,
e.g. dry density, which may lead to differences in the pore microstructures. The dry density
could not be measured for each sample as drying leads to irreversible shrinkage and a macro-
cracking.
III.1 Water retention tests under constant volume conditions
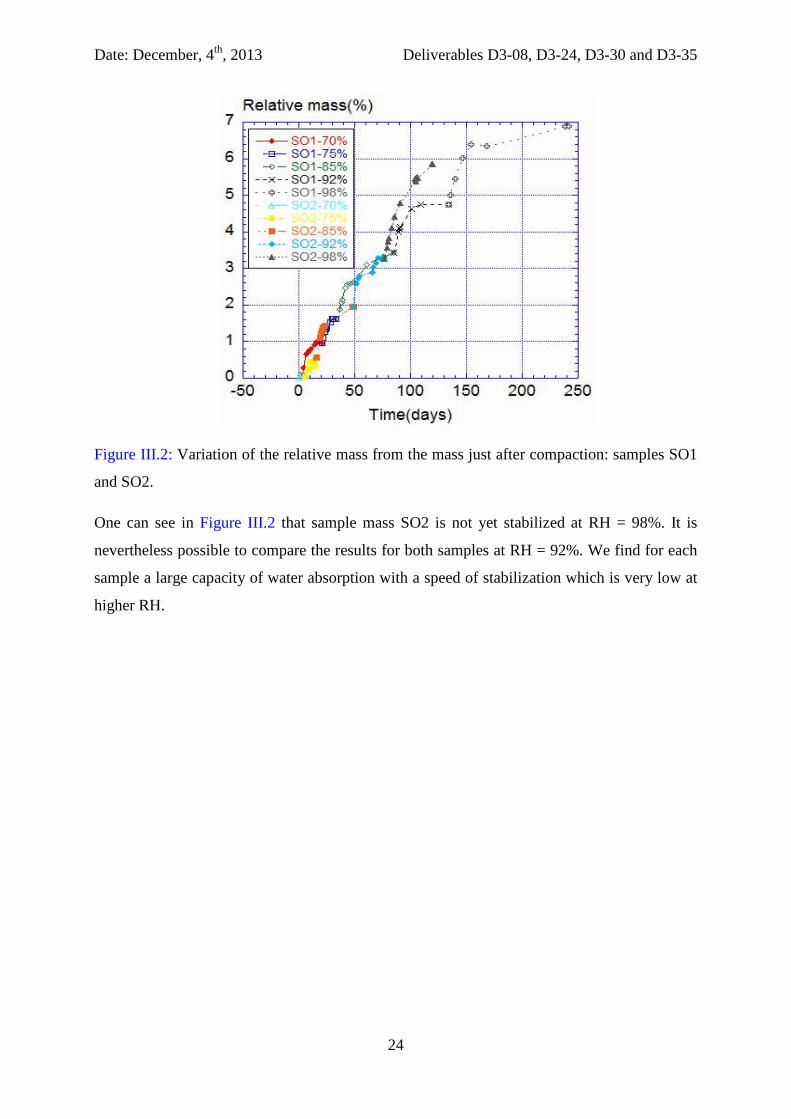
Figures III.1 and III.2 show the swelling kinetics of samples SO1 and SO2 under different RH. It is noted that the test duration is quite long, more than 200 days of sample SO1. As shown in Figure III.2, the relative mass variation is calculated with a reference of the initial mass (just after compaction).
Figure III.1 Variation of the absolute mass from the mass just after compaction: samples SO1
and SO2.
Date: December, 4th, 2013 Deliverables D3-08, D3-24, D3-30 and D3-35
24
Figure III.2: Variation of the relative mass from the mass just after compaction: samples SO1
and SO2.
One can see in Figure III.2 that sample mass SO2 is not yet stabilized at RH = 98%. It is
nevertheless possible to compare the results for both samples at RH = 92%. We find for each
sample a large capacity of water absorption with a speed of stabilization which is very low at
higher RH.
Date: December, 4th, 2013 Deliverables D3-08, D3-24, D3-30 and D3-35
25
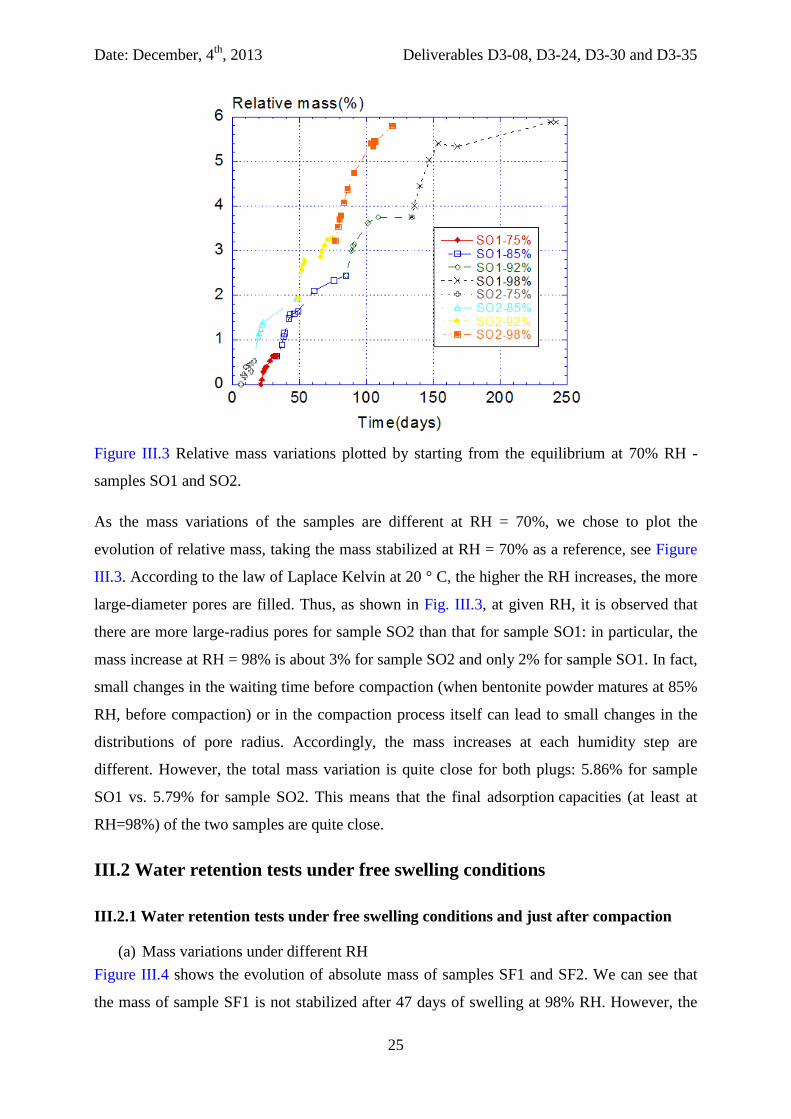
Figure III.3 Relative mass variations plotted by starting from the equilibrium at 70% RH -
samples SO1 and SO2.
As the mass variations of the samples are different at RH = 70%, we chose to plot the
evolution of relative mass, taking the mass stabilized at RH = 70% as a reference, see Figure
III.3. According to the law of Laplace Kelvin at 20 ° C, the higher the RH increases, the more
large-diameter pores are filled. Thus, as shown in Fig. III.3, at given RH, it is observed that
there are more large-radius pores for sample SO2 than that for sample SO1: in particular, the
mass increase at RH = 98% is about 3% for sample SO2 and only 2% for sample SO1. In fact,
small changes in the waiting time before compaction (when bentonite powder matures at 85%
RH, before compaction) or in the compaction process itself can lead to small changes in the
distributions of pore radius. Accordingly, the mass increases at each humidity step are
different. However, the total mass variation is quite close for both plugs: 5.86% for sample
SO1 vs. 5.79% for sample SO2. This means that the final adsorption capacities (at least at
RH=98%) of the two samples are quite close.
III.2 Water retention tests under free swelling conditions
III.2.1 Water retention tests under free swelling conditions and just after compaction
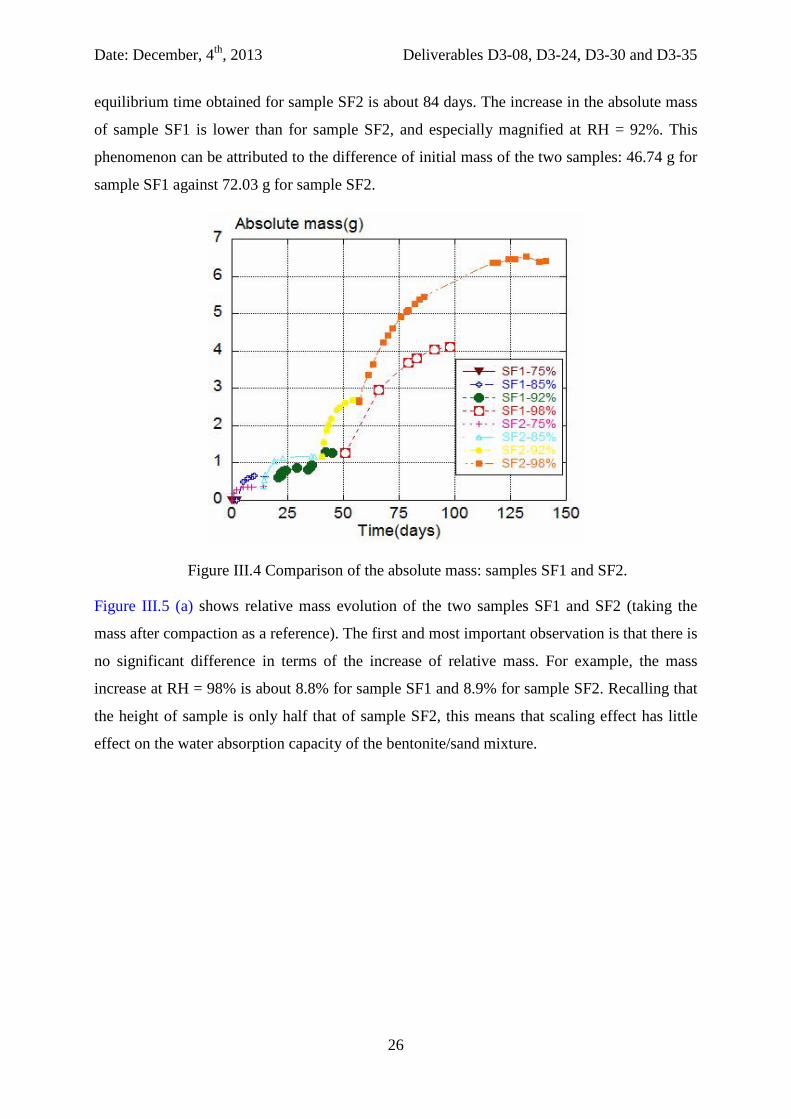
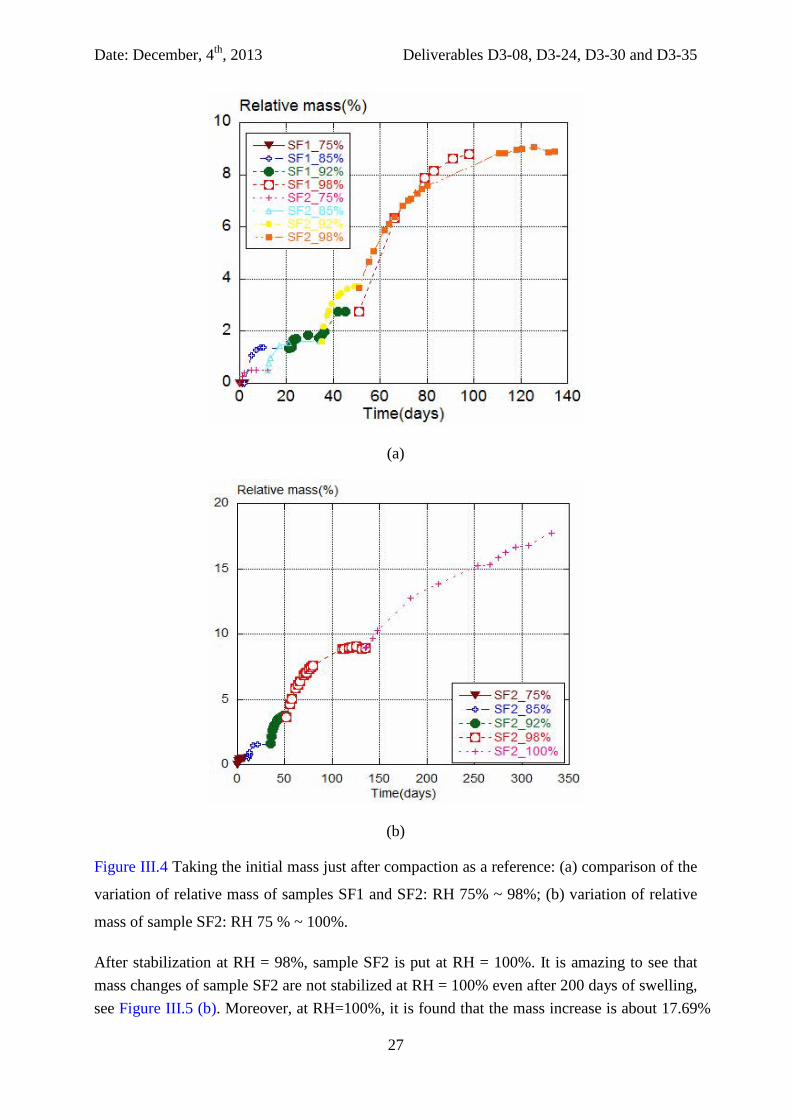
(a) Mass variations under different RH Figure III.4 shows the evolution of absolute mass of samples SF1 and SF2. We can see that
the mass of sample SF1 is not stabilized after 47 days of swelling at 98% RH. However, the
Date: December, 4th, 2013 Deliverables D3-08, D3-24, D3-30 and D3-35
26
equilibrium time obtained for sample SF2 is about 84 days. The increase in the absolute mass
of sample SF1 is lower than for sample SF2, and especially magnified at RH = 92%. This
phenomenon can be attributed to the difference of initial mass of the two samples: 46.74 g for
sample SF1 against 72.03 g for sample SF2.
Figure III.4 Comparison of the absolute mass: samples SF1 and SF2.
Figure III.5 (a) shows relative mass evolution of the two samples SF1 and SF2 (taking the
mass after compaction as a reference). The first and most important observation is that there is
no significant difference in terms of the increase of relative mass. For example, the mass
increase at RH = 98% is about 8.8% for sample SF1 and 8.9% for sample SF2. Recalling that
the height of sample is only half that of sample SF2, this means that scaling effect has little
effect on the water absorption capacity of the bentonite/sand mixture.
Date: December, 4th, 2013 Deliverables D3-08, D3-24, D3-30 and D3-35
27
(a)
(b)
Figure III.4 Taking the initial mass just after compaction as a reference: (a) comparison of the
variation of relative mass of samples SF1 and SF2: RH 75% ~ 98%; (b) variation of relative
mass of sample SF2: RH 75 % ~ 100%.
After stabilization at RH = 98%, sample SF2 is put at RH = 100%. It is amazing to see that mass changes of sample SF2 are not stabilized at RH = 100% even after 200 days of swelling, see Figure III.5 (b). Moreover, at RH=100%, it is found that the mass increase is about 17.69%
Date: December, 4th, 2013 Deliverables D3-08, D3-24, D3-30 and D3-35
28
at the 331th day, which is about two times of the mass increase at RH = 98% (8.9%). This test is still ongoing.
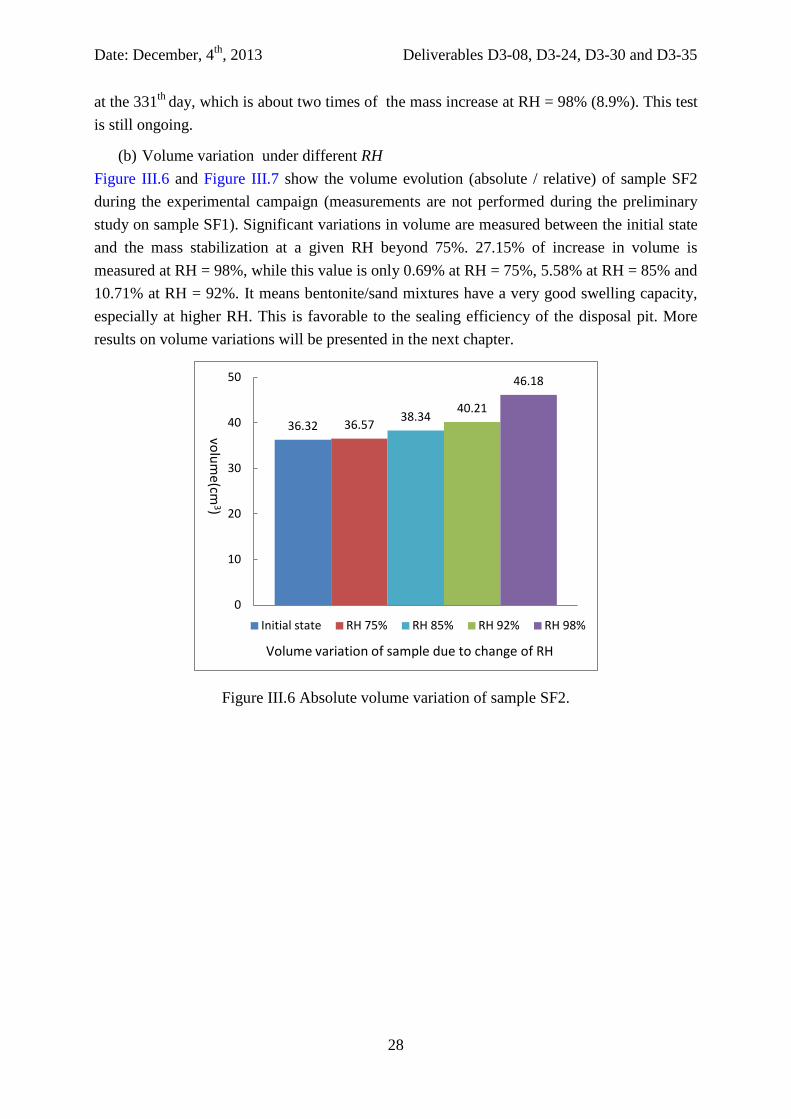
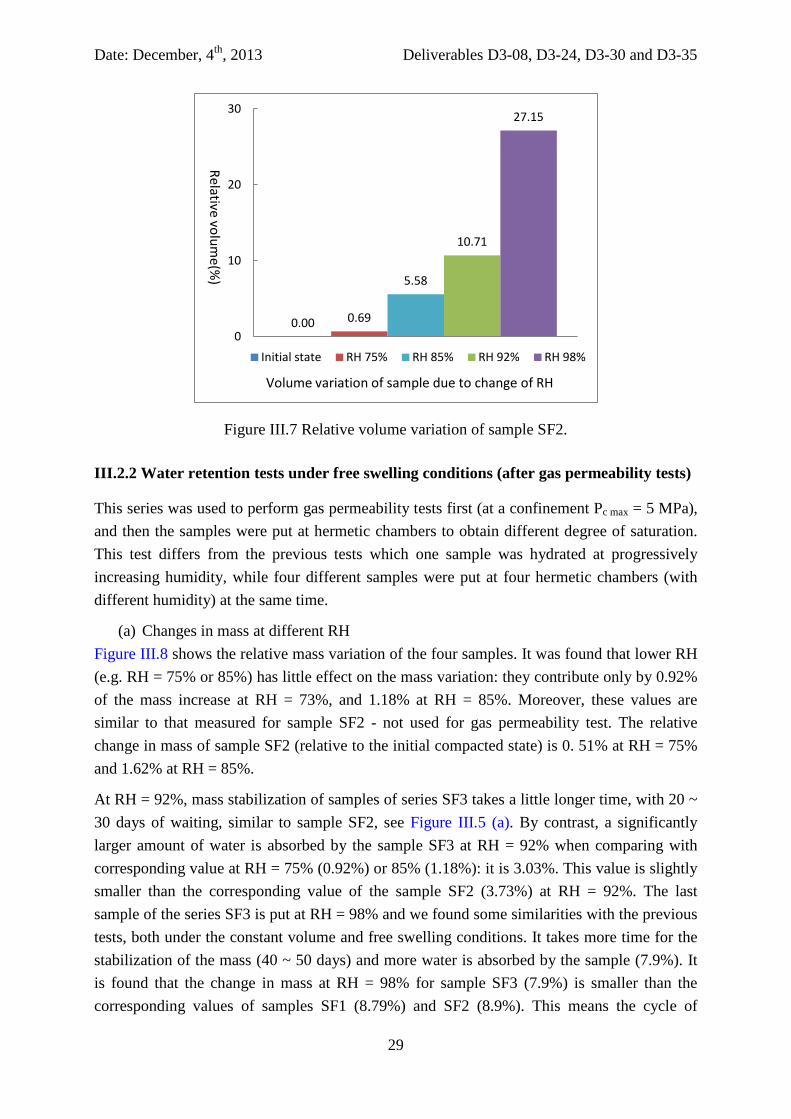
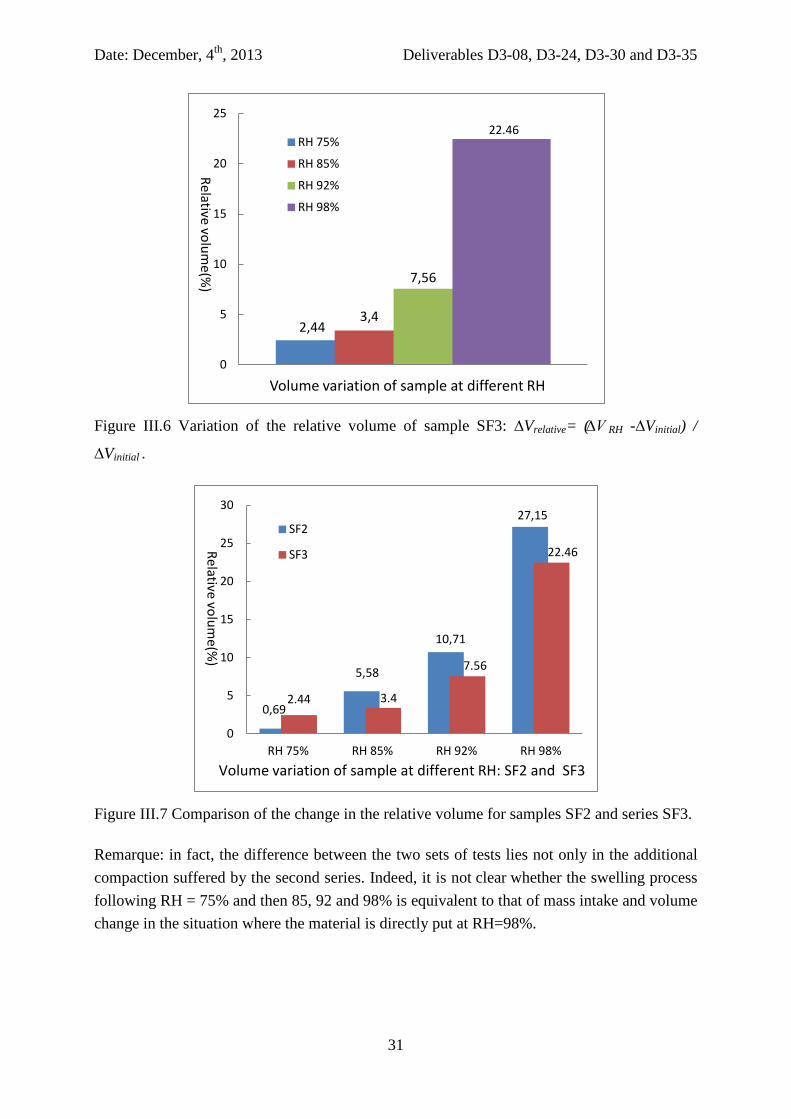
(b) Volume variation under different RH Figure III.6 and Figure III.7 show the volume evolution (absolute / relative) of sample SF2 during the experimental campaign (measurements are not performed during the preliminary study on sample SF1). Significant variations in volume are measured between the initial state and the mass stabilization at a given RH beyond 75%. 27.15% of increase in volume is measured at RH = 98%, while this value is only 0.69% at RH = 75%, 5.58% at RH = 85% and 10.71% at RH = 92%. It means bentonite/sand mixtures have a very good swelling capacity, especially at higher RH. This is favorable to the sealing efficiency of the disposal pit. More results on volume variations will be presented in the next chapter.
Figure III.6 Absolute volume variation of sample SF2.
36.32 36.57 38.34 40.21
46.18
0
10
20
30
40
50
1 Initial state RH 75% RH 85% RH 92% RH 98%
volume(cm
3)
Volume variation of sample due to change of RH
Date: December, 4th, 2013 Deliverables D3-08, D3-24, D3-30 and D3-35
29
Figure III.7 Relative volume variation of sample SF2.
III.2.2 Water retention tests under free swelling conditions (after gas permeability tests)
This series was used to perform gas permeability tests first (at a confinement Pc max = 5 MPa), and then the samples were put at hermetic chambers to obtain different degree of saturation. This test differs from the previous tests which one sample was hydrated at progressively increasing humidity, while four different samples were put at four hermetic chambers (with different humidity) at the same time.
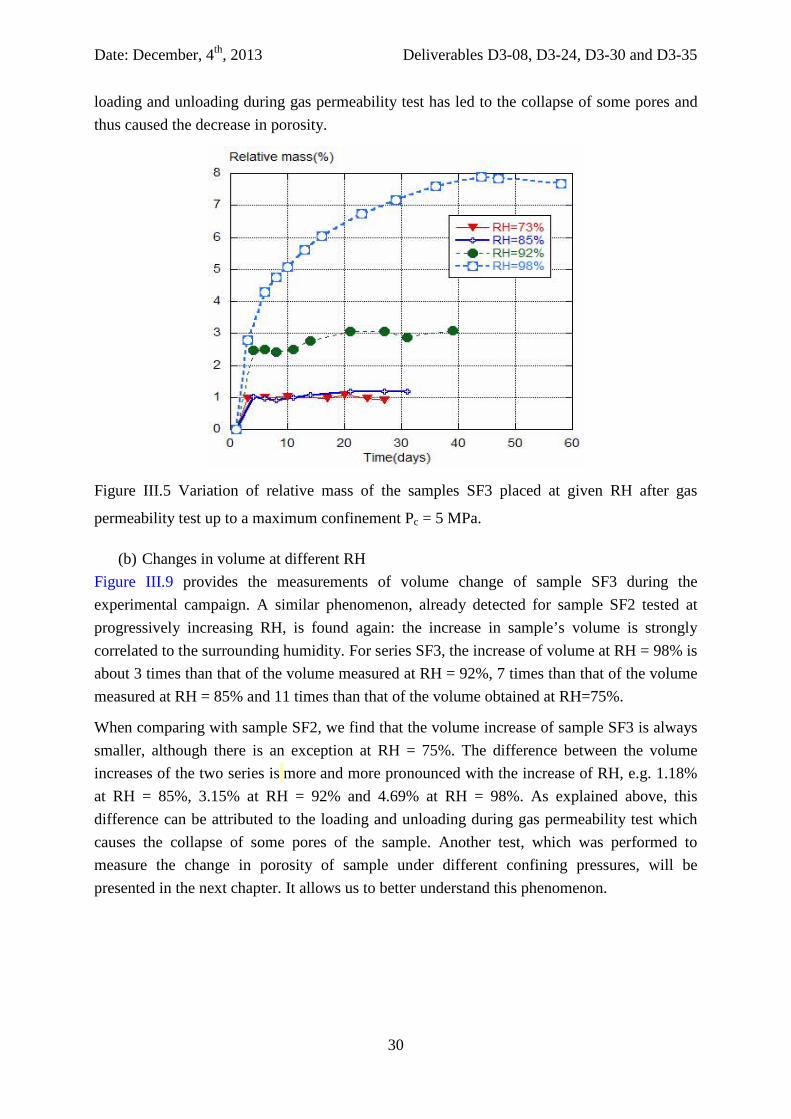
(a) Changes in mass at different RH Figure III.8 shows the relative mass variation of the four samples. It was found that lower RH (e.g. RH = 75% or 85%) has little effect on the mass variation: they contribute only by 0.92% of the mass increase at RH = 73%, and 1.18% at RH = 85%. Moreover, these values are similar to that measured for sample SF2 - not used for gas permeability test. The relative change in mass of sample SF2 (relative to the initial compacted state) is 0. 51% at RH = 75% and 1.62% at RH = 85%.
At RH = 92%, mass stabilization of samples of series SF3 takes a little longer time, with 20 ~ 30 days of waiting, similar to sample SF2, see Figure III.5 (a). By contrast, a significantly larger amount of water is absorbed by the sample SF3 at RH = 92% when comparing with corresponding value at RH = 75% (0.92%) or 85% (1.18%): it is 3.03%. This value is slightly smaller than the corresponding value of the sample SF2 (3.73%) at RH = 92%. The last sample of the series SF3 is put at RH = 98% and we found some similarities with the previous tests, both under the constant volume and free swelling conditions. It takes more time for the stabilization of the mass (40 ~ 50 days) and more water is absorbed by the sample (7.9%). It is found that the change in mass at RH = 98% for sample SF3 (7.9%) is smaller than the corresponding values of samples SF1 (8.79%) and SF2 (8.9%). This means the cycle of
0.00 0.69
5.58
10.71
27.15
0
10
20
30
1 Initial state RH 75% RH 85% RH 92% RH 98%
Relative volume(%
)
Volume variation of sample due to change of RH
Date: December, 4th, 2013 Deliverables D3-08, D3-24, D3-30 and D3-35
30
loading and unloading during gas permeability test has led to the collapse of some pores and thus caused the decrease in porosity.
Figure III.5 Variation of relative mass of the samples SF3 placed at given RH after gas
permeability test up to a maximum confinement Pc = 5 MPa.
(b) Changes in volume at different RH Figure III.9 provides the measurements of volume change of sample SF3 during the experimental campaign. A similar phenomenon, already detected for sample SF2 tested at progressively increasing RH, is found again: the increase in sample’s volume is strongly correlated to the surrounding humidity. For series SF3, the increase of volume at RH = 98% is about 3 times than that of the volume measured at RH = 92%, 7 times than that of the volume measured at RH = 85% and 11 times than that of the volume obtained at RH=75%.
When comparing with sample SF2, we find that the volume increase of sample SF3 is always smaller, although there is an exception at RH = 75%. The difference between the volume increases of the two series is more and more pronounced with the increase of RH, e.g. 1.18% at RH = 85%, 3.15% at RH = 92% and 4.69% at RH = 98%. As explained above, this difference can be attributed to the loading and unloading during gas permeability test which causes the collapse of some pores of the sample. Another test, which was performed to measure the change in porosity of sample under different confining pressures, will be presented in the next chapter. It allows us to better understand this phenomenon.
Date: December, 4th, 2013 Deliverables D3-08, D3-24, D3-30 and D3-35
31
Figure III.6 Variation of the relative volume of sample SF3: ∆Vrelative= (∆V RH -∆Vinitial) /
∆Vinitial .
Figure III.7 Comparison of the change in the relative volume for samples SF2 and series SF3.
Remarque: in fact, the difference between the two sets of tests lies not only in the additional compaction suffered by the second series. Indeed, it is not clear whether the swelling process following RH = 75% and then 85, 92 and 98% is equivalent to that of mass intake and volume change in the situation where the material is directly put at RH=98%.
22.46
0
5
10
15
20
25
1 Volume variation of sample at different RH
RH 75%
RH 85%
RH 92%
RH 98%
7,56
3,4 2,44
Relative volume(%
)
2.44 3.4
7.56
22.46
0
5
10
15
20
25
30
RH 75% RH 85% RH 92% RH 98%
SF2
SF3
Volume variation of sample at different RH: SF2 and SF3
Relative volume(%
)
27,15
10,71
5,58
0,69
Date: December, 4th, 2013 Deliverables D3-08, D3-24, D3-30 and D3-35
32
III.3 Comparison of water retention tests under free swelling and constant
volume conditions (just after compaction)
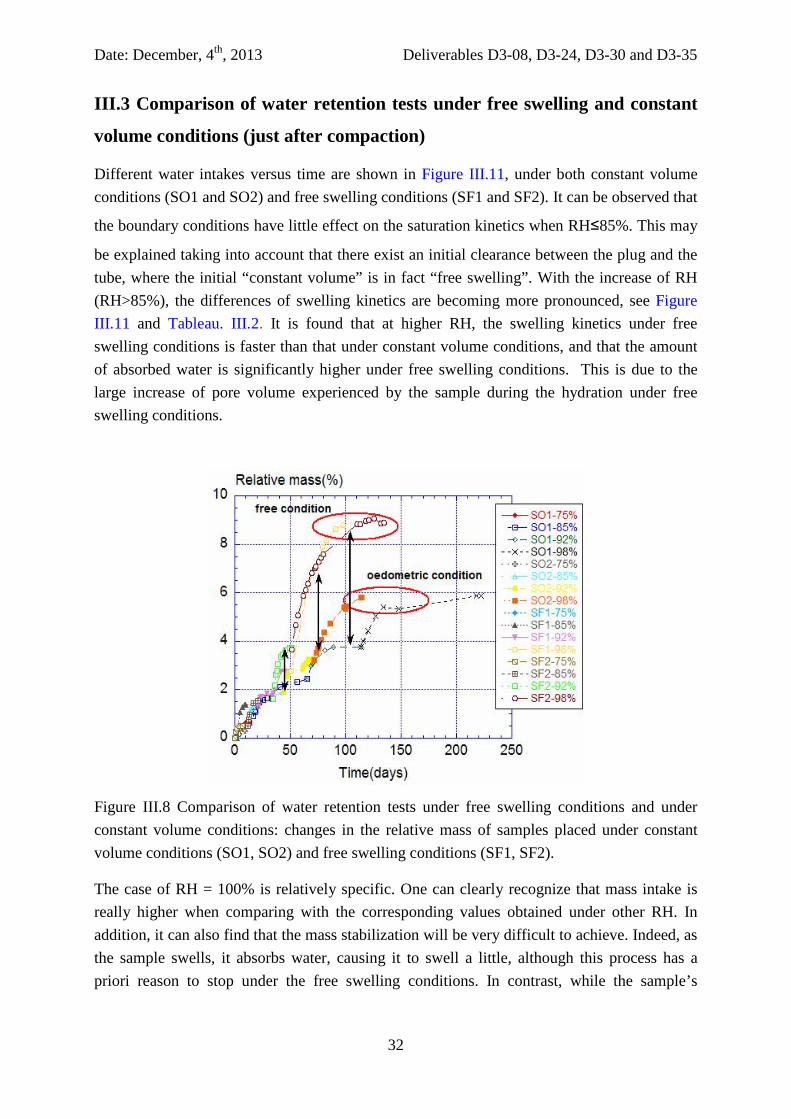
Different water intakes versus time are shown in Figure III.11, under both constant volume conditions (SO1 and SO2) and free swelling conditions (SF1 and SF2). It can be observed that
the boundary conditions have little effect on the saturation kinetics when RH≤85%. This may
be explained taking into account that there exist an initial clearance between the plug and the tube, where the initial “constant volume” is in fact “free swelling”. With the increase of RH (RH>85%), the differences of swelling kinetics are becoming more pronounced, see Figure III.11 and Tableau. III.2. It is found that at higher RH, the swelling kinetics under free swelling conditions is faster than that under constant volume conditions, and that the amount of absorbed water is significantly higher under free swelling conditions. This is due to the large increase of pore volume experienced by the sample during the hydration under free swelling conditions.
Figure III.8 Comparison of water retention tests under free swelling conditions and under constant volume conditions: changes in the relative mass of samples placed under constant volume conditions (SO1, SO2) and free swelling conditions (SF1, SF2).
The case of RH = 100% is relatively specific. One can clearly recognize that mass intake is really higher when comparing with the corresponding values obtained under other RH. In addition, it can also find that the mass stabilization will be very difficult to achieve. Indeed, as the sample swells, it absorbs water, causing it to swell a little, although this process has a priori reason to stop under the free swelling conditions. In contrast, while the sample’s
Date: December, 4th, 2013 Deliverables D3-08, D3-24, D3-30 and D3-35
33
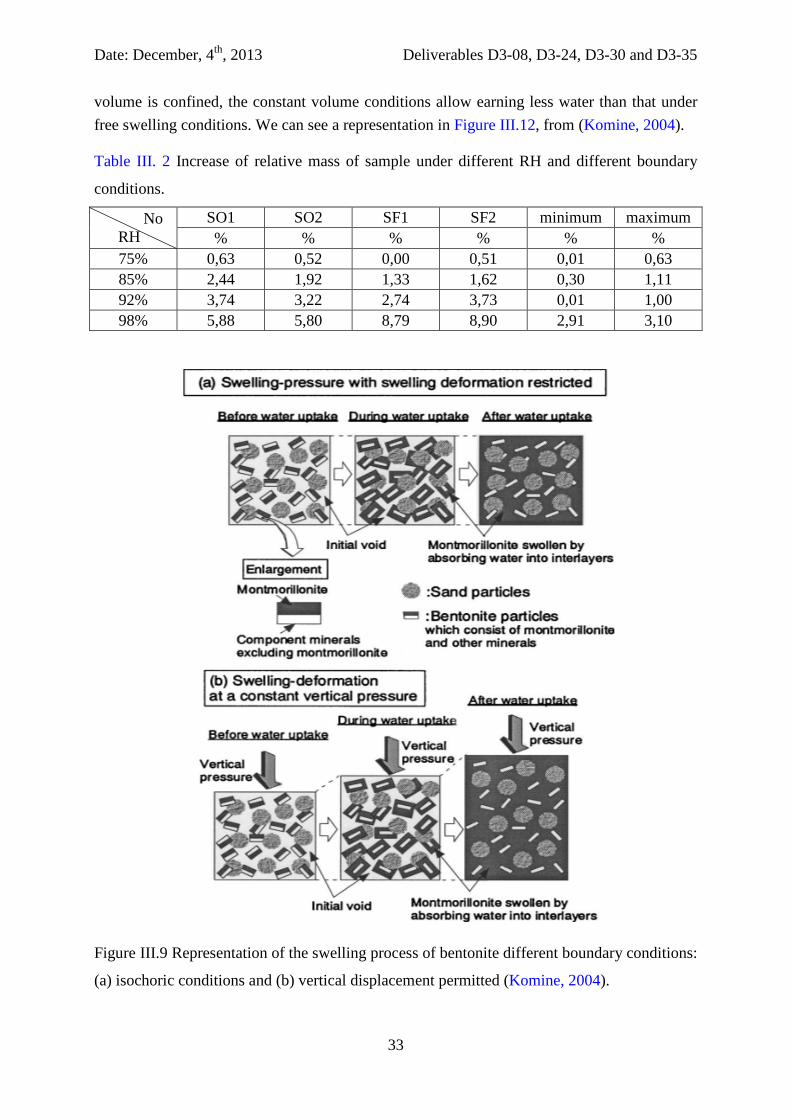
volume is confined, the constant volume conditions allow earning less water than that under free swelling conditions. We can see a representation in Figure III.12, from (Komine, 2004).
Table III. 2 Increase of relative mass of sample under different RH and different boundary
conditions.
No RH
SO1 SO2 SF1 SF2 minimum maximum % % % % % %
75% 0,63 0,52 0,00 0,51 0,01 0,63 85% 2,44 1,92 1,33 1,62 0,30 1,11 92% 3,74 3,22 2,74 3,73 0,01 1,00 98% 5,88 5,80 8,79 8,90 2,91 3,10
Figure III.9 Representation of the swelling process of bentonite different boundary conditions:
(a) isochoric conditions and (b) vertical displacement permitted (Komine, 2004).
Date: December, 4th, 2013 Deliverables D3-08, D3-24, D3-30 and D3-35
34
III.4 Conclusion
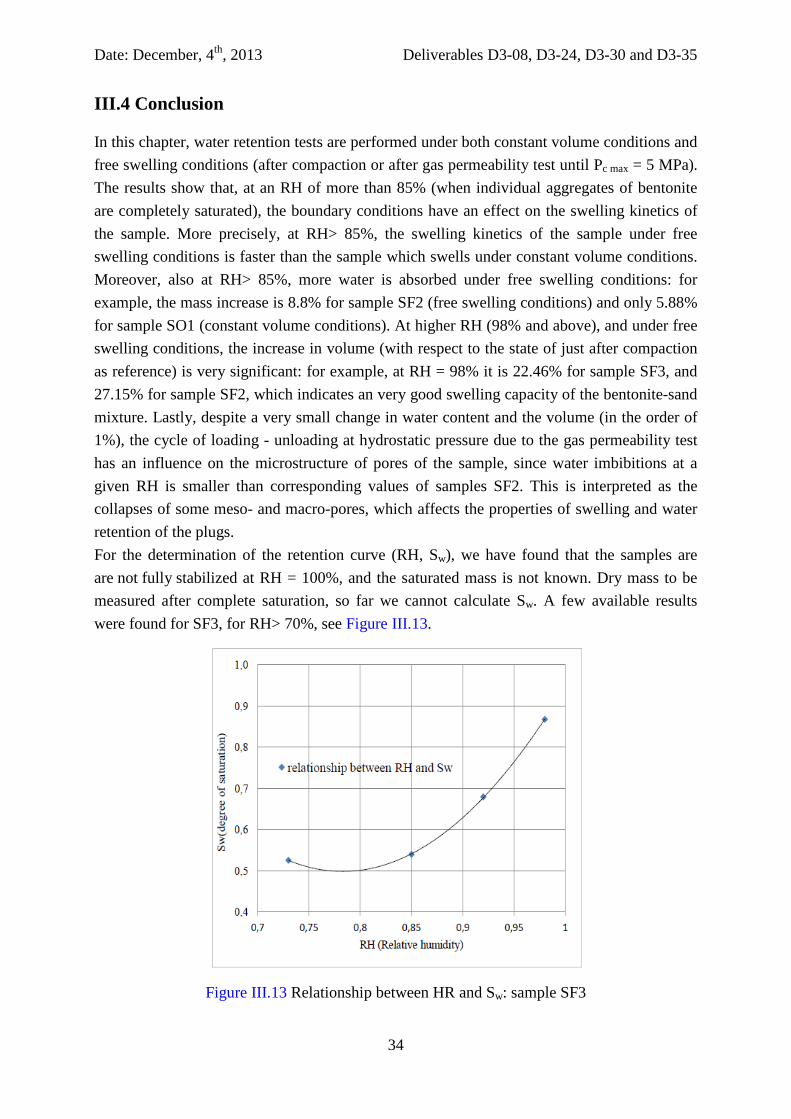
In this chapter, water retention tests are performed under both constant volume conditions and free swelling conditions (after compaction or after gas permeability test until Pc max = 5 MPa). The results show that, at an RH of more than 85% (when individual aggregates of bentonite are completely saturated), the boundary conditions have an effect on the swelling kinetics of the sample. More precisely, at RH> 85%, the swelling kinetics of the sample under free swelling conditions is faster than the sample which swells under constant volume conditions. Moreover, also at RH> 85%, more water is absorbed under free swelling conditions: for example, the mass increase is 8.8% for sample SF2 (free swelling conditions) and only 5.88% for sample SO1 (constant volume conditions). At higher RH (98% and above), and under free swelling conditions, the increase in volume (with respect to the state of just after compaction as reference) is very significant: for example, at RH = 98% it is 22.46% for sample SF3, and 27.15% for sample SF2, which indicates an very good swelling capacity of the bentonite-sand mixture. Lastly, despite a very small change in water content and the volume (in the order of 1%), the cycle of loading - unloading at hydrostatic pressure due to the gas permeability test has an influence on the microstructure of pores of the sample, since water imbibitions at a given RH is smaller than corresponding values of samples SF2. This is interpreted as the collapses of some meso- and macro-pores, which affects the properties of swelling and water retention of the plugs. For the determination of the retention curve (RH, Sw), we have found that the samples are are not fully stabilized at RH = 100%, and the saturated mass is not known. Dry mass to be measured after complete saturation, so far we cannot calculate Sw. A few available results were found for SF3, for RH> 70%, see Figure III.13.
Figure III.13 Relationship between HR and Sw: sample SF3
Date: December, 4th, 2013 Deliverables D3-08, D3-24, D3-30 and D3-35
35
IV - Sealing ability of partially water-saturated
bentonite/sand plugs under the effect of
confinement
Date: December, 4th, 2013 Deliverables D3-08, D3-24, D3-30 and D3-35
36
Introduction
This chapter aims to determine whether the central part of the bentonite-sand barrier, when it
is only partially saturated with water and confined by the swelling pressure of the saturated
plugs (up to about 7.5 MPa, see Chapter V), is permeable to gas or not. We also try to
determine, for the partially saturated and strongly confined material, if it suffers a hydraulic
cut-off: this corresponds to a measured gas permeability of 10-20m2 or less, see (Liu et al 2013)
and signifies that gas doesn’t pass significantly.
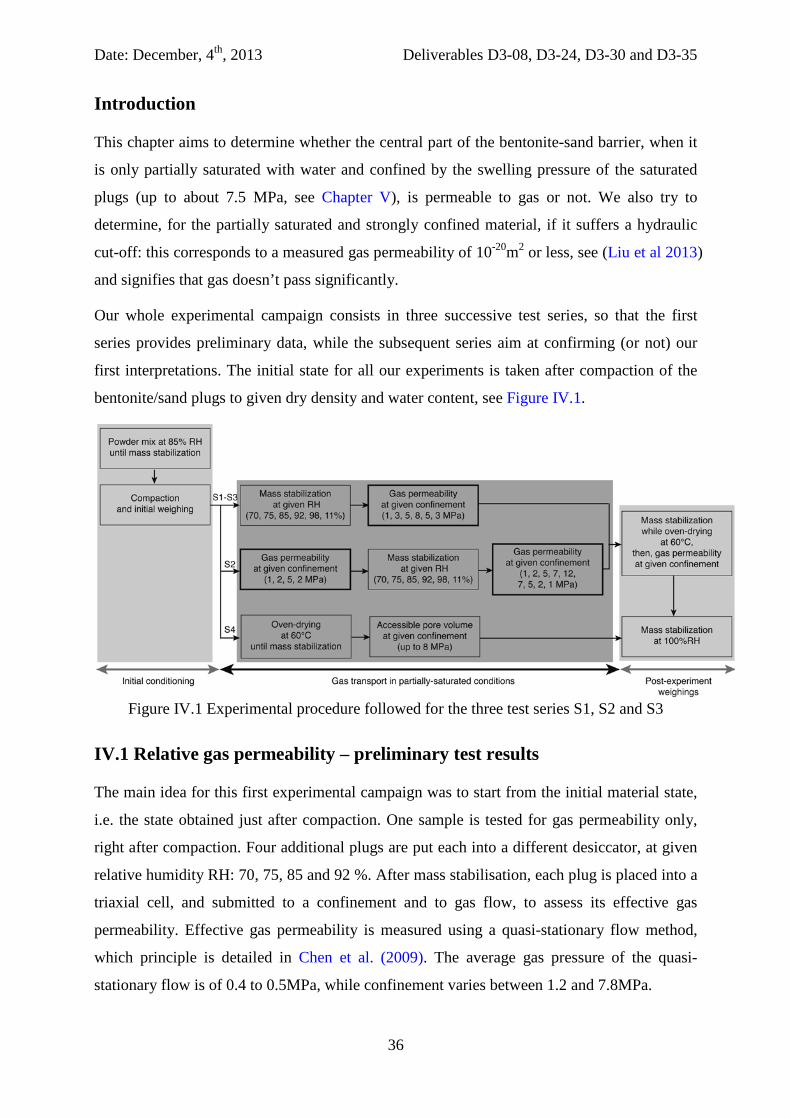
Our whole experimental campaign consists in three successive test series, so that the first
series provides preliminary data, while the subsequent series aim at confirming (or not) our
first interpretations. The initial state for all our experiments is taken after compaction of the
bentonite/sand plugs to given dry density and water content, see Figure IV.1.
Figure IV.1 Experimental procedure followed for the three test series S1, S2 and S3
IV.1 Relative gas permeability – preliminary test results
The main idea for this first experimental campaign was to start from the initial material state,
i.e. the state obtained just after compaction. One sample is tested for gas permeability only,
right after compaction. Four additional plugs are put each into a different desiccator, at given
relative humidity RH: 70, 75, 85 and 92 %. After mass stabilisation, each plug is placed into a
triaxial cell, and submitted to a confinement and to gas flow, to assess its effective gas
permeability. Effective gas permeability is measured using a quasi-stationary flow method,
which principle is detailed in Chen et al. (2009). The average gas pressure of the quasi-
stationary flow is of 0.4 to 0.5MPa, while confinement varies between 1.2 and 7.8MPa.
Date: December, 4th, 2013 Deliverables D3-08, D3-24, D3-30 and D3-35
37
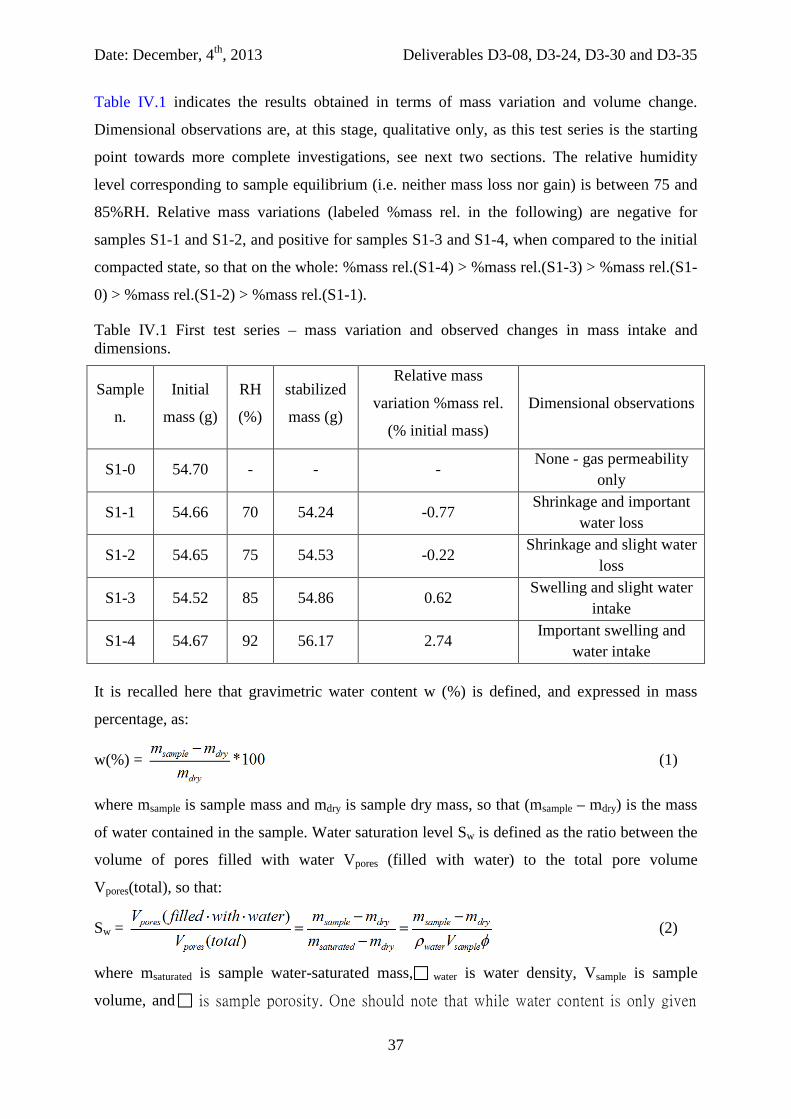
Table IV.1 indicates the results obtained in terms of mass variation and volume change.
Dimensional observations are, at this stage, qualitative only, as this test series is the starting
point towards more complete investigations, see next two sections. The relative humidity
level corresponding to sample equilibrium (i.e. neither mass loss nor gain) is between 75 and
85%RH. Relative mass variations (labeled %mass rel. in the following) are negative for
samples S1-1 and S1-2, and positive for samples S1-3 and S1-4, when compared to the initial
compacted state, so that on the whole: %mass rel.(S1-4) > %mass rel.(S1-3) > %mass rel.(S1-
0) > %mass rel.(S1-2) > %mass rel.(S1-1).
Table IV.1 First test series – mass variation and observed changes in mass intake and dimensions.
Sample
n.
Initial
mass (g)
RH
(%)
stabilized
mass (g)
Relative mass
variation %mass rel.
(% initial mass)
Dimensional observations
S1-0 54.70 - - - None - gas permeability
only
S1-1 54.66 70 54.24 -0.77 Shrinkage and important
water loss
S1-2 54.65 75 54.53 -0.22 Shrinkage and slight water
loss
S1-3 54.52 85 54.86 0.62 Swelling and slight water
intake
S1-4 54.67 92 56.17 2.74 Important swelling and
water intake
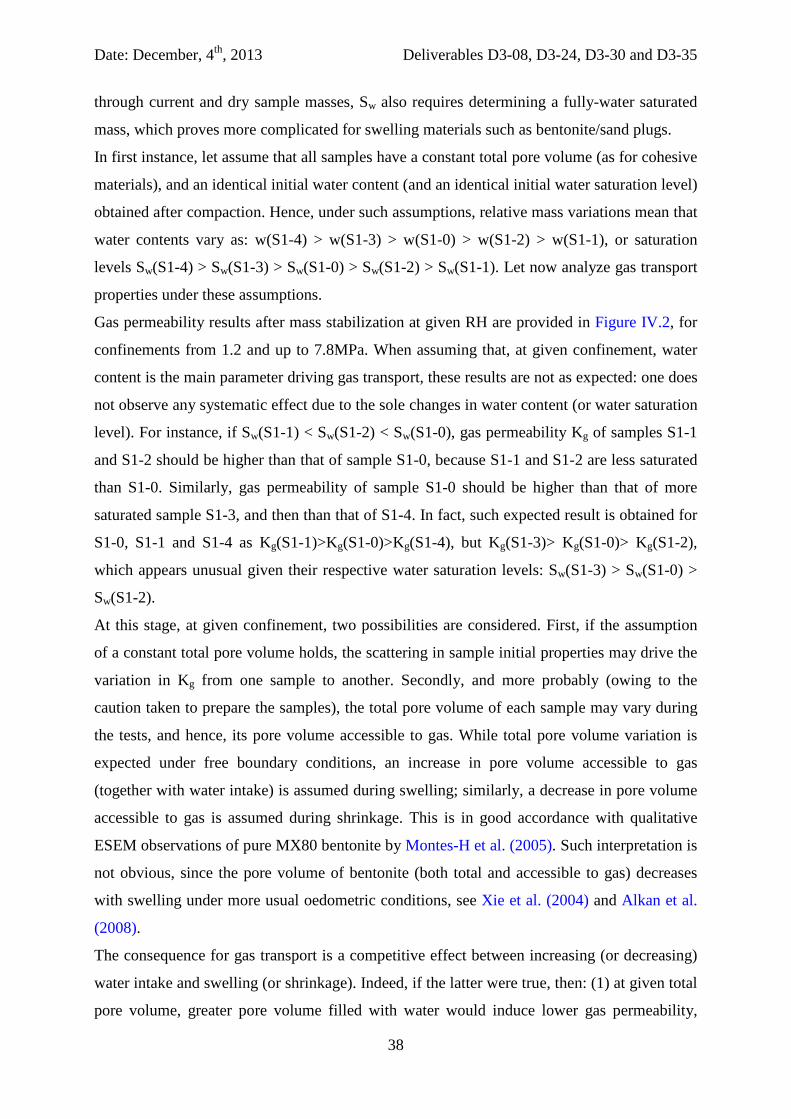
It is recalled here that gravimetric water content w (%) is defined, and expressed in mass
percentage, as:
w(%) = (1)
where msample is sample mass and mdry is sample dry mass, so that (msample – mdry) is the mass
of water contained in the sample. Water saturation level Sw is defined as the ratio between the
volume of pores filled with water Vpores (filled with water) to the total pore volume
Vpores(total), so that:
Sw = (2)
where msaturated is sample water-saturated mass, water is water density, Vsample is sample
volume, and is sample porosity. One should note that while water content is only given
Date: December, 4th, 2013 Deliverables D3-08, D3-24, D3-30 and D3-35
38
through current and dry sample masses, Sw also requires determining a fully-water saturated
mass, which proves more complicated for swelling materials such as bentonite/sand plugs.
In first instance, let assume that all samples have a constant total pore volume (as for cohesive
materials), and an identical initial water content (and an identical initial water saturation level)
obtained after compaction. Hence, under such assumptions, relative mass variations mean that
water contents vary as: w(S1-4) > w(S1-3) > w(S1-0) > w(S1-2) > w(S1-1), or saturation
levels Sw(S1-4) > Sw(S1-3) > Sw(S1-0) > Sw(S1-2) > Sw(S1-1). Let now analyze gas transport
properties under these assumptions.
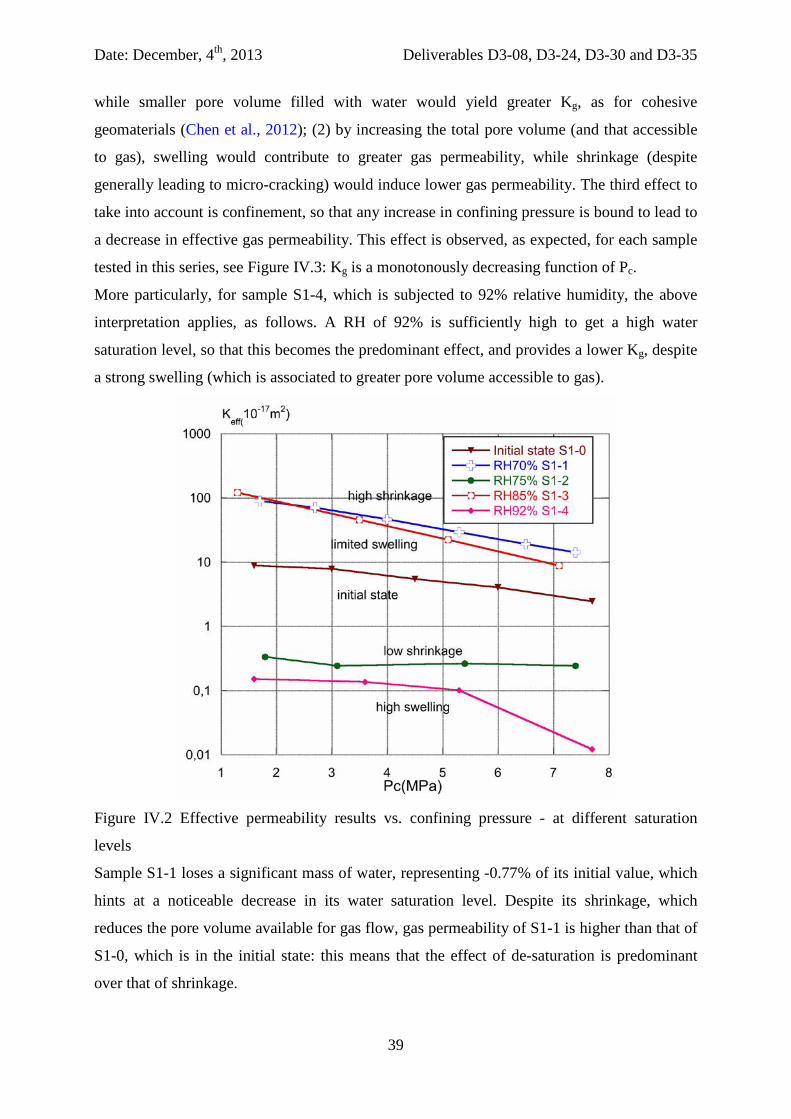
Gas permeability results after mass stabilization at given RH are provided in Figure IV.2, for
confinements from 1.2 and up to 7.8MPa. When assuming that, at given confinement, water
content is the main parameter driving gas transport, these results are not as expected: one does
not observe any systematic effect due to the sole changes in water content (or water saturation
level). For instance, if Sw(S1-1) < Sw(S1-2) < Sw(S1-0), gas permeability Kg of samples S1-1
and S1-2 should be higher than that of sample S1-0, because S1-1 and S1-2 are less saturated
than S1-0. Similarly, gas permeability of sample S1-0 should be higher than that of more
saturated sample S1-3, and then than that of S1-4. In fact, such expected result is obtained for
S1-0, S1-1 and S1-4 as Kg(S1-1)>Kg(S1-0)>Kg(S1-4), but Kg(S1-3)> Kg(S1-0)> Kg(S1-2),
which appears unusual given their respective water saturation levels: Sw(S1-3) > Sw(S1-0) >
Sw(S1-2).
At this stage, at given confinement, two possibilities are considered. First, if the assumption
of a constant total pore volume holds, the scattering in sample initial properties may drive the
variation in Kg from one sample to another. Secondly, and more probably (owing to the
caution taken to prepare the samples), the total pore volume of each sample may vary during
the tests, and hence, its pore volume accessible to gas. While total pore volume variation is
expected under free boundary conditions, an increase in pore volume accessible to gas
(together with water intake) is assumed during swelling; similarly, a decrease in pore volume
accessible to gas is assumed during shrinkage. This is in good accordance with qualitative
ESEM observations of pure MX80 bentonite by Montes-H et al. (2005). Such interpretation is
not obvious, since the pore volume of bentonite (both total and accessible to gas) decreases
with swelling under more usual oedometric conditions, see Xie et al. (2004) and Alkan et al.
(2008).
The consequence for gas transport is a competitive effect between increasing (or decreasing)
water intake and swelling (or shrinkage). Indeed, if the latter were true, then: (1) at given total
pore volume, greater pore volume filled with water would induce lower gas permeability,
Date: December, 4th, 2013 Deliverables D3-08, D3-24, D3-30 and D3-35
39
while smaller pore volume filled with water would yield greater Kg, as for cohesive
geomaterials (Chen et al., 2012); (2) by increasing the total pore volume (and that accessible
to gas), swelling would contribute to greater gas permeability, while shrinkage (despite
generally leading to micro-cracking) would induce lower gas permeability. The third effect to
take into account is confinement, so that any increase in confining pressure is bound to lead to
a decrease in effective gas permeability. This effect is observed, as expected, for each sample
tested in this series, see Figure IV.3: Kg is a monotonously decreasing function of Pc.
More particularly, for sample S1-4, which is subjected to 92% relative humidity, the above
interpretation applies, as follows. A RH of 92% is sufficiently high to get a high water
saturation level, so that this becomes the predominant effect, and provides a lower Kg, despite
a strong swelling (which is associated to greater pore volume accessible to gas).
Figure IV.2 Effective permeability results vs. confining pressure - at different saturation
levels
Sample S1-1 loses a significant mass of water, representing -0.77% of its initial value, which
hints at a noticeable decrease in its water saturation level. Despite its shrinkage, which
reduces the pore volume available for gas flow, gas permeability of S1-1 is higher than that of
S1-0, which is in the initial state: this means that the effect of de-saturation is predominant
over that of shrinkage.
Date: December, 4th, 2013 Deliverables D3-08, D3-24, D3-30 and D3-35
40
On the opposite, for samples S1-2 and S1-3, the effect of swelling/shrinkage (and pore
volume variation) is predominant over that of saturation level. Sample S1-2 sustains
simultaneously a decrease in water saturation (which contributes to an increase in gas
permeability Kg) and limited shrinkage (responsible for a decrease in pore volume accessible
to gas, i.e. in Kg), so that, on the whole, its permeability Kg is lower than that of S1-0. For
sample S1-3, although one observes an increase in saturation (associated to a decrease in Kg),
limited swelling (associated to an increase in Kg) induces greater Kg than for S1-0.
In order to confirm these antagonist effects more quantitatively, complementary experiments
are performed by two supplementary test series, see below.
IV.2 Relative gas permeability study – second series of tests
IV. 2.1 Mass and volume changes
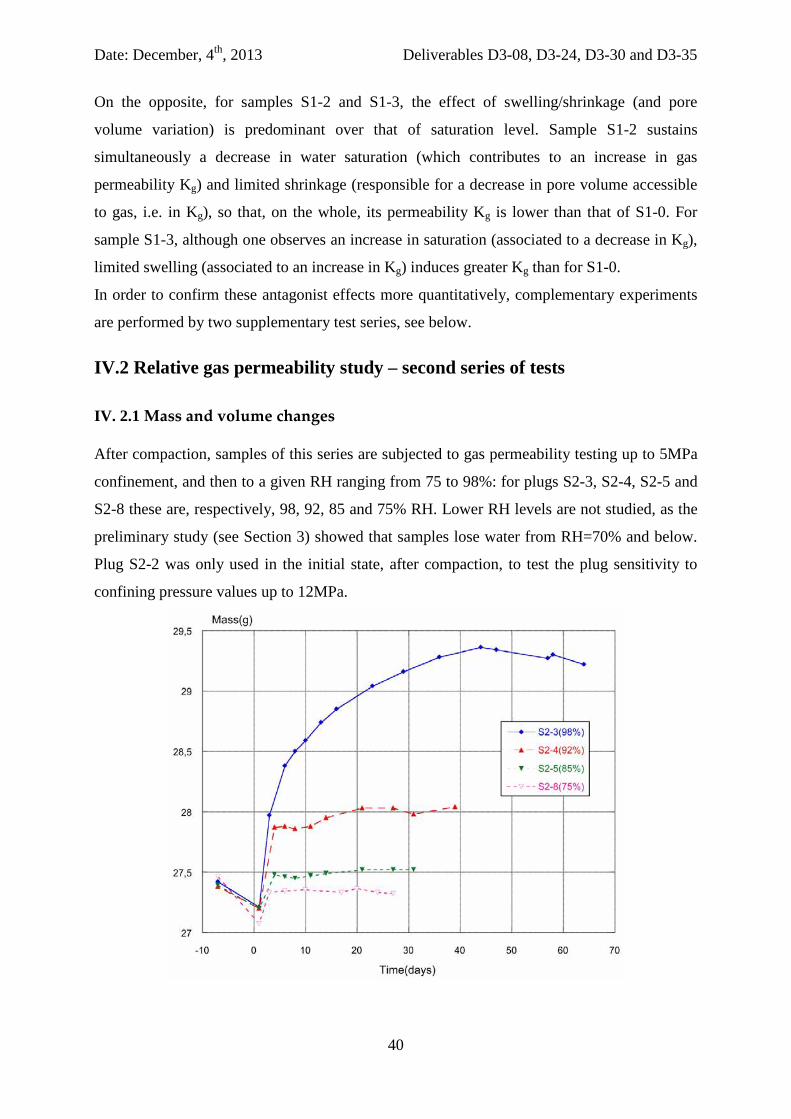
After compaction, samples of this series are subjected to gas permeability testing up to 5MPa
confinement, and then to a given RH ranging from 75 to 98%: for plugs S2-3, S2-4, S2-5 and
S2-8 these are, respectively, 98, 92, 85 and 75% RH. Lower RH levels are not studied, as the
preliminary study (see Section 3) showed that samples lose water from RH=70% and below.
Plug S2-2 was only used in the initial state, after compaction, to test the plug sensitivity to
confining pressure values up to 12MPa.
Date: December, 4th, 2013 Deliverables D3-08, D3-24, D3-30 and D3-35
41
Figure IV.3 Evolution of sample mass vs. time, when the samples are placed at different humidity levels. Mass evolution from compaction to the atmosphere at fixed RH is given in Figure IV.3.
Masses at negative times correspond to the initial compaction state. Masses at day 1
correspond to the initial gas permeability measurement phase.
Figure IV.3 shows that, from one sample to another, there are huge differences in the time
required to get a stable mass at given RH. These differences are attributed to the amount of
water gained by each sample, which is much greater at higher relative humidity. The longest
time for mass stabilisation is obtained with S2-3, which is placed at 98%RH. This is related to
the strong swelling, which is observed at this level, see Figure IV.4.
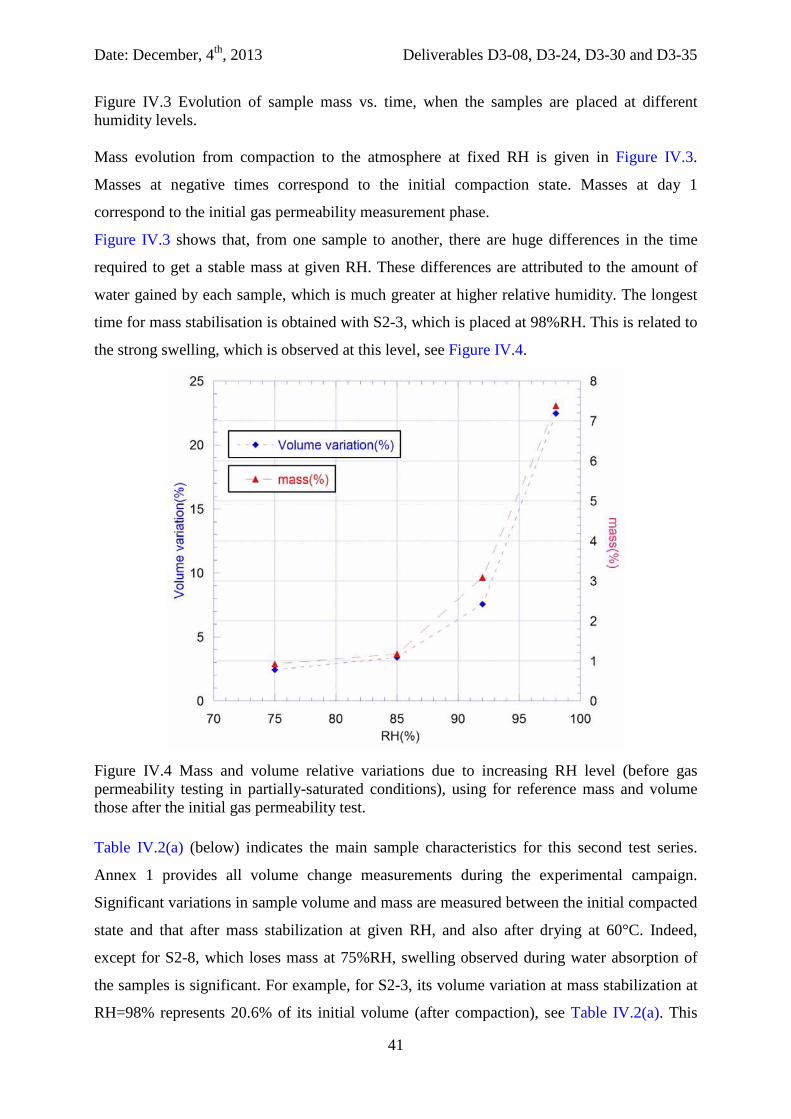
Figure IV.4 Mass and volume relative variations due to increasing RH level (before gas permeability testing in partially-saturated conditions), using for reference mass and volume those after the initial gas permeability test. Table IV.2(a) (below) indicates the main sample characteristics for this second test series.
Annex 1 provides all volume change measurements during the experimental campaign.
Significant variations in sample volume and mass are measured between the initial compacted
state and that after mass stabilization at given RH, and also after drying at 60°C. Indeed,
except for S2-8, which loses mass at 75%RH, swelling observed during water absorption of
the samples is significant. For example, for S2-3, its volume variation at mass stabilization at
RH=98% represents 20.6% of its initial volume (after compaction), see Table IV.2(a). This
Date: December, 4th, 2013 Deliverables D3-08, D3-24, D3-30 and D3-35
42
means that the actual pore volume is constantly changing during the swelling process due to
bentonite/sand deformability (related to water absorption). This is also the case at 100%RH,
where sample mass msaturated reflects the proportion of voids filled with water i.e. the
proportion of actual porosity filled with water. Significant sample volume changes also mean
that the choice of a reference volume for assessing physical properties (such as density,
porosity and water saturation) will require discussion.
Several physical properties of the samples are deduced from the raw data in Table IV.2(a), see
Table IV.2(b). Apparent plug density is calculated after compaction as: ρ = mcompact/Vcompact.
An “apparent” dry density ρdry = mdry/V, where V is either Vcompact (sample volume after
compaction), or Vdry (sample volume in the dry state). It is observed that all samples have a
good homogeneity in terms of apparent or dry density. Dry density values are closer when
calculated with Vcompact rather than with Vdry, hinting at greater volume changes after our
experiments (and the subsequent drying) than right after compaction.
A discussion about porosity (and further, about water saturation Sw) is proposed here, as this
property requires a reference volume to be calculated, as:
φ = (msaturated-mdry)/ρwater V (3)
where msaturated is sample saturated mass (obtained at stabilization in an hermetic chamber at
100%RH), mdry is dry mass, rwater is water density (1000kg/m3 at 20°C), and V is sample total
volume. It is noted that the humidity of 100%RH (used to obtain msaturated) is imposed by
placing each sample in a desiccator, over pure distilled water.
In Table IV.2(b), the volume after compaction Vcompact (i.e. the initial volume) is chosen as the
reference volume V to calculate φ . Therefore, φ represents an “artificial” porosity rather than
an actual one, due to significant sample volume changes from the dry to the so-called fully
water saturated state, see Table IV.2(b). Except for sample S2-2, which is significantly more
porous and less saturated than the other samples of the series, porosity values are on the order
of 47%+/-3.7.
Water saturation Sw, which is given below, will also be a conventional or artificial saturation,
assessed with respect to the same sample volume V, as:
Sw = (mRH – mdry)/ρwater φ V (4)
Date: December, 4th, 2013 Deliverables D3-08, D3-24, D3-30 and D3-35
43
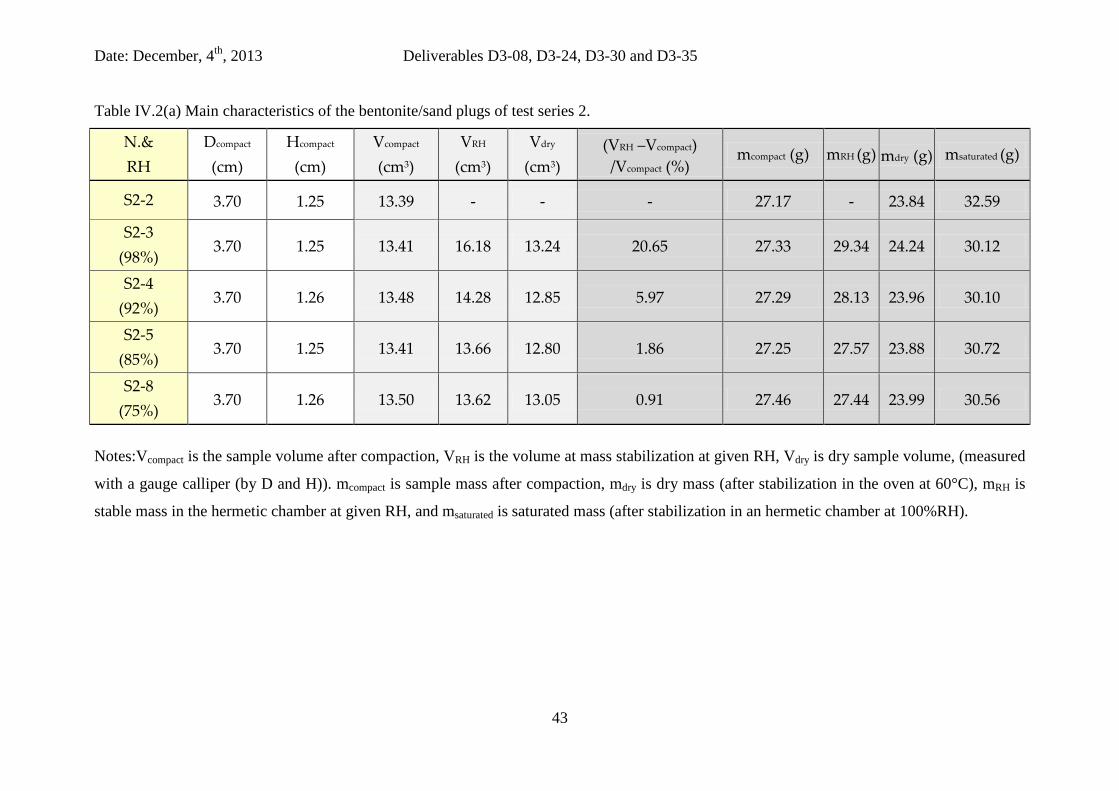
Table IV.2(a) Main characteristics of the bentonite/sand plugs of test series 2.
N.& RH
Dcompact
(cm) Нcompact
(cm) Vcompact (cm3)
VRH (cm3)
Vdry (cm3)
(VRH –Vcompact) /Vcompact (%)
mcompact (g) mRH (g) mdry (g) msaturated (g)
S2-2 3.70 1.25 13.39 - - - 27.17 - 23.84 32.59
S2-3 (98%)
3.70 1.25 13.41 16.18 13.24 20.65 27.33 29.34 24.24 30.12
S2-4 (92%)
3.70 1.26 13.48 14.28 12.85 5.97 27.29 28.13 23.96 30.10
S2-5 (85%)
3.70 1.25 13.41 13.66 12.80 1.86 27.25 27.57 23.88 30.72
S2-8 (75%)
3.70 1.26 13.50 13.62 13.05 0.91 27.46 27.44 23.99 30.56
Notes:Vcompact is the sample volume after compaction, VRH is the volume at mass stabilization at given RH, Vdry is dry sample volume, (measured
with a gauge calliper (by D and H)). mcompact is sample mass after compaction, mdry is dry mass (after stabilization in the oven at 60°C), mRH is
stable mass in the hermetic chamber at given RH, and msaturated is saturated mass (after stabilization in an hermetic chamber at 100%RH).
Date: December, 4th, 2013 Deliverables D3-08, D3-24, D3-30 and D3-35
44
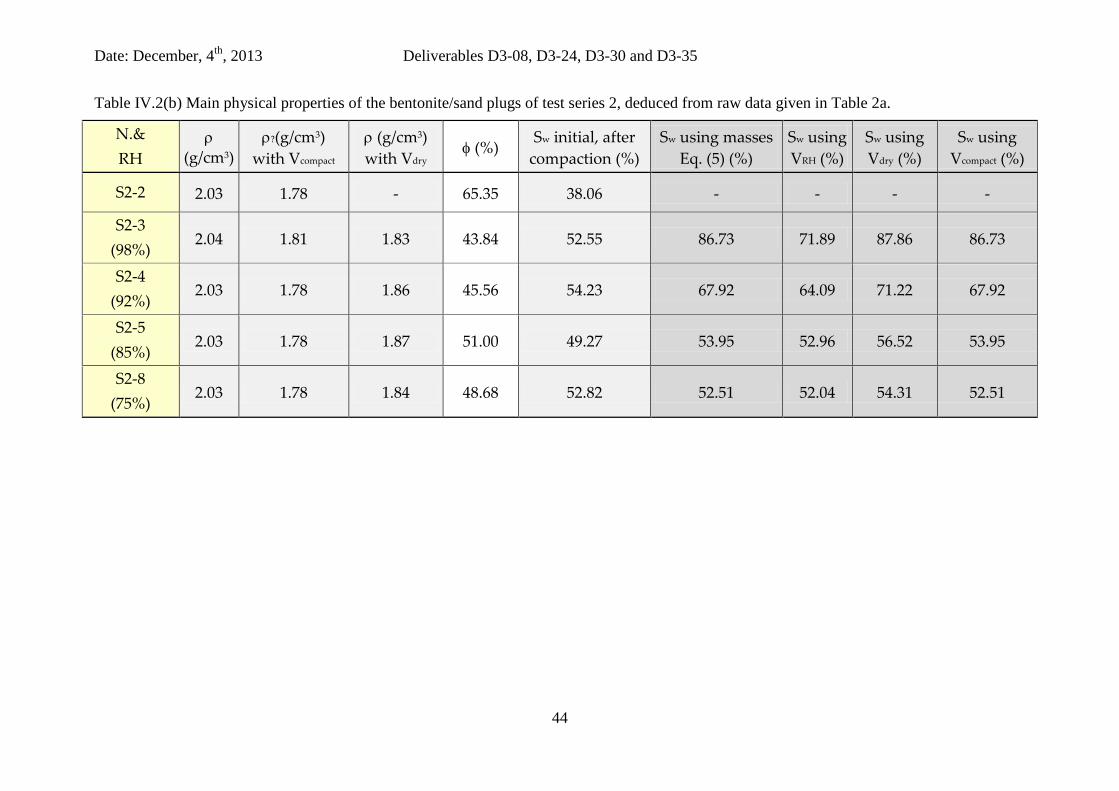
Table IV.2(b) Main physical properties of the bentonite/sand plugs of test series 2, deduced from raw data given in Table 2a.
N.& RH
ρ (g/cm3)
ρ?(g/cm3) with Vcompact
ρ (g/cm3) with Vdry
φ (%) Sw initial, after compaction (%)
Sw using masses Eq. (5) (%)
Sw using VRH (%)
Sw using Vdry (%)
Sw using Vcompact (%)
S2-2 2.03 1.78 - 65.35 38.06 - - - -
S2-3 (98%)
2.04 1.81 1.83 43.84 52.55 86.73 71.89 87.86 86.73
S2-4 (92%)
2.03 1.78 1.86 45.56 54.23 67.92 64.09 71.22 67.92
S2-5 (85%)
2.03 1.78 1.87 51.00 49.27 53.95 52.96 56.52 53.95
S2-8 (75%)
2.03 1.78 1.84 48.68 52.82 52.51 52.04 54.31 52.51
Date: December, 4th, 2013 Deliverables D3-08, D3-24, D3-30 and D3-35
45
V may be chosen as the volume after compaction (initial plug state) Vcompact, or as VRH (after
stabilization at given RH), or as the dry sample volume Vdry. When assessing Sw during the
gas transport experiment, the choice of Vcompact, which is the volume at the start of the tests, as
the reference volume is more appropriate than VRH (obtained during the experiment), or than
Vdry (obtained after permeability testing). Eq. (4) is also equivalent to:
Sw = (5)
Eq. (5) provides identical values for Sw as with Vcompact as the reference volume. With this
method, Sw ranges from 52.5% (for S2-8, subjected to 75%RH) and up to 86.7% (for S2-3,
subjected to 98%RH). It is noted that, while Sw decreases for S2-8 (75%RH) between
compaction and after mass stabilization at given RH, Sw increases for all the other samples,
subjected to RH from 85 and up to 98%. The case of S2-8 is noticeable, because this sample
swells while losing mass (from compaction to mass stabilisation at 75%RH), so that on the
whole, its saturation Sw decreases, see Table IV.2(a) and (b). This is attributed to a small de-
compaction effect, possibly related to the initial gas permeability measurement phase.
One also observes in Table IV.2(b) that dry density ρdry is slightly higher (by 0.01 to
0.04g/cm3) than the targeted one, which is of 1.77. Indeed, it is uneasy to obtain exactly the
required humidity for the bentonite/sand mix before its compaction. Nevertheless, this is not
an actual issue, as regards the phenomena and properties under study here.
IV. 2.2 Initial sample gas permeability
Results of gas permeability after compaction are provided in Figure IV.5. Except for S2-2,
which is only tested in the initial state, confining pressure was limited to 5MPa for the other
samples of the series (S2-3, S2-4, S2-5 and S2-8). This aims at limiting microstructure
changes before mass stabilization at given RH and subsequent Kg assessment.
Date: December, 4th, 2013 Deliverables D3-08, D3-24, D3-30 and D3-35
46
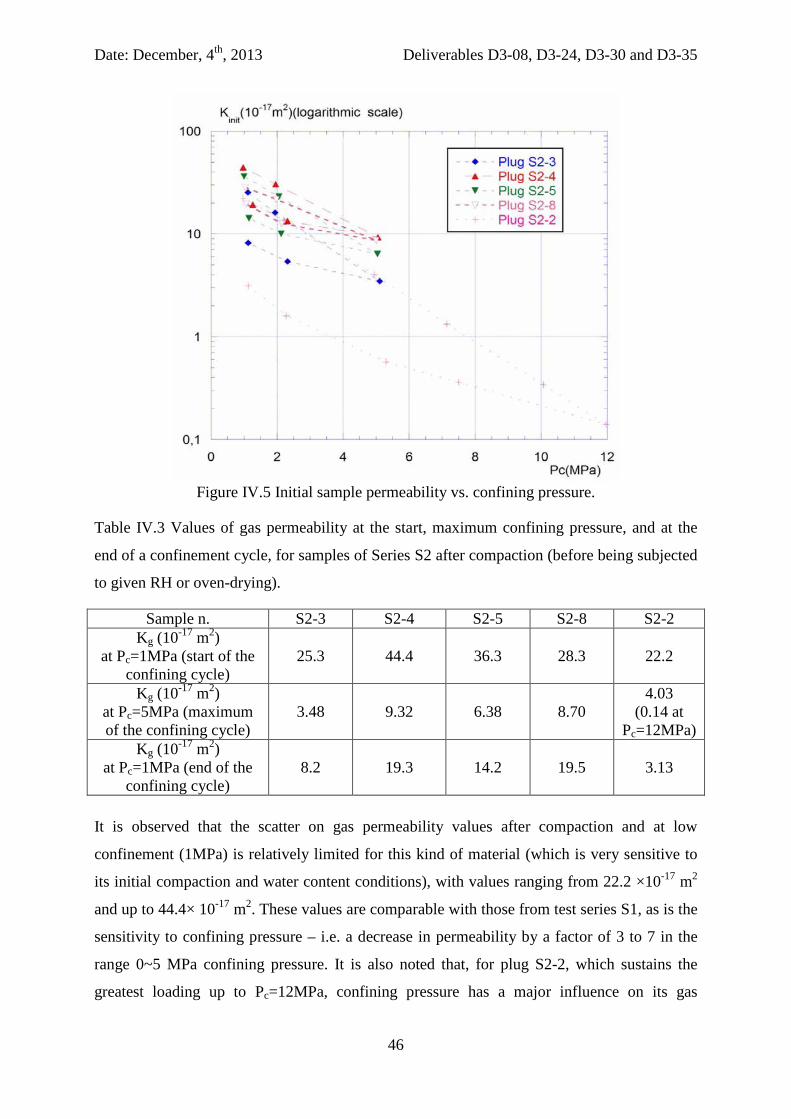
Figure IV.5 Initial sample permeability vs. confining pressure.
Table IV.3 Values of gas permeability at the start, maximum confining pressure, and at the
end of a confinement cycle, for samples of Series S2 after compaction (before being subjected
to given RH or oven-drying).
Sample n. S2-3 S2-4 S2-5 S2-8 S2-2 Kg (10-17 m2)
at Pc=1MPa (start of the confining cycle)
25.3 44.4 36.3 28.3 22.2
Kg (10-17 m2) at Pc=5MPa (maximum of the confining cycle)
3.48 9.32 6.38 8.70 4.03
(0.14 at Pc=12MPa)
Kg (10-17 m2) at Pc=1MPa (end of the
confining cycle) 8.2 19.3 14.2 19.5 3.13
It is observed that the scatter on gas permeability values after compaction and at low
confinement (1MPa) is relatively limited for this kind of material (which is very sensitive to
its initial compaction and water content conditions), with values ranging from 22.2 ×10⁻¹⁷ m2
and up to 44.4× 10⁻¹⁷ m2. These values are comparable with those from test series S1, as is the
sensitivity to confining pressure – i.e. a decrease in permeability by a factor of 3 to 7 in the
range 0~5 MPa confining pressure. It is also noted that, for plug S2-2, which sustains the
greatest loading up to Pc=12MPa, confining pressure has a major influence on its gas
Date: December, 4th, 2013 Deliverables D3-08, D3-24, D3-30 and D3-35
47
permeability, which drops down by two orders of magnitude between Pc=1MPa and
Pc=12MPa. This is attributed to a sort of pore collapse, i.e. a loss of pore volume accessible to
gas under confinement Pc. All samples display such pore closure, and it is irreversible in
nature, because no sample regains its initial gas permeability (that before the confining cycle
up to 5 or 12MPa). This irreversibility, or hysteresis in Kg (Pc) behaviour, is much more
marked for sample S2-2 than for S2-3, S2-4, S2-5 and S2-8, due to a greater confinement
amplitude, see Figure IV.5 and Table IV.3.
IV. 2.3 Coupled effects of saturation and confining pressure upon gas permeability
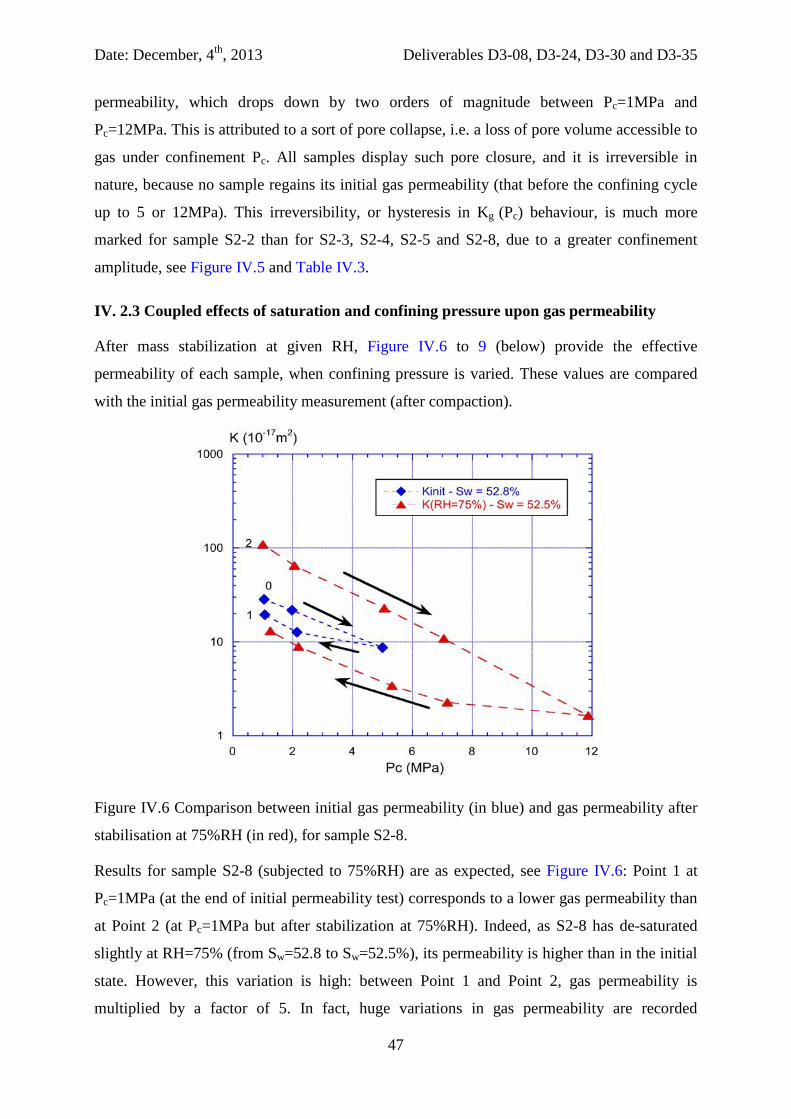
After mass stabilization at given RH, Figure IV.6 to 9 (below) provide the effective
permeability of each sample, when confining pressure is varied. These values are compared
with the initial gas permeability measurement (after compaction).
Figure IV.6 Comparison between initial gas permeability (in blue) and gas permeability after
stabilisation at 75%RH (in red), for sample S2-8.
Results for sample S2-8 (subjected to 75%RH) are as expected, see Figure IV.6: Point 1 at
Pc=1MPa (at the end of initial permeability test) corresponds to a lower gas permeability than
at Point 2 (at Pc=1MPa but after stabilization at 75%RH). Indeed, as S2-8 has de-saturated
slightly at RH=75% (from Sw=52.8 to Sw=52.5%), its permeability is higher than in the initial
state. However, this variation is high: between Point 1 and Point 2, gas permeability is
multiplied by a factor of 5. In fact, huge variations in gas permeability are recorded
Date: December, 4th, 2013 Deliverables D3-08, D3-24, D3-30 and D3-35
48
throughout our experimental campaign on bentonite/sand plugs. For instance, we will see in
Sub-section IV 3.4) that gas permeability is three orders of magnitude higher when comparing
the initial state and the dry state. This means that there is a very strong effect, upon gas
permeability, of drying from 52.8% down to “0”% saturation. Figure IV.6 also shows that the
slope of the decrease in permeability is comparable in the initial state and after 75%RH, when
confining pressure increases. This is because both saturation states of sample S2-8 are very
close. Nevertheless, a strong hysteretic effect is observed upon unloading, so that
permeability does not follow the same path during unloading as during loading. This
hysteresis occurs mainly from Pc=12MPa down to 5MPa, because, during unloading from
Pc=5 to 1MPa, Kg (Pc) still follows a similar slope as during loading. Due to this hysteresis, at
the lowest confinement used (Pc=1MPa), gas permeability is irreversibly lowered by the
confinement cycle: at Pc=1MPa, Kg decreases by a factor of 8.4 (from 109×10-17m2 down to
13x10-17m2). And while Kg (Pc) is almost linear during loading, it is highly non linear in the
unloading range (12-5MPa). This is attributed to an irreversible compaction of the sample,
with a volume decrease from 13.62cm3 down to 13.29cm3, i.e. by 2.4% only.
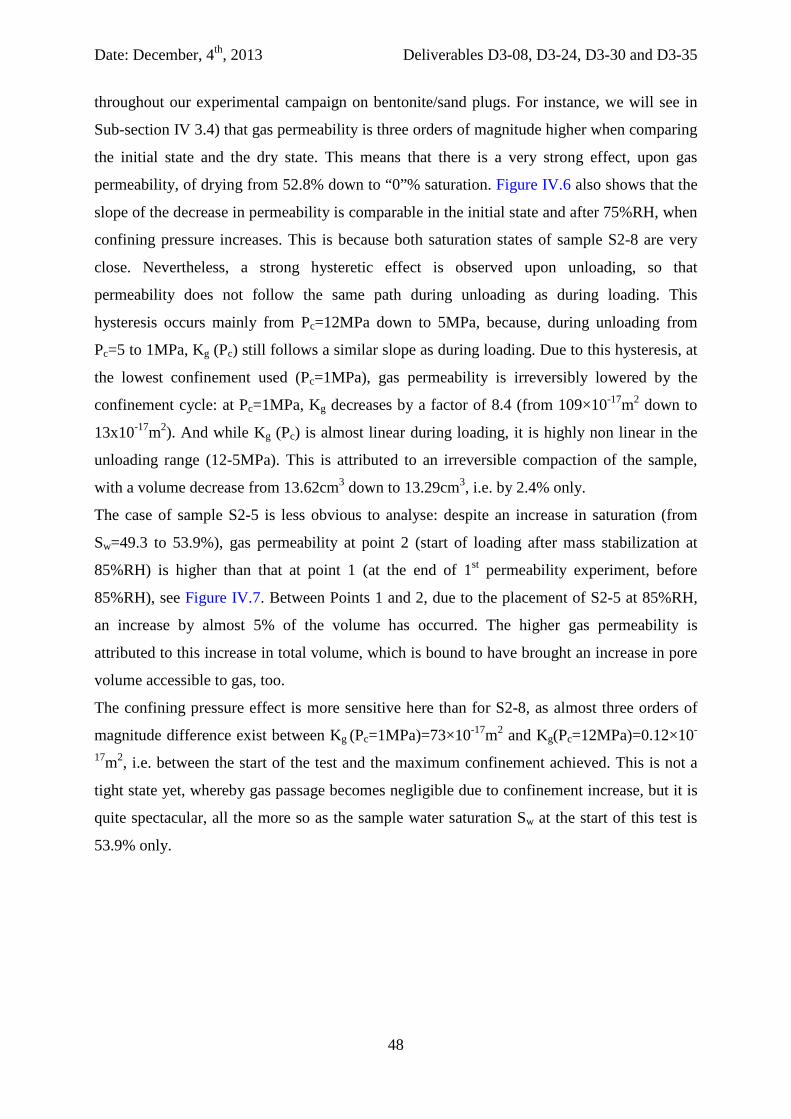
The case of sample S2-5 is less obvious to analyse: despite an increase in saturation (from
Sw=49.3 to 53.9%), gas permeability at point 2 (start of loading after mass stabilization at
85%RH) is higher than that at point 1 (at the end of 1st permeability experiment, before
85%RH), see Figure IV.7. Between Points 1 and 2, due to the placement of S2-5 at 85%RH,
an increase by almost 5% of the volume has occurred. The higher gas permeability is
attributed to this increase in total volume, which is bound to have brought an increase in pore
volume accessible to gas, too.
The confining pressure effect is more sensitive here than for S2-8, as almost three orders of
magnitude difference exist between Kg (Pc=1MPa)=73×10-17m2 and Kg(Pc=12MPa)=0.12×10-
17m2, i.e. between the start of the test and the maximum confinement achieved. This is not a
tight state yet, whereby gas passage becomes negligible due to confinement increase, but it is
quite spectacular, all the more so as the sample water saturation Sw at the start of this test is
53.9% only.
Date: December, 4th, 2013 Deliverables D3-08, D3-24, D3-30 and D3-35
49
Figure IV.7 Comparison between initial gas permeability (in blue) and gas permeability after
stabilisation at 85%RH (in red), for sample S2-5.
There is also a stronger hysteretic effect during the unloading phase, which occurs now
mainly in the range 12-5MPa. As for S2-8, it is associated to sample volume change, from
13.66cm3 (at the start of the second gas permeability test) to 13.25cm3 (at the end of this test),
i.e. by 3% only, see Annex 1. This is a clear evidence of the major effect of sample volume
variation on its gas permeability. The difference in permeability between 2 and 3 can be
clearly attributed to this volume variation.
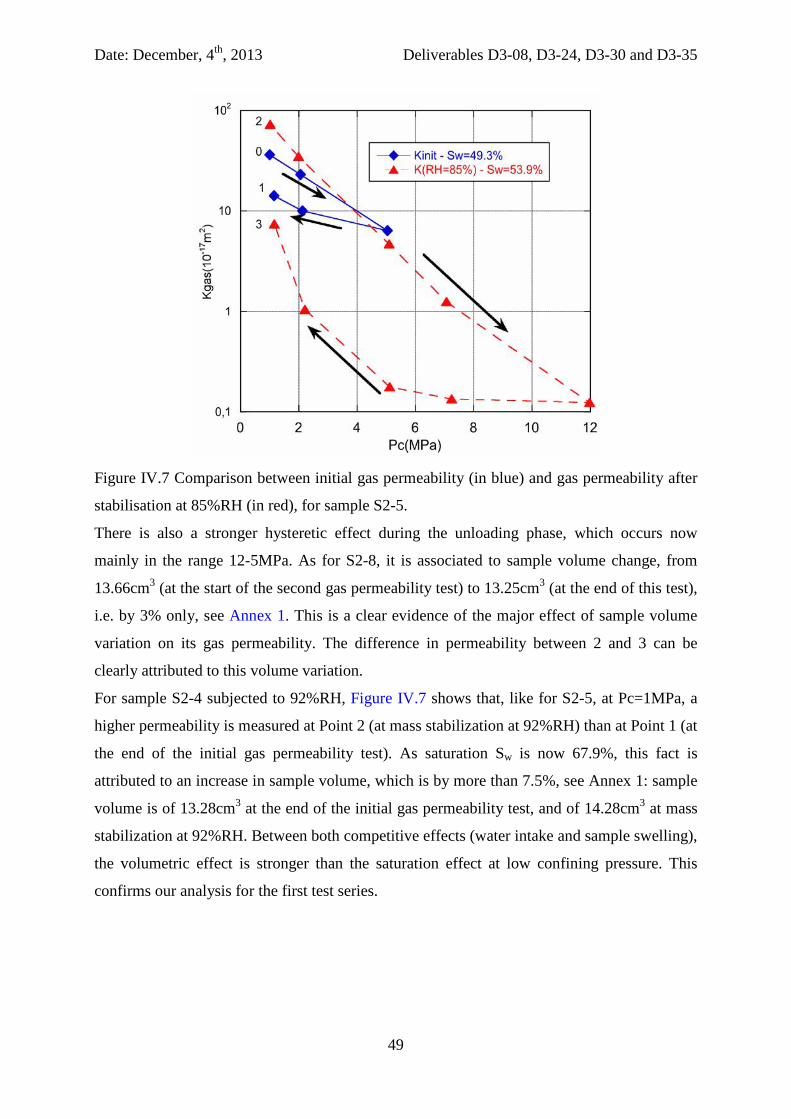
For sample S2-4 subjected to 92%RH, Figure IV.7 shows that, like for S2-5, at Pc=1MPa, a
higher permeability is measured at Point 2 (at mass stabilization at 92%RH) than at Point 1 (at
the end of the initial gas permeability test). As saturation Sw is now 67.9%, this fact is
attributed to an increase in sample volume, which is by more than 7.5%, see Annex 1: sample
volume is of 13.28cm3 at the end of the initial gas permeability test, and of 14.28cm3 at mass
stabilization at 92%RH. Between both competitive effects (water intake and sample swelling),
the volumetric effect is stronger than the saturation effect at low confining pressure. This
confirms our analysis for the first test series.
Date: December, 4th, 2013 Deliverables D3-08, D3-24, D3-30 and D3-35
50
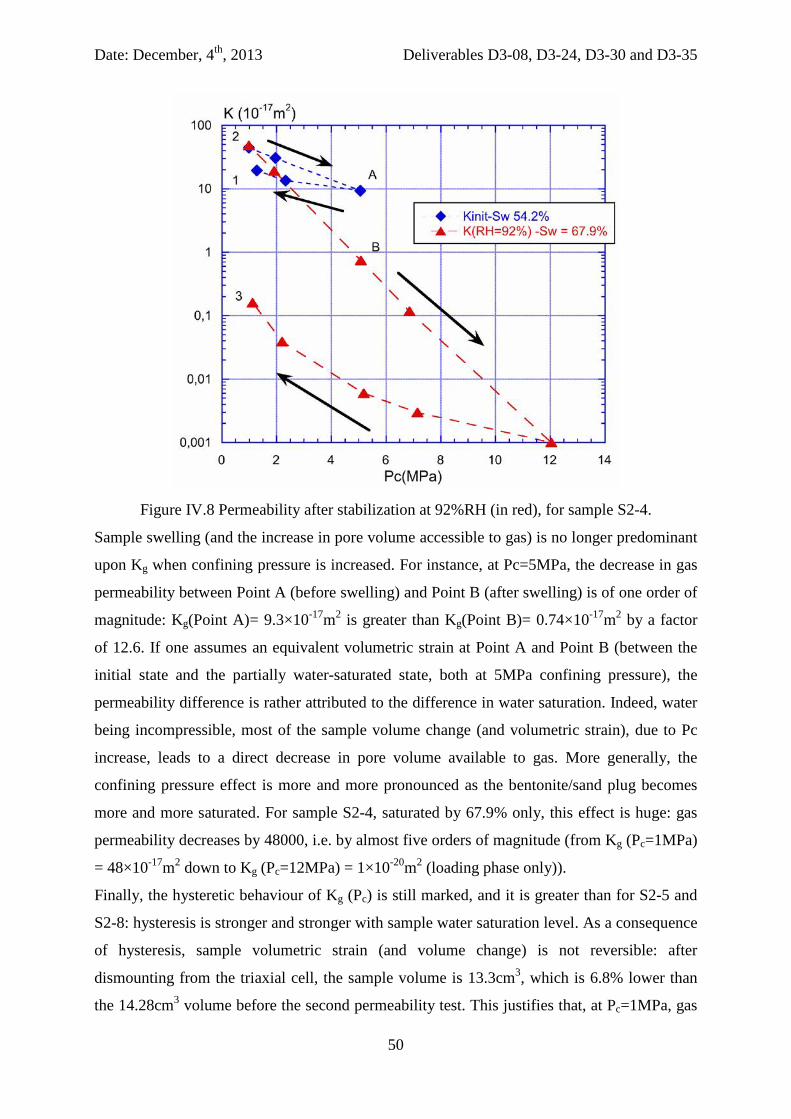
Figure IV.8 Permeability after stabilization at 92%RH (in red), for sample S2-4.
Sample swelling (and the increase in pore volume accessible to gas) is no longer predominant
upon Kg when confining pressure is increased. For instance, at Pc=5MPa, the decrease in gas
permeability between Point A (before swelling) and Point B (after swelling) is of one order of
magnitude: Kg(Point A)= 9.3×10⁻¹⁷m2 is greater than Kg(Point B)= 0.74×10⁻¹⁷m2 by a factor
of 12.6. If one assumes an equivalent volumetric strain at Point A and Point B (between the
initial state and the partially water-saturated state, both at 5MPa confining pressure), the
permeability difference is rather attributed to the difference in water saturation. Indeed, water
being incompressible, most of the sample volume change (and volumetric strain), due to Pc
increase, leads to a direct decrease in pore volume available to gas. More generally, the
confining pressure effect is more and more pronounced as the bentonite/sand plug becomes
more and more saturated. For sample S2-4, saturated by 67.9% only, this effect is huge: gas
permeability decreases by 48000, i.e. by almost five orders of magnitude (from Kg (Pc=1MPa)
= 48×10-17m2 down to Kg (Pc=12MPa) = 1×10-20m2 (loading phase only)).
Finally, the hysteretic behaviour of Kg (Pc) is still marked, and it is greater than for S2-5 and
S2-8: hysteresis is stronger and stronger with sample water saturation level. As a consequence
of hysteresis, sample volumetric strain (and volume change) is not reversible: after
dismounting from the triaxial cell, the sample volume is 13.3cm3, which is 6.8% lower than
the 14.28cm3 volume before the second permeability test. This justifies that, at Pc=1MPa, gas
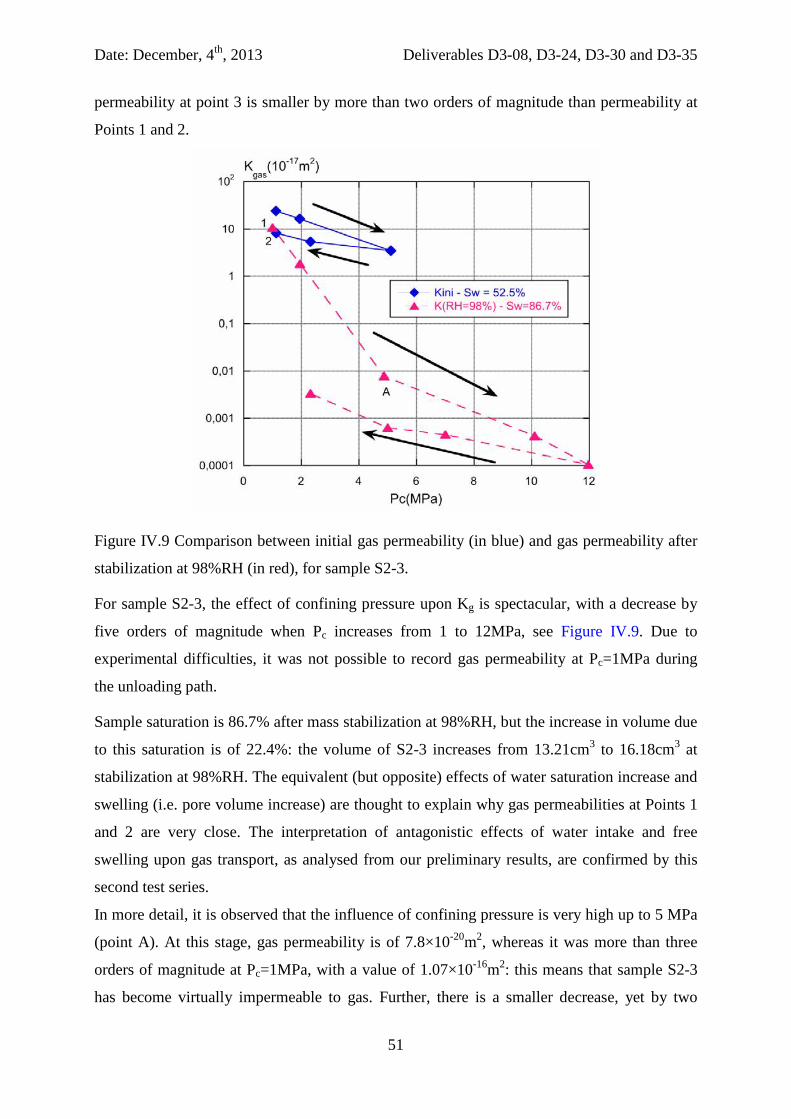
Date: December, 4th, 2013 Deliverables D3-08, D3-24, D3-30 and D3-35
51
permeability at point 3 is smaller by more than two orders of magnitude than permeability at
Points 1 and 2.
Figure IV.9 Comparison between initial gas permeability (in blue) and gas permeability after
stabilization at 98%RH (in red), for sample S2-3.
For sample S2-3, the effect of confining pressure upon Kg is spectacular, with a decrease by
five orders of magnitude when Pc increases from 1 to 12MPa, see Figure IV.9. Due to
experimental difficulties, it was not possible to record gas permeability at Pc=1MPa during
the unloading path.
Sample saturation is 86.7% after mass stabilization at 98%RH, but the increase in volume due
to this saturation is of 22.4%: the volume of S2-3 increases from 13.21cm3 to 16.18cm3 at
stabilization at 98%RH. The equivalent (but opposite) effects of water saturation increase and
swelling (i.e. pore volume increase) are thought to explain why gas permeabilities at Points 1
and 2 are very close. The interpretation of antagonistic effects of water intake and free
swelling upon gas transport, as analysed from our preliminary results, are confirmed by this
second test series.
In more detail, it is observed that the influence of confining pressure is very high up to 5 MPa
(point A). At this stage, gas permeability is of 7.8×10⁻²⁰m2, whereas it was more than three
orders of magnitude at Pc=1MPa, with a value of 1.07×10⁻¹⁶m2: this means that sample S2-3
has become virtually impermeable to gas. Further, there is a smaller decrease, yet by two
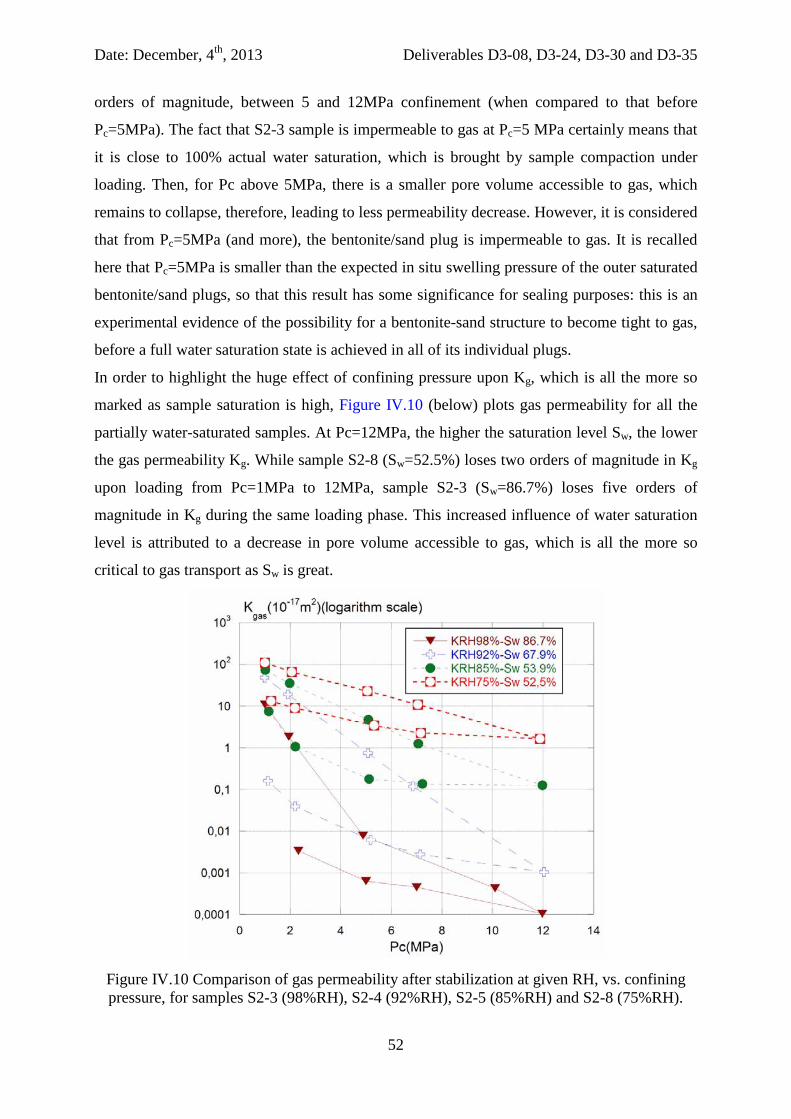
Date: December, 4th, 2013 Deliverables D3-08, D3-24, D3-30 and D3-35
52
orders of magnitude, between 5 and 12MPa confinement (when compared to that before
Pc=5MPa). The fact that S2-3 sample is impermeable to gas at Pc=5 MPa certainly means that
it is close to 100% actual water saturation, which is brought by sample compaction under
loading. Then, for Pc above 5MPa, there is a smaller pore volume accessible to gas, which
remains to collapse, therefore, leading to less permeability decrease. However, it is considered
that from Pc=5MPa (and more), the bentonite/sand plug is impermeable to gas. It is recalled
here that Pc=5MPa is smaller than the expected in situ swelling pressure of the outer saturated
bentonite/sand plugs, so that this result has some significance for sealing purposes: this is an
experimental evidence of the possibility for a bentonite-sand structure to become tight to gas,
before a full water saturation state is achieved in all of its individual plugs.
In order to highlight the huge effect of confining pressure upon Kg, which is all the more so
marked as sample saturation is high, Figure IV.10 (below) plots gas permeability for all the
partially water-saturated samples. At Pc=12MPa, the higher the saturation level Sw, the lower
the gas permeability Kg. While sample S2-8 (Sw=52.5%) loses two orders of magnitude in Kg
upon loading from Pc=1MPa to 12MPa, sample S2-3 (Sw=86.7%) loses five orders of
magnitude in Kg during the same loading phase. This increased influence of water saturation
level is attributed to a decrease in pore volume accessible to gas, which is all the more so
critical to gas transport as Sw is great.
Figure IV.10 Comparison of gas permeability after stabilization at given RH, vs. confining pressure, for samples S2-3 (98%RH), S2-4 (92%RH), S2-5 (85%RH) and S2-8 (75%RH).
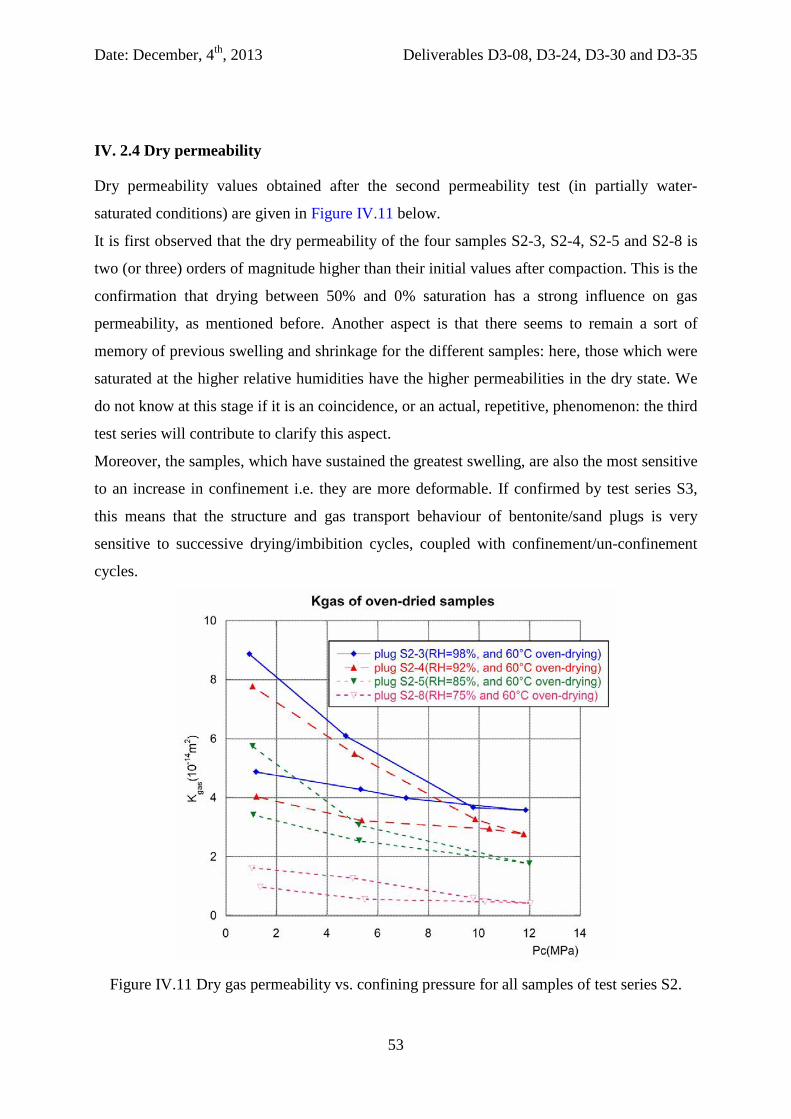
Date: December, 4th, 2013 Deliverables D3-08, D3-24, D3-30 and D3-35
53
IV. 2.4 Dry permeability
Dry permeability values obtained after the second permeability test (in partially water-
saturated conditions) are given in Figure IV.11 below.
It is first observed that the dry permeability of the four samples S2-3, S2-4, S2-5 and S2-8 is
two (or three) orders of magnitude higher than their initial values after compaction. This is the
confirmation that drying between 50% and 0% saturation has a strong influence on gas
permeability, as mentioned before. Another aspect is that there seems to remain a sort of
memory of previous swelling and shrinkage for the different samples: here, those which were
saturated at the higher relative humidities have the higher permeabilities in the dry state. We
do not know at this stage if it is an coincidence, or an actual, repetitive, phenomenon: the third
test series will contribute to clarify this aspect.
Moreover, the samples, which have sustained the greatest swelling, are also the most sensitive
to an increase in confinement i.e. they are more deformable. If confirmed by test series S3,
this means that the structure and gas transport behaviour of bentonite/sand plugs is very
sensitive to successive drying/imbibition cycles, coupled with confinement/un-confinement
cycles.
Figure IV.11 Dry gas permeability vs. confining pressure for all samples of test series S2.
Date: December, 4th, 2013 Deliverables D3-08, D3-24, D3-30 and D3-35
54
IV.3 Complementary tests (third test series)
A last test series was performed to confirm the main trends, which were observed during the
first two series. This series was not subjected to any initial gas permeability measurement
(and confinement) prior to free swelling at given RH. Indeed, this was decided in order to
avoid any over-compaction of the plugs due to confinement (which is unavoidable with our
gas permeability test method), before swelling. One plug only (number S3-9) was tested after
the initial compaction, to acquire one reference value for initial gas permeability. Another
single sample (S3-14) has been prepared by compaction and oven-drying at 60°C until mass
stabilization, in order to assess directly its pore volume accessible to gas under varying
confining pressure.
IV. 3.1 Mass and volume changes
Tables 5a and 5b below show the general physical properties of the plugs from this series S3.
For this test series, average porosity is of 42.3%+/-3.8, which is slightly lower than for test
series S2 (φ=47%+/-3.8). Dry and apparent densities are comparable for both test series,
although they are slightly higher for test series S3 (by 0.05g/cm3 i.e. by 2.4%). Initial
saturation levels (after compaction) are also greater for series S3, by more than 10%. After
mass stabilization at given RH, as for test series S2, Sw increases with increasing RH, except
for S3-10 (75%RH) and S3-11 (85%RH). In this case, initial Sw is greater for S3-10 than for
S3-11, so that S3-10 has not stabilized at a lower Sw than S3-11 at 75%RH. Sample S3-10
loses mass during its placement at RH=75%, similarly to S2-8, yet it also shrinks (whereas
S2-8 swell). Therefore, results for sample S3-10 will be analysed with caution when
comparing with previous test series, and with less saturated S3-11.
A significant shrinkage is noted after mass stabilisation at 11%RH, with -6.7% volume
change, while a huge swelling (by 19.8% volume change) occurs at RH=98%.
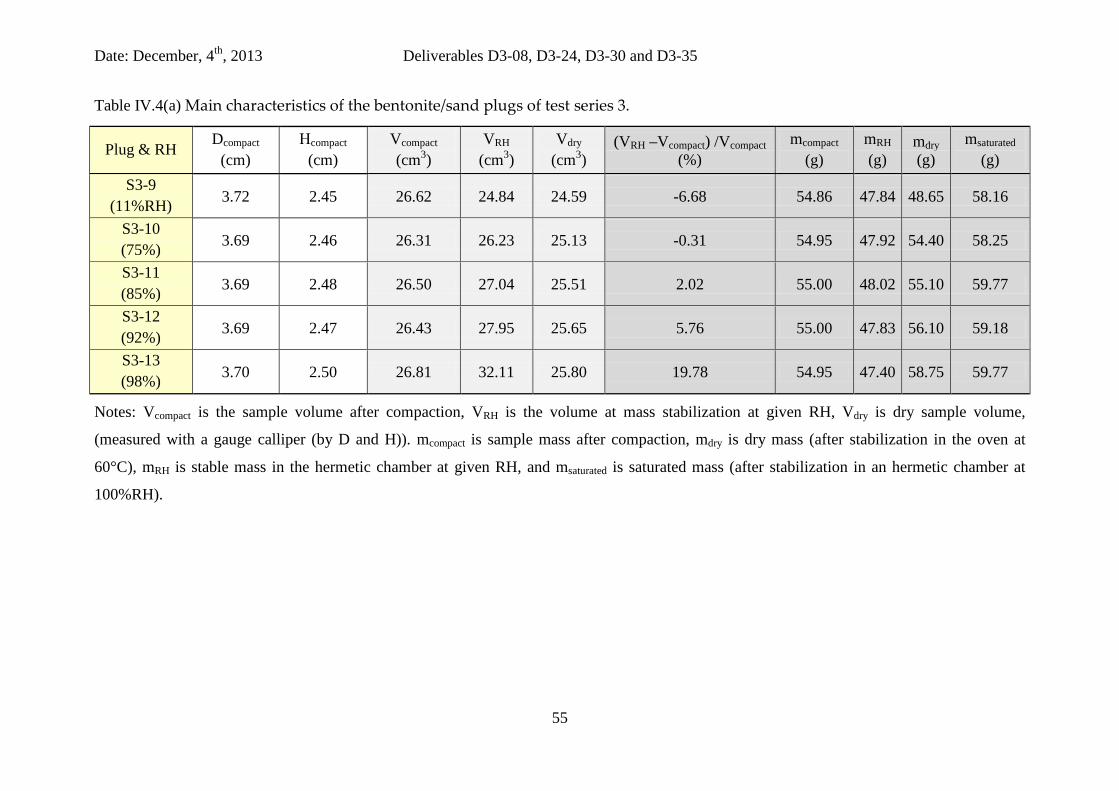
Date: December, 4th, 2013 Deliverables D3-08, D3-24, D3-30 and D3-35
55
Table IV.4(a) Main characteristics of the bentonite/sand plugs of test series 3.
Plug & RH Dcompact
(cm) Нcompact
(cm) Vcompact (cm3)
VRH (cm3)
Vdry (cm3)
(VRH –Vcompact) /Vcompact (%)
mcompact (g)
mRH
(g) mdry (g)
msaturated
(g) S3-9
(11%RH) 3.72 2.45 26.62 24.84 24.59 -6.68 54.86 47.84 48.65 58.16
S3-10 (75%) 3.69 2.46 26.31 26.23 25.13 -0.31 54.95 47.92 54.40 58.25
S3-11 (85%) 3.69 2.48 26.50 27.04 25.51 2.02 55.00 48.02 55.10 59.77
S3-12 (92%) 3.69 2.47 26.43 27.95 25.65 5.76 55.00 47.83 56.10 59.18
S3-13 (98%) 3.70 2.50 26.81 32.11 25.80 19.78 54.95 47.40 58.75 59.77
Notes: Vcompact is the sample volume after compaction, VRH is the volume at mass stabilization at given RH, Vdry is dry sample volume,
(measured with a gauge calliper (by D and H)). mcompact is sample mass after compaction, mdry is dry mass (after stabilization in the oven at
60°C), mRH is stable mass in the hermetic chamber at given RH, and msaturated is saturated mass (after stabilization in an hermetic chamber at
100%RH).
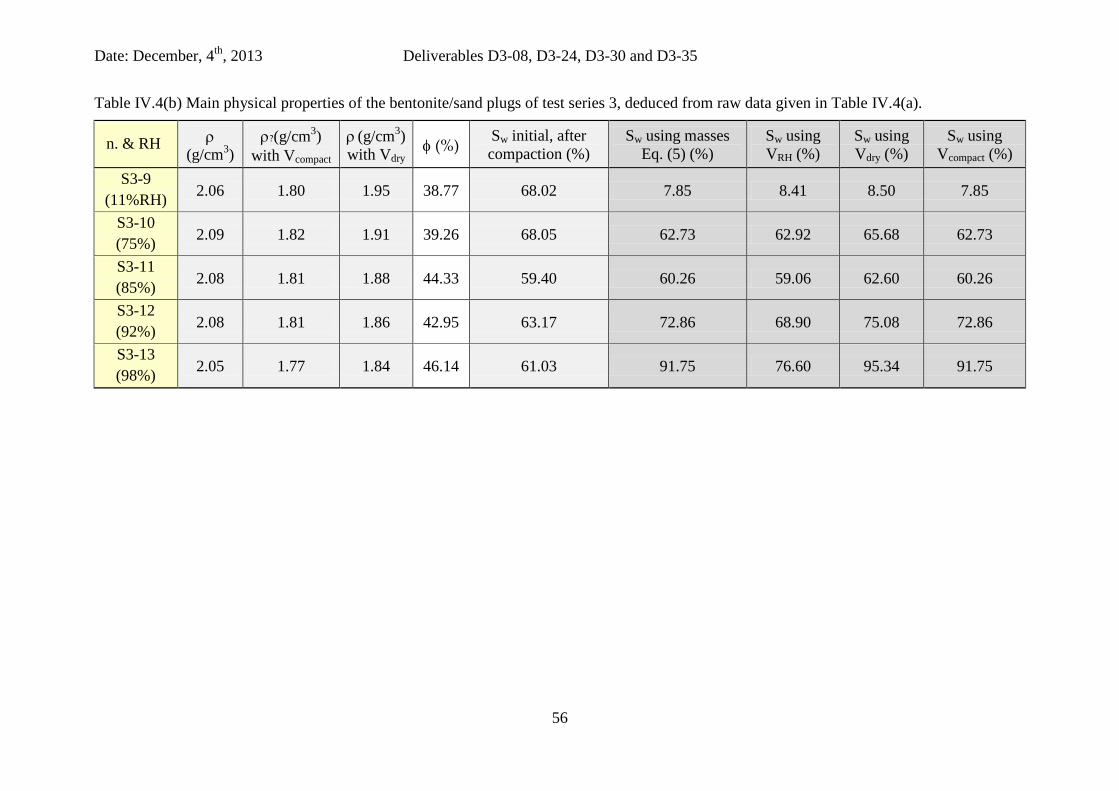
Date: December, 4th, 2013 Deliverables D3-08, D3-24, D3-30 and D3-35
56
Table IV.4(b) Main physical properties of the bentonite/sand plugs of test series 3, deduced from raw data given in Table IV.4(a).
n. & RH ρ (g/cm3)
ρ?(g/cm3) with Vcompact
ρ (g/cm3) with Vdry
φ (%) Sw initial, after compaction (%)
Sw using masses Eq. (5) (%)
Sw using VRH (%)
Sw using Vdry (%)
Sw using Vcompact (%)
S3-9 (11%RH) 2.06 1.80 1.95 38.77 68.02 7.85 8.41 8.50 7.85
S3-10 (75%) 2.09 1.82 1.91 39.26 68.05 62.73 62.92 65.68 62.73
S3-11 (85%) 2.08 1.81 1.88 44.33 59.40 60.26 59.06 62.60 60.26
S3-12 (92%) 2.08 1.81 1.86 42.95 63.17 72.86 68.90 75.08 72.86
S3-13 (98%) 2.05 1.77 1.84 46.14 61.03 91.75 76.60 95.34 91.75
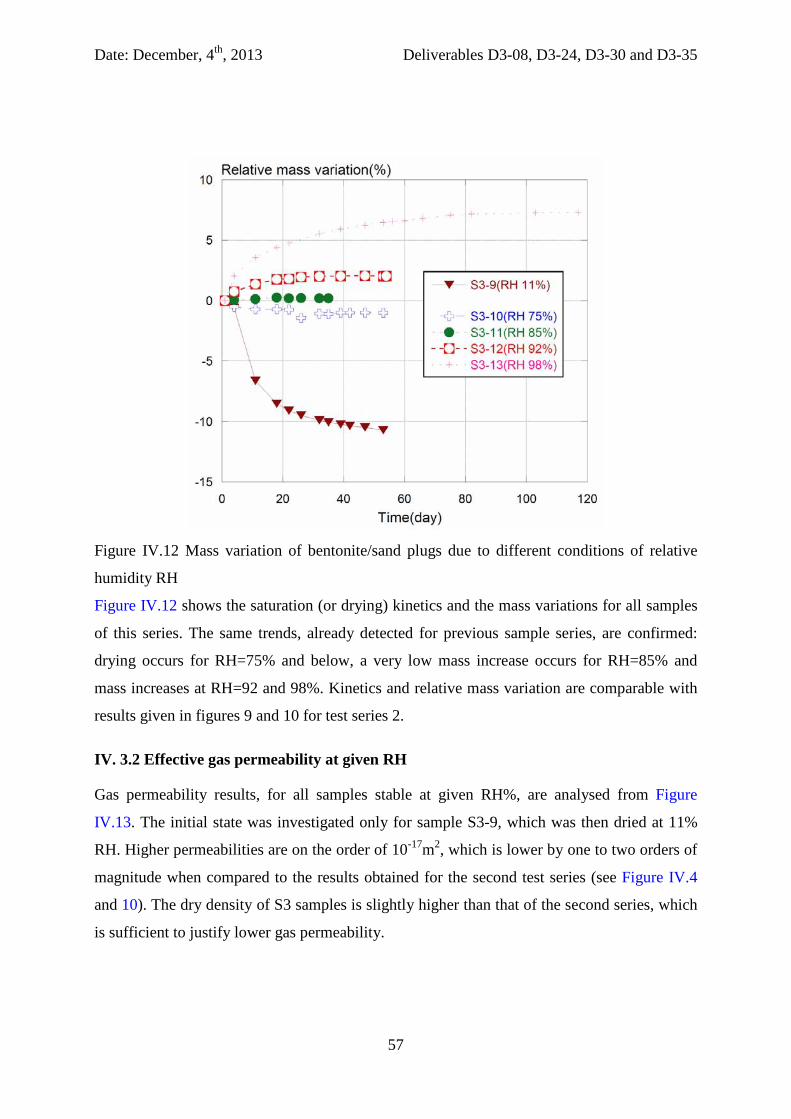
Date: December, 4th, 2013 Deliverables D3-08, D3-24, D3-30 and D3-35
57
Figure IV.12 Mass variation of bentonite/sand plugs due to different conditions of relative
humidity RH
Figure IV.12 shows the saturation (or drying) kinetics and the mass variations for all samples
of this series. The same trends, already detected for previous sample series, are confirmed:
drying occurs for RH=75% and below, a very low mass increase occurs for RH=85% and
mass increases at RH=92 and 98%. Kinetics and relative mass variation are comparable with
results given in figures 9 and 10 for test series 2.
IV. 3.2 Effective gas permeability at given RH
Gas permeability results, for all samples stable at given RH%, are analysed from Figure
IV.13. The initial state was investigated only for sample S3-9, which was then dried at 11%
RH. Higher permeabilities are on the order of 10-17m2, which is lower by one to two orders of
magnitude when compared to the results obtained for the second test series (see Figure IV.4
and 10). The dry density of S3 samples is slightly higher than that of the second series, which
is sufficient to justify lower gas permeability.
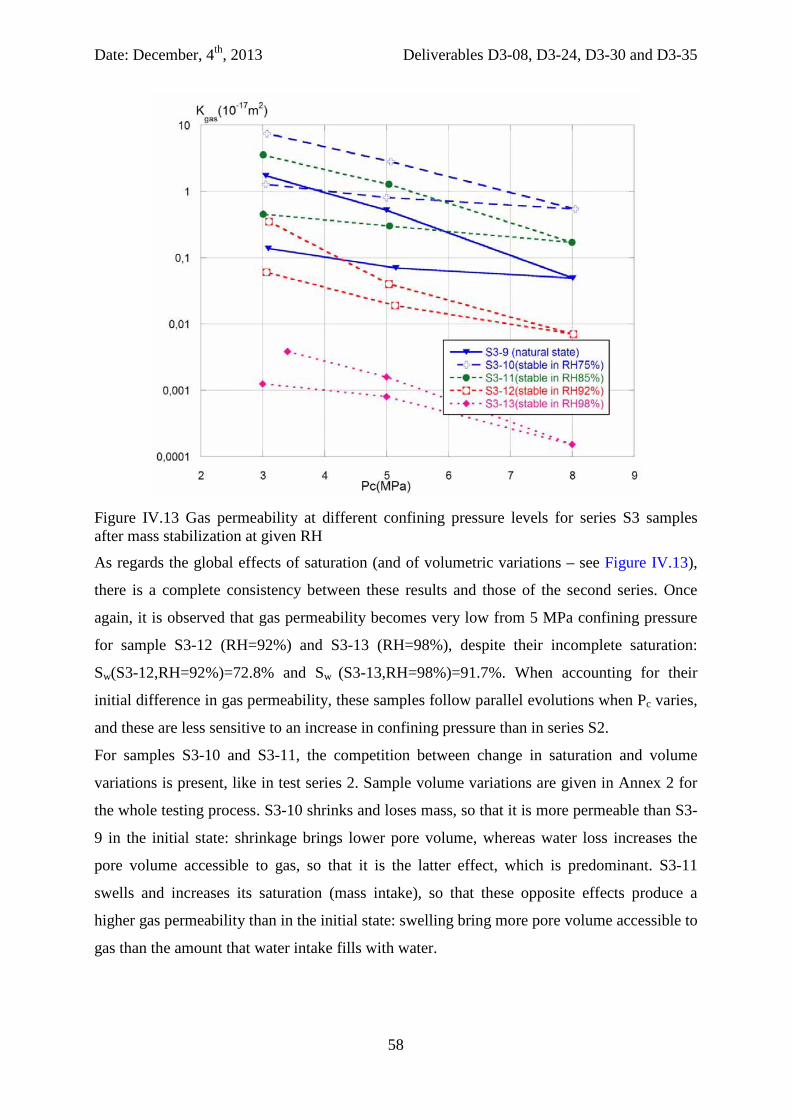
Date: December, 4th, 2013 Deliverables D3-08, D3-24, D3-30 and D3-35
58
Figure IV.13 Gas permeability at different confining pressure levels for series S3 samples after mass stabilization at given RH
As regards the global effects of saturation (and of volumetric variations – see Figure IV.13),
there is a complete consistency between these results and those of the second series. Once
again, it is observed that gas permeability becomes very low from 5 MPa confining pressure
for sample S3-12 (RH=92%) and S3-13 (RH=98%), despite their incomplete saturation:
Sw(S3-12,RH=92%)=72.8% and Sw (S3-13,RH=98%)=91.7%. When accounting for their
initial difference in gas permeability, these samples follow parallel evolutions when Pc varies,
and these are less sensitive to an increase in confining pressure than in series S2.
For samples S3-10 and S3-11, the competition between change in saturation and volume
variations is present, like in test series 2. Sample volume variations are given in Annex 2 for
the whole testing process. S3-10 shrinks and loses mass, so that it is more permeable than S3-
9 in the initial state: shrinkage brings lower pore volume, whereas water loss increases the
pore volume accessible to gas, so that it is the latter effect, which is predominant. S3-11
swells and increases its saturation (mass intake), so that these opposite effects produce a
higher gas permeability than in the initial state: swelling bring more pore volume accessible to
gas than the amount that water intake fills with water.
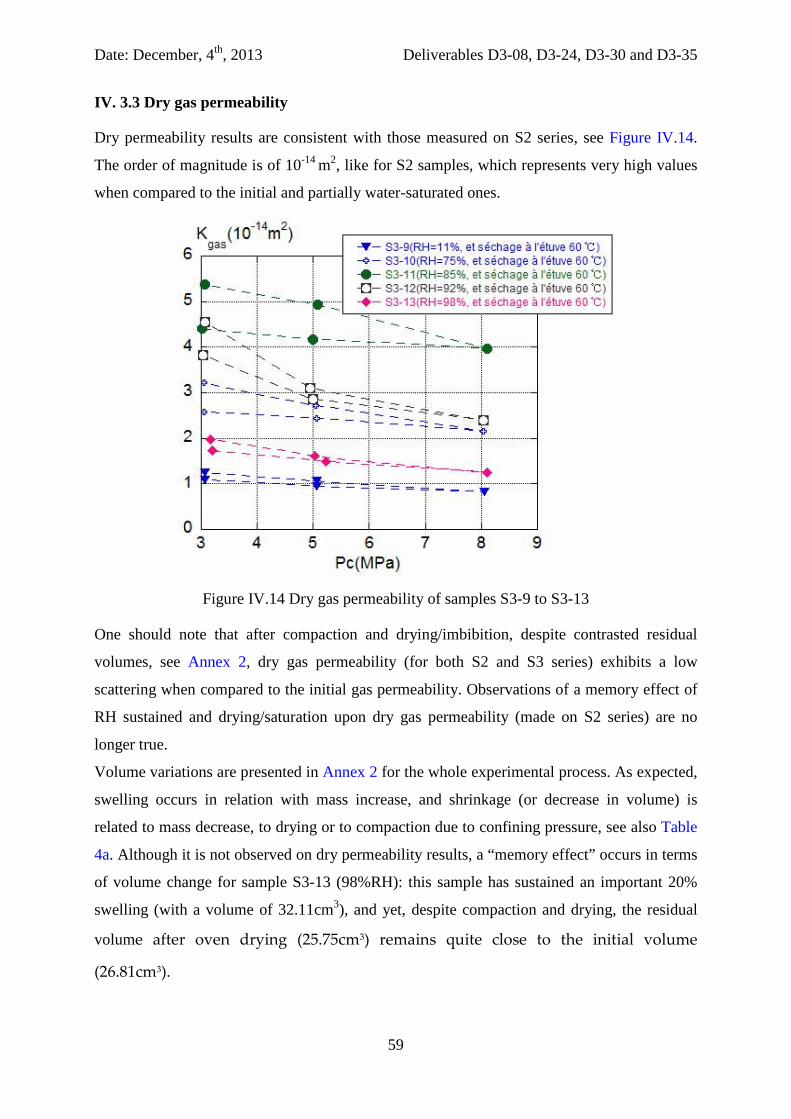
Date: December, 4th, 2013 Deliverables D3-08, D3-24, D3-30 and D3-35
59
IV. 3.3 Dry gas permeability
Dry permeability results are consistent with those measured on S2 series, see Figure IV.14.
The order of magnitude is of 10-14 m2, like for S2 samples, which represents very high values
when compared to the initial and partially water-saturated ones.
Figure IV.14 Dry gas permeability of samples S3-9 to S3-13
One should note that after compaction and drying/imbibition, despite contrasted residual
volumes, see Annex 2, dry gas permeability (for both S2 and S3 series) exhibits a low
scattering when compared to the initial gas permeability. Observations of a memory effect of
RH sustained and drying/saturation upon dry gas permeability (made on S2 series) are no
longer true.
Volume variations are presented in Annex 2 for the whole experimental process. As expected,
swelling occurs in relation with mass increase, and shrinkage (or decrease in volume) is
related to mass decrease, to drying or to compaction due to confining pressure, see also Table
4a. Although it is not observed on dry permeability results, a “memory effect” occurs in terms
of volume change for sample S3-13 (98%RH): this sample has sustained an important 20%
swelling (with a volume of 32.11cm3), and yet, despite compaction and drying, the residual
volume after oven drying (25.75cm3) remains quite close to the initial volume
(26.81cm3).
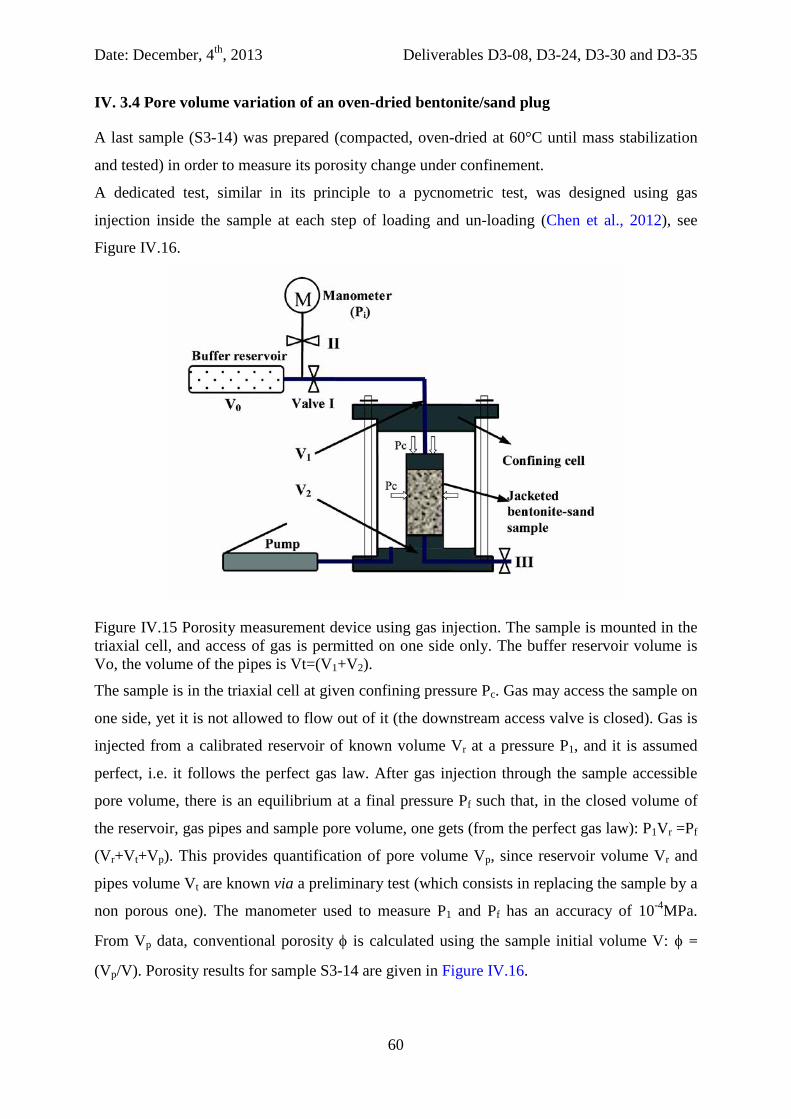
Date: December, 4th, 2013 Deliverables D3-08, D3-24, D3-30 and D3-35
60
IV. 3.4 Pore volume variation of an oven-dried bentonite/sand plug
A last sample (S3-14) was prepared (compacted, oven-dried at 60°C until mass stabilization
and tested) in order to measure its porosity change under confinement.
A dedicated test, similar in its principle to a pycnometric test, was designed using gas
injection inside the sample at each step of loading and un-loading (Chen et al., 2012), see
Figure IV.16.
Figure IV.15 Porosity measurement device using gas injection. The sample is mounted in the triaxial cell, and access of gas is permitted on one side only. The buffer reservoir volume is Vo, the volume of the pipes is Vt=(V1+V2).
The sample is in the triaxial cell at given confining pressure Pc. Gas may access the sample on
one side, yet it is not allowed to flow out of it (the downstream access valve is closed). Gas is
injected from a calibrated reservoir of known volume Vr at a pressure P1, and it is assumed
perfect, i.e. it follows the perfect gas law. After gas injection through the sample accessible
pore volume, there is an equilibrium at a final pressure Pf such that, in the closed volume of
the reservoir, gas pipes and sample pore volume, one gets (from the perfect gas law): P1Vr =Pf
(Vr+Vt+Vp). This provides quantification of pore volume Vp, since reservoir volume Vr and
pipes volume Vt are known via a preliminary test (which consists in replacing the sample by a
non porous one). The manometer used to measure P1 and Pf has an accuracy of 10-4MPa.
From Vp data, conventional porosity φ is calculated using the sample initial volume V: φ =
(Vp/V). Porosity results for sample S3-14 are given in Figure IV.16.
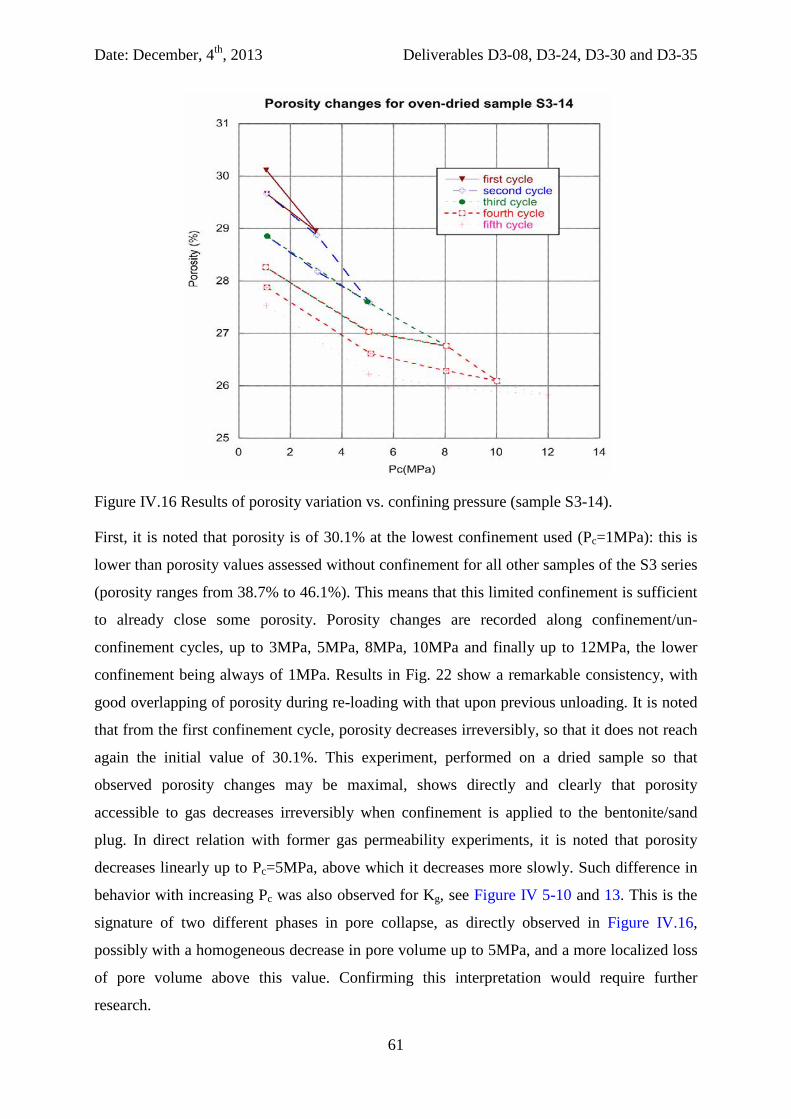
Date: December, 4th, 2013 Deliverables D3-08, D3-24, D3-30 and D3-35
61
Figure IV.16 Results of porosity variation vs. confining pressure (sample S3-14).
First, it is noted that porosity is of 30.1% at the lowest confinement used (Pc=1MPa): this is
lower than porosity values assessed without confinement for all other samples of the S3 series
(porosity ranges from 38.7% to 46.1%). This means that this limited confinement is sufficient
to already close some porosity. Porosity changes are recorded along confinement/un-
confinement cycles, up to 3MPa, 5MPa, 8MPa, 10MPa and finally up to 12MPa, the lower
confinement being always of 1MPa. Results in Fig. 22 show a remarkable consistency, with
good overlapping of porosity during re-loading with that upon previous unloading. It is noted
that from the first confinement cycle, porosity decreases irreversibly, so that it does not reach
again the initial value of 30.1%. This experiment, performed on a dried sample so that
observed porosity changes may be maximal, shows directly and clearly that porosity
accessible to gas decreases irreversibly when confinement is applied to the bentonite/sand
plug. In direct relation with former gas permeability experiments, it is noted that porosity
decreases linearly up to Pc=5MPa, above which it decreases more slowly. Such difference in
behavior with increasing Pc was also observed for Kg, see Figure IV 5-10 and 13. This is the
signature of two different phases in pore collapse, as directly observed in Figure IV.16,
possibly with a homogeneous decrease in pore volume up to 5MPa, and a more localized loss
of pore volume above this value. Confirming this interpretation would require further
research.
Date: December, 4th, 2013 Deliverables D3-08, D3-24, D3-30 and D3-35
62
IV.4 Conclusion
This experimental study has aimed at assessing the sealing ability of partially water-saturated
bentonite/sand plugs, under increasing hydrostatic stress, in relation with an actual in situ
safety issue.
Indeed, in underground radioactive waste storage structures, bentonite/sand arrays of plugs
are used to seal the repository galleries. These comprise an arrangement of so-called vertical
slices, made of individual bentonite/sand plugs, which form the whole buffer. Similarly to
laboratory experiments in constant volume conditions, the bentonite buffer swells in the fixed
volume of an underground storage gallery. Yet, unlike small scale samples, plugs located at
the rim of each vertical slice swell fully due to underground water coming from the
surrounding host rock, while central plugs have less access to water, so that they are bound to
be partially saturated for a long time. Therefore, in such context, due to fully swollen plugs at
the rim, central bentonite/sand plugs are bound to be confined due to stresses close to 7MPa
(which is the swelling pressure of the fully water-saturated plugs). The main question we have
aimed at answering here was: are 7MPa confinement high enough to make a partially-
saturated bentonite/sand plug fully impermeable to gas?
Our investigation was performed in three successive test series, on bentonite/sand plugs
compacted using the same procedure: the first one has provided preliminary results, which
have been confirmed by test series S2 and S3, as follows,
- when subjected to relative humidity of 70-75% and below, bentonite/sand plugs shrink
and lose mass, whereas these swell and gain mass for RH>70-75%. At 98%RH,
swelling is as huge as 20% of the plug initial volume and water saturation reaches 87-
92%.
- Due to such huge volume variations, a discussion is proposed on the adequate
reference volume to take in order to assess sample porosity and water saturation level.
It is shown that the initial plug volume after compaction is a good compromise, which
allows to assess a conventional porosity, ranging between 42 and 47%, depending on
the test series. Initial water saturation level varies hugely from one test series to the
other, by ranging (on average) between 52% for S2 and 64% for S3.
- After mass stabilization at given RH in free boundary conditions, gas permeability
results show two opposite effects at given confinement. First, sample swelling is
accompanied by an increase in total sample volume and in pore volume accessible to
gas, so that this contributes to gas permeability increase. Similarly, sample shrinkage
Date: December, 4th, 2013 Deliverables D3-08, D3-24, D3-30 and D3-35
63
corresponds to a decrease in sample volume and in pore volume accessible to gas,
which promotes gas permeability decrease. Secondly, at given sample volume, water
intake fills the pore volume partly, so that gas permeability decreases; at given sample
volume, water loss promotes gas permeability increase. These antagonistic effects,
brought from the literature, allow to interpret satisfactorily all our gas permeability
experiments in partially saturated conditions.
- Tightness to gas is achieved for partially-saturated bentonite/sand plugs under
confinement. In particular, at a confinement equivalent to the expected full swelling
pressure of 7MPa, gas permeability is lower than 10-20m2 for samples initially
saturated up to 86-91% only.
After gas permeability in partially water saturated conditions, samples are oven-dried at 60°C
until mass stabilization: dry gas permeability is then on the order of 10-14m2, which is two to
three orders of magnitude greater than the permeability in the partially water-saturated state
(whatever the sample, and the saturation state between 50-91%). This testifies of the great
ability of bentonite/sand plugs to undergo pore opening upon drying. This completes the
observation of a 20% increase in volume upon swelling at 98%RH.
Date: December, 4th, 2013 Deliverables D3-08, D3-24, D3-30 and D3-35
64
V - Swelling of compacted bentonite/sand plug
(into tube) submitted to gas pressure
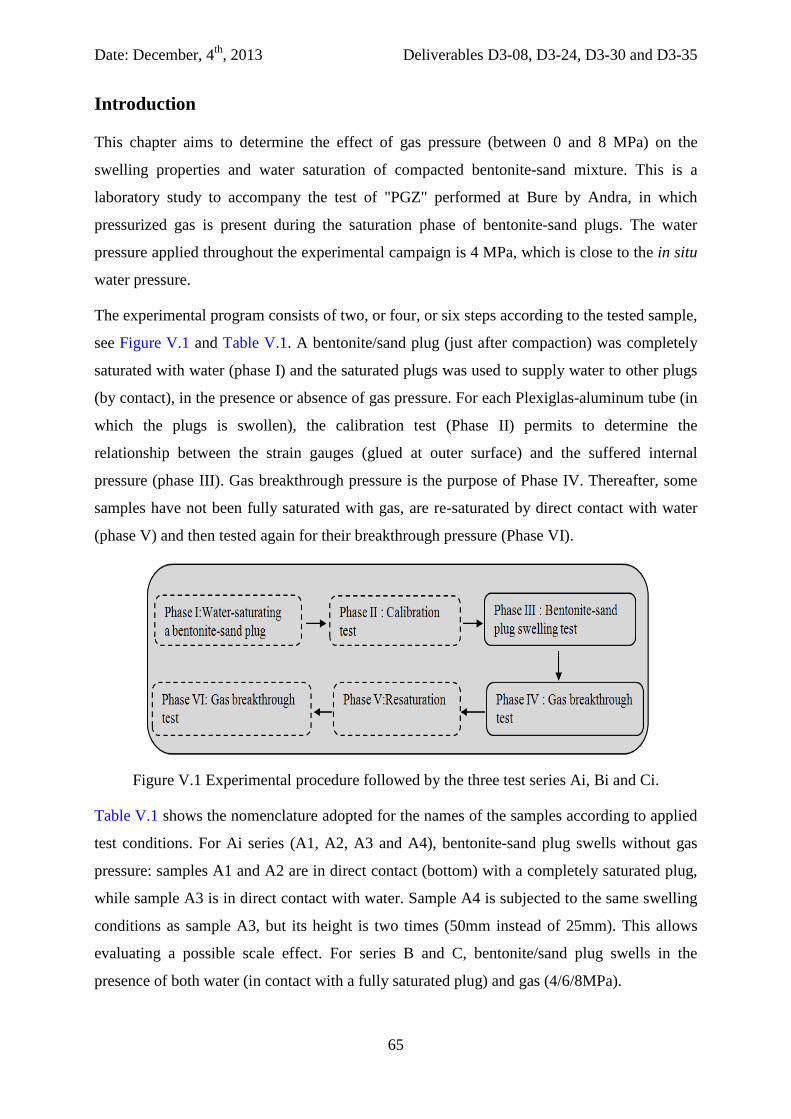
Date: December, 4th, 2013 Deliverables D3-08, D3-24, D3-30 and D3-35
65
Introduction
This chapter aims to determine the effect of gas pressure (between 0 and 8 MPa) on the
swelling properties and water saturation of compacted bentonite-sand mixture. This is a
laboratory study to accompany the test of "PGZ" performed at Bure by Andra, in which
pressurized gas is present during the saturation phase of bentonite-sand plugs. The water
pressure applied throughout the experimental campaign is 4 MPa, which is close to the in situ
water pressure.
The experimental program consists of two, or four, or six steps according to the tested sample,
see Figure V.1 and Table V.1. A bentonite/sand plug (just after compaction) was completely
saturated with water (phase I) and the saturated plugs was used to supply water to other plugs
(by contact), in the presence or absence of gas pressure. For each Plexiglas-aluminum tube (in
which the plugs is swollen), the calibration test (Phase II) permits to determine the
relationship between the strain gauges (glued at outer surface) and the suffered internal
pressure (phase III). Gas breakthrough pressure is the purpose of Phase IV. Thereafter, some
samples have not been fully saturated with gas, are re-saturated by direct contact with water
(phase V) and then tested again for their breakthrough pressure (Phase VI).
Figure V.1 Experimental procedure followed by the three test series Ai, Bi and Ci.
Table V.1 shows the nomenclature adopted for the names of the samples according to applied
test conditions. For Ai series (A1, A2, A3 and A4), bentonite-sand plug swells without gas
pressure: samples A1 and A2 are in direct contact (bottom) with a completely saturated plug,
while sample A3 is in direct contact with water. Sample A4 is subjected to the same swelling
conditions as sample A3, but its height is two times (50mm instead of 25mm). This allows
evaluating a possible scale effect. For series B and C, bentonite/sand plug swells in the
presence of both water (in contact with a fully saturated plug) and gas (4/6/8MPa).
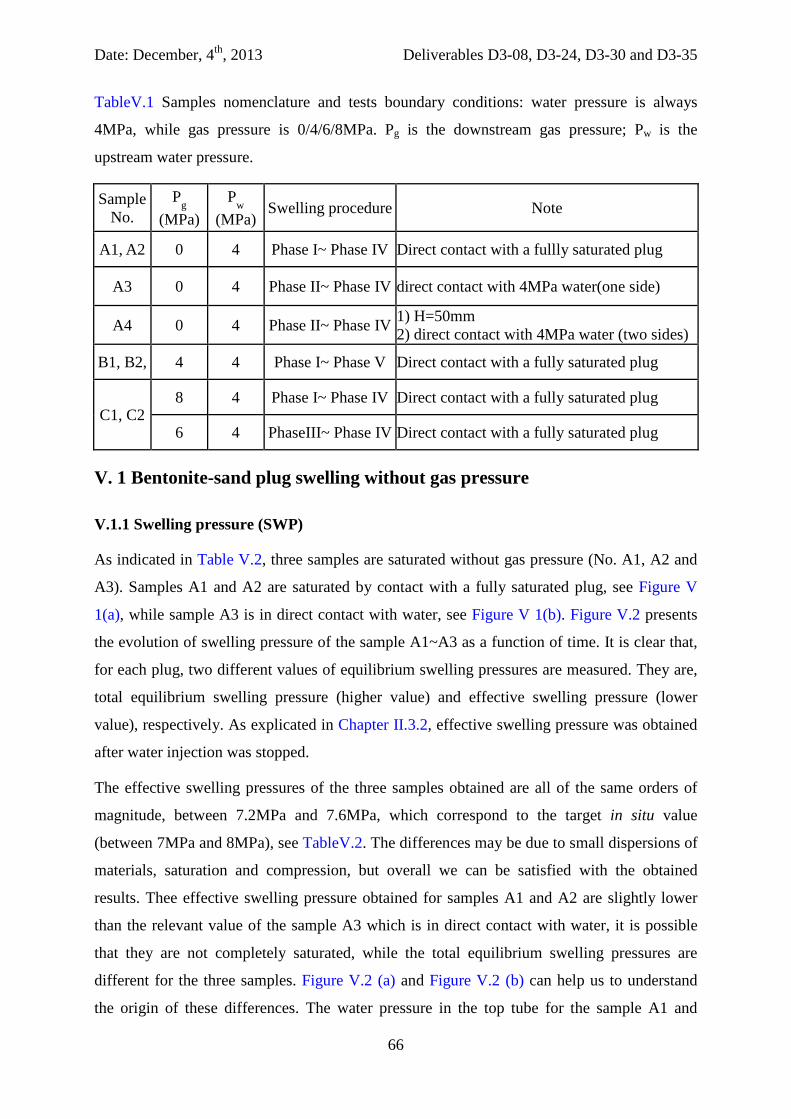
Date: December, 4th, 2013 Deliverables D3-08, D3-24, D3-30 and D3-35
66
TableV.1 Samples nomenclature and tests boundary conditions: water pressure is always
4MPa, while gas pressure is 0/4/6/8MPa. Pg is the downstream gas pressure; Pw is the
upstream water pressure.
Sample No.
Pg (MPa)
Pw (MPa)
Swelling procedure Note
A1, A2 0 4 Phase I~ Phase IV Direct contact with a fullly saturated plug
A3 0 4 Phase II~ Phase IV direct contact with 4MPa water(one side)
A4 0 4 Phase II~ Phase IV 1) H=50mm 2) direct contact with 4MPa water (two sides)
B1, B2, 4 4 Phase I~ Phase V Direct contact with a fully saturated plug
C1, C2 8 4 Phase I~ Phase IV Direct contact with a fully saturated plug
6 4 PhaseIII~ Phase IV Direct contact with a fully saturated plug
V. 1 Bentonite-sand plug swelling without gas pressure
V.1.1 Swelling pressure (SWP)
As indicated in Table V.2, three samples are saturated without gas pressure (No. A1, A2 and
A3). Samples A1 and A2 are saturated by contact with a fully saturated plug, see Figure V
1(a), while sample A3 is in direct contact with water, see Figure V 1(b). Figure V.2 presents
the evolution of swelling pressure of the sample A1~A3 as a function of time. It is clear that,
for each plug, two different values of equilibrium swelling pressures are measured. They are,
total equilibrium swelling pressure (higher value) and effective swelling pressure (lower
value), respectively. As explicated in Chapter II.3.2, effective swelling pressure was obtained
after water injection was stopped.
The effective swelling pressures of the three samples obtained are all of the same orders of
magnitude, between 7.2MPa and 7.6MPa, which correspond to the target in situ value
(between 7MPa and 8MPa), see TableV.2. The differences may be due to small dispersions of
materials, saturation and compression, but overall we can be satisfied with the obtained
results. Thee effective swelling pressure obtained for samples A1 and A2 are slightly lower
than the relevant value of the sample A3 which is in direct contact with water, it is possible
that they are not completely saturated, while the total equilibrium swelling pressures are
different for the three samples. Figure V.2 (a) and Figure V.2 (b) can help us to understand
the origin of these differences. The water pressure in the top tube for the sample A1 and
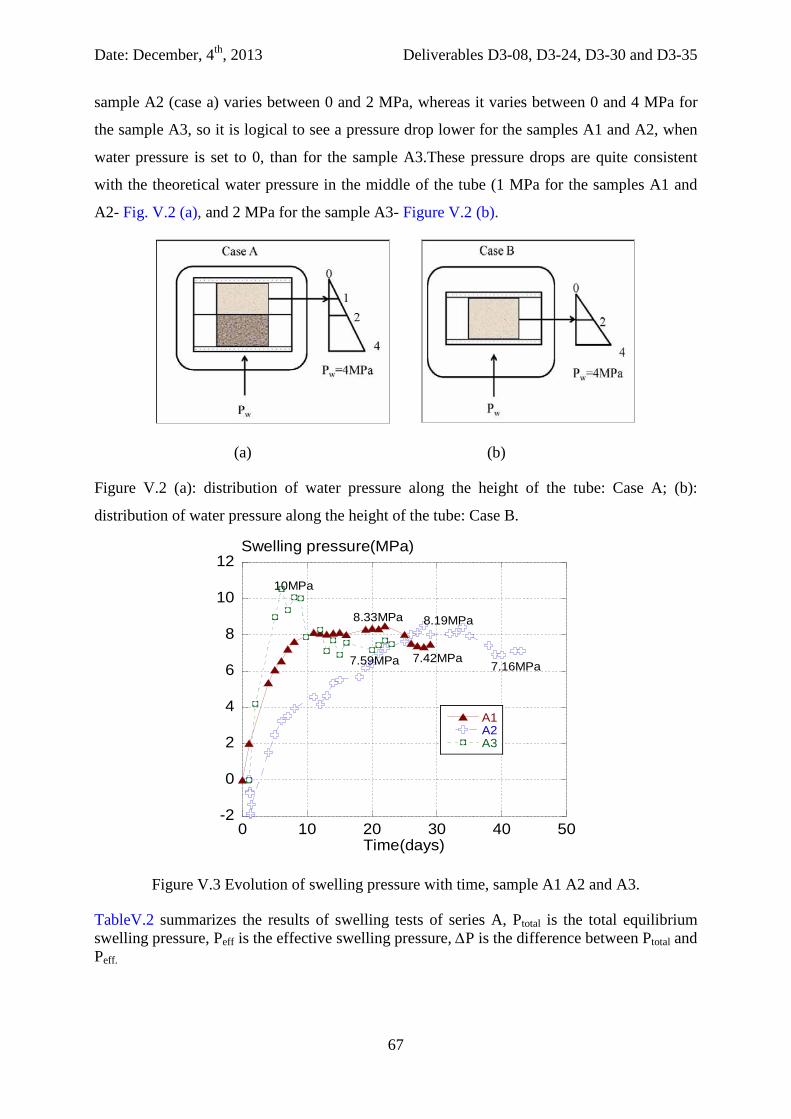
Date: December, 4th, 2013 Deliverables D3-08, D3-24, D3-30 and D3-35
67
sample A2 (case a) varies between 0 and 2 MPa, whereas it varies between 0 and 4 MPa for
the sample A3, so it is logical to see a pressure drop lower for the samples A1 and A2, when
water pressure is set to 0, than for the sample A3.These pressure drops are quite consistent
with the theoretical water pressure in the middle of the tube (1 MPa for the samples A1 and
A2- Fig. V.2 (a), and 2 MPa for the sample A3- Figure V.2 (b).
(a) (b)
Figure V.2 (a): distribution of water pressure along the height of the tube: Case A; (b):
distribution of water pressure along the height of the tube: Case B.
-2
0
2
4
6
8
10
12
0 10 20 30 40 50
A1A2A3
Swelling pressure(MPa)
Time(days)
8.33MPa
7.42MPa
8.19MPa
7.16MPa7.59MPa
10MPa
Figure V.3 Evolution of swelling pressure with time, sample A1 A2 and A3.
TableV.2 summarizes the results of swelling tests of series A, Ptotal is the total equilibrium swelling pressure, Peff is the effective swelling pressure, ∆P is the difference between Ptotal and Peff.
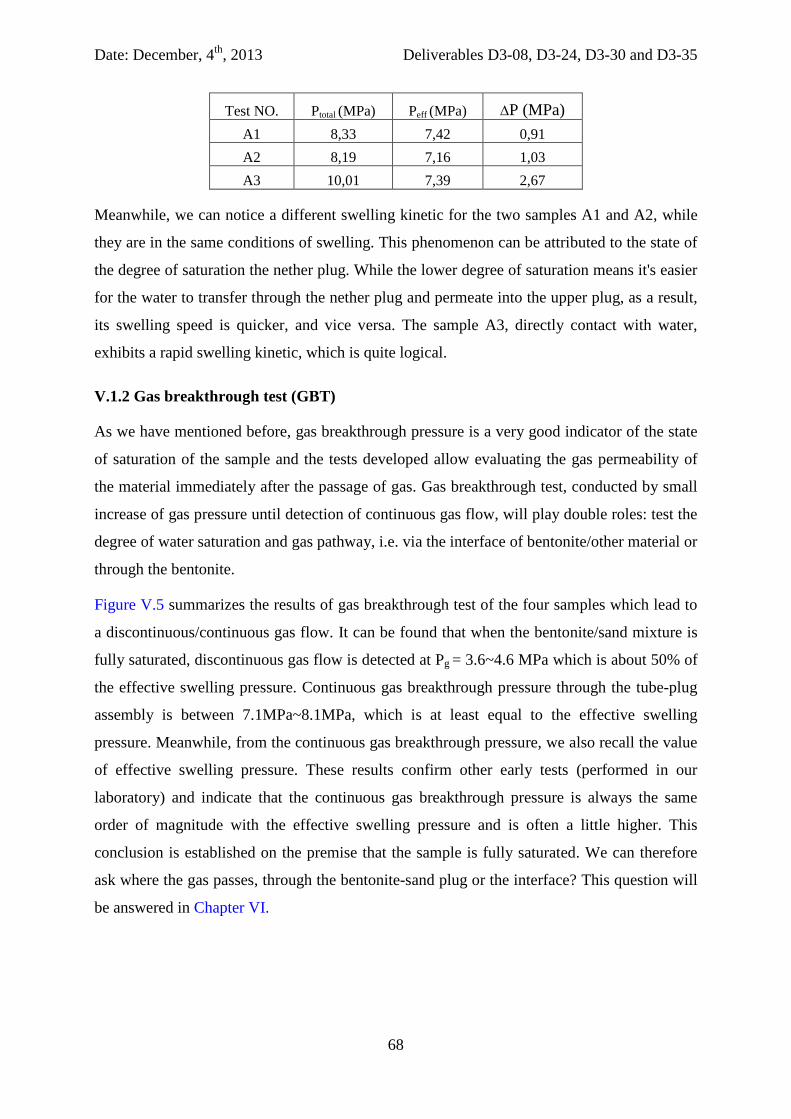
Date: December, 4th, 2013 Deliverables D3-08, D3-24, D3-30 and D3-35
68
Test NO. Ptotal (MPa) Peff (MPa) ∆P (MPa) A1 8,33 7,42 0,91 A2 8,19 7,16 1,03 A3 10,01 7,39 2,67
Meanwhile, we can notice a different swelling kinetic for the two samples A1 and A2, while
they are in the same conditions of swelling. This phenomenon can be attributed to the state of
the degree of saturation the nether plug. While the lower degree of saturation means it's easier
for the water to transfer through the nether plug and permeate into the upper plug, as a result,
its swelling speed is quicker, and vice versa. The sample A3, directly contact with water,
exhibits a rapid swelling kinetic, which is quite logical.
V.1.2 Gas breakthrough test (GBT)
As we have mentioned before, gas breakthrough pressure is a very good indicator of the state
of saturation of the sample and the tests developed allow evaluating the gas permeability of
the material immediately after the passage of gas. Gas breakthrough test, conducted by small
increase of gas pressure until detection of continuous gas flow, will play double roles: test the
degree of water saturation and gas pathway, i.e. via the interface of bentonite/other material or
through the bentonite.
Figure V.5 summarizes the results of gas breakthrough test of the four samples which lead to
a discontinuous/continuous gas flow. It can be found that when the bentonite/sand mixture is
fully saturated, discontinuous gas flow is detected at Pg = 3.6~4.6 MPa which is about 50% of
the effective swelling pressure. Continuous gas breakthrough pressure through the tube-plug
assembly is between 7.1MPa~8.1MPa, which is at least equal to the effective swelling
pressure. Meanwhile, from the continuous gas breakthrough pressure, we also recall the value
of effective swelling pressure. These results confirm other early tests (performed in our
laboratory) and indicate that the continuous gas breakthrough pressure is always the same
order of magnitude with the effective swelling pressure and is often a little higher. This
conclusion is established on the premise that the sample is fully saturated. We can therefore
ask where the gas passes, through the bentonite-sand plug or the interface? This question will
be answered in Chapter VI.
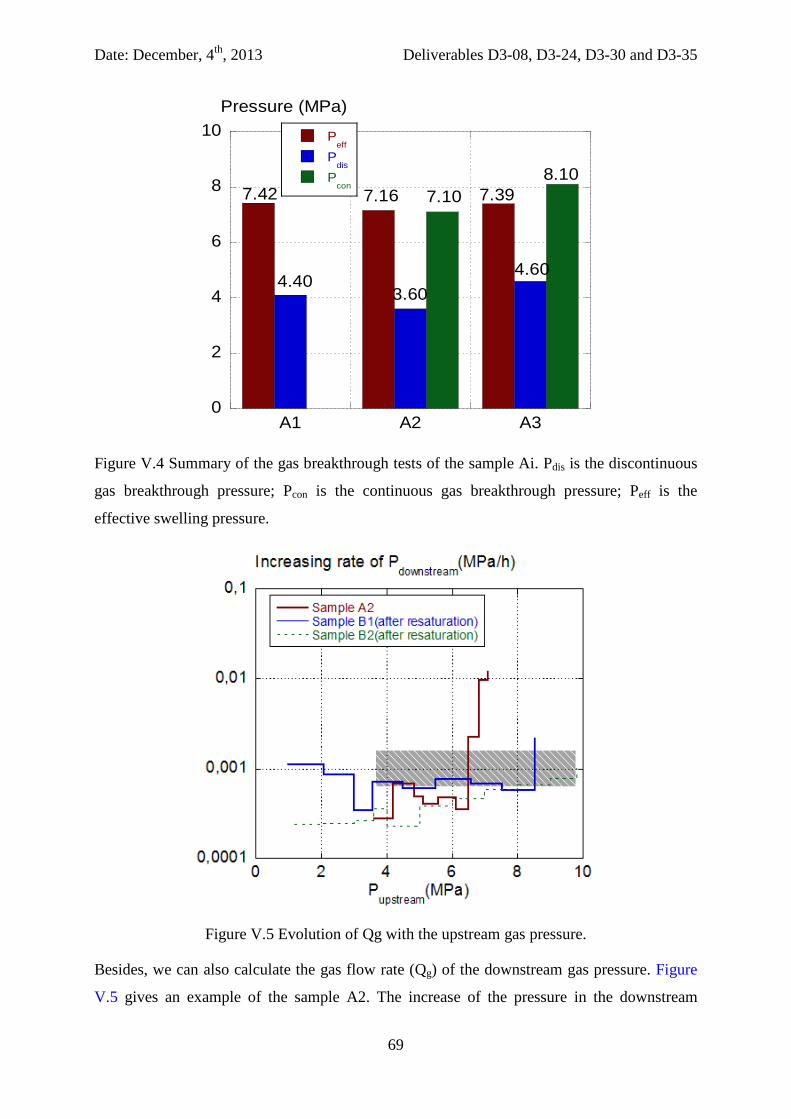
Date: December, 4th, 2013 Deliverables D3-08, D3-24, D3-30 and D3-35
69
0
2
4
6
8
10
A1 A2 A3
Peff
Pdis
Pcon
Pressure (MPa)
7.42
4.40
7.16
3.60
7.10 7.39
4.60
8.10
Figure V.4 Summary of the gas breakthrough tests of the sample Ai. Pdis is the discontinuous
gas breakthrough pressure; Pcon is the continuous gas breakthrough pressure; Peff is the
effective swelling pressure.
Figure V.5 Evolution of Qg with the upstream gas pressure.
Besides, we can also calculate the gas flow rate (Qg) of the downstream gas pressure. Figure
V.5 gives an example of the sample A2. The increase of the pressure in the downstream
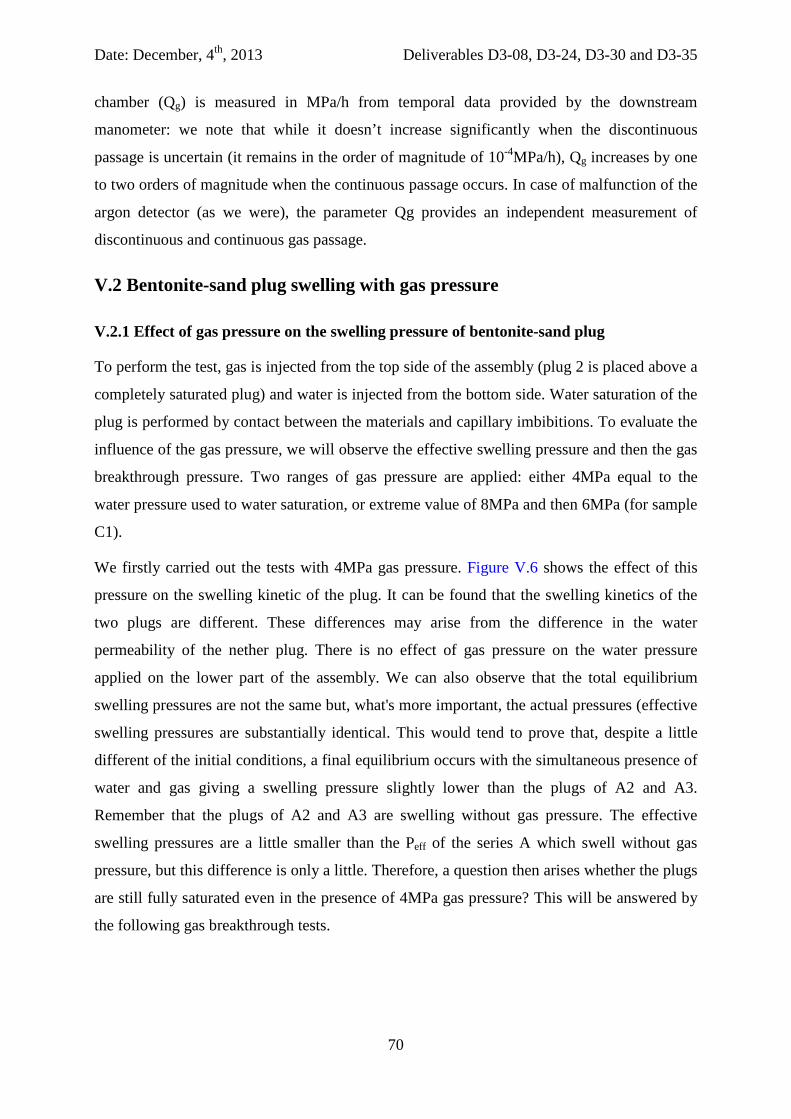
Date: December, 4th, 2013 Deliverables D3-08, D3-24, D3-30 and D3-35
70
chamber (Qg) is measured in MPa/h from temporal data provided by the downstream
manometer: we note that while it doesn’t increase significantly when the discontinuous
passage is uncertain (it remains in the order of magnitude of 10-4MPa/h), Qg increases by one
to two orders of magnitude when the continuous passage occurs. In case of malfunction of the
argon detector (as we were), the parameter Qg provides an independent measurement of
discontinuous and continuous gas passage.
V.2 Bentonite-sand plug swelling with gas pressure
V.2.1 Effect of gas pressure on the swelling pressure of bentonite-sand plug
To perform the test, gas is injected from the top side of the assembly (plug 2 is placed above a
completely saturated plug) and water is injected from the bottom side. Water saturation of the
plug is performed by contact between the materials and capillary imbibitions. To evaluate the
influence of the gas pressure, we will observe the effective swelling pressure and then the gas
breakthrough pressure. Two ranges of gas pressure are applied: either 4MPa equal to the
water pressure used to water saturation, or extreme value of 8MPa and then 6MPa (for sample
C1).
We firstly carried out the tests with 4MPa gas pressure. Figure V.6 shows the effect of this
pressure on the swelling kinetic of the plug. It can be found that the swelling kinetics of the
two plugs are different. These differences may arise from the difference in the water
permeability of the nether plug. There is no effect of gas pressure on the water pressure
applied on the lower part of the assembly. We can also observe that the total equilibrium
swelling pressures are not the same but, what's more important, the actual pressures (effective
swelling pressures are substantially identical. This would tend to prove that, despite a little
different of the initial conditions, a final equilibrium occurs with the simultaneous presence of
water and gas giving a swelling pressure slightly lower than the plugs of A2 and A3.
Remember that the plugs of A2 and A3 are swelling without gas pressure. The effective
swelling pressures are a little smaller than the Peff of the series A which swell without gas
pressure, but this difference is only a little. Therefore, a question then arises whether the plugs
are still fully saturated even in the presence of 4MPa gas pressure? This will be answered by
the following gas breakthrough tests.
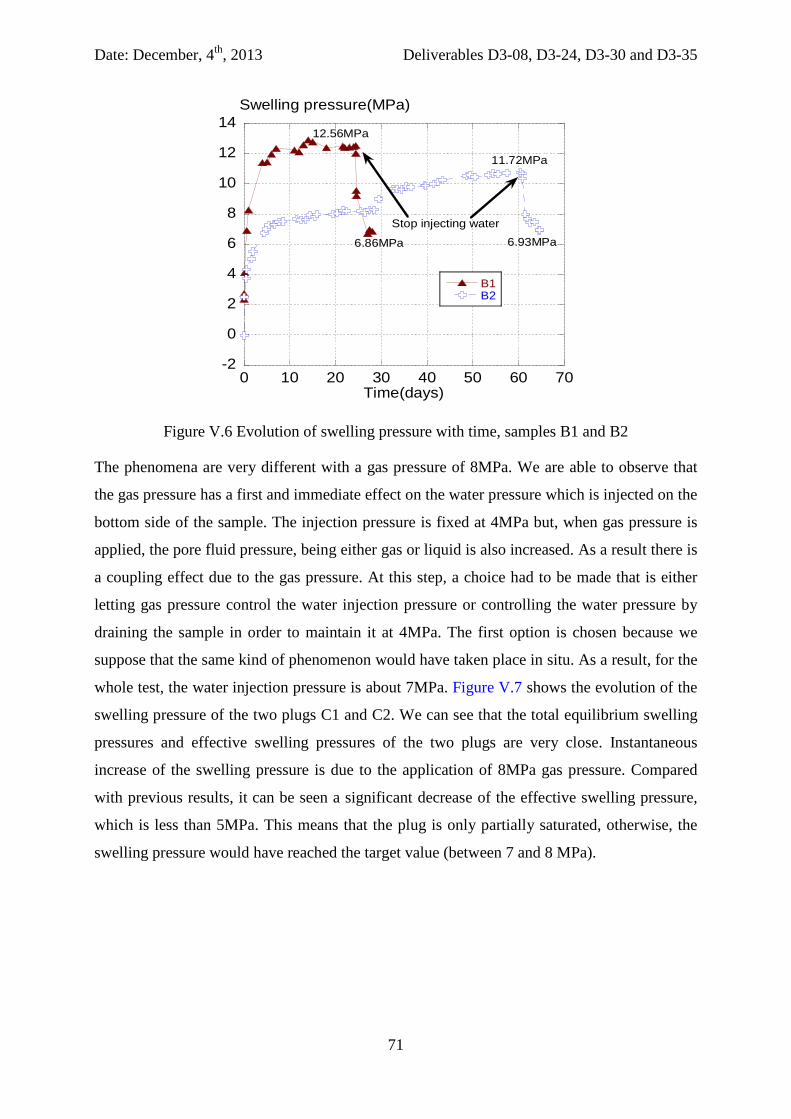
Date: December, 4th, 2013 Deliverables D3-08, D3-24, D3-30 and D3-35
71
-2
0
2
4
6
8
10
12
14
0 10 20 30 40 50 60 70
B1B2
Swelling pressure(MPa)
Time(days)
11.72MPa
6.93MPa6.86MPa
12.56MPa
Stop injecting water
Figure V.6 Evolution of swelling pressure with time, samples B1 and B2
The phenomena are very different with a gas pressure of 8MPa. We are able to observe that
the gas pressure has a first and immediate effect on the water pressure which is injected on the
bottom side of the sample. The injection pressure is fixed at 4MPa but, when gas pressure is
applied, the pore fluid pressure, being either gas or liquid is also increased. As a result there is
a coupling effect due to the gas pressure. At this step, a choice had to be made that is either
letting gas pressure control the water injection pressure or controlling the water pressure by
draining the sample in order to maintain it at 4MPa. The first option is chosen because we
suppose that the same kind of phenomenon would have taken place in situ. As a result, for the
whole test, the water injection pressure is about 7MPa. Figure V.7 shows the evolution of the
swelling pressure of the two plugs C1 and C2. We can see that the total equilibrium swelling
pressures and effective swelling pressures of the two plugs are very close. Instantaneous
increase of the swelling pressure is due to the application of 8MPa gas pressure. Compared
with previous results, it can be seen a significant decrease of the effective swelling pressure,
which is less than 5MPa. This means that the plug is only partially saturated, otherwise, the
swelling pressure would have reached the target value (between 7 and 8 MPa).
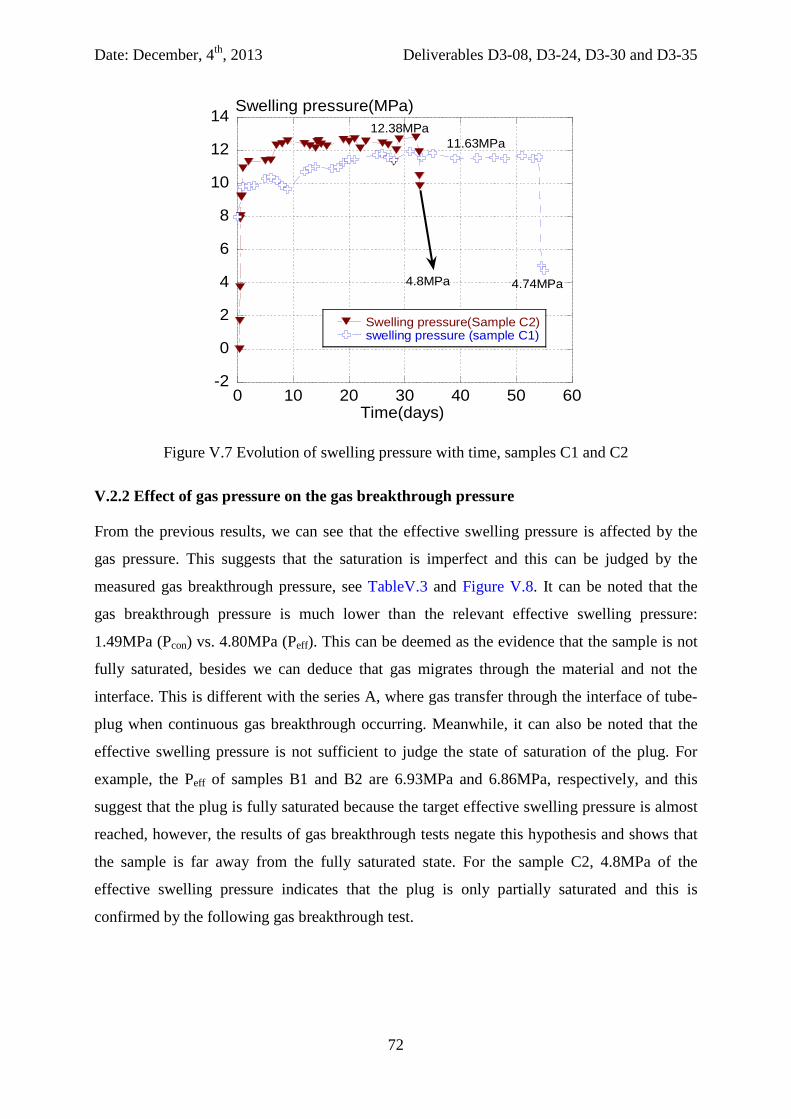
Date: December, 4th, 2013 Deliverables D3-08, D3-24, D3-30 and D3-35
72
-2
0
2
4
6
8
10
12
14
0 10 20 30 40 50 60
Swelling pressure(Sample C2)swelling pressure (sample C1)
Swelling pressure(MPa)
Time(days)
12.38MPa
4.8MPa
11.63MPa
4.74MPa
Figure V.7 Evolution of swelling pressure with time, samples C1 and C2
V.2.2 Effect of gas pressure on the gas breakthrough pressure
From the previous results, we can see that the effective swelling pressure is affected by the
gas pressure. This suggests that the saturation is imperfect and this can be judged by the
measured gas breakthrough pressure, see TableV.3 and Figure V.8. It can be noted that the
gas breakthrough pressure is much lower than the relevant effective swelling pressure:
1.49MPa (Pcon) vs. 4.80MPa (Peff). This can be deemed as the evidence that the sample is not
fully saturated, besides we can deduce that gas migrates through the material and not the
interface. This is different with the series A, where gas transfer through the interface of tube-
plug when continuous gas breakthrough occurring. Meanwhile, it can also be noted that the
effective swelling pressure is not sufficient to judge the state of saturation of the plug. For
example, the Peff of samples B1 and B2 are 6.93MPa and 6.86MPa, respectively, and this
suggest that the plug is fully saturated because the target effective swelling pressure is almost
reached, however, the results of gas breakthrough tests negate this hypothesis and shows that
the sample is far away from the fully saturated state. For the sample C2, 4.8MPa of the
effective swelling pressure indicates that the plug is only partially saturated and this is
confirmed by the following gas breakthrough test.
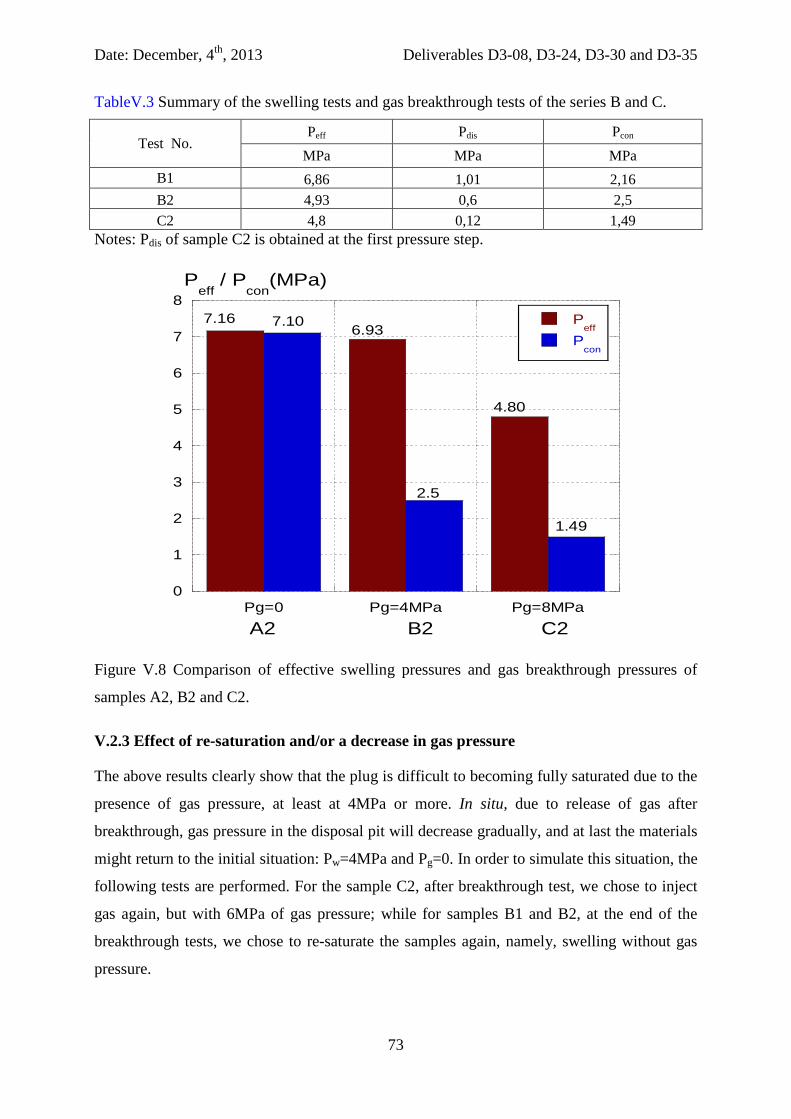
Date: December, 4th, 2013 Deliverables D3-08, D3-24, D3-30 and D3-35
73
TableV.3 Summary of the swelling tests and gas breakthrough tests of the series B and C.
Test No. Peff Pdis Pcon
MPa MPa MPa B1 6,86 1,01 2,16 B2 4,93 0,6 2,5 C2 4,8 0,12 1,49
Notes: Pdis of sample C2 is obtained at the first pressure step.
0
1
2
3
4
5
6
7
8
Pg=0 Pg=4MPa Pg=8MPa
Peff
Pcon
Peff
/ Pcon
(MPa)
A2 B2 C2
7.107.166.93
2.5
4.80
1.49
Figure V.8 Comparison of effective swelling pressures and gas breakthrough pressures of
samples A2, B2 and C2.
V.2.3 Effect of re-saturation and/or a decrease in gas pressure
The above results clearly show that the plug is difficult to becoming fully saturated due to the
presence of gas pressure, at least at 4MPa or more. In situ, due to release of gas after
breakthrough, gas pressure in the disposal pit will decrease gradually, and at last the materials
might return to the initial situation: Pw=4MPa and Pg=0. In order to simulate this situation, the
following tests are performed. For the sample C2, after breakthrough test, we chose to inject
gas again, but with 6MPa of gas pressure; while for samples B1 and B2, at the end of the
breakthrough tests, we chose to re-saturate the samples again, namely, swelling without gas
pressure.
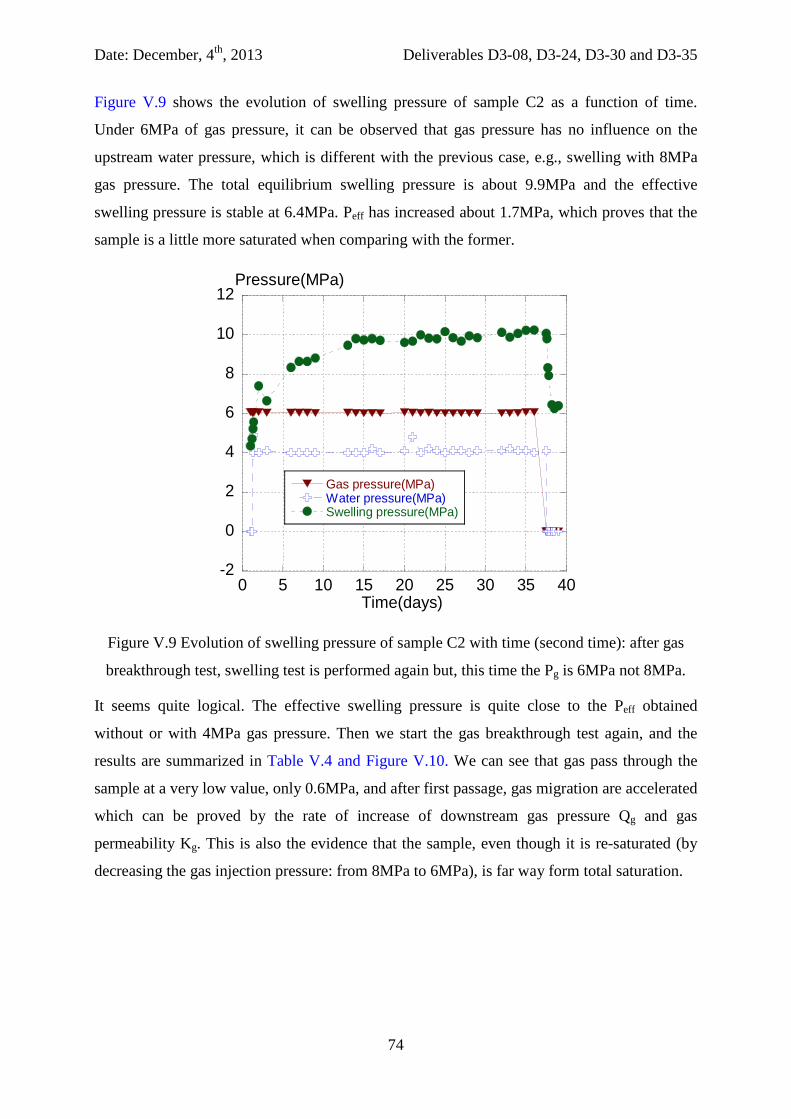
Date: December, 4th, 2013 Deliverables D3-08, D3-24, D3-30 and D3-35
74
Figure V.9 shows the evolution of swelling pressure of sample C2 as a function of time.
Under 6MPa of gas pressure, it can be observed that gas pressure has no influence on the
upstream water pressure, which is different with the previous case, e.g., swelling with 8MPa
gas pressure. The total equilibrium swelling pressure is about 9.9MPa and the effective
swelling pressure is stable at 6.4MPa. Peff has increased about 1.7MPa, which proves that the
sample is a little more saturated when comparing with the former.
-2
0
2
4
6
8
10
12
0 5 10 15 20 25 30 35 40
Gas pressure(MPa)Water pressure(MPa)Swelling pressure(MPa)
Pressure(MPa)
Time(days)
Figure V.9 Evolution of swelling pressure of sample C2 with time (second time): after gas
breakthrough test, swelling test is performed again but, this time the Pg is 6MPa not 8MPa.
It seems quite logical. The effective swelling pressure is quite close to the Peff obtained
without or with 4MPa gas pressure. Then we start the gas breakthrough test again, and the
results are summarized in Table V.4 and Figure V.10. We can see that gas pass through the
sample at a very low value, only 0.6MPa, and after first passage, gas migration are accelerated
which can be proved by the rate of increase of downstream gas pressure Qg and gas
permeability Kg. This is also the evidence that the sample, even though it is re-saturated (by
decreasing the gas injection pressure: from 8MPa to 6MPa), is far way form total saturation.
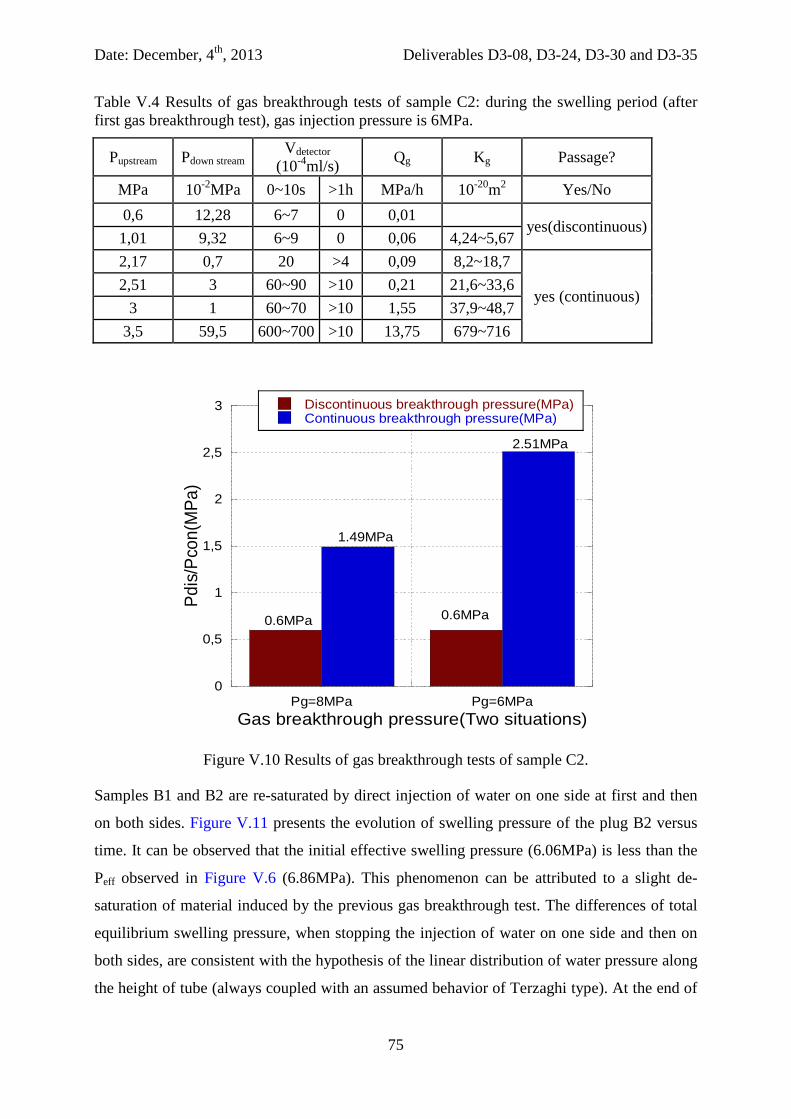
Date: December, 4th, 2013 Deliverables D3-08, D3-24, D3-30 and D3-35
75
Table V.4 Results of gas breakthrough tests of sample C2: during the swelling period (after first gas breakthrough test), gas injection pressure is 6MPa.
Pupstream Pdown stream Vdetector (10-4ml/s) Qg Kg Passage?
MPa 10-2MPa 0~10s >1h MPa/h 10-20m2 Yes/No 0,6 12,28 6~7 0 0,01
yes(discontinuous) 1,01 9,32 6~9 0 0,06 4,24~5,67 2,17 0,7 20 >4 0,09 8,2~18,7
yes (continuous) 2,51 3 60~90 >10 0,21 21,6~33,6
3 1 60~70 >10 1,55 37,9~48,7 3,5 59,5 600~700 >10 13,75 679~716
Figure V.10 Results of gas breakthrough tests of sample C2.
Samples B1 and B2 are re-saturated by direct injection of water on one side at first and then
on both sides. Figure V.11 presents the evolution of swelling pressure of the plug B2 versus
time. It can be observed that the initial effective swelling pressure (6.06MPa) is less than the
Peff observed in Figure V.6 (6.86MPa). This phenomenon can be attributed to a slight de-
saturation of material induced by the previous gas breakthrough test. The differences of total
equilibrium swelling pressure, when stopping the injection of water on one side and then on
both sides, are consistent with the hypothesis of the linear distribution of water pressure along
the height of tube (always coupled with an assumed behavior of Terzaghi type). At the end of
0
0,5
1
1,5
2
2,5
3
Pg=8MPa Pg=6MPa
Discontinuous breakthrough pressure(MPa)Continuous breakthrough pressure(MPa)
Pdis
/Pco
n(M
Pa)
Gas breakthrough pressure(Two situations)
0.6MPa
2.51MPa
0.6MPa
1.49MPa
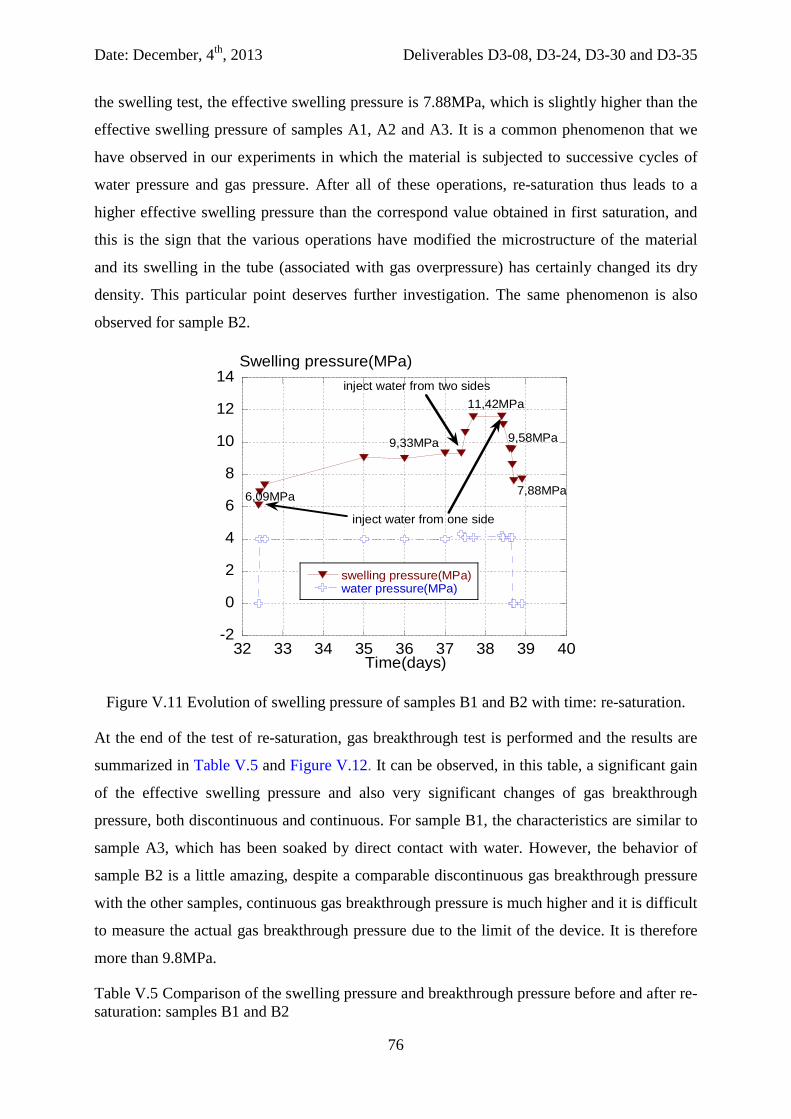
Date: December, 4th, 2013 Deliverables D3-08, D3-24, D3-30 and D3-35
76
the swelling test, the effective swelling pressure is 7.88MPa, which is slightly higher than the
effective swelling pressure of samples A1, A2 and A3. It is a common phenomenon that we
have observed in our experiments in which the material is subjected to successive cycles of
water pressure and gas pressure. After all of these operations, re-saturation thus leads to a
higher effective swelling pressure than the correspond value obtained in first saturation, and
this is the sign that the various operations have modified the microstructure of the material
and its swelling in the tube (associated with gas overpressure) has certainly changed its dry
density. This particular point deserves further investigation. The same phenomenon is also
observed for sample B2.
-2
0
2
4
6
8
10
12
14
32 33 34 35 36 37 38 39 40
swelling pressure(MPa)water pressure(MPa)
Swelling pressure(MPa)
Time(days)
inject water from two sides
inject water from one side
6,09MPa
9,33MPa
11,42MPa
9,58MPa
7,88MPa
Figure V.11 Evolution of swelling pressure of samples B1 and B2 with time: re-saturation.
At the end of the test of re-saturation, gas breakthrough test is performed and the results are
summarized in Table V.5 and Figure V.12. It can be observed, in this table, a significant gain
of the effective swelling pressure and also very significant changes of gas breakthrough
pressure, both discontinuous and continuous. For sample B1, the characteristics are similar to
sample A3, which has been soaked by direct contact with water. However, the behavior of
sample B2 is a little amazing, despite a comparable discontinuous gas breakthrough pressure
with the other samples, continuous gas breakthrough pressure is much higher and it is difficult
to measure the actual gas breakthrough pressure due to the limit of the device. It is therefore
more than 9.8MPa.
Table V.5 Comparison of the swelling pressure and breakthrough pressure before and after re-saturation: samples B1 and B2
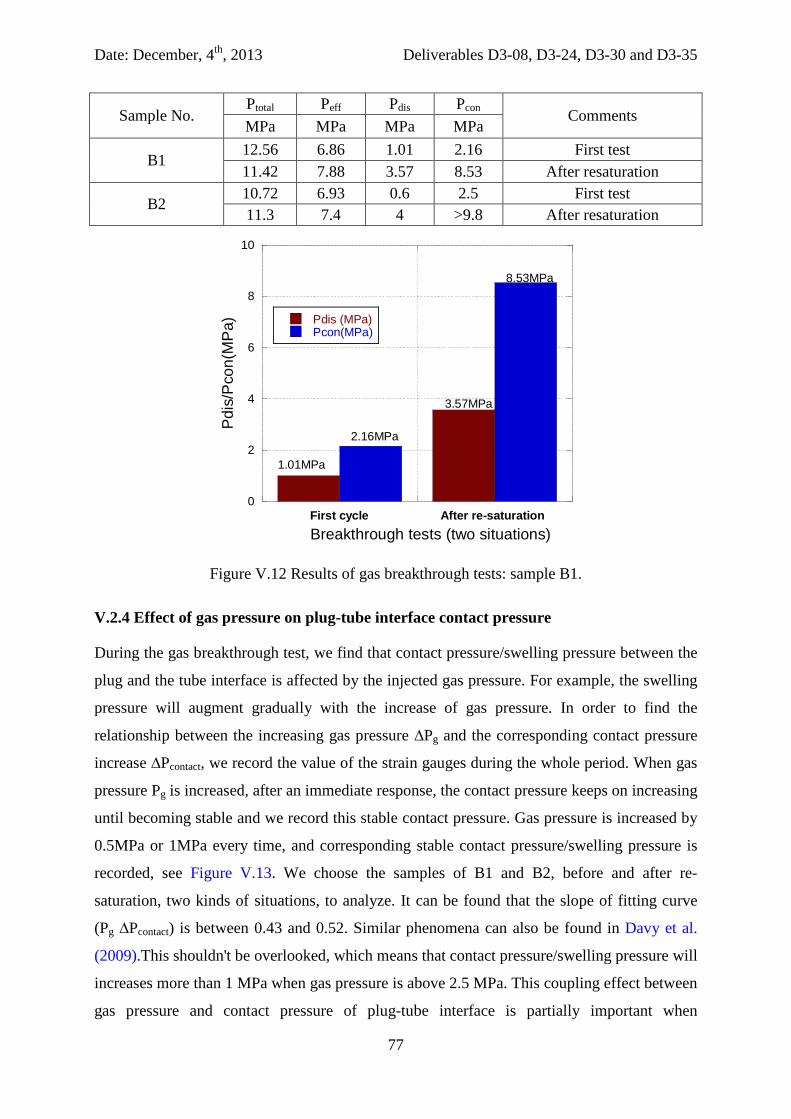
Date: December, 4th, 2013 Deliverables D3-08, D3-24, D3-30 and D3-35
77
Sample No. Ptotal Peff Pdis Pcon Comments MPa MPa MPa MPa
B1 12.56 6.86 1.01 2.16 First test 11.42 7.88 3.57 8.53 After resaturation
B2 10.72 6.93 0.6 2.5 First test 11.3 7.4 4 >9.8 After resaturation
0
2
4
6
8
10
First cycle After re-saturation
Pdis (MPa)Pcon(MPa)
Pdi
s/P
con(
MP
a)
Breakthrough tests (two situations)
1.01MPa
8.53MPa
3.57MPa
2.16MPa
Figure V.12 Results of gas breakthrough tests: sample B1.
V.2.4 Effect of gas pressure on plug-tube interface contact pressure
During the gas breakthrough test, we find that contact pressure/swelling pressure between the
plug and the tube interface is affected by the injected gas pressure. For example, the swelling
pressure will augment gradually with the increase of gas pressure. In order to find the
relationship between the increasing gas pressure ∆Pg and the corresponding contact pressure
increase ∆Pcontact, we record the value of the strain gauges during the whole period. When gas
pressure Pg is increased, after an immediate response, the contact pressure keeps on increasing
until becoming stable and we record this stable contact pressure. Gas pressure is increased by
0.5MPa or 1MPa every time, and corresponding stable contact pressure/swelling pressure is
recorded, see Figure V.13. We choose the samples of B1 and B2, before and after re-
saturation, two kinds of situations, to analyze. It can be found that the slope of fitting curve
(Pg ∆Pcontact) is between 0.43 and 0.52. Similar phenomena can also be found in Davy et al.
(2009).This shouldn't be overlooked, which means that contact pressure/swelling pressure will
increases more than 1 MPa when gas pressure is above 2.5 MPa. This coupling effect between
gas pressure and contact pressure of plug-tube interface is partially important when
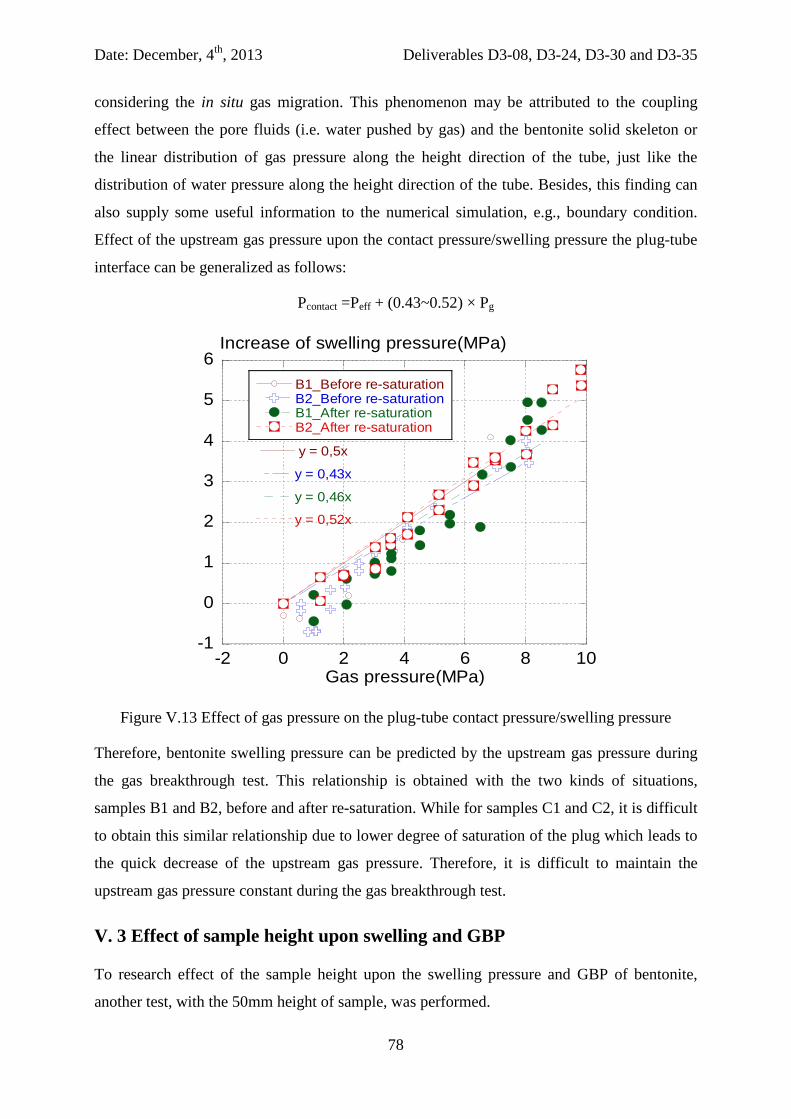
Date: December, 4th, 2013 Deliverables D3-08, D3-24, D3-30 and D3-35
78
considering the in situ gas migration. This phenomenon may be attributed to the coupling
effect between the pore fluids (i.e. water pushed by gas) and the bentonite solid skeleton or
the linear distribution of gas pressure along the height direction of the tube, just like the
distribution of water pressure along the height direction of the tube. Besides, this finding can
also supply some useful information to the numerical simulation, e.g., boundary condition.
Effect of the upstream gas pressure upon the contact pressure/swelling pressure the plug-tube
interface can be generalized as follows:
Pcontact =Peff + (0.43~0.52) × Pg
Figure V.13 Effect of gas pressure on the plug-tube contact pressure/swelling pressure
Therefore, bentonite swelling pressure can be predicted by the upstream gas pressure during
the gas breakthrough test. This relationship is obtained with the two kinds of situations,
samples B1 and B2, before and after re-saturation. While for samples C1 and C2, it is difficult
to obtain this similar relationship due to lower degree of saturation of the plug which leads to
the quick decrease of the upstream gas pressure. Therefore, it is difficult to maintain the
upstream gas pressure constant during the gas breakthrough test.
V. 3 Effect of sample height upon swelling and GBP
To research effect of the sample height upon the swelling pressure and GBP of bentonite,
another test, with the 50mm height of sample, was performed.
-1
0
1
2
3
4
5
6
-2 0 2 4 6 8 10
B1_Before re-saturationB2_Before re-saturationB1_After re-saturationB2_After re-saturation
y = 0,5x
y = 0,43x
y = 0,46x
y = 0,52x
Increase of swelling pressure(MPa)
Gas pressure(MPa)
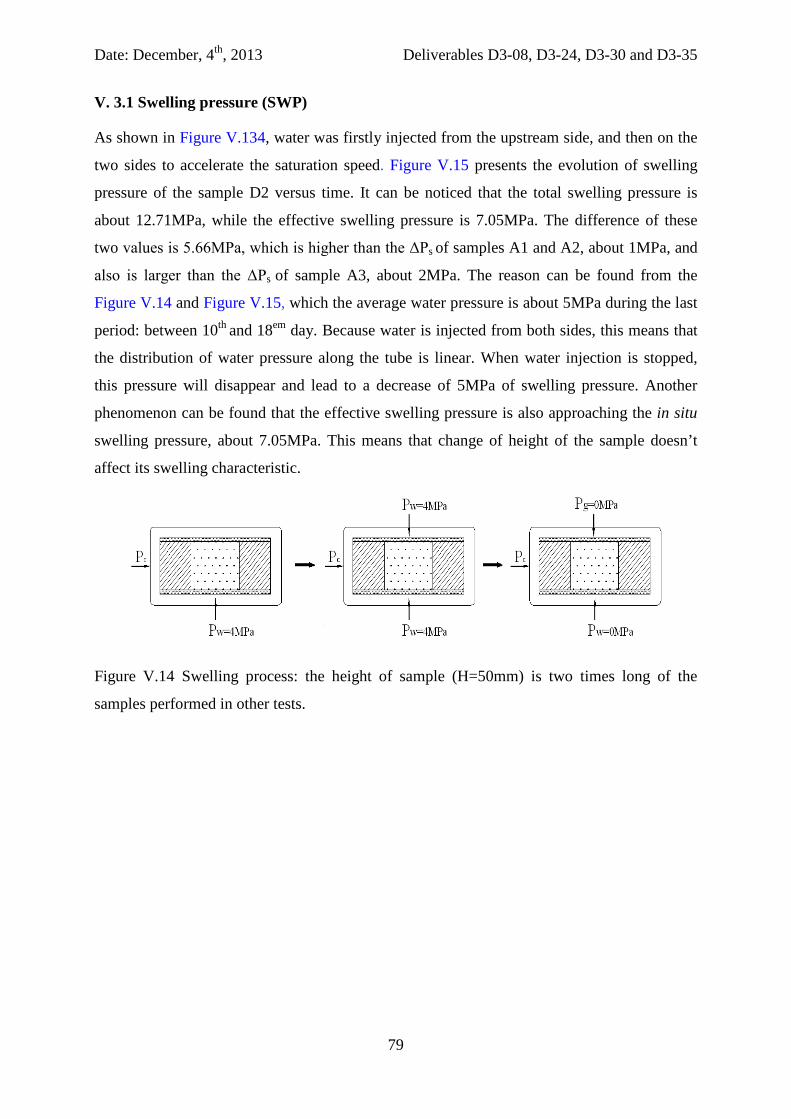
Date: December, 4th, 2013 Deliverables D3-08, D3-24, D3-30 and D3-35
79
V. 3.1 Swelling pressure (SWP)
As shown in Figure V.134, water was firstly injected from the upstream side, and then on the
two sides to accelerate the saturation speed. Figure V.15 presents the evolution of swelling
pressure of the sample D2 versus time. It can be noticed that the total swelling pressure is
about 12.71MPa, while the effective swelling pressure is 7.05MPa. The difference of these
two values is 5.66MPa, which is higher than the ΔPs of samples A1 and A2, about 1MPa, and
also is larger than the ΔPs of sample A3, about 2MPa. The reason can be found from the
Figure V.14 and Figure V.15, which the average water pressure is about 5MPa during the last
period: between 10th and 18em day. Because water is injected from both sides, this means that
the distribution of water pressure along the tube is linear. When water injection is stopped,
this pressure will disappear and lead to a decrease of 5MPa of swelling pressure. Another
phenomenon can be found that the effective swelling pressure is also approaching the in situ
swelling pressure, about 7.05MPa. This means that change of height of the sample doesn’t
affect its swelling characteristic.
Figure V.14 Swelling process: the height of sample (H=50mm) is two times long of the
samples performed in other tests.
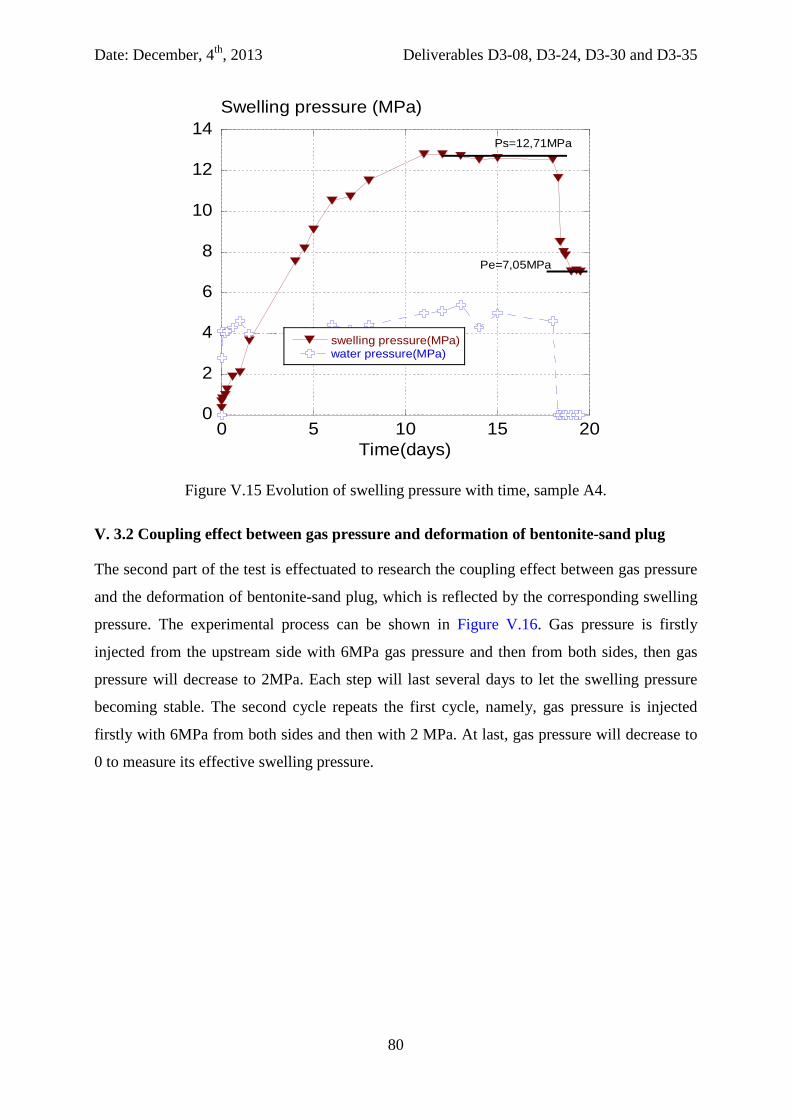
Date: December, 4th, 2013 Deliverables D3-08, D3-24, D3-30 and D3-35
80
0
2
4
6
8
10
12
14
0 5 10 15 20
swelling pressure(MPa)water pressure(MPa)
Swelling pressure (MPa)
Time(days)
Ps=12,71MPa
Pe=7,05MPa
Figure V.15 Evolution of swelling pressure with time, sample A4.
V. 3.2 Coupling effect between gas pressure and deformation of bentonite-sand plug
The second part of the test is effectuated to research the coupling effect between gas pressure
and the deformation of bentonite-sand plug, which is reflected by the corresponding swelling
pressure. The experimental process can be shown in Figure V.16. Gas pressure is firstly
injected from the upstream side with 6MPa gas pressure and then from both sides, then gas
pressure will decrease to 2MPa. Each step will last several days to let the swelling pressure
becoming stable. The second cycle repeats the first cycle, namely, gas pressure is injected
firstly with 6MPa from both sides and then with 2 MPa. At last, gas pressure will decrease to
0 to measure its effective swelling pressure.
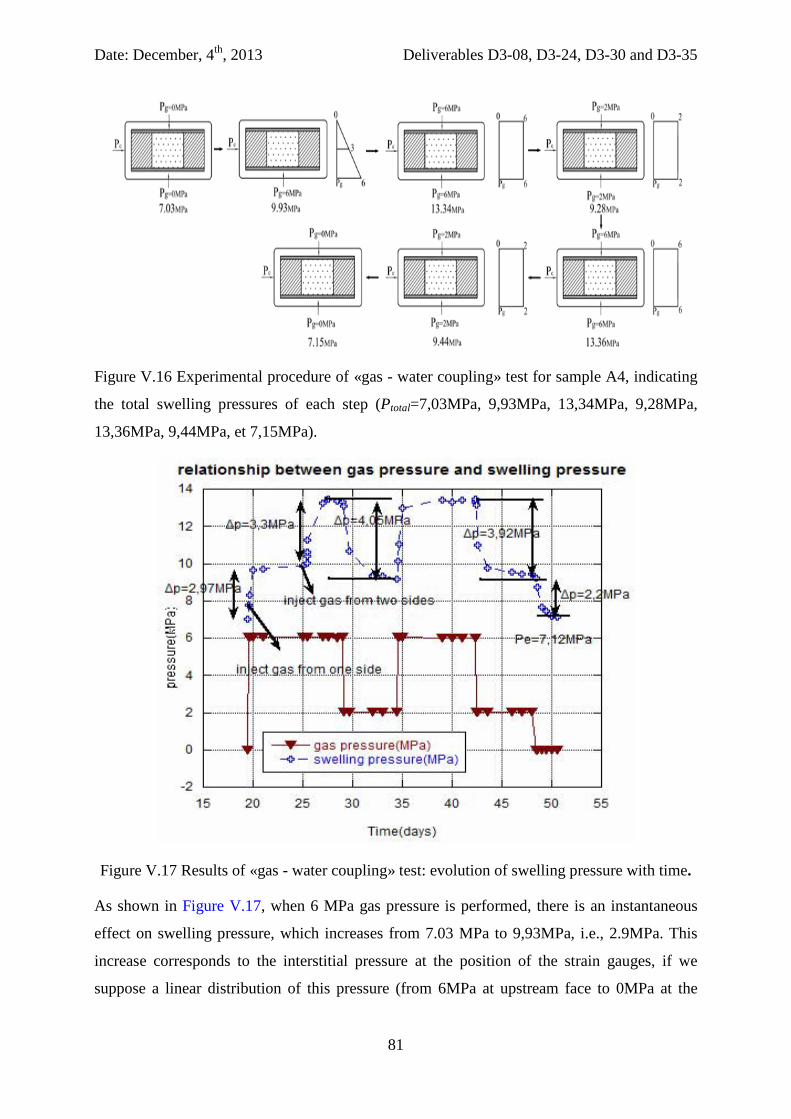
Date: December, 4th, 2013 Deliverables D3-08, D3-24, D3-30 and D3-35
81
Figure V.16 Experimental procedure of «gas - water coupling» test for sample A4, indicating
the total swelling pressures of each step (Ptotal=7,03MPa, 9,93MPa, 13,34MPa, 9,28MPa,
13,36MPa, 9,44MPa, et 7,15MPa).
Figure V.17 Results of «gas - water coupling» test: evolution of swelling pressure with time.
As shown in Figure V.17, when 6 MPa gas pressure is performed, there is an instantaneous
effect on swelling pressure, which increases from 7.03 MPa to 9,93MPa, i.e., 2.9MPa. This
increase corresponds to the interstitial pressure at the position of the strain gauges, if we
suppose a linear distribution of this pressure (from 6MPa at upstream face to 0MPa at the
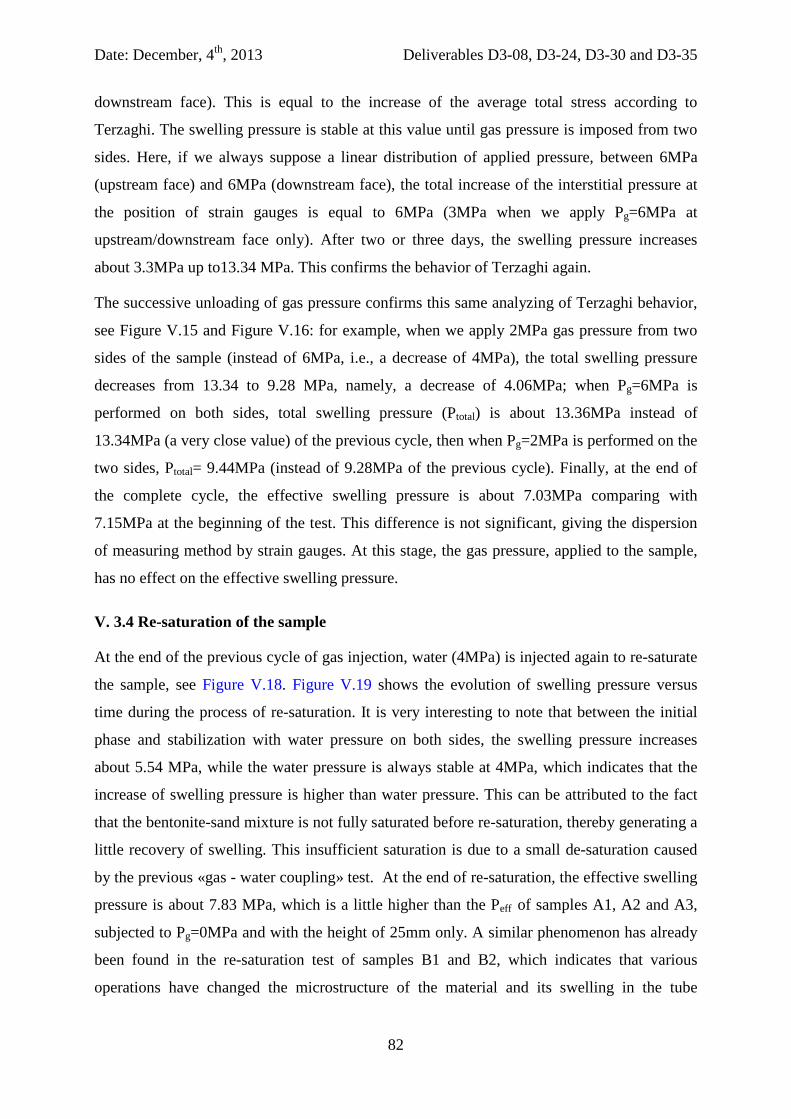
Date: December, 4th, 2013 Deliverables D3-08, D3-24, D3-30 and D3-35
82
downstream face). This is equal to the increase of the average total stress according to
Terzaghi. The swelling pressure is stable at this value until gas pressure is imposed from two
sides. Here, if we always suppose a linear distribution of applied pressure, between 6MPa
(upstream face) and 6MPa (downstream face), the total increase of the interstitial pressure at
the position of strain gauges is equal to 6MPa (3MPa when we apply Pg=6MPa at
upstream/downstream face only). After two or three days, the swelling pressure increases
about 3.3MPa up to13.34 MPa. This confirms the behavior of Terzaghi again.
The successive unloading of gas pressure confirms this same analyzing of Terzaghi behavior,
see Figure V.15 and Figure V.16: for example, when we apply 2MPa gas pressure from two
sides of the sample (instead of 6MPa, i.e., a decrease of 4MPa), the total swelling pressure
decreases from 13.34 to 9.28 MPa, namely, a decrease of 4.06MPa; when Pg=6MPa is
performed on both sides, total swelling pressure (Ptotal) is about 13.36MPa instead of
13.34MPa (a very close value) of the previous cycle, then when Pg=2MPa is performed on the
two sides, Ptotal= 9.44MPa (instead of 9.28MPa of the previous cycle). Finally, at the end of
the complete cycle, the effective swelling pressure is about 7.03MPa comparing with
7.15MPa at the beginning of the test. This difference is not significant, giving the dispersion
of measuring method by strain gauges. At this stage, the gas pressure, applied to the sample,
has no effect on the effective swelling pressure.
V. 3.4 Re-saturation of the sample
At the end of the previous cycle of gas injection, water (4MPa) is injected again to re-saturate
the sample, see Figure V.18. Figure V.19 shows the evolution of swelling pressure versus
time during the process of re-saturation. It is very interesting to note that between the initial
phase and stabilization with water pressure on both sides, the swelling pressure increases
about 5.54 MPa, while the water pressure is always stable at 4MPa, which indicates that the
increase of swelling pressure is higher than water pressure. This can be attributed to the fact
that the bentonite-sand mixture is not fully saturated before re-saturation, thereby generating a
little recovery of swelling. This insufficient saturation is due to a small de-saturation caused
by the previous «gas - water coupling» test. At the end of re-saturation, the effective swelling
pressure is about 7.83 MPa, which is a little higher than the Peff of samples A1, A2 and A3,
subjected to Pg=0MPa and with the height of 25mm only. A similar phenomenon has already
been found in the re-saturation test of samples B1 and B2, which indicates that various
operations have changed the microstructure of the material and its swelling in the tube
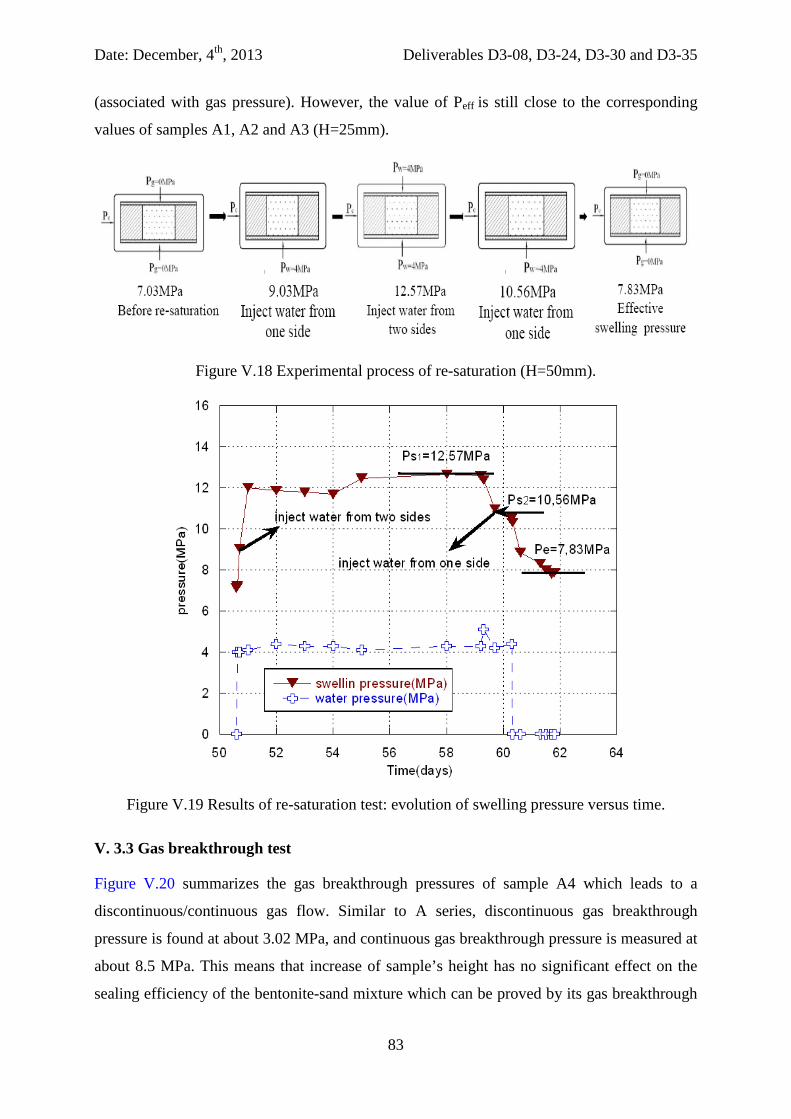
Date: December, 4th, 2013 Deliverables D3-08, D3-24, D3-30 and D3-35
83
(associated with gas pressure). However, the value of Peff is still close to the corresponding
values of samples A1, A2 and A3 (H=25mm).
Figure V.18 Experimental process of re-saturation (H=50mm).
Figure V.19 Results of re-saturation test: evolution of swelling pressure versus time.
V. 3.3 Gas breakthrough test
Figure V.20 summarizes the gas breakthrough pressures of sample A4 which leads to a
discontinuous/continuous gas flow. Similar to A series, discontinuous gas breakthrough
pressure is found at about 3.02 MPa, and continuous gas breakthrough pressure is measured at
about 8.5 MPa. This means that increase of sample’s height has no significant effect on the
sealing efficiency of the bentonite-sand mixture which can be proved by its gas breakthrough
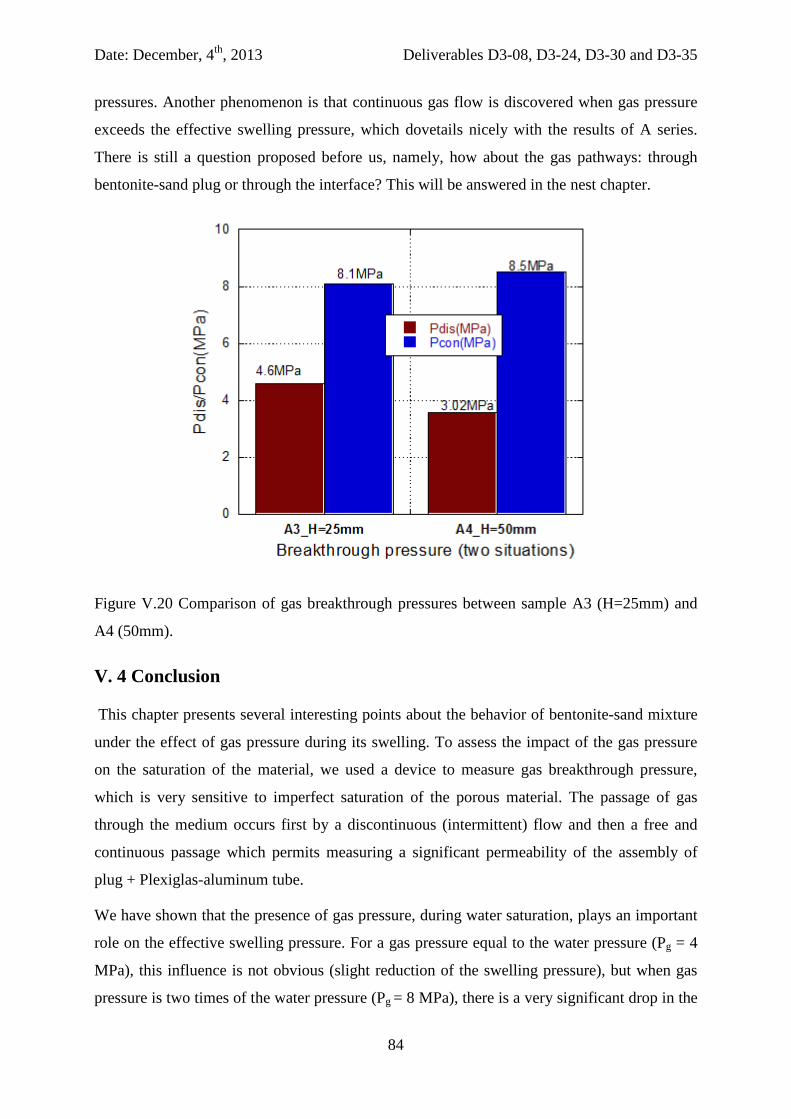
Date: December, 4th, 2013 Deliverables D3-08, D3-24, D3-30 and D3-35
84
pressures. Another phenomenon is that continuous gas flow is discovered when gas pressure
exceeds the effective swelling pressure, which dovetails nicely with the results of A series.
There is still a question proposed before us, namely, how about the gas pathways: through
bentonite-sand plug or through the interface? This will be answered in the nest chapter.
Figure V.20 Comparison of gas breakthrough pressures between sample A3 (H=25mm) and
A4 (50mm).
V. 4 Conclusion
This chapter presents several interesting points about the behavior of bentonite-sand mixture
under the effect of gas pressure during its swelling. To assess the impact of the gas pressure
on the saturation of the material, we used a device to measure gas breakthrough pressure,
which is very sensitive to imperfect saturation of the porous material. The passage of gas
through the medium occurs first by a discontinuous (intermittent) flow and then a free and
continuous passage which permits measuring a significant permeability of the assembly of
plug + Plexiglas-aluminum tube.
We have shown that the presence of gas pressure, during water saturation, plays an important
role on the effective swelling pressure. For a gas pressure equal to the water pressure (Pg = 4
MPa), this influence is not obvious (slight reduction of the swelling pressure), but when gas
pressure is two times of the water pressure (Pg = 8 MPa), there is a very significant drop in the
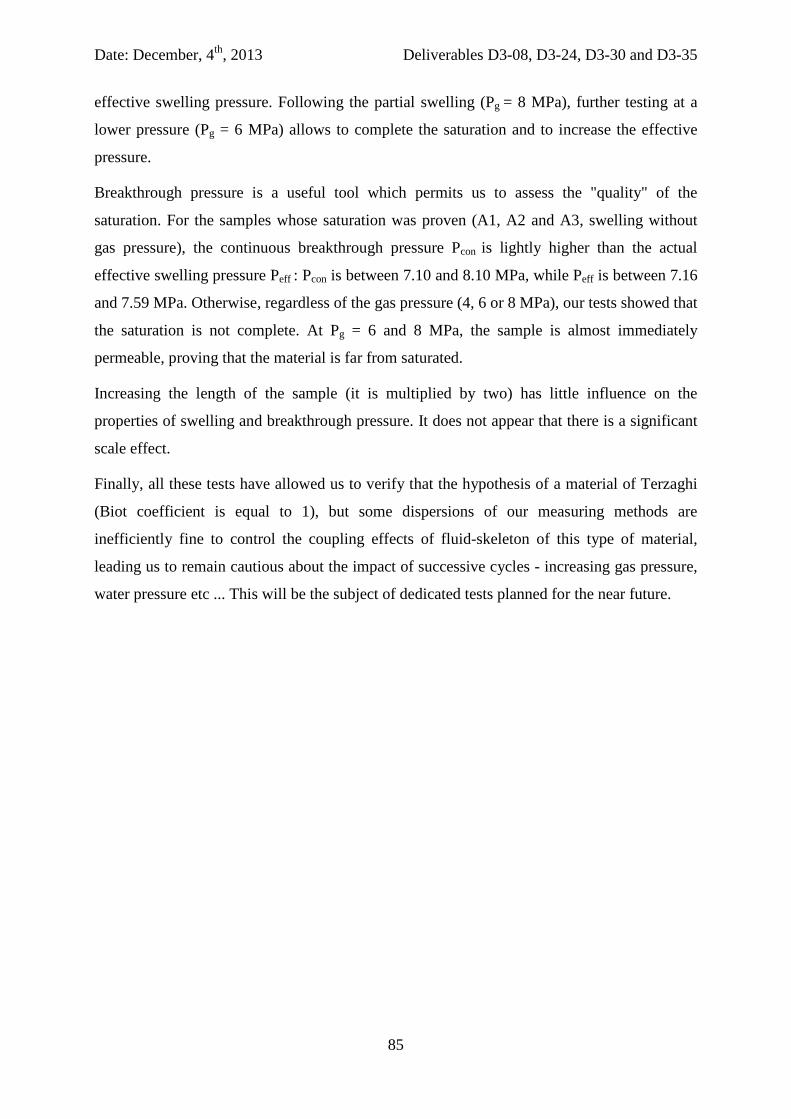
Date: December, 4th, 2013 Deliverables D3-08, D3-24, D3-30 and D3-35
85
effective swelling pressure. Following the partial swelling (Pg = 8 MPa), further testing at a
lower pressure (Pg = 6 MPa) allows to complete the saturation and to increase the effective
pressure.
Breakthrough pressure is a useful tool which permits us to assess the "quality" of the
saturation. For the samples whose saturation was proven (A1, A2 and A3, swelling without
gas pressure), the continuous breakthrough pressure Pcon is lightly higher than the actual
effective swelling pressure Peff : Pcon is between 7.10 and 8.10 MPa, while Peff is between 7.16
and 7.59 MPa. Otherwise, regardless of the gas pressure (4, 6 or 8 MPa), our tests showed that
the saturation is not complete. At Pg = 6 and 8 MPa, the sample is almost immediately
permeable, proving that the material is far from saturated.
Increasing the length of the sample (it is multiplied by two) has little influence on the
properties of swelling and breakthrough pressure. It does not appear that there is a significant
scale effect.
Finally, all these tests have allowed us to verify that the hypothesis of a material of Terzaghi
(Biot coefficient is equal to 1), but some dispersions of our measuring methods are
inefficiently fine to control the coupling effects of fluid-skeleton of this type of material,
leading us to remain cautious about the impact of successive cycles - increasing gas pressure,
water pressure etc ... This will be the subject of dedicated tests planned for the near future.
Date: December, 4th, 2013 Deliverables D3-08, D3-24, D3-30 and D3-35
86
VI - Swelling and GBP of argillite, bentonite
and argillite / bentonite interface
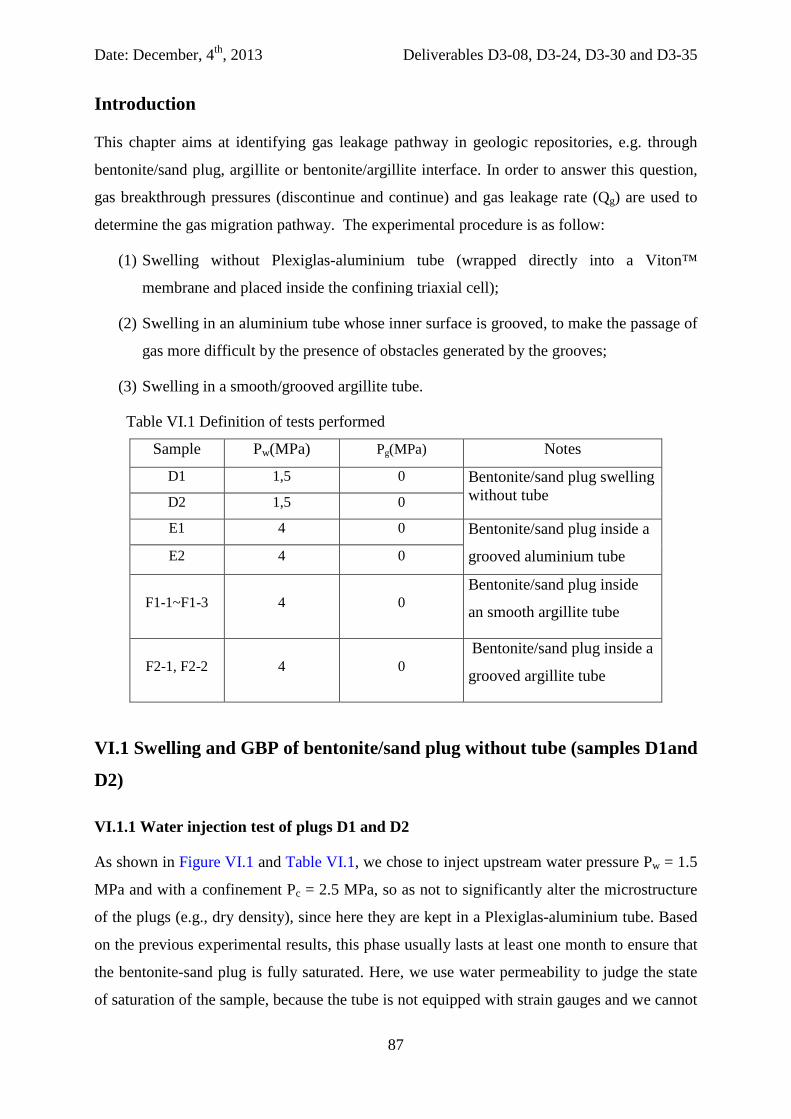
Date: December, 4th, 2013 Deliverables D3-08, D3-24, D3-30 and D3-35
87
Introduction
This chapter aims at identifying gas leakage pathway in geologic repositories, e.g. through
bentonite/sand plug, argillite or bentonite/argillite interface. In order to answer this question,
gas breakthrough pressures (discontinue and continue) and gas leakage rate (Qg) are used to
determine the gas migration pathway. The experimental procedure is as follow:
(1) Swelling without Plexiglas-aluminium tube (wrapped directly into a Viton™
membrane and placed inside the confining triaxial cell);
(2) Swelling in an aluminium tube whose inner surface is grooved, to make the passage of
gas more difficult by the presence of obstacles generated by the grooves;
(3) Swelling in a smooth/grooved argillite tube.
Table VI.1 Definition of tests performed
Sample Pw(MPa) Pg(MPa) Notes
D1 1,5 0 Bentonite/sand plug swelling without tube D2 1,5 0
E1 4 0 Bentonite/sand plug inside a
grooved aluminium tube E2 4 0
F1-1~F1-3 4 0 Bentonite/sand plug inside
an smooth argillite tube
F2-1, F2-2 4 0 Bentonite/sand plug inside a
grooved argillite tube
VI.1 Swelling and GBP of bentonite/sand plug without tube (samples D1and
D2)
VI.1.1 Water injection test of plugs D1 and D2
As shown in Figure VI.1 and Table VI.1, we chose to inject upstream water pressure Pw = 1.5
MPa and with a confinement Pc = 2.5 MPa, so as not to significantly alter the microstructure
of the plugs (e.g., dry density), since here they are kept in a Plexiglas-aluminium tube. Based
on the previous experimental results, this phase usually lasts at least one month to ensure that
the bentonite-sand plug is fully saturated. Here, we use water permeability to judge the state
of saturation of the sample, because the tube is not equipped with strain gauges and we cannot
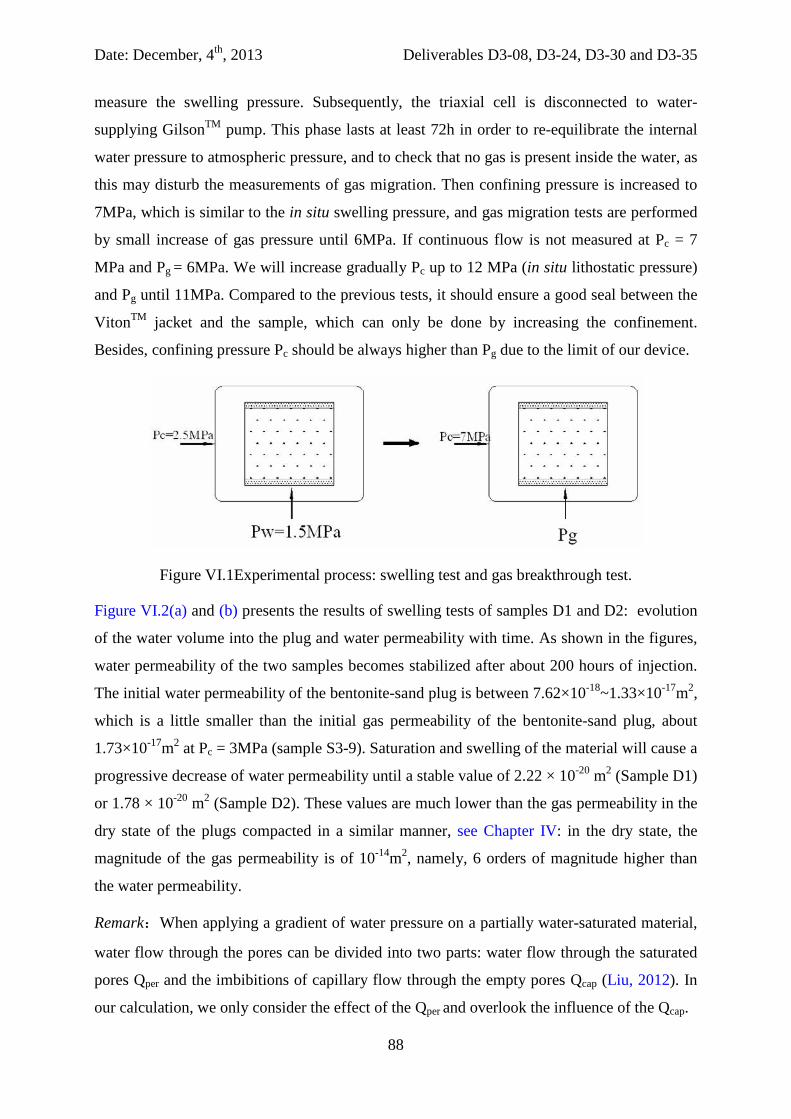
Date: December, 4th, 2013 Deliverables D3-08, D3-24, D3-30 and D3-35
88
measure the swelling pressure. Subsequently, the triaxial cell is disconnected to water-
supplying GilsonTM pump. This phase lasts at least 72h in order to re-equilibrate the internal
water pressure to atmospheric pressure, and to check that no gas is present inside the water, as
this may disturb the measurements of gas migration. Then confining pressure is increased to
7MPa, which is similar to the in situ swelling pressure, and gas migration tests are performed
by small increase of gas pressure until 6MPa. If continuous flow is not measured at Pc = 7
MPa and Pg = 6MPa. We will increase gradually Pc up to 12 MPa (in situ lithostatic pressure)
and Pg until 11MPa. Compared to the previous tests, it should ensure a good seal between the
VitonTM jacket and the sample, which can only be done by increasing the confinement.
Besides, confining pressure Pc should be always higher than Pg due to the limit of our device.
Figure VI.1Experimental process: swelling test and gas breakthrough test.
Figure VI.2(a) and (b) presents the results of swelling tests of samples D1 and D2: evolution
of the water volume into the plug and water permeability with time. As shown in the figures,
water permeability of the two samples becomes stabilized after about 200 hours of injection.
The initial water permeability of the bentonite-sand plug is between 7.62×10⁻¹⁸~1.33×10⁻¹⁷m2,
which is a little smaller than the initial gas permeability of the bentonite-sand plug, about
1.73×10⁻¹⁷m2 at Pc = 3MPa (sample S3-9). Saturation and swelling of the material will cause a
progressive decrease of water permeability until a stable value of 2.22 × 10⁻²⁰ m2 (Sample D1)
or 1.78 × 10⁻²⁰ m2 (Sample D2). These values are much lower than the gas permeability in the
dry state of the plugs compacted in a similar manner, see Chapter IV: in the dry state, the
magnitude of the gas permeability is of 10-14m2, namely, 6 orders of magnitude higher than
the water permeability.
Remark:When applying a gradient of water pressure on a partially water-saturated material,
water flow through the pores can be divided into two parts: water flow through the saturated
pores Qper and the imbibitions of capillary flow through the empty pores Qcap (Liu, 2012). In
our calculation, we only consider the effect of the Qper and overlook the influence of the Qcap.
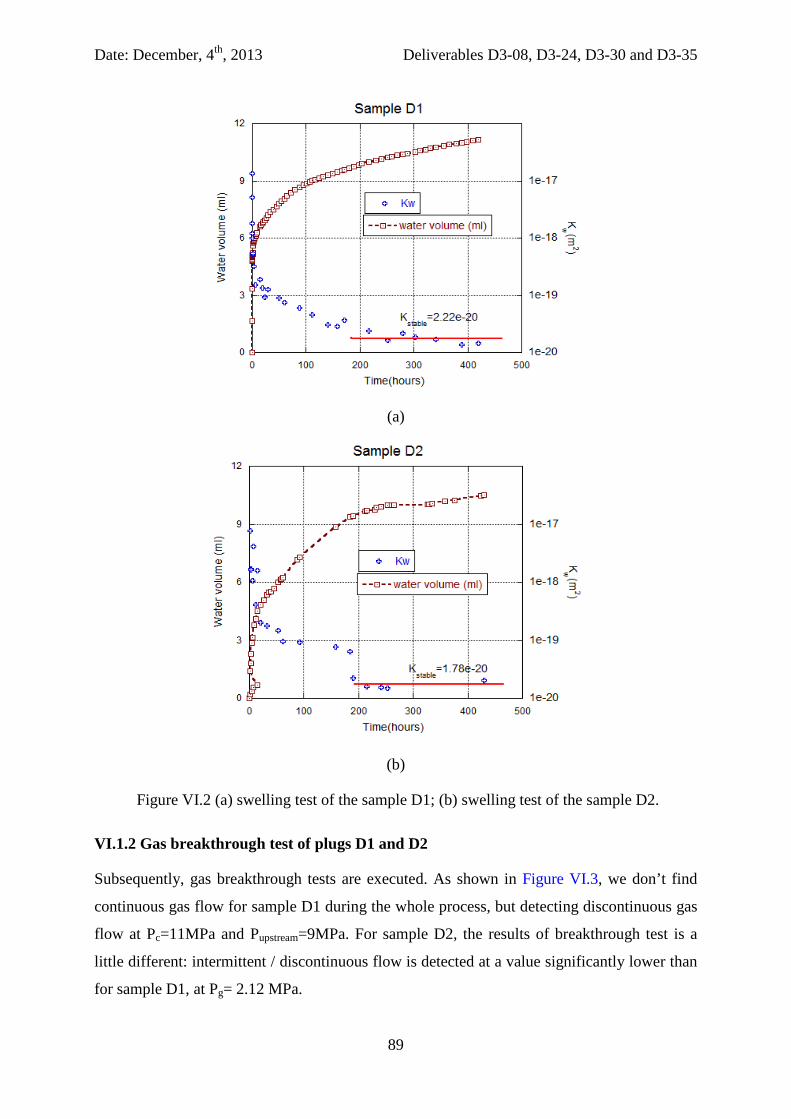
Date: December, 4th, 2013 Deliverables D3-08, D3-24, D3-30 and D3-35
89
(a)
(b)
Figure VI.2 (a) swelling test of the sample D1; (b) swelling test of the sample D2.
VI.1.2 Gas breakthrough test of plugs D1 and D2
Subsequently, gas breakthrough tests are executed. As shown in Figure VI.3, we don’t find
continuous gas flow for sample D1 during the whole process, but detecting discontinuous gas
flow at Pc=11MPa and Pupstream=9MPa. For sample D2, the results of breakthrough test is a
little different: intermittent / discontinuous flow is detected at a value significantly lower than
for sample D1, at Pg= 2.12 MPa.
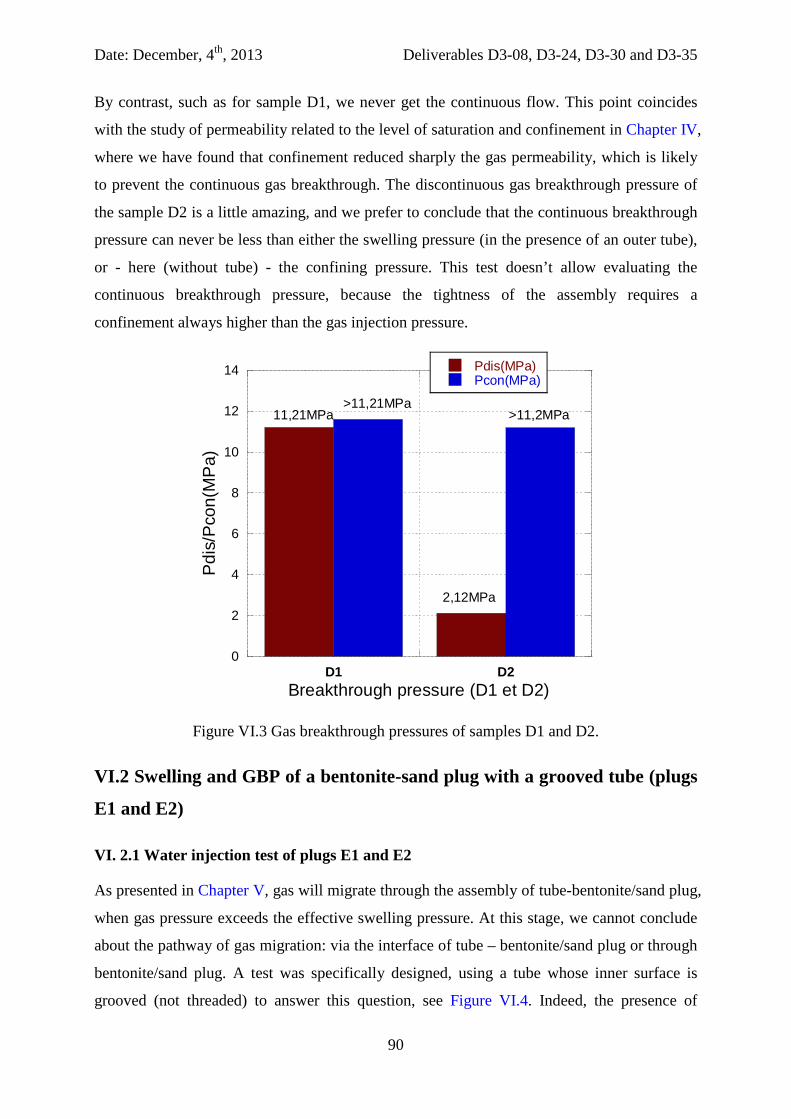
Date: December, 4th, 2013 Deliverables D3-08, D3-24, D3-30 and D3-35
90
By contrast, such as for sample D1, we never get the continuous flow. This point coincides
with the study of permeability related to the level of saturation and confinement in Chapter IV,
where we have found that confinement reduced sharply the gas permeability, which is likely
to prevent the continuous gas breakthrough. The discontinuous gas breakthrough pressure of
the sample D2 is a little amazing, and we prefer to conclude that the continuous breakthrough
pressure can never be less than either the swelling pressure (in the presence of an outer tube),
or - here (without tube) - the confining pressure. This test doesn’t allow evaluating the
continuous breakthrough pressure, because the tightness of the assembly requires a
confinement always higher than the gas injection pressure.
0
2
4
6
8
10
12
14
D1 D2
Pdis(MPa)Pcon(MPa)
Pdi
s/P
con(
MP
a)
Breakthrough pressure (D1 et D2)
11,21MPa
2,12MPa
>11,21MPa>11,2MPa
Figure VI.3 Gas breakthrough pressures of samples D1 and D2.
VI.2 Swelling and GBP of a bentonite-sand plug with a grooved tube (plugs
E1 and E2)
VI. 2.1 Water injection test of plugs E1 and E2
As presented in Chapter V, gas will migrate through the assembly of tube-bentonite/sand plug,
when gas pressure exceeds the effective swelling pressure. At this stage, we cannot conclude
about the pathway of gas migration: via the interface of tube – bentonite/sand plug or through
bentonite/sand plug. A test was specifically designed, using a tube whose inner surface is
grooved (not threaded) to answer this question, see Figure VI.4. Indeed, the presence of
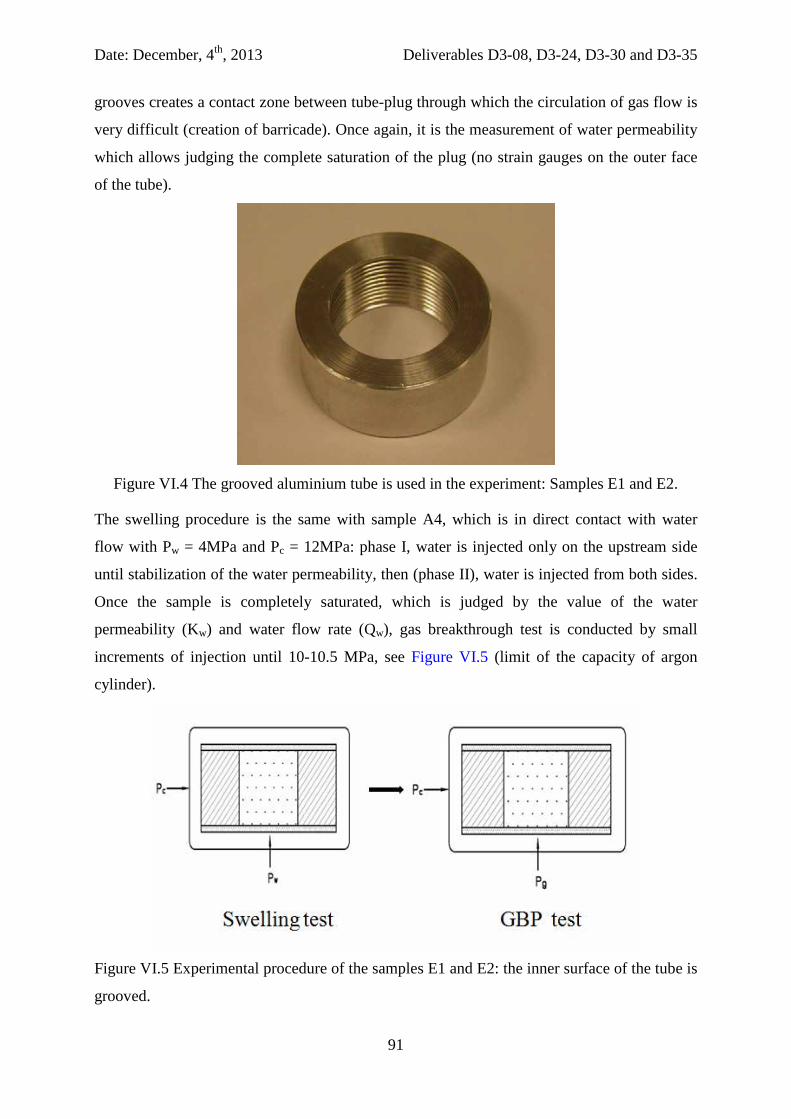
Date: December, 4th, 2013 Deliverables D3-08, D3-24, D3-30 and D3-35
91
grooves creates a contact zone between tube-plug through which the circulation of gas flow is
very difficult (creation of barricade). Once again, it is the measurement of water permeability
which allows judging the complete saturation of the plug (no strain gauges on the outer face
of the tube).
Figure VI.4 The grooved aluminium tube is used in the experiment: Samples E1 and E2.
The swelling procedure is the same with sample A4, which is in direct contact with water
flow with Pw = 4MPa and Pc = 12MPa: phase I, water is injected only on the upstream side
until stabilization of the water permeability, then (phase II), water is injected from both sides.
Once the sample is completely saturated, which is judged by the value of the water
permeability (Kw) and water flow rate (Qw), gas breakthrough test is conducted by small
increments of injection until 10-10.5 MPa, see Figure VI.5 (limit of the capacity of argon
cylinder).
Figure VI.5 Experimental procedure of the samples E1 and E2: the inner surface of the tube is
grooved.
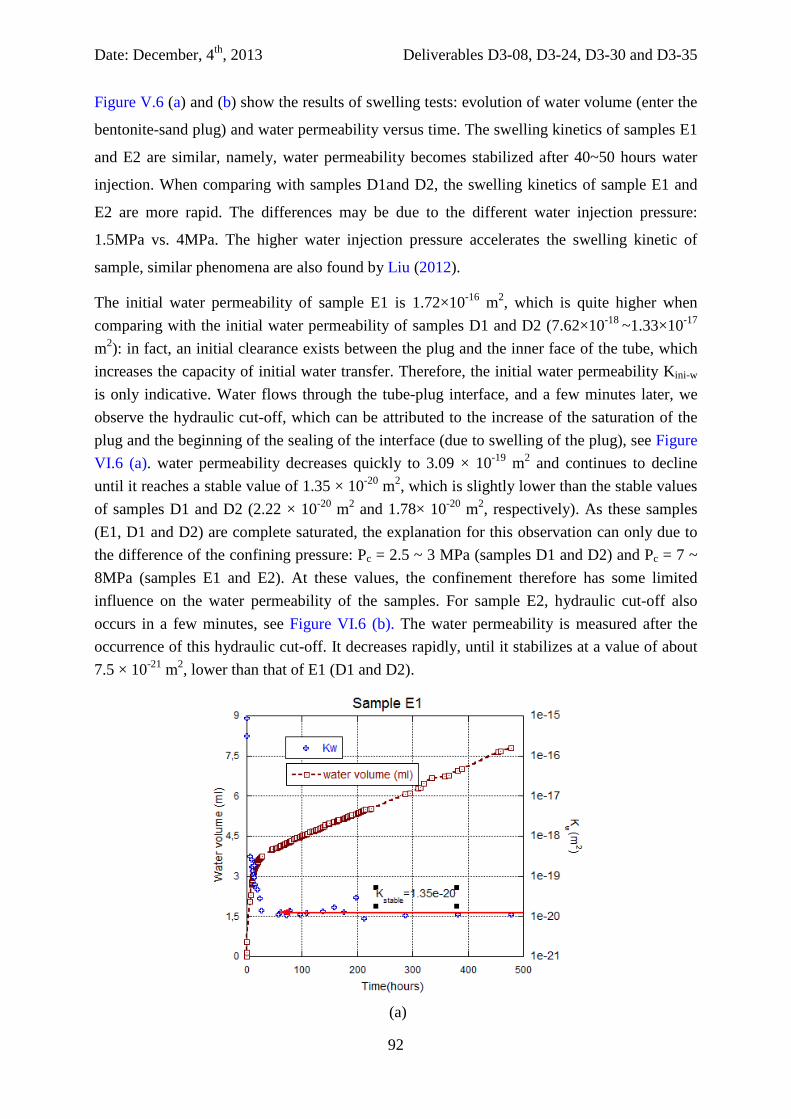
Date: December, 4th, 2013 Deliverables D3-08, D3-24, D3-30 and D3-35
92
Figure V.6 (a) and (b) show the results of swelling tests: evolution of water volume (enter the
bentonite-sand plug) and water permeability versus time. The swelling kinetics of samples E1
and E2 are similar, namely, water permeability becomes stabilized after 40~50 hours water
injection. When comparing with samples D1and D2, the swelling kinetics of sample E1 and
E2 are more rapid. The differences may be due to the different water injection pressure:
1.5MPa vs. 4MPa. The higher water injection pressure accelerates the swelling kinetic of
sample, similar phenomena are also found by Liu (2012).
The initial water permeability of sample E1 is 1.72×10⁻¹⁶ m2, which is quite higher when comparing with the initial water permeability of samples D1 and D2 (7.62×10⁻¹⁸ ~1.33×10⁻¹⁷
m2): in fact, an initial clearance exists between the plug and the inner face of the tube, which increases the capacity of initial water transfer. Therefore, the initial water permeability Kini-w is only indicative. Water flows through the tube-plug interface, and a few minutes later, we observe the hydraulic cut-off, which can be attributed to the increase of the saturation of the plug and the beginning of the sealing of the interface (due to swelling of the plug), see Figure VI.6 (a). water permeability decreases quickly to 3.09 × 10⁻¹⁹ m2 and continues to decline until it reaches a stable value of 1.35 × 10⁻²⁰ m2, which is slightly lower than the stable values of samples D1 and D2 (2.22 × 10⁻²⁰ m2 and 1.78× 10⁻²⁰ m2, respectively). As these samples (E1, D1 and D2) are complete saturated, the explanation for this observation can only due to the difference of the confining pressure: Pc = 2.5 ~ 3 MPa (samples D1 and D2) and Pc = 7 ~ 8MPa (samples E1 and E2). At these values, the confinement therefore has some limited influence on the water permeability of the samples. For sample E2, hydraulic cut-off also occurs in a few minutes, see Figure VI.6 (b). The water permeability is measured after the occurrence of this hydraulic cut-off. It decreases rapidly, until it stabilizes at a value of about 7.5 × 10⁻²¹ m2, lower than that of E1 (D1 and D2).
(a)
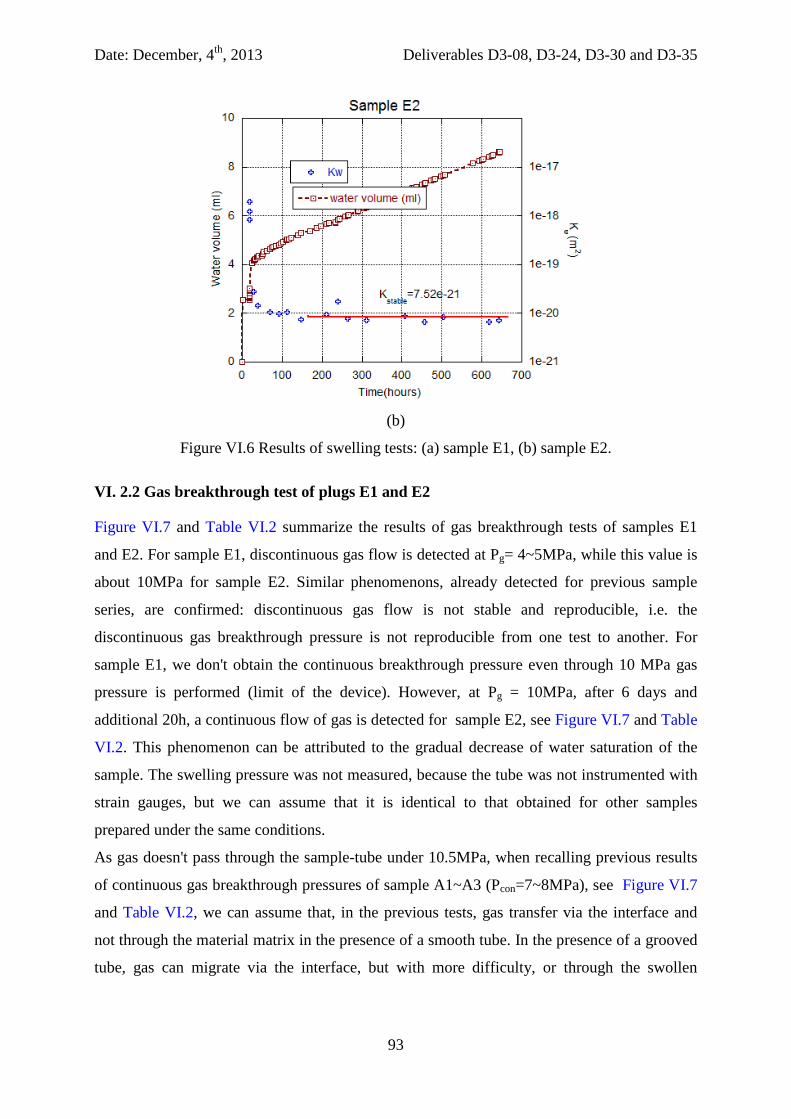
Date: December, 4th, 2013 Deliverables D3-08, D3-24, D3-30 and D3-35
93
(b)
Figure VI.6 Results of swelling tests: (a) sample E1, (b) sample E2.
VI. 2.2 Gas breakthrough test of plugs E1 and E2
Figure VI.7 and Table VI.2 summarize the results of gas breakthrough tests of samples E1
and E2. For sample E1, discontinuous gas flow is detected at Pg= 4~5MPa, while this value is
about 10MPa for sample E2. Similar phenomenons, already detected for previous sample
series, are confirmed: discontinuous gas flow is not stable and reproducible, i.e. the
discontinuous gas breakthrough pressure is not reproducible from one test to another. For
sample E1, we don't obtain the continuous breakthrough pressure even through 10 MPa gas
pressure is performed (limit of the device). However, at Pg = 10MPa, after 6 days and
additional 20h, a continuous flow of gas is detected for sample E2, see Figure VI.7 and Table
VI.2. This phenomenon can be attributed to the gradual decrease of water saturation of the
sample. The swelling pressure was not measured, because the tube was not instrumented with
strain gauges, but we can assume that it is identical to that obtained for other samples
prepared under the same conditions.
As gas doesn't pass through the sample-tube under 10.5MPa, when recalling previous results
of continuous gas breakthrough pressures of sample A1~A3 (Pcon=7~8MPa), see Figure VI.7
and Table VI.2, we can assume that, in the previous tests, gas transfer via the interface and
not through the material matrix in the presence of a smooth tube. In the presence of a grooved
tube, gas can migrate via the interface, but with more difficulty, or through the swollen
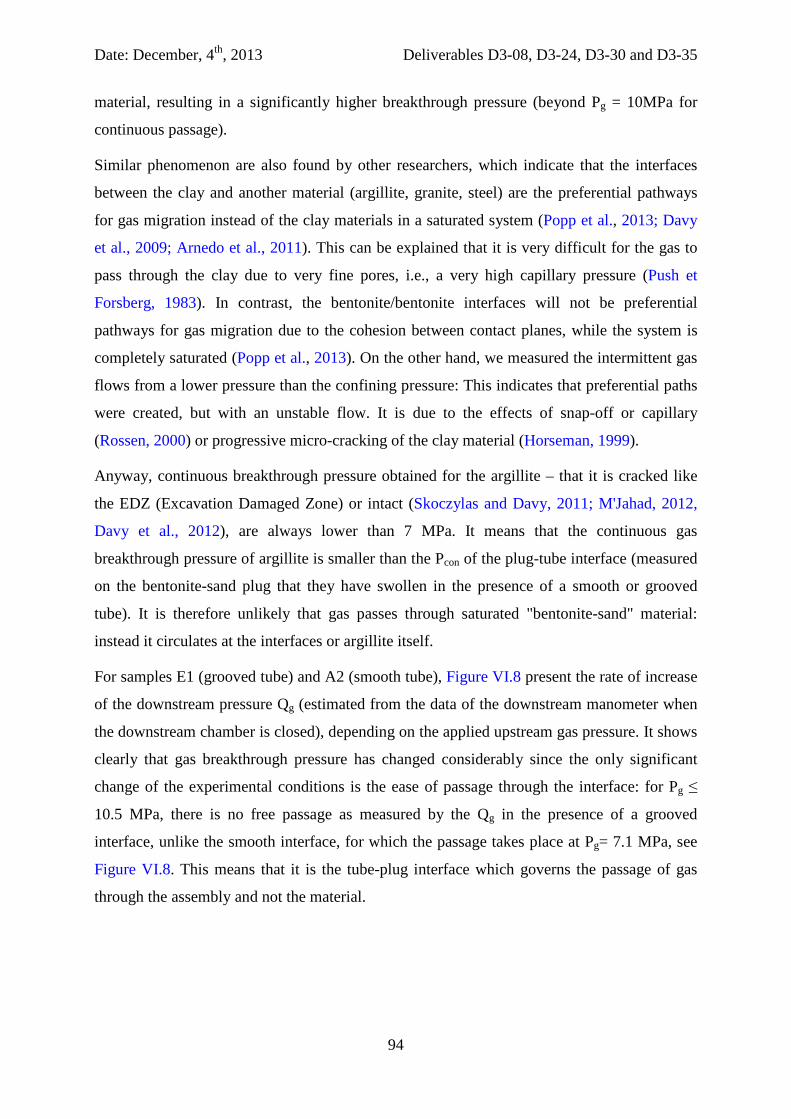
Date: December, 4th, 2013 Deliverables D3-08, D3-24, D3-30 and D3-35
94
material, resulting in a significantly higher breakthrough pressure (beyond Pg = 10MPa for
continuous passage).
Similar phenomenon are also found by other researchers, which indicate that the interfaces
between the clay and another material (argillite, granite, steel) are the preferential pathways
for gas migration instead of the clay materials in a saturated system (Popp et al., 2013; Davy
et al., 2009; Arnedo et al., 2011). This can be explained that it is very difficult for the gas to
pass through the clay due to very fine pores, i.e., a very high capillary pressure (Push et
Forsberg, 1983). In contrast, the bentonite/bentonite interfaces will not be preferential
pathways for gas migration due to the cohesion between contact planes, while the system is
completely saturated (Popp et al., 2013). On the other hand, we measured the intermittent gas
flows from a lower pressure than the confining pressure: This indicates that preferential paths
were created, but with an unstable flow. It is due to the effects of snap-off or capillary
(Rossen, 2000) or progressive micro-cracking of the clay material (Horseman, 1999).
Anyway, continuous breakthrough pressure obtained for the argillite – that it is cracked like
the EDZ (Excavation Damaged Zone) or intact (Skoczylas and Davy, 2011; M'Jahad, 2012,
Davy et al., 2012), are always lower than 7 MPa. It means that the continuous gas
breakthrough pressure of argillite is smaller than the Pcon of the plug-tube interface (measured
on the bentonite-sand plug that they have swollen in the presence of a smooth or grooved
tube). It is therefore unlikely that gas passes through saturated "bentonite-sand" material:
instead it circulates at the interfaces or argillite itself.
For samples E1 (grooved tube) and A2 (smooth tube), Figure VI.8 present the rate of increase
of the downstream pressure Qg (estimated from the data of the downstream manometer when
the downstream chamber is closed), depending on the applied upstream gas pressure. It shows
clearly that gas breakthrough pressure has changed considerably since the only significant
change of the experimental conditions is the ease of passage through the interface: for Pg ≤
10.5 MPa, there is no free passage as measured by the Qg in the presence of a grooved
interface, unlike the smooth interface, for which the passage takes place at Pg= 7.1 MPa, see
Figure VI.8. This means that it is the tube-plug interface which governs the passage of gas
through the assembly and not the material.
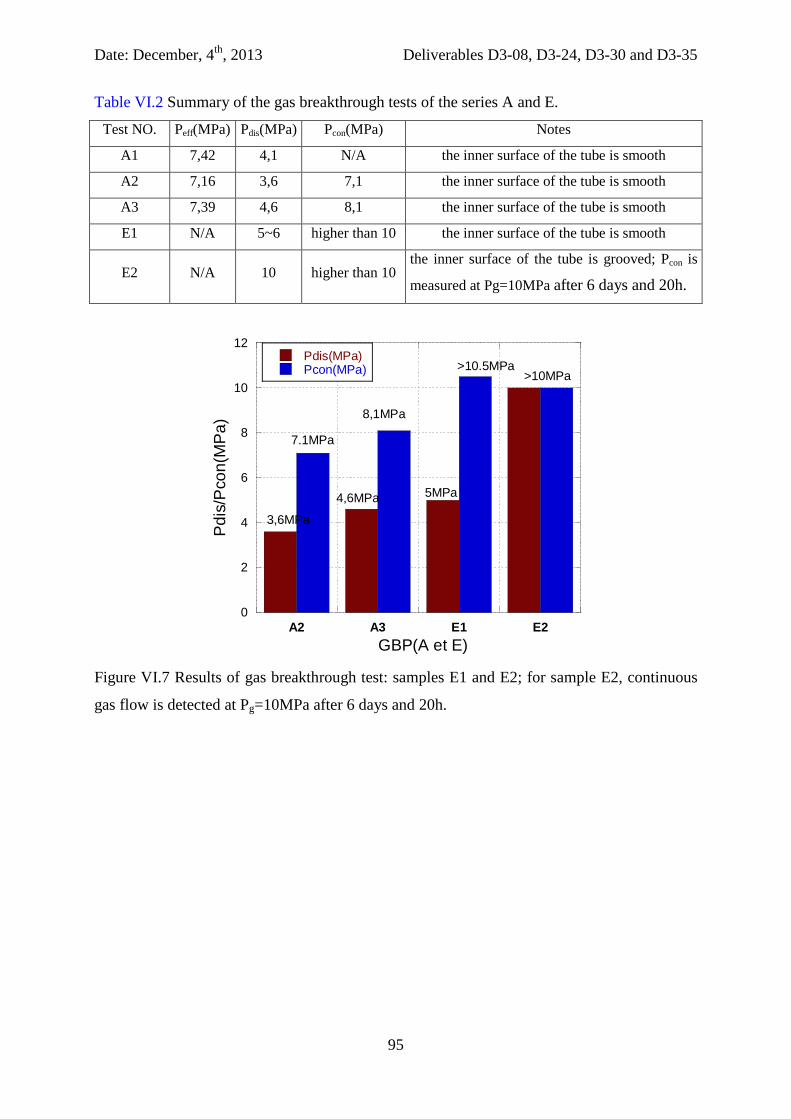
Date: December, 4th, 2013 Deliverables D3-08, D3-24, D3-30 and D3-35
95
Table VI.2 Summary of the gas breakthrough tests of the series A and E.
Test NO. Peff(MPa) Pdis(MPa) Pcon(MPa) Notes A1 7,42 4,1 N/A the inner surface of the tube is smooth A2 7,16 3,6 7,1 the inner surface of the tube is smooth A3 7,39 4,6 8,1 the inner surface of the tube is smooth E1 N/A 5~6 higher than 10 the inner surface of the tube is smooth
E2 N/A 10 higher than 10 the inner surface of the tube is grooved; Pcon is
measured at Pg=10MPa after 6 days and 20h.
0
2
4
6
8
10
12
A2 A3 E1 E2
Pdis(MPa)Pcon(MPa)
Pdi
s/P
con(
MP
a)
GBP(A et E)
3,6MPa
>10.5MPa
5MPa
8,1MPa
7.1MPa
4,6MPa
>10MPa
Figure VI.7 Results of gas breakthrough test: samples E1 and E2; for sample E2, continuous
gas flow is detected at Pg=10MPa after 6 days and 20h.
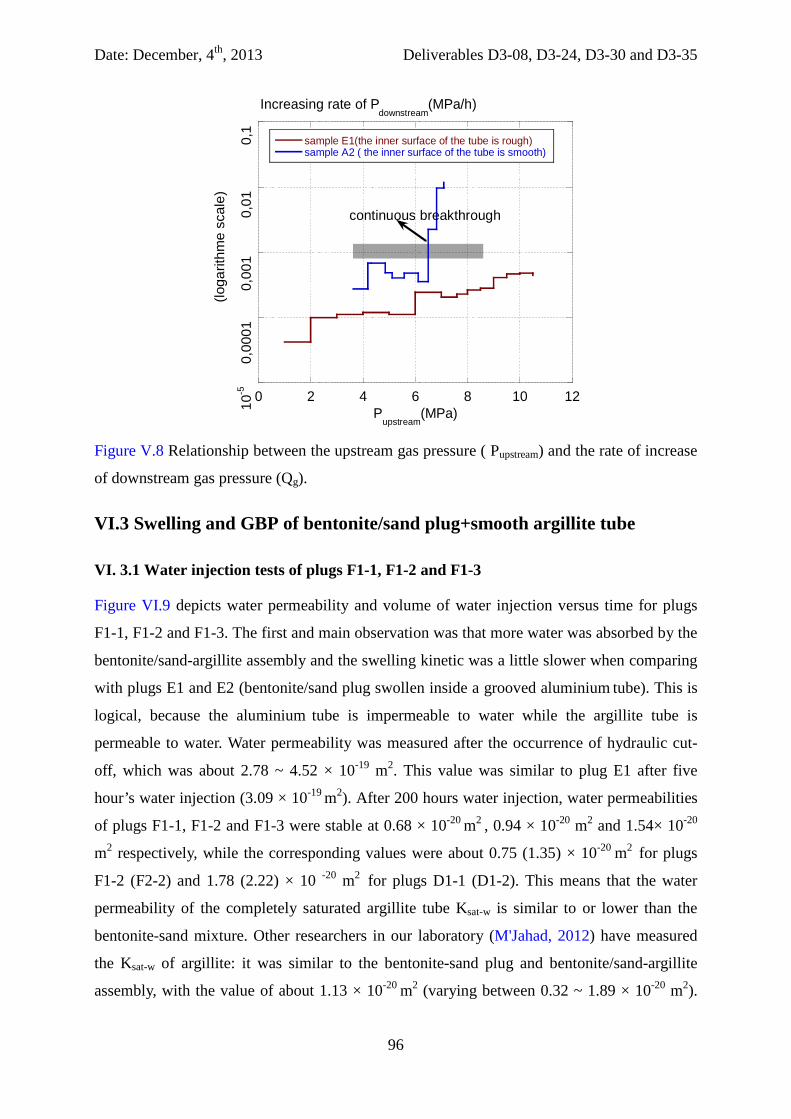
Date: December, 4th, 2013 Deliverables D3-08, D3-24, D3-30 and D3-35
96
10-5
0,00
010,
001
0,01
0,1
0 2 4 6 8 10 12
sample E1(the inner surface of the tube is rough)sample A2 ( the inner surface of the tube is smooth)
Increasing rate of Pdownstream
(MPa/h)
Pupstream
(MPa)
continuous breakthrough (l
ogar
ithm
e sc
ale)
Figure V.8 Relationship between the upstream gas pressure ( Pupstream) and the rate of increase
of downstream gas pressure (Qg).
VI.3 Swelling and GBP of bentonite/sand plug+smooth argillite tube
VI. 3.1 Water injection tests of plugs F1-1, F1-2 and F1-3
Figure VI.9 depicts water permeability and volume of water injection versus time for plugs
F1-1, F1-2 and F1-3. The first and main observation was that more water was absorbed by the
bentonite/sand-argillite assembly and the swelling kinetic was a little slower when comparing
with plugs E1 and E2 (bentonite/sand plug swollen inside a grooved aluminium tube). This is
logical, because the aluminium tube is impermeable to water while the argillite tube is
permeable to water. Water permeability was measured after the occurrence of hydraulic cut-
off, which was about 2.78 ~ 4.52 × 10⁻¹⁹ m2. This value was similar to plug E1 after five
hour’s water injection (3.09 × 10⁻¹⁹ m2). After 200 hours water injection, water permeabilities
of plugs F1-1, F1-2 and F1-3 were stable at 0.68 × 10⁻²⁰ m2 , 0.94 × 10⁻²⁰ m2 and 1.54× 10⁻²⁰
m2 respectively, while the corresponding values were about 0.75 (1.35) × 10-20 m2 for plugs
F1-2 (F2-2) and 1.78 (2.22) × 10 -20 m2 for plugs D1-1 (D1-2). This means that the water
permeability of the completely saturated argillite tube Ksat-w is similar to or lower than the
bentonite-sand mixture. Other researchers in our laboratory (M'Jahad, 2012) have measured
the Ksat-w of argillite: it was similar to the bentonite-sand plug and bentonite/sand-argillite
assembly, with the value of about 1.13 × 10⁻²⁰ m2 (varying between 0.32 ~ 1.89 × 10⁻²⁰ m2).
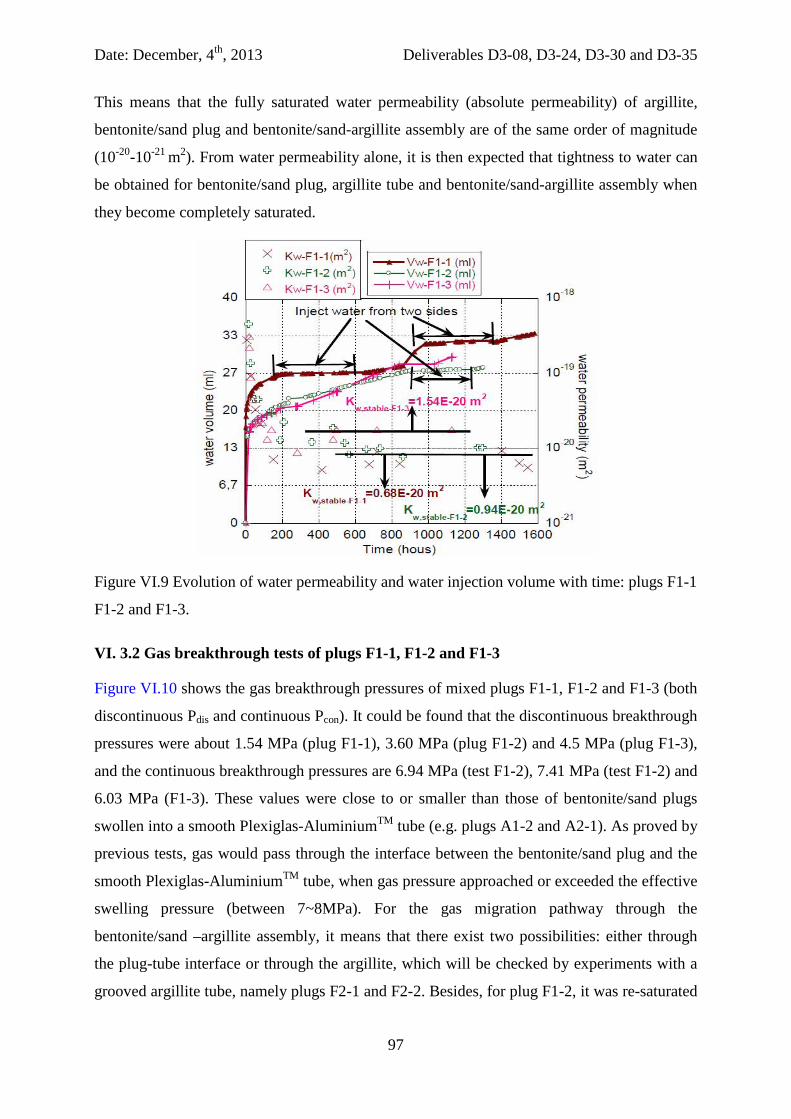
Date: December, 4th, 2013 Deliverables D3-08, D3-24, D3-30 and D3-35
97
This means that the fully saturated water permeability (absolute permeability) of argillite,
bentonite/sand plug and bentonite/sand-argillite assembly are of the same order of magnitude
(10-20-10-21 m2). From water permeability alone, it is then expected that tightness to water can
be obtained for bentonite/sand plug, argillite tube and bentonite/sand-argillite assembly when
they become completely saturated.
Figure VI.9 Evolution of water permeability and water injection volume with time: plugs F1-1
F1-2 and F1-3.
VI. 3.2 Gas breakthrough tests of plugs F1-1, F1-2 and F1-3
Figure VI.10 shows the gas breakthrough pressures of mixed plugs F1-1, F1-2 and F1-3 (both
discontinuous Pdis and continuous Pcon). It could be found that the discontinuous breakthrough
pressures were about 1.54 MPa (plug F1-1), 3.60 MPa (plug F1-2) and 4.5 MPa (plug F1-3),
and the continuous breakthrough pressures are 6.94 MPa (test F1-2), 7.41 MPa (test F1-2) and
6.03 MPa (F1-3). These values were close to or smaller than those of bentonite/sand plugs
swollen into a smooth Plexiglas-AluminiumTM tube (e.g. plugs A1-2 and A2-1). As proved by
previous tests, gas would pass through the interface between the bentonite/sand plug and the
smooth Plexiglas-AluminiumTM tube, when gas pressure approached or exceeded the effective
swelling pressure (between 7~8MPa). For the gas migration pathway through the
bentonite/sand –argillite assembly, it means that there exist two possibilities: either through
the plug-tube interface or through the argillite, which will be checked by experiments with a
grooved argillite tube, namely plugs F2-1 and F2-2. Besides, for plug F1-2, it was re-saturated
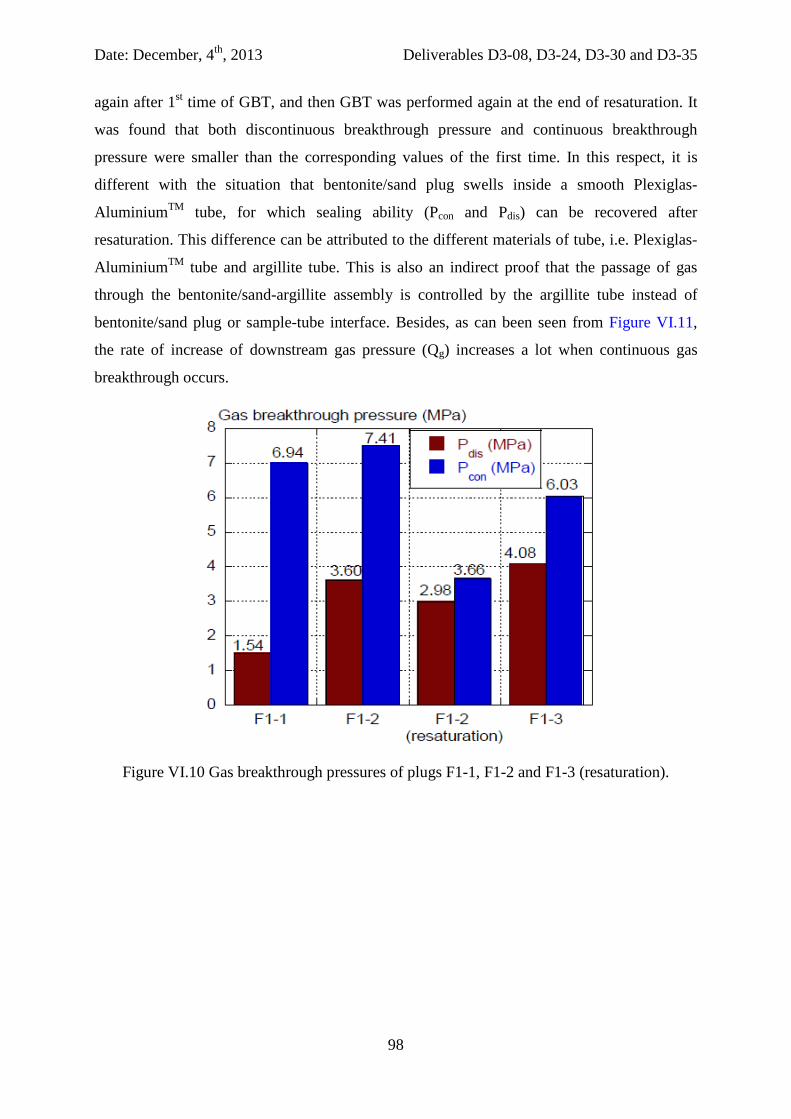
Date: December, 4th, 2013 Deliverables D3-08, D3-24, D3-30 and D3-35
98
again after 1st time of GBT, and then GBT was performed again at the end of resaturation. It
was found that both discontinuous breakthrough pressure and continuous breakthrough
pressure were smaller than the corresponding values of the first time. In this respect, it is
different with the situation that bentonite/sand plug swells inside a smooth Plexiglas-
AluminiumTM tube, for which sealing ability (Pcon and Pdis) can be recovered after
resaturation. This difference can be attributed to the different materials of tube, i.e. Plexiglas-
AluminiumTM tube and argillite tube. This is also an indirect proof that the passage of gas
through the bentonite/sand-argillite assembly is controlled by the argillite tube instead of
bentonite/sand plug or sample-tube interface. Besides, as can been seen from Figure VI.11,
the rate of increase of downstream gas pressure (Qg) increases a lot when continuous gas
breakthrough occurs.
Figure VI.10 Gas breakthrough pressures of plugs F1-1, F1-2 and F1-3 (resaturation).
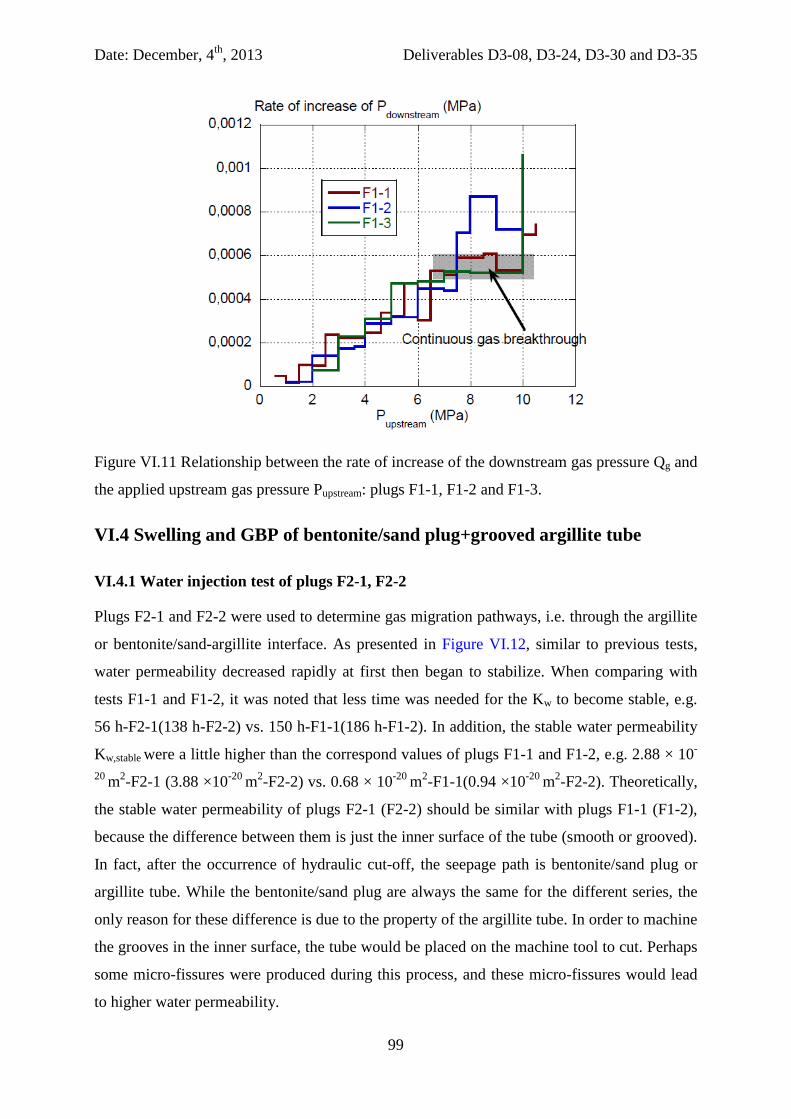
Date: December, 4th, 2013 Deliverables D3-08, D3-24, D3-30 and D3-35
99
Figure VI.11 Relationship between the rate of increase of the downstream gas pressure Qg and
the applied upstream gas pressure Pupstream: plugs F1-1, F1-2 and F1-3.
VI.4 Swelling and GBP of bentonite/sand plug+grooved argillite tube
VI.4.1 Water injection test of plugs F2-1, F2-2
Plugs F2-1 and F2-2 were used to determine gas migration pathways, i.e. through the argillite
or bentonite/sand-argillite interface. As presented in Figure VI.12, similar to previous tests,
water permeability decreased rapidly at first then began to stabilize. When comparing with
tests F1-1 and F1-2, it was noted that less time was needed for the Kw to become stable, e.g.
56 h-F2-1(138 h-F2-2) vs. 150 h-F1-1(186 h-F1-2). In addition, the stable water permeability
Kw,stable were a little higher than the correspond values of plugs F1-1 and F1-2, e.g. 2.88 × 10-
20 m2-F2-1 (3.88 ×10⁻²⁰ m2-F2-2) vs. 0.68 × 10⁻²⁰ m2-F1-1(0.94 ×10⁻²⁰ m2-F2-2). Theoretically,
the stable water permeability of plugs F2-1 (F2-2) should be similar with plugs F1-1 (F1-2),
because the difference between them is just the inner surface of the tube (smooth or grooved).
In fact, after the occurrence of hydraulic cut-off, the seepage path is bentonite/sand plug or
argillite tube. While the bentonite/sand plug are always the same for the different series, the
only reason for these difference is due to the property of the argillite tube. In order to machine
the grooves in the inner surface, the tube would be placed on the machine tool to cut. Perhaps
some micro-fissures were produced during this process, and these micro-fissures would lead
to higher water permeability.
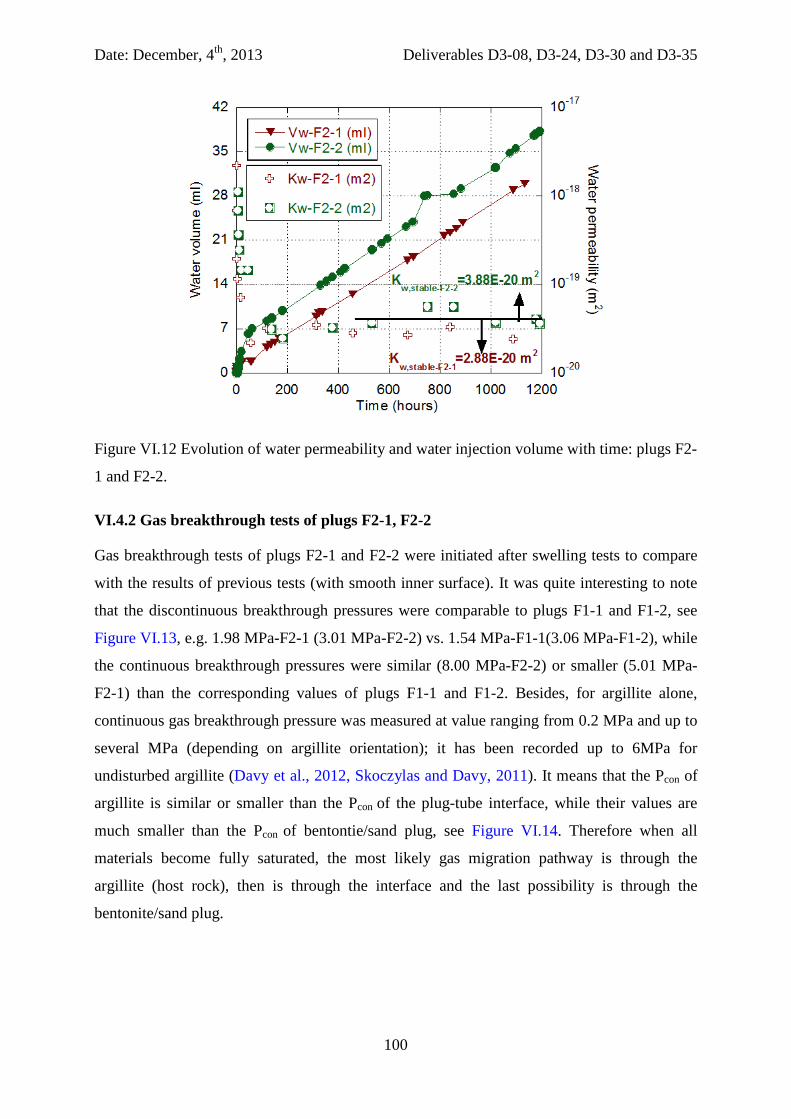
Date: December, 4th, 2013 Deliverables D3-08, D3-24, D3-30 and D3-35
100
Figure VI.12 Evolution of water permeability and water injection volume with time: plugs F2-
1 and F2-2.
VI.4.2 Gas breakthrough tests of plugs F2-1, F2-2
Gas breakthrough tests of plugs F2-1 and F2-2 were initiated after swelling tests to compare
with the results of previous tests (with smooth inner surface). It was quite interesting to note
that the discontinuous breakthrough pressures were comparable to plugs F1-1 and F1-2, see
Figure VI.13, e.g. 1.98 MPa-F2-1 (3.01 MPa-F2-2) vs. 1.54 MPa-F1-1(3.06 MPa-F1-2), while
the continuous breakthrough pressures were similar (8.00 MPa-F2-2) or smaller (5.01 MPa-
F2-1) than the corresponding values of plugs F1-1 and F1-2. Besides, for argillite alone,
continuous gas breakthrough pressure was measured at value ranging from 0.2 MPa and up to
several MPa (depending on argillite orientation); it has been recorded up to 6MPa for
undisturbed argillite (Davy et al., 2012, Skoczylas and Davy, 2011). It means that the Pcon of
argillite is similar or smaller than the Pcon of the plug-tube interface, while their values are
much smaller than the Pcon of bentontie/sand plug, see Figure VI.14. Therefore when all
materials become fully saturated, the most likely gas migration pathway is through the
argillite (host rock), then is through the interface and the last possibility is through the
bentonite/sand plug.
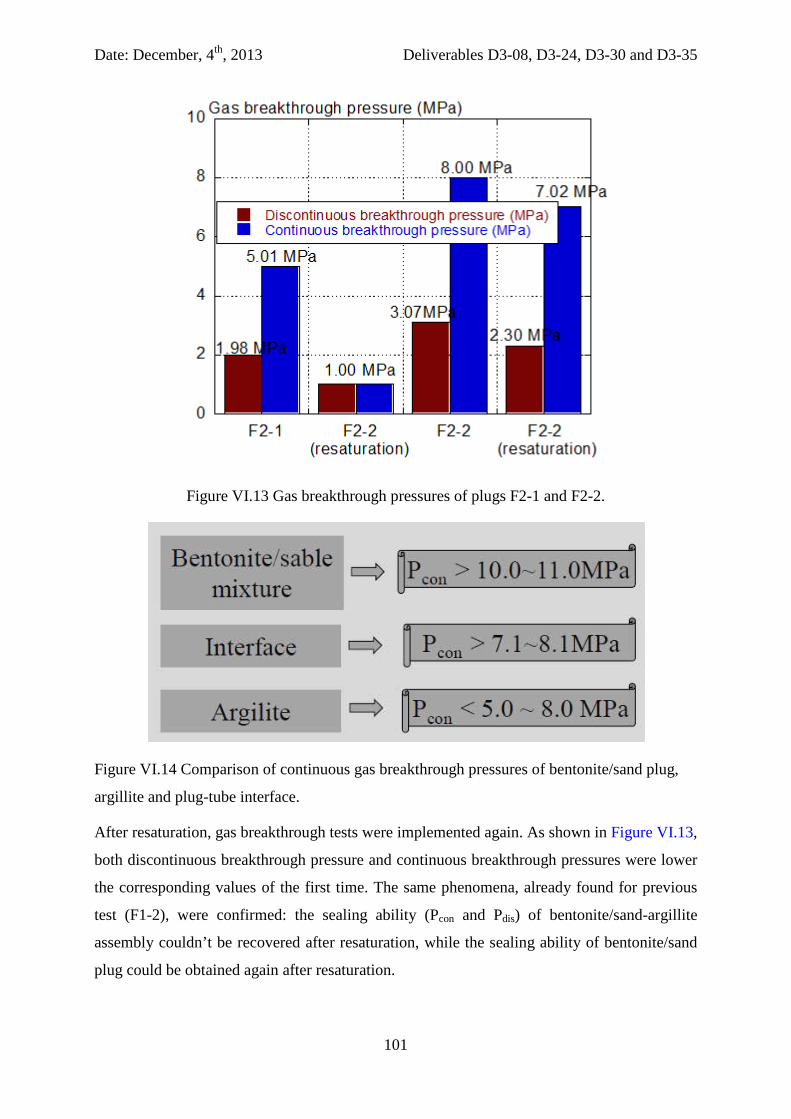
Date: December, 4th, 2013 Deliverables D3-08, D3-24, D3-30 and D3-35
101
Figure VI.13 Gas breakthrough pressures of plugs F2-1 and F2-2.
Figure VI.14 Comparison of continuous gas breakthrough pressures of bentonite/sand plug,
argillite and plug-tube interface.
After resaturation, gas breakthrough tests were implemented again. As shown in Figure VI.13,
both discontinuous breakthrough pressure and continuous breakthrough pressures were lower
the corresponding values of the first time. The same phenomena, already found for previous
test (F1-2), were confirmed: the sealing ability (Pcon and Pdis) of bentonite/sand-argillite
assembly couldn’t be recovered after resaturation, while the sealing ability of bentonite/sand
plug could be obtained again after resaturation.
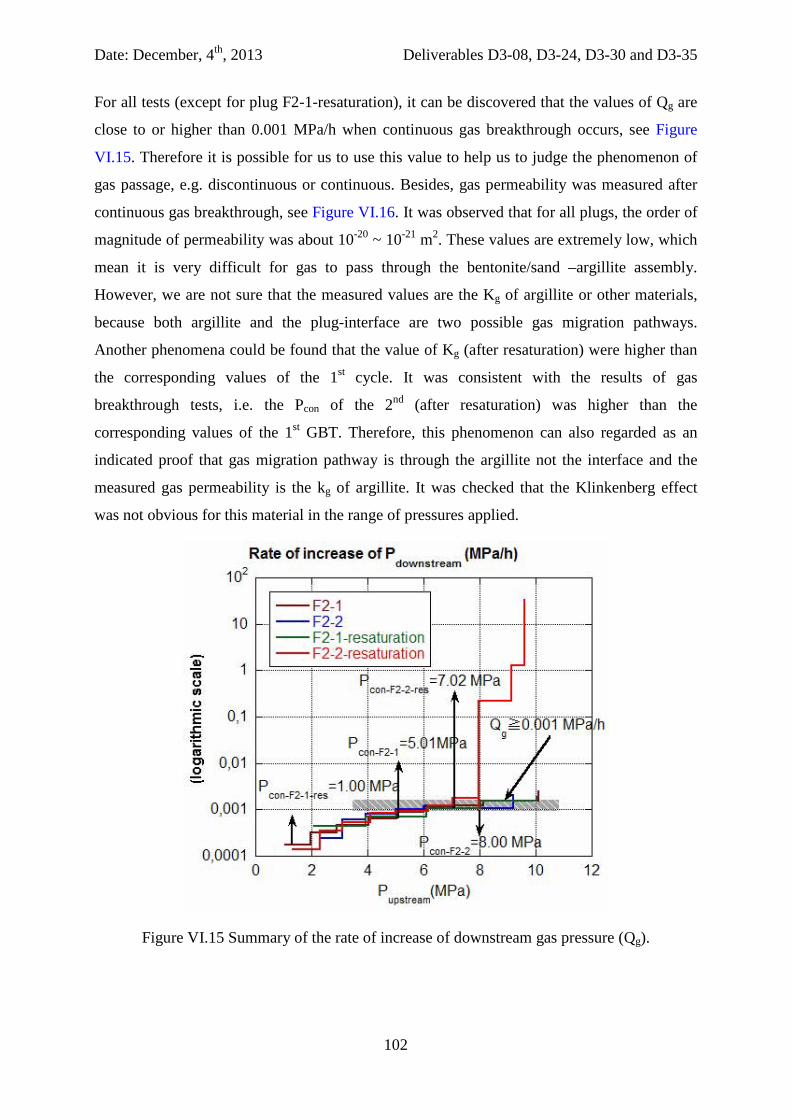
Date: December, 4th, 2013 Deliverables D3-08, D3-24, D3-30 and D3-35
102
For all tests (except for plug F2-1-resaturation), it can be discovered that the values of Qg are
close to or higher than 0.001 MPa/h when continuous gas breakthrough occurs, see Figure
VI.15. Therefore it is possible for us to use this value to help us to judge the phenomenon of
gas passage, e.g. discontinuous or continuous. Besides, gas permeability was measured after
continuous gas breakthrough, see Figure VI.16. It was observed that for all plugs, the order of
magnitude of permeability was about 10-20 ~ 10-21 m2. These values are extremely low, which
mean it is very difficult for gas to pass through the bentonite/sand –argillite assembly.
However, we are not sure that the measured values are the Kg of argillite or other materials,
because both argillite and the plug-interface are two possible gas migration pathways.
Another phenomena could be found that the value of Kg (after resaturation) were higher than
the corresponding values of the 1st cycle. It was consistent with the results of gas
breakthrough tests, i.e. the Pcon of the 2nd (after resaturation) was higher than the
corresponding values of the 1st GBT. Therefore, this phenomenon can also regarded as an
indicated proof that gas migration pathway is through the argillite not the interface and the
measured gas permeability is the kg of argillite. It was checked that the Klinkenberg effect
was not obvious for this material in the range of pressures applied.
Figure VI.15 Summary of the rate of increase of downstream gas pressure (Qg).
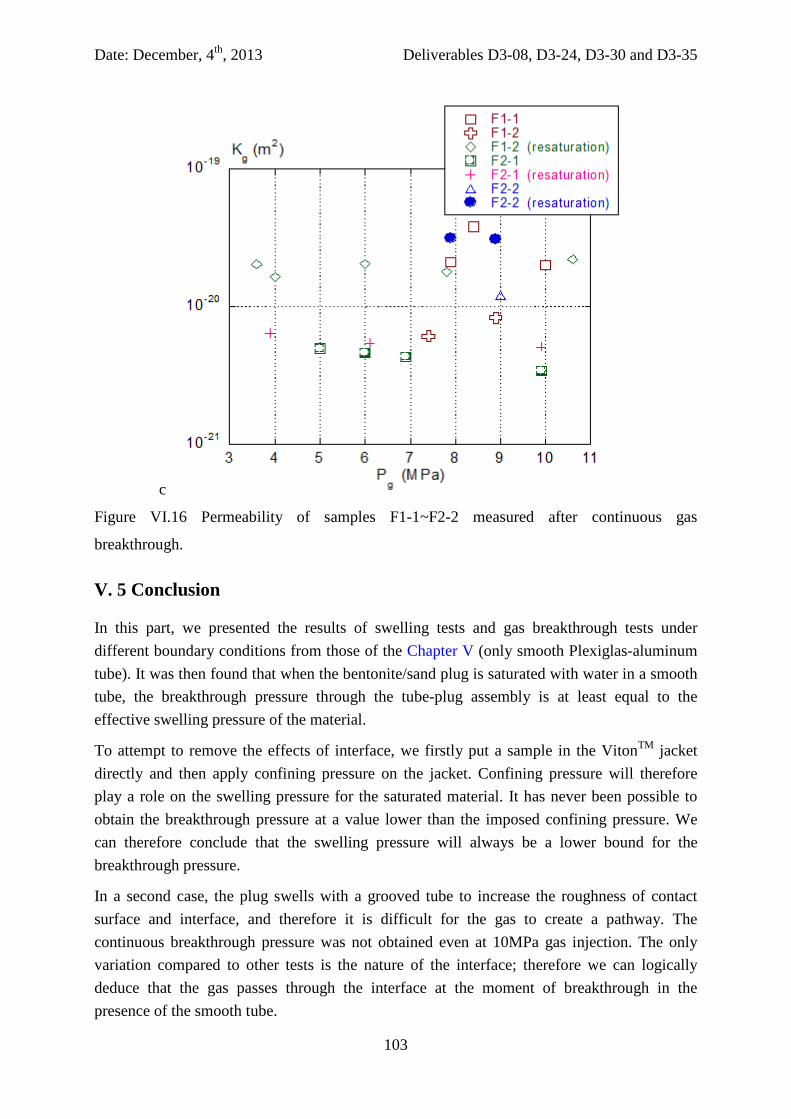
Date: December, 4th, 2013 Deliverables D3-08, D3-24, D3-30 and D3-35
103
c
Figure VI.16 Permeability of samples F1-1~F2-2 measured after continuous gas
breakthrough.
V. 5 Conclusion
In this part, we presented the results of swelling tests and gas breakthrough tests under different boundary conditions from those of the Chapter V (only smooth Plexiglas-aluminum tube). It was then found that when the bentonite/sand plug is saturated with water in a smooth tube, the breakthrough pressure through the tube-plug assembly is at least equal to the effective swelling pressure of the material.
To attempt to remove the effects of interface, we firstly put a sample in the VitonTM jacket directly and then apply confining pressure on the jacket. Confining pressure will therefore play a role on the swelling pressure for the saturated material. It has never been possible to obtain the breakthrough pressure at a value lower than the imposed confining pressure. We can therefore conclude that the swelling pressure will always be a lower bound for the breakthrough pressure.
In a second case, the plug swells with a grooved tube to increase the roughness of contact surface and interface, and therefore it is difficult for the gas to create a pathway. The continuous breakthrough pressure was not obtained even at 10MPa gas injection. The only variation compared to other tests is the nature of the interface; therefore we can logically deduce that the gas passes through the interface at the moment of breakthrough in the presence of the smooth tube.
Date: December, 4th, 2013 Deliverables D3-08, D3-24, D3-30 and D3-35
104
Finally, we perform some tests with an argillite-bentonite/sand plug assembly which is more
close to in situ situation. Our results showed that the fully saturated water permeabilities of
compacted bentonite/sand and argillite were similar: in the order of magnitude of 10-20-10-21
m2. Gas breakthrough tests revealed that continuous gas breakthrough pressure of
bentonite/sand plugs was higher than 10.0~10.9 MPa. Due to the limits of our experimental
device, we didn’t obtain continuous gas breakthrough for bentonite/sand plug when swollen
inside a grooved tube. For argillite, this value was lower, with values consistently smaller
than 5.0~8.0 MPa. For plug-tube interface (smooth inner surface), continuous gas flow was
detected when gas pressure was similar to or higher than the effective swelling pressure
(between 7-8MPa). This means that the interface and the argillite (host rock) are two
preferential pathways for gas migration, and the possibility of gas passage through argillite is
more likely when all clayey materials become fully water saturated.
Date: December, 4th, 2013 Deliverables D3-08, D3-24, D3-30 and D3-35
105
General Conclusion
This research contributes to a better understanding of 1) the sealing ability of partially
saturated bentonite-sand plug under variable confinement, 2) the kinetics and swelling
pressure of plugs in the presence of gas pressure (at least 4 MPa) and in contact with water
(contact direct or via a fully saturated plug) as well as their gas breakthrough pressure, and 3)
the sealing efficiency of argillite-bentonite interface, obtained by accurately measuring
swelling pressure of bentonite/sand mixture and the discontinuous/continuous gas
breakthrough pressure, when this interface is subjected to a non-negligible gas pressure.
Previously, we conducted water retention tests, with different boundary conditions: free
swelling conditions and constant volume conditions. Our work shows that the swelling
speeds of the sample under free swelling conditions are faster than for the samples which
swell under constant volume conditions. In addition, more water is absorbed under free
swelling conditions (compared to constant volume conditions). We also found that at RH =
98%, the swelling is higher with an increase of 22.5% of the initial volume of the plug.
To evaluate the sealing ability of partially saturated bentonite/sand plugs with, we measured
their gas permeability under variable confining pressure (up to 12MPa). We find that the
porous structure accessible to gas and transport of gas are very sensitive to successive drying /
imbibitions cycles, coupled with cycles of confinement / de-confinement. Besides, tightness
to gas (supposedly obtained when the gas permeability is less than 10-20m2) is obtained under
9MPa confinement and for the samples initially saturated at 86-91% only. After stabilization
of the mass at a given RH under conditions of free swelling and given confinement, the
results of gas permeability highlight two antagonistic effects. Firstly, the swelling is
accompanied by an increase of the total volume and the pore volume accessible to the gas, so
as to contribute to increased gas permeability. Moreover, at given sample volume, the
increase in water saturation partially fills the volume of pores, so that the gas permeability
decreases. These antagonistic effects already described in the literature, are observed
simultaneously in the domain of intermediate saturations (50-60%): they allow to interpret
satisfactorily our experiments of gas permeability in partially water-saturated conditions, for
which an increase of the water saturation may lead to an augmentation of the gas permeability,
so the effect of the swelling (and therefore an increase in the pore volume available to gas) is
predominate.
Date: December, 4th, 2013 Deliverables D3-08, D3-24, D3-30 and D3-35
106
In a third part, an experimental campaign is performed to determine the effect of gas pressure
(4, 6 or 8 MPa) on the swelling capacity of bentonite-sand plug, as well as its gas
breakthrough pressure (discontinuous and continuous). In parallel with the presence of water
(favorable for swelling), the presence of 4 MPa gas pressure slightly limits the effective
swelling pressure, but significantly affects the gas breakthrough pressure. For a gas pressure
of 8 MPa, equal to the double of water pressure, a very significant decrease of the effective
swelling pressure of is measured, and the gas passage occurs systematically, regardless of the
pressure employed.
At last, a tube with a grooved inner surface is used to determine whether gas passes through
the interface or through the water-saturated plug: our tests show that gas transfers
preferentially via the interface. When the tube is smooth, gas breakthrough pressure is similar
or slightly higher than the actual swelling pressure for the tests of A1 ~ A3, otherwise (rough
interface), gas passes at a much higher pressure (beyond 10MPa). Our tests also showed that
the absence of scale effect on the swelling pressure and breakthrough pressure, using a sample
A4 twice longer than the others. For argillite, this value was lower, with values consistently
smaller than 5.0~8.0 MPa. For plug-tube interface (smooth inner surface), continuous gas
flow was detected when gas pressure was similar to or higher than the effective swelling
pressure (between 7-8MPa). This means that the interface and the argillite (host rock) are two
preferential pathways for gas migration, and the possibility of gas passage through argillite is
more likely when all clayey materials become fully water saturated.
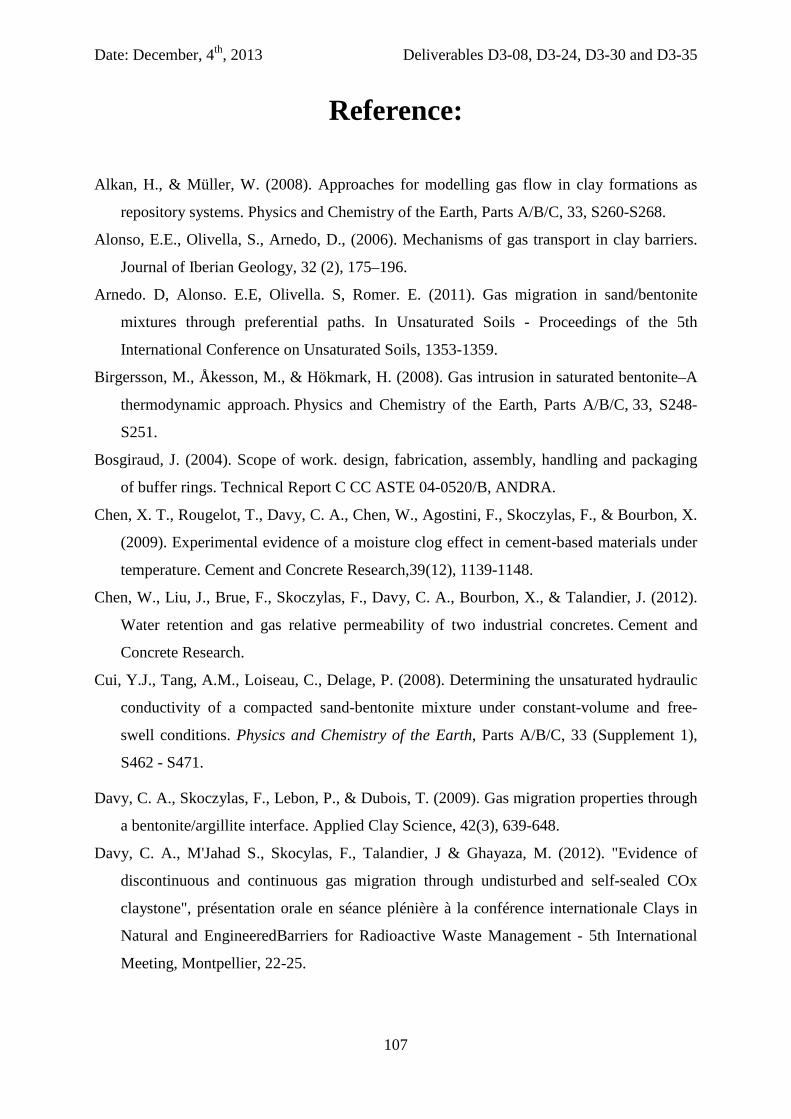
Date: December, 4th, 2013 Deliverables D3-08, D3-24, D3-30 and D3-35
107
Reference:
Alkan, H., & Müller, W. (2008). Approaches for modelling gas flow in clay formations as
repository systems. Physics and Chemistry of the Earth, Parts A/B/C, 33, S260-S268.
Alonso, E.E., Olivella, S., Arnedo, D., (2006). Mechanisms of gas transport in clay barriers.
Journal of Iberian Geology, 32 (2), 175–196.
Arnedo. D, Alonso. E.E, Olivella. S, Romer. E. (2011). Gas migration in sand/bentonite
mixtures through preferential paths. In Unsaturated Soils - Proceedings of the 5th
International Conference on Unsaturated Soils, 1353-1359.
Birgersson, M., Åkesson, M., & Hökmark, H. (2008). Gas intrusion in saturated bentonite–A
thermodynamic approach. Physics and Chemistry of the Earth, Parts A/B/C, 33, S248-
S251.
Bosgiraud, J. (2004). Scope of work. design, fabrication, assembly, handling and packaging
of buffer rings. Technical Report C CC ASTE 04-0520/B, ANDRA.
Chen, X. T., Rougelot, T., Davy, C. A., Chen, W., Agostini, F., Skoczylas, F., & Bourbon, X.
(2009). Experimental evidence of a moisture clog effect in cement-based materials under
temperature. Cement and Concrete Research,39(12), 1139-1148.
Chen, W., Liu, J., Brue, F., Skoczylas, F., Davy, C. A., Bourbon, X., & Talandier, J. (2012).
Water retention and gas relative permeability of two industrial concretes. Cement and
Concrete Research.
Cui, Y.J., Tang, A.M., Loiseau, C., Delage, P. (2008). Determining the unsaturated hydraulic
conductivity of a compacted sand-bentonite mixture under constant-volume and free-
swell conditions. Physics and Chemistry of the Earth, Parts A/B/C, 33 (Supplement 1),
S462 - S471.
Davy, C. A., Skoczylas, F., Lebon, P., & Dubois, T. (2009). Gas migration properties through
a bentonite/argillite interface. Applied Clay Science, 42(3), 639-648.
Davy, C. A., M'Jahad S., Skocylas, F., Talandier, J & Ghayaza, M. (2012). "Evidence of
discontinuous and continuous gas migration through undisturbed and self-sealed COx
claystone", présentation orale en séance plénière à la conférence internationale Clays in
Natural and EngineeredBarriers for Radioactive Waste Management - 5th International
Meeting, Montpellier, 22-25.
Date: December, 4th, 2013 Deliverables D3-08, D3-24, D3-30 and D3-35
108
Egermann, P., Lombard, J. M., & Bretonnier, P. (2006). A fast and accurate method to
measure threshold capillary pressure of caprocks under representative
conditions. SCA2006 A, 46.
Gatabin, C. (2005). Selection and THM characterization of the buffer material. Technical
Report RT DPC/SCCME 05-704-B, ANDRA.
Hildenbrand, A., S. Schlömer, & B. Krooss. (2002). Gas breakthrough experiments on fine-
grained sedimentary rocks. Geofluids 2, 3-23.
Horseman, S.T; Harrington, J.F; Sellin, P. (1999). Gas migration in clay barriers. Engineering
Geology, 54:139-149.
Ishimori, H., and Katsumi, T. (2012). Temperature effects on the swelling capacity and
barrier performance of geosynthetic clay liners permeated with sodium chloride
solutions. Geotextiles and Geomembranes, 33, 25-33.
Kaufhold, S., Pohlmann-Lortz, M., Dohrmann, R., & Nüesch, R. (2007). About the possible
upgrade of bentonite with respect to iodide retention capacity. Applied clay science, 35(1),
39-46.
King, F., Ahonen, L., Taxén, C., Vuorinen, U., & Werme, L. (2001). Copper corrosion under
expected conditions in a deep geologic repository (Vol. 1). Svensk Kärnbränslehantering
AB.
King, F., Ahonen, L., Taxén, C., Vuorinen, U., and Werme, L. (2010). Copper corrosion
under expected conditions in a deep geologic repository. Technical Report SKB TR-01-
23, SKB AB.
Komine, H. (2004). Simplified evaluation for swelling characteristics of bentonites.
Engineering Geology, 71(3), 265-279.
Liu, J. (2011). Etude expérimentale de la perméabilité relative des matériaux cimentaires et
simulation numérique du transfert d’eau du béton, Thèse de doctorat, Ecole Centrale de
Lille.
Liu, J.F., Duan, Z.B., Davy, C. A., Skoczylas, F. (2013). "Sealing ability of partially water-
saturated bentonite/sand plugs", under revision for Engineering Geology.
M’Jahad S. (2012). Impact de la fissuration sur les propriétés de rétention d`eau et de
transport des géométraux. Application au stockage profond des dechets radioactifs. PhD
thesis, (in French), Ecole Centrale de Lille, France.
Montes-H, G., Geraud, Y., Duplay, J., & Reuschle, T. (2005). ESEM observations of
compacted bentonite submitted to hydration/dehydration conditions. Colloids and
Surfaces A: Physicochemical and Engineering Aspects, 262(1), 14-22.
Date: December, 4th, 2013 Deliverables D3-08, D3-24, D3-30 and D3-35
109
Popp, T., Salzer, K. & Rölke, C. (2013). Role of Interfaces in Bentonite-Block Assemblies as
Favoured Pathways for Gas Transport. International Symposium and workshop on Gas
generation and migration: Implications for the performance of geological repositories for
radioactive waste disposal, FORGE EU project Dissemination Symposium, Luxemburg.
Rossen, W. R. (2000). Snap-off in constricted tubes and porous media.Colloids and Surfaces
A: Physicochemical and Engineering Aspects, 166(1), 101-107.
Skoczylas, F., Davy, C.A. (2011). Measurement of gas entry pressure. Technical Report
FORGE Report: D3.13, Euratom 7th Framework project: FORGE.
Thomas, L. K., Katz, D. L., & Tek, M. R. (1968). Threshold pressure phenomena in porous
media. Old SPE Journal, 8(2), 174-184.
Xie, M., Agus, S. S., Schanz, T., & Kolditz, O. (2004). An upscaling method and a numerical
analysis of swelling/shrinking processes in a compacted bentonite/sand
mixture. International journal for numerical and analytical methods in
geomechanics, 28(15), 1479-1502.
Ye, W. M., Wan, M., Chen, B., Chen, Y. G., Cui, Y. J., & Wang, J. (2012). Temperature
effects on the unsaturated permeability of the densely compacted GMZ01 bentonite under
confined conditions. Engineering Geology, 126, 1-7.
Villar, M.V., & Lloret, A. (2007). Dismantling of the first section of the FEBEX in situ test:
THM laboratory tests on the bentonite blocks retrieved. Physics and Chemistry of the
Earth, Parts A/B/C, 32(8), 716-729.
Villar, M.V., & Lloret, A. (2004). Influence of temperature on the hydro-mechanical
behaviour of a compacted bentonite. Applied Clay Science, 26(1), 337-350.
Villar, M.V., García-Siñeriz, J. L., Bárcena, I., & Lloret, A. (2005). State of the bentonite
barrier after five years operation of an in situ test simulating a high level radioactive
waste repository. Engineering Geology, 80(3), 175-198.
Wang, Q., Tang, A. M., Cui, Y. J., Delage, P., & Gatmiri, B. (2012). Experimental study on
the swelling behaviour of bentonite/claystone mixture.Engineering Geology, 124, 59-66.
Date: December, 4th, 2013 Deliverables D3-08, D3-24, D3-30 and D3-35
110
Annex 1
(a) Volume changes of bentonite/sand plugs for test series S2
Figure A.1 volume change of samples S2-3, S2-4, S2-5 and S2-8 of test series 2, showing the limited changes due to the initial gas permeability testing phase (up to 5MPa confinement).
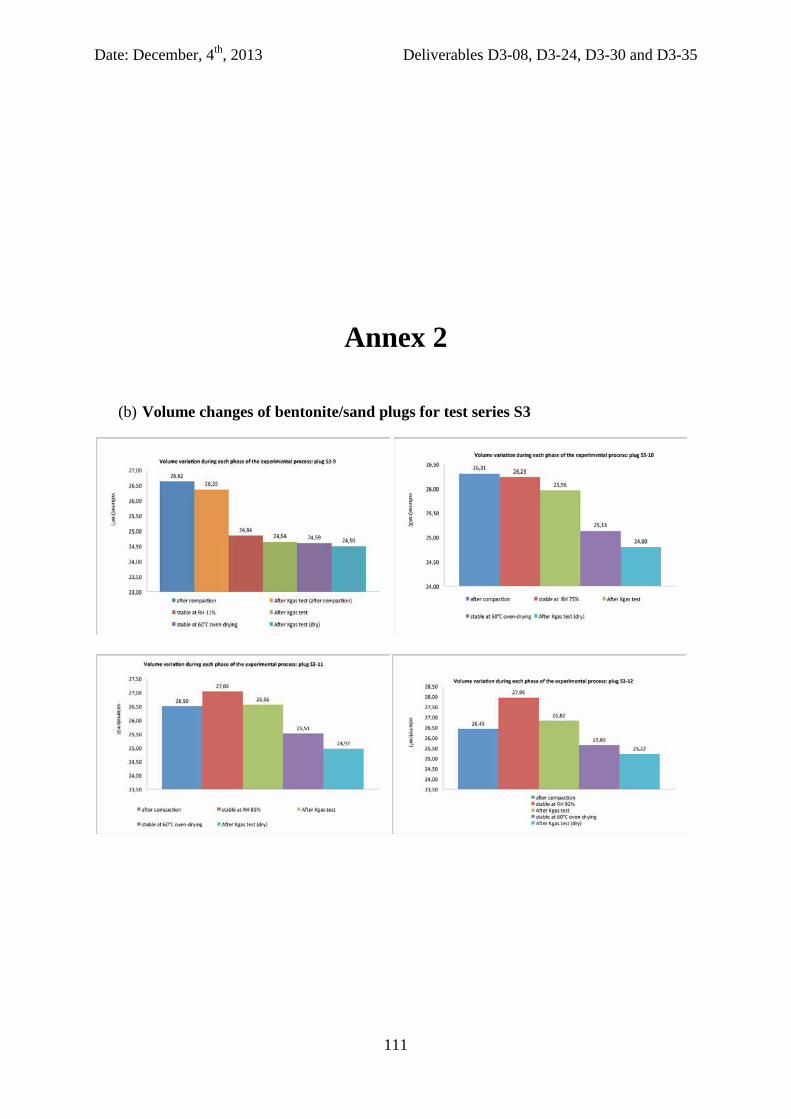
Date: December, 4th, 2013 Deliverables D3-08, D3-24, D3-30 and D3-35
111
Annex 2
(b) Volume changes of bentonite/sand plugs for test series S3
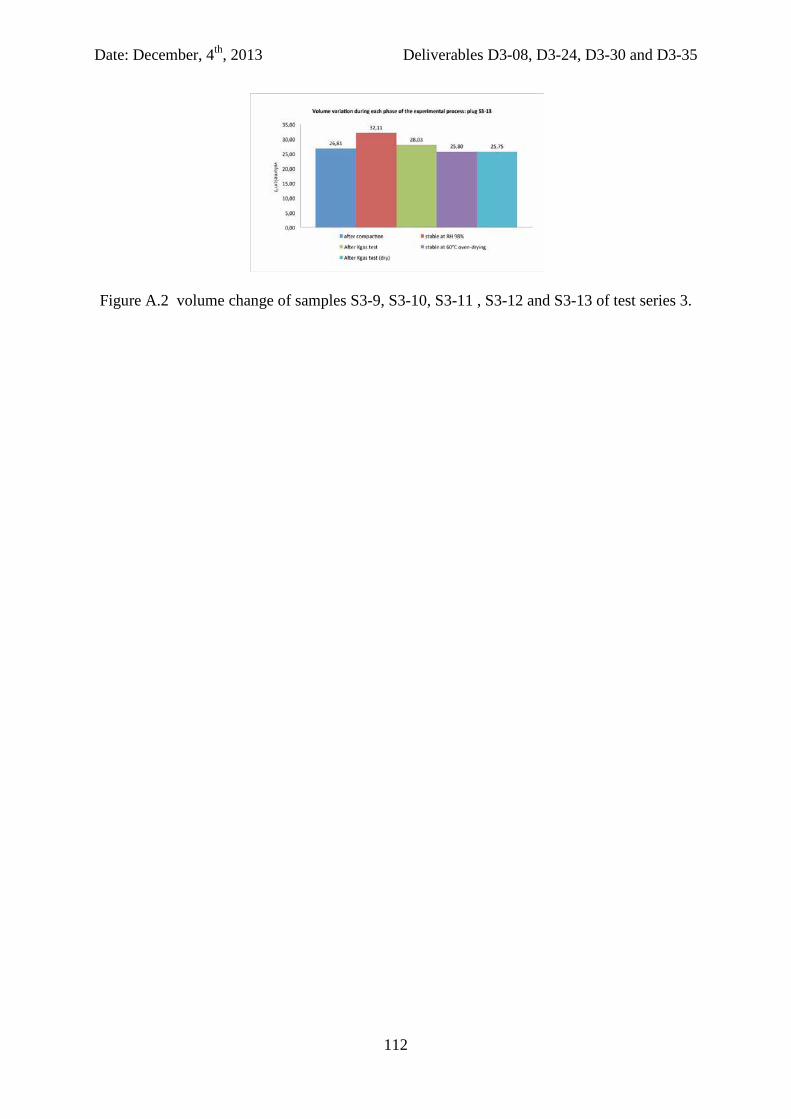
Date: December, 4th, 2013 Deliverables D3-08, D3-24, D3-30 and D3-35
112
Figure A.2 volume change of samples S3-9, S3-10, S3-11 , S3-12 and S3-13 of test series 3.