berwick-upon-tweed parking study - northumberland€¦ · berwick-upon-tweed parking study 5...
TRANSCRIPT

September 2017
Berwick-upon-TweedParking Study

Prepared by: ........................................................... Checked by: .............................................................Garry Dawson Paul KirkPrincipal Engineer Senior Consultant
Approved by: ...........................................................Nick WebsterAssociate Director
Berwick-upon-Tweed Parking StudyRev No Comments Checked by Approved
byDate
1 Draft for NCC Review 17/09/172 For internal check 25/10/173 Final PK NW 30/10/174 Revised following further NCC Comments PK NW 06/12/17
First Floor, One Trinity Gardens, Quayside, Newcastle upon Tyne, NE1 2HFTelephone: 0191 224 6500 Website: http://www.aecom.com
Job No: 60539334 Reference: TRA_RT_001 Date Created: August 2017
This document is confidential and the copyright of AECOM Limited. Any unauthorised reproduction or usage by anyperson other than the addressee is strictly prohibited.

AECOMBerwick-upon-Tweed Parking Study
CONTENTS
1 Introduction 11.1 Background 1
1.2 The Brief 1
1.3 Report Structure 2
2 Review of the Study Area 42.1 Description of Study Area 4
2.2 Parking 4
2.3 Pedestrian Routes 18
2.4 Cycle Routes 19
2.5 Bus Routes 19
3 Policy Review 223.1 National Parking Policy 22
3.2 Local Policy 23
4 Consultations 264.2 Northumberland County Council’s Core Strategy Team Consultation 26
4.3 Arch Consultation 27
4.4 Local Businesses & Schools Consultations 27
4.5 Northumberland County Council’s Parking Enforcement Team Consultation 30
4.6 Berwick-upon-Tweed Town Council and Local Councillors Consultation 31
5 Existing Parking Situation 345.1 Introduction 34
5.2 Analysis 34
5.3 Overall Situation for Mixed Parking Areas 43
6 Future Parking Situation 466.1 Introduction 46
6.2 Proposed Developments 46
6.3 Traffic Growth 47
6.4 Overall Impact 48
7 Recommendations 527.2 Town Centre Core Parking Provision 52
7.3 Parking Restrictions 58
7.4 Streets Outside Town Centre Core Parking Area 59

AECOMBerwick-upon-Tweed Parking Study
7.5 Coach Parking 59
7.6 Disabled Parking Spaces 61
7.7 Electric Vehicle Charging Spaces 61
7.8 Car Parks Condition 61
7.9 Signing to Parking Areas 61
7.10 Pedestrian Routes 61
Figures 63

AECOMBerwick-upon-Tweed Parking Study
FIGURESFigure 1 – Study Area
Figure 2 – Existing Parking Capacity & Restrictions
Figure 3 – Sub-Area Boundaries
Figure 4 – Existing Signing Layout
Figure 5 – Bus Routes
Figure 6 – Maximum Parking Occupancy – March Surveys - Wednesday
Figure 7 – Maximum Parking Occupancy – March Surveys - Thursday
Figure 8 – Maximum Parking Occupancy – March Surveys - Saturday
Figure 9 – Maximum Parking Occupancy – July Surveys - Wednesday
Figure 10 – Maximum Parking Occupancy – July Surveys - Thursday
Figure 11 – Maximum Parking Occupancy – July Surveys - Saturday
Figure 12 – Potential Additional Parking Provision Sites
Figure 13 – Potential Park and Ride Sites
Figure 14 – Streets Over Capacity or Over 85% Threshold – Existing Situation
Figure 15 – Streets Over Capacity or Over 85% Threshold – 2020
Figure 16 – Streets Over Capacity or Over 85% Threshold – 2030

AECOMBerwick-upon-Tweed Parking Study
APPENDICESAppendix A – Existing Parking Capacity Schedule
Appendix B – Existing Parking Situation Analysis
Appendix C – Parking Occupancy Analysis Data

01
Introduction

AECOMBerwick-upon-Tweed Parking Study
1
1 Introduction
1.1 Background1.1.1 Northumberland County Council (NCC) appointed AECOM to carry out a parking study of the central area of
Berwick-upon-Tweed to both assess the current situation and investigate the likely long term strategic parkingissues that may arise.
1.1.2 Any long term parking strategy for Berwick-upon-Tweed needs to consider:
· Any current development proposals.
· The aspirations of the County Council’s Core Strategy.
· The potential loss of the overflow area of Castlegate car park which only has temporary planningconsent.
1.1.3 The study area is shown in Figure 1. All figures are contained in the figures section which commences onpage 63 of this document.
1.2 The Brief1.2.1 The brief for the study had the following specific requirements:-
Establish the existing parking provision and demand.
· The study shall include all existing off street car parks, both public and private, available to the generalpublic. Private car parks to be included will be those available to the general public such as atsupermarkets. Private car parks not to be included will be staff/visitor only car parks at smallbusinesses, care homes, schools etc, not available to the general public and where any nonstaff/visitor parking would easily be identified.
· The study shall also include all on street parking within the study area.
· Parking surveys shall be conducted on a neutral weekday, a Wednesday which is Market Day and aSaturday both in March, outside school holiday time, and in July after the Scottish school holidayshave begun, to assess the impact of tourists and caravan visitors.
· Local businesses shall be consulted with regards to their current staff parking behaviours.
· Meetings shall be held with NCC officers regarding the Core Strategy, with Arch regarding potentialfuture regeneration proposals and with NCC Civil Enforcement Officers to gain their views on parkingissues within the study area.
Establish future parking demand
· Consideration shall be given to the long term impact of the proposed developments on parkingdemand levels.
· Two future year scenarios shall be examined – 2020 and 2030
Make recommendations as to the future parking strategy, potentially including -
· Additional off-street parking provision in terms of numbers and options for locations;
· Changes to on-street parking restrictions and bay locations;
· Changes to permitted stay durations in both off-street and on-street locations;
· Any changes to off-street car parks,

AECOMBerwick-upon-Tweed Parking Study
2
· Changes to the number and locations of disabled parking bays, electric vehicle charging bays andcoach parking;
· Consideration of walking routes and accessibility of proposed parking to key locations within the towncentre;
· Changes to directional signing to parking places.
· Recommendations regarding the future operation of the railway station car parks, both existing andproposed.
· Potential for Park & Ride sites to be provided on the Tweedmouth side of the river.
Provide high level cost estimates of any recommended infrastructure proposals
1.3 Report Structure1.3.1 In addition to this introduction, the following Chapters are presented within this report.
§ Chapter 2 – Review of the Study Area – Contains an overview of the study area including the mainroads, pedestrian and cycle facilities and bus routes as well as a thorough review of existing parkingprovision.
§ Chapter 3 – Policy Review – Details a review of national and local policy relevant to the study.
§ Chapter 4 – Consultations – Summarises the consultations carried out as part of the study.
§ Chapter 5 – Existing Parking Situation – Describes the analysis and results of the parkingoccupancy surveys.
§ Chapter 6 – Future Parking Situation – Contains a review of the proposed developments within thestudy area and the likely impact on the future parking situation of these developments, the Council’sCore Strategy and general growth in vehicular traffic.
§ Chapter 7 – Recommendations – Details the recommendations from the study.

02
Review of the StudyArea

AECOMBerwick-upon-Tweed Parking Study
4
2 Review of the Study Area2.1 Description of Study Area
2.1.1 The study area is shown in Figure 1. It includes the town centre and adjacent residential areas bounded by theholiday park to the north, the railway line to the west, the town walls to the east and the river to the west andsouth. Additionally it includes the housing area to the northwest of the town centre, beyond the railway line, asfar as Castle Drive. It also includes a residential/retail area to the west of the river between the river andPrince Edward Road / Main Street. This area stretches from Blakewell Gardens in the north to Mount Road inthe south.
2.1.2 The main traffic route through the study area is the A1167 which connects with the A1 at roundabouts to thesouth and north of Berwick. As the A1167 runs south to north through the study area it consists of Main Street,Prince Edward Road, Royal Tweed Bridge, Golden Square, Marygate, Castlegate and North Road.
2.1.3 The other main routes into the study area consist of the B6354 which joins the A1167 at the southern end ofthe study area and connects with the A1 at a priority junction, the A698 which joins the A1167 on the westernside of the study area and connects to a roundabout on the A1 and the A6105 which joins the A1167 in thenorthwest of the study area and connects to a priority junction on the A1.
2.1.4 The main retail area within the town is centred around Castlegate, Hide Hill, Bridge Street, West Street and, inparticular, Marygate.
2.1.5 Berwick’s train station is on the east coast mainline and situated on the western boundary of the study area.Berwick does not have a bus station.
2.2 Parking2.2.1 A full review of existing parking provision and restrictions within the study area was carried out by AECOM
staff. Initially car park locations were established using Northumberland County Council’s website andParkopedia website but then the study area was fully surveyed by AECOM staff to identify any additional carparks and to obtain further details of car park space types and restrictions. Brief details were also notedregarding the general condition of car parks and their facilities. A review of existing signing to car parks wasalso carried out.
2.2.2 All streets within the study area were surveyed by AECOM staff to obtain full details of on street parkingavailability and restrictions and details of any adjacent off-street parking areas. Capacity estimates weremainly established on site during the site visits but longer lengths were estimated in the office throughmeasuring available parking lengths on electronic mapping. Over lengths of parallel parking, capacity wasgenerally determined allowing a length of 5.7m per vehicle. Over lengths of parking at right angles to theadjacent carriageway, capacity was generally determined allowing a width of 2.4m. These are measurementsthat are commonly used when assessing parking capacity. Where individual bays were marked the bays weresimply counted to determine capacity.
2.2.3 There is an element of subjectivity in assessing the capacity of on-street parking and adjacent parking areas,for example in judging whether a road is wide enough to allow parking on both sides and whether to include onstreet space that would block driveways or garage access. Owners will sometimes park in front of their owngarages or driveway and this parking will be picked up in the demand surveys. However within the study areathe majority of the driveway and garage accesses occur on relatively narrow roads where on-street parkingwould form an obstruction or in areas of plentiful parking where obstructing driveways would not be necessary,therefore areas in front of driveways or garage accesses have not generally been included within on-streetparking capacity assessments. The capacity of irregular shaped parking areas without marked bays can alsobe subjective and can be dependent on the way people park.
2.2.4 The results of the parking provision review are described in the following sections.

AECOMBerwick-upon-Tweed Parking Study
5
Capacity2.2.5 All available parking of the types identified within the study brief, and all on street parking restrictions, within
the study area are shown in Figure 2. The total four-wheel vehicle parking capacity in the study area andwithin each individual parking area is shown in the table below.
2.2.6 Car parks have been divided into two groups, public car parks operated by Northumberland County Counciland private car parks in public use/use specific car parks. This last group includes the customer car parks oflarger businesses and car parks at facilities such as medical centres.
2.2.7 On-street parking and adjacent parking areas have been broken down into 11 groups, major roads whereparking is unlikely or forbidden, major roads where parking is allowed, and 9 sub-area groups. The areacovered by each sub-area group is shown in Figure 3. Each group is then broken down into individual streets,or sections of street for longer streets.
2.2.8 A breakdown giving full details of parking space types within each car park and street is given in Appendix A.
Name VehicularSpaces
Public Car Parks - NCCBerwick Railway Station Short Stay 10Berwick Railway Station Long Stay 116Bridge Street 48Eastern Lane 55Castlegate Short Stay 105Castlegate Long Stay 72Castlegate Overflow 141Waugh Place 12Woolmarket 6Coxons Lane 55Foul Ford 30Parade 78Quayside 128Sub-Total 856
Private Car Parks in Public Use / Use Specific Car ParksAsda 147Berwick Infirmary – Maternity Unit 26Berwick Infirmary – Mather Unit 12Berwick Infirmary – Infirmary Unit 26Berwick Infirmary – Minor Injuries Unit 12Sub-Total 223
On-Street Parking & Adjacent Parking AreasMajor Roads Where Parking is Unlikely / ForbiddenCastlegate (Castle Terrace to High Greens) 0Royal Tweed Bridge 0Berwick Bridge 0Golden Square 0Main Street (Prince Edward Road to Church Road) 0Sub-Total 0

AECOMBerwick-upon-Tweed Parking Study
6
Major Roads Where Parking is AllowedCastlegate (High Greens to Marygate) 74Marygate 28Prince Edward Road 14Main Street (West End to Prince Edward Road) 59Main Street (Church Road to Mount Road) 16Sub-Total 191
NorthwestCastle Drive 94Castle Terrace 32Windsor Crescent 48North Road 37Sub-Total 211
NorthNorthumberland Avenue 40Warkworth Terrace 28Percy Terrace 10Lovaine Terrace 20Back alleys between Warkworth Terrace and Lovaine Terrace 19Sub-Total 117
CentralHigh Greens 18Low Greens 76Back Alley from Low Greens to Lord's Mount 0Violet Terrace 8Bell Tower Place 0Bell Tower Park 24Lords Mount 15Castlegate Court 35Brucegate 21Well Close Square 22Ivy Place 0Scott’s Place 0Sub-Total 219
StationRailway Street 0Tweed Street 14Sub-Total 14
East 1Walkergate 5Hatters Lane 3Coxons Lane 6Wallace Green 66Chapel Street 8Crawford's Alley 0Church Street 31Parade 12

AECOMBerwick-upon-Tweed Parking Study
7
Ravensdowne 54Woolmarket 7Sub-Total 192
East 2Bank Hill 1West Street 0Easter Wynd 0Eastern Lane 7Love Lane 0Bridge Terrace 5Bridge End 0Bridge Street 0Drivers Lane 0Dewar’s Lane 1Sub-Total 14
East 3Hide Hill 42Sandgate 25Silver Street 0Ness Street 8Weddell's Lane 0Foul Ford 0Oil Mill Lane 2Palace Street 48Palace Green 28Palace Street East 18The Avenue 3Sub-Total 174
West 1Blakewell Gardens 30Riverside Road 33Bower's Crescent 16Blakewell Road 32West End to west of southern junction with Blakewell Road & WestEnd Parking Area
42
West End to south of southern junction with Blakewell Road 31Sub-Total 184
West 2Union Brae 0Kiln Hill 32Dock Road 117Mill Strand 20Brewery Lane 9Brewery Bank 9Church Road 46Well Square 16Lee's Lane 3Tower Road 16
AECOMBerwick-upon-Tweed Parking Study
8
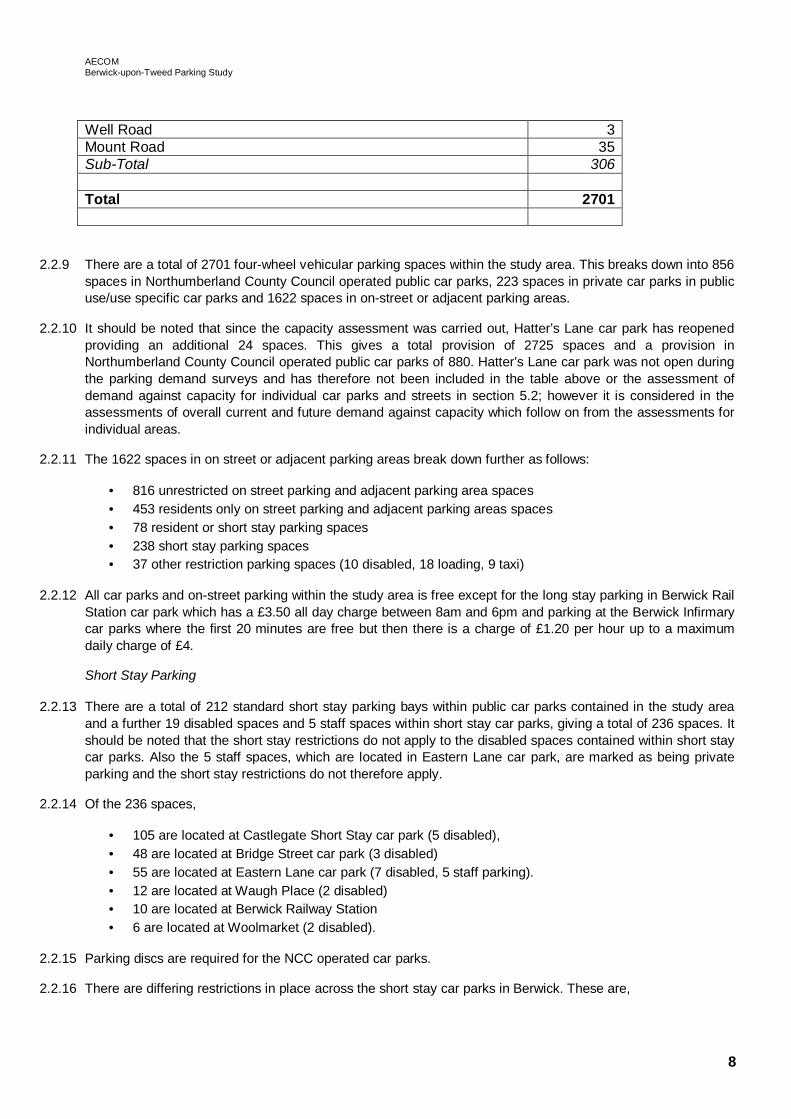
Well Road 3Mount Road 35Sub-Total 306
Total 2701
2.2.9 There are a total of 2701 four-wheel vehicular parking spaces within the study area. This breaks down into 856spaces in Northumberland County Council operated public car parks, 223 spaces in private car parks in publicuse/use specific car parks and 1622 spaces in on-street or adjacent parking areas.
2.2.10 It should be noted that since the capacity assessment was carried out, Hatter’s Lane car park has reopenedproviding an additional 24 spaces. This gives a total provision of 2725 spaces and a provision inNorthumberland County Council operated public car parks of 880. Hatter’s Lane car park was not open duringthe parking demand surveys and has therefore not been included in the table above or the assessment ofdemand against capacity for individual car parks and streets in section 5.2; however it is considered in theassessments of overall current and future demand against capacity which follow on from the assessments forindividual areas.
2.2.11 The 1622 spaces in on street or adjacent parking areas break down further as follows:
· 816 unrestricted on street parking and adjacent parking area spaces· 453 residents only on street parking and adjacent parking areas spaces· 78 resident or short stay parking spaces· 238 short stay parking spaces· 37 other restriction parking spaces (10 disabled, 18 loading, 9 taxi)
2.2.12 All car parks and on-street parking within the study area is free except for the long stay parking in Berwick RailStation car park which has a £3.50 all day charge between 8am and 6pm and parking at the Berwick Infirmarycar parks where the first 20 minutes are free but then there is a charge of £1.20 per hour up to a maximumdaily charge of £4.
Short Stay Parking
2.2.13 There are a total of 212 standard short stay parking bays within public car parks contained in the study areaand a further 19 disabled spaces and 5 staff spaces within short stay car parks, giving a total of 236 spaces. Itshould be noted that the short stay restrictions do not apply to the disabled spaces contained within short staycar parks. Also the 5 staff spaces, which are located in Eastern Lane car park, are marked as being privateparking and the short stay restrictions do not therefore apply.
2.2.14 Of the 236 spaces,
· 105 are located at Castlegate Short Stay car park (5 disabled),· 48 are located at Bridge Street car park (3 disabled)· 55 are located at Eastern Lane car park (7 disabled, 5 staff parking).· 12 are located at Waugh Place (2 disabled)· 10 are located at Berwick Railway Station· 6 are located at Woolmarket (2 disabled).
2.2.15 Parking discs are required for the NCC operated car parks.
2.2.16 There are differing restrictions in place across the short stay car parks in Berwick. These are,

AECOMBerwick-upon-Tweed Parking Study
9
· a maximum stay of 3 hours (no return within 4 hours) at Castlegate Short Stay, Woolmarket andWaugh Place;
· a maximum stay of 2 hours (no return within 3 hours) at Eastern Lane and Bridge Street car parks;· a maximum stay of 20 minutes (no return within 1 hour) at Berwick Railway Station
2.2.17 In addition there is a maximum stay duration of 2 hours on the private car park at Asda. This applies to all 147spaces which includes 6 disabled spaces and 5 parent and child spaces.
There are a number of on street short stay parking bays in Berwick and these total 238 spaces. There are,
· 62 on Wallace Green,· 8 on Chapel Street,· 18 on Church Street,· 7 on Woolmarket,· 42 on Hide Hill,· 25 on Sandgate,· 20 on Well Close Square,· 25 on Main Street,· 31 on Castlegate.
2.2.18 Parking discs are required for some but not all of the on-street short stay parking areas.
2.2.19 As with the short stay car parks there are several different stay restrictions in place affecting these on-streetparking bays as follows:
· Woolmarket and Wallace Green have a maximum stay of 3 hours (no return in 4),· Church Street and Sandgate have a maximum stay of 2 hours (no return in 3),· Hide Hill and Chapel Street have a maximum stay of 1 hour (no return in 2),· Main Street and Well Close Square have a maximum stay of 1 hour (no return in 1)· Castlegate has two restrictions in place on the road, at the south end opposite Scott’s Place the stay
restriction is 30 minutes (no return in 1 hour) further up the road the restriction is a stay of 1 hour (noreturn in 1 hour).
2.2.20 In addition to the on-street short stay parking bays there are a number of bays that are for short stays orresident parking; these total 78 spaces. There are,
· 28 spaces on Castlegate,· 15 spaces on Main Street,· 13 spaces on Castle Terrace,· 7 spaces on Blakewell Road,· 10 spaces on West End.· 5 spaces on Brucegate
2.2.21 The restrictions in place are as follows:
· Castlegate has a 1 hour maximum stay restriction (no return within 1 hours),· Main Street, Blakewell Road, West End and Brucegate have a 2 hour maximum stay restriction (no
return within 1 hour),· Castle Terrace has a 3 hour maximum stay restriction (no return within 1 hour).

AECOMBerwick-upon-Tweed Parking Study
10
Disabled Parking Bays
2.2.22 There are a total of 55 disabled parking bays within the study area. Most of these are located inNorthumberland County Council operated public car parks with the exceptions being 6 disabled bays locatedin the Asda car park, 6 located in the Berwick Infirmary car parks, 3 bays on Riverside Road, 6 located onMarygate and 1 located on Palace Street.
Electric Vehicle Charging Bays
2.2.23 There is only one electric vehicle charging bay within the study area and this is located at the BerwickInfirmary Maternity Unit car park.
Parent & Child Parking Bays
2.2.24 There are 5 parent and child parking bays within the study area all of which are in the Asda car park.
Loading Bays
2.2.25 The only loading bays in the study area are located along Marygate to the east of the junction with GoldenSquare. A number of bays of varying length are marked here with a total capacity adequate to allow parking byapproximately 18 car length vehicles.
Taxi Bays
2.2.26 There are a total of 9 taxi bays within the study area. They are spread across two locations with 5 onWalkergate and 4 on Marygate.
Resident Parking Areas
2.2.27 There are 29 residential parking areas within the study area with a total parking capacity of approximately 453spaces. The residential parking areas are as follows:
· Bell Tower Park with space for approximately 24 cars· Bridge Terrace with space for approximately 5 cars· Brucegate with space for approximately 13 cars· Castlegate Court with space for approximately 35 cars· Castlegate with space for approximately 7 cars· Church Street with space for approximately 13 cars· Coxons Lane with space for approximately 6 cars· Eastern Lane with space for approximately 7 cars· Hatters Lane with space for approximately 3 cars· High Greens with space for approximately 18 cars· Lovaine Terrace with space for approximately 20 cars· Low Greens with space for approximately 52 cars· Main Street with space for approximately 7 cars· Ness Street with space for approximately 6 cars· Northumberland Avenue with space for approximately 15 cars· Oil Mill Lane with space for approximately 2 cars· Palace Green with space for approximately 28 cars· Palace Street East with space for approximately 18 cars· Palace Street with space for approximately 47 cars· Parade with space for approximately 12 cars· Percy Terrace with space for approximately 10 cars· Ravensdowne with space for approximately 54 cars

AECOMBerwick-upon-Tweed Parking Study
11
· The Avenue with space for approximately 3 cars· Tweed Street with space for approximately 14 cars· Wallace Green with space for approximately 4 cars· Warkworth Terrace with space for approximately 28 cars· Well Close Square with space for approximately 2 cars
2.2.28 In addition to these areas, as described in the short stay parking section above, there are a number of onstreet bays marked for resident or short stay parking; these total 78 spaces. There are 28 spaces onCastlegate, 15 spaces on Main Street, 13 spaces on Castle Terrace, 10 spaces on West End, 7 spaces onBlakewell Road and 5 spaces on Brucegate.
Motorcycle Parking
2.2.29 There are four motorcycle parking areas within the study boundary with room for approximately 14motorcycles. Two of the areas are at Castlegate Short Stay car park with room for approximately 9motorcycles and the other two areas are at Bridge Street car park with room for approximately 5 motorcycles.
2.2.30 It should be noted that half of one of the motorcycle parking areas at Castlegate short stay car park alsocontains cycle stands and if these were fully in use 3 motorcycle spaces would be unavailable.
Cycle Parking
2.2.31 There are 30 cycle parking spaces within the study area consisting of 8 cycle stands providing 16 spaces atBerwick Railway Station, 3 stands providing 6 spaces at Castlegate Short Stay car park and 4 standsproviding 8 spaces at Bridge Street Car Park.
2.2.32 As noted above the 3 stands at Castlegate short stay car park are within a motorcycle parking area which if inuse by motorcycles would be unavailable to cycles.
Coach Parking
2.2.33 Coach parking is currently provided in Chapel Street coach park which has 4 spaces, however there areproposals for this coach park to revert back to a car park. There is a coach drop off bay on Church Streetadjacent to Parade car park.
Condition & General Site Observations2.2.34 The following observations were made by AECOM staff regarding the condition of car parks and parking
facilities within the car parks:
Castlegate Overflow Car Park (see photo 1)
· Grassed areas very muddy in wet weather· Cars would struggle or get stuck in bad weather conditions

AECOMBerwick-upon-Tweed Parking Study
12
Photo 1: Castlegate Overflow Car Park muddy in wet weather
· On second site visit the weather was much better and the overflow car park was heavily used withoutissue. (see photo 2)
Photo 2: Castlegate Overflow Car Park in good weather
Former Car Park off Hatters Lane
· This car park is fenced off and has been unused for a period of time. (see photo 3)· Has overgrown weeds and substantial amount of litter around the outside.· General surface is fairly uneven and white lines have faded in some areas.· If brought back into use would need degree of maintenance work.

AECOMBerwick-upon-Tweed Parking Study
13
Photo 3: Hatters Lane Car Park
2.2.35 It should be noted that since the site visit and parking surveys Hatter’s Lane car park has been brought backinto use and maintenance works have been carried out to improve its condition.
Quayside Car Park
· Disabled space markings are not to Traffic Signs Regulations & General Directions standards(TSRGD). (see photo 4)
Photo 4: Disabled bay markings not to TSRGD
Berwick Infirmary Maternity Unit
· Surface very loose and uneven (see photos 5 and 6)· Older sections of paving showing through newer surfacing (see photo 6)

AECOMBerwick-upon-Tweed Parking Study
14
· No marked spaces
Photos 5 & 6: Surfacing at Berwick Infirmary Maternity Unit
Berwick Infirmary Mather Unit
· Marking very faded across all spaces.· Many potholes which have been tarmacked over· Generally poor surface condition. (see photo 7)
Photo 7: Surfacing at Berwick Infirmary Mather Unit

AECOMBerwick-upon-Tweed Parking Study
15
Berwick Infirmary Minor Injuries Unit
· Markings very faded (see photo 8)
Photo 8: Faded markings at Berwick Infirmary Minor Injuries Unit
Foul Ford
· The markings in the car park are faded. (see photo 9)
Photo 9: Faded markings at Foul Ford Car Park

AECOMBerwick-upon-Tweed Parking Study
16
Waugh Place
· The markings are faded. (see photo 11)
Photos 10 & 11: Markings at Waugh Place Car Park
Parade
· The markings are faded in some areas. (see photo 12)
Photo 12: Markings at Parade Car Park

AECOMBerwick-upon-Tweed Parking Study
17
Berwick Station Car Park
· Those parking in the southern section of the car park and wishing to access the town have to eithercross the station access road where it is very wide in the vicinity of the bus stop, or follow a tortuousroute towards the station across a four stage unassisted crossing point (see photo 13) and then backon themselves on the footway on the southern side of the access road.
Photo 13: Four stage pedestrian crossing at Station
Signing to Parking Areas2.2.36 A survey of all signing to car parks within the study area and on the main routes into the study area was
carried out by AECOM staff. The locations of and a photograph of each sign are shown in Figure 4 togetherwith diagrammatic indications of the routes that are signed.
2.2.37 Traffic entering Berwick from the south on the A1167 or the B6354 and then the A1167, or from the west onthe A698 is directed across the Royal Tweed Bridge to access town centre parking. It is then directed to turnright onto Marygate to access historic quayside parking or left onto Marygate to access all other parking.
2.2.38 Traffic turning right onto Marygate is then directed right onto Hide Hill straight on into Sandgate and into theQuayside car park. Traffic turning left onto Marygate is directed to turn right onto Walkergate to access EnglishHeritage property / historic church parking or straight on to access Castlegate car park. Traffic turning left ontoWalkergate is then directed left to access Coxons Lane car park or straight on to access Parade car park.
2.2.39 Just beyond the entrance to Castlegate car park there is a sign informing northbound vehicles that they canalso go straight on to access further long stay parking. Vehicles going in this direction are then directed leftonto Railway Street and into the Station car park.
2.2.40 Traffic entering Berwick from the north on the A1167 or the A6105 and then the A1167 is directed south alongthe A1167 to access town centre parking. There is then a sign at the junction with Railway Street directingthem along Railway Street for train station parking. If they continue heading south along the A1167 Castlegatethere are signs directing them into Castlegate car park for general parking or straight on for museum/touristinformation/historic church/historic quayside parking. If they continue straight on there is then a sign at thejunction with Walkergate directing them left along Walkergate to access English Heritage property / historicchurch parking.
2.2.41 Traffic turning left onto Walkergate is then directed left to access Coxons Lane car park or straight on toaccess Parade car park. For traffic continuing straight on at the junction with Walkergate there is no furtherparking direction signing.

AECOMBerwick-upon-Tweed Parking Study
18
2.2.42 There is no parking signing at the junction of Marygate / Golden Square for traffic arriving from the north. Itwould be useful to have a sign here showing that the quayside parking is straight ahead especially as thetendency may be to follow the main road to the right where there is no further town centre parking. This wouldalso provide consistency with the signing for traffic arriving from the south.
2.3 Pedestrian Routes2.3.1 A review was carried out by AECOM staff of the pedestrian routes between the main town centre public car
parks of Castlegate, Coxons Lane, Parade, Quayside, Bridge Street and Eastern Lane and the main shoppingstreets of Castlegate, Hide Hill, Bridge Street, West Street and, in particular, Marygate.
2.3.2 Although Castlegate car park is very large and relatively linear, with motorists parking in some areas of ithaving a reasonably long walk to reach Castlegate, there is no defined pedestrian route through the majority ofit resulting in pedestrians walking through trafficked areas. It is considered that a defined pedestrian routethrough the long and short stay sections of the car park, ideally raised above trafficked areas and connectingto the section of footway outside the public conveniences, would be of considerable benefit. In addition amarked pedestrian crossing point, ideally on a raised ramp, from the footway in front of B&M Bargains accesssteps to the short section of footway on the other side of the relatively wide car park access would assistpedestrians wanting to head south on Castlegate from the car park.
2.3.3 Another issue for pedestrians within Castlegate car park is that due to the overflow car park being a grassedsurface it can be muddy and/or rutted at times as shown in photo 14 below.
Photo 14: Castlegate Car Park muddy and rutted surface at times
2.3.4 Once pedestrians from Castlegate car park have reached the footway on the eastern side of Castlegateprovision is generally good with a reasonably wide footway, a signalised crossing of Castlegate approximately40m to the north and a pedestrian refuge crossing approximately 50m to the south
2.3.5 Pedestrian provision from Coxons Lane and Parade car parks through to Castlegate/Marygate is good with noissues noted except for a number of potholes on Hatters Lane at the point where pedestrians travelling alongWalkergate cross it.
2.3.6 From Quayside car park the main pedestrian route towards the town centre passes through a narrow archwayunder the town walls which is also a vehicular access to the car park and where there are no footways. Thisbrings pedestrians into conflict with vehicles. It would however be difficult to resolve this issue due to thehistoric nature of the constraints involved. Beyond this archway the pedestrian connections to the town centreare good with no noted issues.
2.3.7 At Bridge Street car park, pedestrians exiting onto Bridge Street can do so via two build-out areas raised tofootway level and containing planters and seating. These give access to the Bridge Street footways which arenarrow in places however this is in keeping with the narrow one way carriageway and historic setting.
AECOMBerwick-upon-Tweed Parking Study
19
Pedestrians exiting via Drivers Lane have to walk along the vehicular exit from the car park which has nofootways and where vehicles are approaching from behind. There is potential here to provide a footway on thenorth side of the access on the adjacent land. It is understood that this land is being developed as part of aPremier Inn facility. At the end of Drivers Lane pedestrians can join the footways on Sandgate which giveaccess to Bridge Street and Hide Hill with no noted issues.
2.3.8 From Eastern Lane car park there are three possible pedestrian accesses. The most direct route to the mainshopping areas is to head north along Eastern Lane, between buildings onto Marygate. As Eastern Lanepasses between the buildings it is a narrow one way road with no footways. Although no pedestrian/vehicularconflicts were observed during the site visits, this is obviously not an ideal situation for pedestrians, but withoutdemolition of the historic stone buildings, or closure of the access to vehicles, pedestrian access cannot reallybe improved. Neither of these options are practical as the vehicular access is the only exit from the car park.
2.3.9 The alternative pedestrian accesses are along Easter Wynd to West Street and then Bridge Street orMarygate; or south along Eastern Lane to Bridge Street. The first route has good footway links although theseare a little narrow in places on West Street. The second route has very narrow footways towards its southernend. On both routes the narrowness of the overall highway corridor between buildings makes it impractical towiden footways. However in this area of the town, given its historic layout with generally narrow roads andfootways, the situation appears to work well with lower traffic speeds and an almost shared space type feel tothe highway corridors.
2.4 Cycle Routes2.4.1 Sustrans Cycle Route 1 passes through the study area on Dock Road and Main Street to the south and
Castlegate and Castle Terrace to the north. Between these points there are separately signed routes fornorthbound and southbound cyclists. Northbound cyclists are directed up Blakewell Road then back south onUnion Park Road, across the Royal Tweed Bridge and up Bank Hill to join Castlegate. Southbound cyclists aredirected down Marygate, along Hide Hill and Bridge Street and across Berwick Bridge to join Main Street.
2.4.2 Other than a section of segregated cycleway across the Royal Tweed Bridge the routes described above arecompletely on road. Within the study area Route 1 forms part of the Coast and Castles Cycle Route. From theRiver northwards it is also part of the Pennine Cycleway.
2.5 Bus Routes2.5.1 There are a number of bus routes within the study area and the main services are shown in Figure 5. Buses
typically enter/leave the study area to/from the north and south on the A1167 and to/from the west on theA698.
2.5.2 The main bus stops for Berwick are located along Golden Square and at the train station. There are somelocal routes which serve the more minor streets of Berwick but the main services tend to follow the A1167across the Royal Tweed Bridge and along Golden Square and Castlegate.
2.5.3 There is also a local ‘hail and ride’ service which operates half hourly through the day and runs from BerwickHoliday Park to the railway station via Castlegate, Marygate, Hide Hill, Bridge Street, Tweedmouth West End,Spittal and Golden Square.
2.5.4 Destinations served by routes within the study area include:
· Newcastle
· Edinburgh
· Dunbar
· Kelso

AECOMBerwick-upon-Tweed Parking Study
20
· Galasheils
· Holy Island
· Alnwick
· Eyemouth

03
Policy Review

AECOMBerwick-upon-Tweed Parking Study
22
3 Policy Review
3.1.1 There are a number of National and Local Policy documents relevant to the consideration of the parkingprovisions in the Berwick-upon-Tweed area of Northumberland. These documents were reviewed to identifyrelevant policy aims and objectives to inform the recommendations of this report.
3.1.2 The relevant content of each document is discussed below.
3.1 National Parking Policy3.1.1 The National Planning Policy Framework (NPPF) issued in March 2012 sets out the Government’s planning
policies for England and how these are expected to be applied. The Government aims to achieve sustainabledevelopment that stimulates positive growth by way of change for the better in the built, natural and historicenvironments.
3.1.2 Guidance within the document relevant to parking is detailed below.
3.1.3 Para 29: ‘The transport system needs to be balanced in favour of sustainable transport modes, giving people areal choice about how they travel. However, the Government recognises that different policies and measureswill be required in different communities and opportunities to maximise sustainable transport solutions will varyfrom urban to rural areas.’
3.1.4 Para 30: ‘Encouragement should be given to solutions which support reductions in greenhouse gas emissionsand reduce congestion.’
3.1.5 Para 39: ‘If setting local parking standards for residential and non-residential development, local planningauthorities should take into account:
· the accessibility of the development;
· the type, mix and use of development;
· the availability of and opportunities for public transport;
· local car ownership levels; and
· an overall need to reduce the use of high-emission vehicles.’
3.1.6 Para 40: ‘Local authorities should seek to improve the quality of parking in town centres so that it isconvenient, safe and secure, including appropriate provision for motorcycles. They should set appropriateparking charges that do not undermine the vitality of town centres. Parking enforcement should beproportionate.’
3.1.7 A Written Statement to Parliament, Planning update March 2015, outlined steps the government are taking tostreamline the planning system, protect the environment, support economic growth and assist locally-leddecision-making.
3.1.8 The statement outlined that the government is keen to ensure that there is adequate parking provision both innew residential developments and around our town centres and high streets.
3.1.9 The statement declared that:
3.1.10 “The imposition of maximum parking standards under the last administration lead to blocked and congestedstreets and pavement parking. Arbitrarily restricting new off-street parking spaces does not reduce car use, it

AECOMBerwick-upon-Tweed Parking Study
23
just leads to parking misery. It is for this reason that the government abolished national maximum parkingstandards in 2011. The market is best placed to decide if additional parking spaces should be provided.
3.1.11 However, many councils have embedded the last administration’s revoked policies. Following a consultation,we are now amending national planning policy to further support the provision of car parking spaces. Parkingstandards are covered in paragraph 39 of the NPPF. The following text now needs to be read alongside thatparagraph: “Local planning authorities should only impose local parking standards for residential and non-residential development where there is clear and compelling justification that it is necessary to manage theirlocal road network.”
3.1.12 Building on the success of our previous guidance to help householders rent out under-used car parkingspaces, we have also updated planning guidance to local authorities to clarify that non-residential car parkingspace can be rented out. This will support the shared economy and increase the provision of competitivelypriced car parking spaces”.
3.2 Local PolicyConsolidated Planning Policy Framework
3.2.1 The Consolidated Planning Policy Framework for Northumberland includes one document relevant to theBerwick-upon-Tweed area. This is:
· Berwick-upon-Tweed Borough Local Plan Adopted April 1999
3.2.2 The Local Plan is now fairly dated at 18 years old and therefore has reduced relevance to the current issuesfacing Berwick. Also a number of the policies contained within the document have now expired.
3.2.3 Section 3.15.1 of the document identifies its aims and what areas a Local Plan needs to address. Inaccordance with the principles of sustainable development, PPG13 at the time (Transport, March 1994,paragraph 1.7) states that policies for transport and other forms of development should aim to reduce the needto travel, especially by car, by: influencing the location of different types of development relative to transportprovision (and vice versa); and, fostering forms of development which encourage walking, cycling and publictransport use. Planning policies should: promote development within urban centres at locations highlyaccessible by means other than the private car; locate major generators of travel demand in existing centres;strengthen existing local centres which offer a range of everyday community, shopping and employment useopportunities; maintain and improve facilities for walking, cycling and public transport; and, limit parkingprovision within new developments.
3.2.4 Saved policies and proposals within the document with some relevance to this study include the following:
3.2.5 Proposal 19 – ‘The feasibility of providing ‘park and ride’ bus services between the northern and southernends of the town by way of Golden Square will be kept under review.
3.2.6 Proposal 20 – ‘In co-operation with the Highway Authority and coach operators, the Council will seek toprovide boarding and alighting points for coach passengers and limited-stay waiting spaces for coaches atappropriate locations.’
Northumberland County Council Local Transport Plan 2011-2026
3.2.7 The Local Transport Plan (LTP) contains a number of statements relevant to this parking study including:
3.2.8 Paragraph 3.32 – ‘The need for increased parking at rail stations is also important to encourage modal shiftfrom road to rail.’
3.2.9 The LTP sets out a number of actions to achieve its objectives. Regarding these it states:

AECOMBerwick-upon-Tweed Parking Study
24
3.2.10 Paragraph 5.10 – ‘Our first priority is to manage and maintain the transport networks and services to ensurethe greatest transport benefits from the existing infrastructure. This includes traffic management to maximisethe efficiency of the existing network for the benefit of all users including:
· Managing parking on the road to reduce obstructions and congestion; and ….’
3.2.11 Paragraph 5.12 – ‘Our second priority is to influence demand for travel on the transport network. Thiscomprises interventions to encourage modal shift onto more sustainable modes such as:
· More car parking capacity at railway stations; ….’
3.2.12 Paragraph 6.5 sets out a number of identified transport issues affecting sustainable economic growth andcompetitiveness in Northumberland including, ‘Inadequate coach parking facilities in town centres, impactingon the number of tourists.’
3.2.13 Paragraph 6.33 states, ‘The lack of available car parking at stations is severely restricting passenger growth.This is a particular problem at stations on the ECML at Berwick, Morpeth and Cramlington. Indiscriminateparking of cars is also affecting local communities as well as the reliable operation of local bus services.
3.2.14 The LTP lists a number of specific actions to be carried out including:
· Review coach parking facilities in town centres and include improvements, as appropriate, in aprioritised programme of schemes.
· Investigate the provision of additional car parking at Berwick railway station.

AECOMBerwick-upon-Tweed Parking Study
25
00
04
Consultations

AECOMBerwick-upon-Tweed Parking Study
26
4 Consultations
4.1.1 As part of the Berwick-upon-Tweed Parking Study a number of initial consultations were carried out. Thepurpose of these consultations was two-fold, firstly to establish details of proposals that may affect parkingsupply and demand in the future and secondly to establish any concerns of relevant stakeholders regardingthe current and future parking situation in Berwick-upon-Tweed.
4.1.2 As part of the process to establish details of proposals that may affect parking supply and demand in thefuture the following were consulted:
· Northumberland County Council’s Core Strategy Team
· Arch, the Northumberland Development Company
4.1.3 The following stakeholders were consulted regarding their comments and concerns over the current and futureparking situation in Berwick.
· 35 local businesses and schools
· Northumberland County Council’s Parking Enforcement Team
· Berwick-upon-Tweed Town Council
· The two local councillors who’s wards cover the study area
4.1.4 As well as being asked for their general comments and concerns regarding parking the local businesses andschools were also asked for details of where their staff currently parked to help in building up a general pictureof the long term parking arrangements in the study area.
4.1.5 The information obtained from the stakeholder consultations is described in the following sections.
4.2 Northumberland County Council’s Core Strategy Team Consultation4.2.1 A meeting was held with members of Northumberland County Council’s Core Strategy team on 23rd June 2017
to establish details of any current proposals likely to affect parking supply or demand within the study area.Comments made at the meeting are summarised below.
· There is only one major proposed development that is likely to affect the parking provision in Berwick,this is the Premier Inn on Sandgate. There is no parking provision proposed according to theTransport Assessment which states that guests at the hotel are likely to be outside of Berwick duringpeak times.
· There are a number of potential housing developments which have planning permission in Berwick butonly one actually in the study area. These are all residential areas which will serve themselves interms of parking provision. The development within the study area is on Silver St/Palace St East andhas plans for houses/flats with parking provided.
· Seton Hall residential development is outside of the study area but has a large number of housesplanned at between 71 and 120.
· The core strategy plans to build 900 houses by the end of 2031, at a rate of approximately 45 a year.

AECOMBerwick-upon-Tweed Parking Study
27
· Summer, around July, will be the time when the figures are more definitive to the number ofdevelopments, as well as the likelihood they will go through.
· There are no planned tourism developments to generate parking provision or demand.
4.3 Arch Consultation4.3.1 ARCH were contacted on 31st May 2017 regarding any proposals likely to affect parking supply or demand in
Berwick. They stated that they have no current developments and no developments planned for the nearfuture in Berwick.
4.4 Local Businesses & Schools Consultations4.4.1 35 local businesses and schools were contacted by telephone to discuss any comments and concerns they
had over the current or future parking situation in Berwick and their staff parking arrangements. 19 of thepeople spoken to provided comments. It should be noted that these comments may be the personal views ofthe individuals spoken to and do not necessarily reflect official comment from the businesses or schools. Thecomments are summarised below:
Lloyds Pharmacy, Union Brae, Tweedmouth, Berwick-upon-Tweed TD15 2HB
4.4.2 Staff usually park on Main St /West End underneath the Royal Tweed Bridge as there is no staff car park.Customers normally park outside of the shop on the double yellow lines which creates issues outside of thesurgery with traffic building up. Overall the staff member considers that there is a lack of parking inTweedmouth in general with very limited spaces.
St Cuthbert’s First School, Prince Edward Rd, Tweedmouth, Berwick-upon-Tweed TD15 2EX
4.4.3 There is a staff car park off Union Brae for staff at the school to park in. Parents park anywhere andeverywhere they can which causes real issues, people park outside of the doctor’s surgery blocking thejunction especially at peak times for the school. People often can’t enter or exit the junction due to the trafficbuild-up. If the school are ever getting deliveries the driver often can’t get into the car park due to the numberof people who park on the double yellow lines; the queues often end up onto Bridge End. The member of staffspoken to said she lives in Tweedmouth so she usually walks to work so she doesn’t have any othercomments about parking apart from the issues around the school.
Buds of Berwick, 11 Main St, Tweedmouth, Berwick-upon-Tweed TD15 2AA
4.4.4 Staff park outside the shop when there is space available. Customers generally park outside of the shop ifthey can but if not it is Main St / West End under the Royal Tweed Bridge. The issues they are having isgetting parking tickets when their delivery van is outside of the shop, the company have applied for a permit asit is a business vehicle but were not allowed. When they get deliveries it is the same problem, they often haveto leave cones out in the spaces so that there is room for the delivery vehicle outside of the shop. In terms ofwider comments the staff member spoken to considers that parking is horrendous and people like to complainabout it. People often block spaces and there is one lady with a large camper van who parks over a number ofbays which she doesn’t need. It is a busy street so the staff often have to park on Kiln Hill away from the shopwhich makes deliveries difficult.
Tyne and Tweed Estate Agents, 9 Bridge St, Berwick-upon-Tweed TD15 1ES
4.4.5 Staff park in the Bridge Street car park but it is a maximum stay of 2 hours so they have to keep going in andout to sort parking. The customers normally park in the same car park or they are just walking past and pop in.The main issue the shop has is that the staff have to keep going in and out to sort parking which isn’tproductive. Overall the staff member considers that it is chaos and there isn’t enough parking, also makesreference to the closed car park behind the job centre on Walkergate which should be reopened.

AECOMBerwick-upon-Tweed Parking Study
28
The Green Shop, 30 Bridge St, Berwick-upon-Tweed TD15 1AQ
4.4.6 Staff park in the Quayside car park, customers usually park in the Bridge Street car park. The manager thinksit was a mistake to make it free. Further comments made included that it was a shame they built Bridge Streetcar park where they did, where do you start and stop with the problems there are so many. Considers thatthere are insufficient places to park for coaches as there are only two spaces available near Parade.
The Maltings, Theatre and Cinema, Eastern Ln, Berwick-upon-Tweed TD15 1AJ
4.4.7 There are four spaces for staff to park in the Eastern Lane car park but often the acts have to park in them soit is very limited. Customers park in Eastern Lane car park which only has a 2 hour maximum stay and oftenperformances last longer than two hours so people are directed towards Parade or the Quayside car park. Themain issue for the theatre is the 2 hour limit on car parking. In terms of further comments they think it is greatthat it has been made free parking but hope it can become three hour maximum stay to tie in with performancedurations.
Shoecare, 8 Hide Hill, Berwick-upon-Tweed TD15 1AB
4.4.8 Staff park at the Quayside car park and customers park anywhere they can find space. Currently has noissues with parking and has no further comments to make about parking in Berwick.
G.C Grieve Ltd, 1 Church St, Berwick-upon-Tweed TD15 1EG
4.4.9 Staff park in the all-day car park at Castlegate and customers park wherever they can. The issue that themanager has with parking is that he considers the all-day free car park backfired, thought it was ‘the best ideain the world’ at first but ‘it wasn’t to be the case’. People who didn’t used to pay for a ticket are now parking forfree meaning that there are no spaces from around 9am to park. In terms of further comments the managerthinks it should go back to the way it was where everywhere had to pay, also thinks that 500 more spaces areneeded for visitors, currently entering peak season and there is nowhere for them to park.
Mountain Warehouse, 41 Marygate, Berwick-on-Tweed TD15 1AX
4.4.10 Most staff walk into work but some park in Castlegate car park. Customers tend to park in Castlegate orEastern Lane. There currently aren’t any issues with parking at the shop. In terms of further issues themanager said it’s not bad but as soon as it gets busy you can’t find a space to park, also made reference tothe loading bays opposite the shop and stated that lots of people park in them and get tickets.
H.B Longbone & Son, 1-3 Walkergate, Berwick-upon-Tweed TD15 1DB
4.4.11 Staff currently park in Coxons Lane car park, customers park anywhere they can but usually it is in Castlegatecar park. Current issues regarding parking are that there is not enough parking; the new Greaves West & Ayreoffice means that it is difficult to find anywhere to park the van. In regards to further comments the staffmember stated that they have benefitted greatly from the new parking measures although there is still notenough available. The staff member thinks that the loading bays in Marygate should be on short term 15-30minute parking, and the car park behind the job centre should be reopened.
Greaves, West & Ayre, 17 Walkergate, Berwick-Upon-Tweed, Northumberland TD15 1DJ
4.4.12 Staff tend to park at Coxons Lane car park. There is an area on site for 6 clients to park. Issues are that staffstruggle to park after 8:30am in Coxons Lane so often have to go to Parade to park instead. Other issues arethe general lack of parking in Berwick.
The Music Gallery, 83C Marygate, Berwick-upon-Tweed TD15 1BA
4.4.13 Staff park wherever they can, usually the Quayside car park or Castlegate. but they sometimes get tickets.Customers are the same they try to get parked wherever they can. Customers sometimes get tickets whenloading outside the shop as they are coming in and out of the shop and don’t want to leave their car bootsopen with valuable instruments in. The issues that the owner has is the problem with loading. Often business

AECOMBerwick-upon-Tweed Parking Study
29
users are in and out of the shops and the wardens come at bad times. The owner had a lot of input about thewider issues regarding parking in Berwick. He stated, it’s awful, the situation is ridiculous.
4.4.14 The owner has been thinking about relocating his business because the parking situation is so bad, customerscan’t get parked outside of the shop because of the fear of being ticketed. Lots of shops are struggling with theparking situation, which has been made worse by Greaves West & Ayre as the building shouldn’t have beenbuilt in the owner’s opinion, there are lots of empty offices in the trading estate to the North of Berwick and thecurrent building should have been made a car park. He can’t stress how bad it is, there are too many trafficwardens and cars get ticketed for silly offenses such as one tyre on the white line. Another shop keeper gotticketed twice in one day because of deliveries and left her in tears as she had no choice but to park there, the30 minute bays were changed to loading only so she now can’t park outside of her own shop. People arelosing a lot of business from this and it is unfair, lots of spaces have been taken i.e. on the high street andnone of them have been replaced, the owner thinks that the pedestrianisation of the high street was the startof the decline.
4.4.15 The problems are now in quieter season never mind the summer, the owner has spoken to councillors andMPs but they don’t seem to do anything, he has started a campaign but to no avail and thinks it will be thedeath of Berwick. There should be alternative car park for staff and visitors so that there is better access to thetown centre instead of people taking the spaces all day.
Holy Trinity C E First School, Bell Tower Pl, Berwick-upon-Tweed TD15 1NB
4.4.16 There is a small staff car park but it is not enough for everyone so others park in Castlegate car park. Parentscan’t get parked within half a mile of the school so they really struggle. The main issue is the distance thatparents have to walk to get to the school. In terms of additional comments the staff member stated that ingeneral it is not very good for locals or visitors at the moment.
Berwick Middle School, Lovaine Terrace, Berwick-upon-Tweed TD15 1
4.4.17 There is a small car park for staff within the school site but if that is full the staff park along NorthumberlandAvenue. Parents also tend to park along Northumberland Avenue. An issue that the member of staffhighlighted was that outside is resident only from 9:30-3 so they have a problem with parking. A parent got aticket when inside the school for two minutes when picking up a sick child. Sports events are near impossibleto get parked for. Another issue the staff member referenced was the dangers of parking on NorthumberlandAvenue with the holiday park, staff members cars have been damaged by caravan deliveries. The staffmember also added that parking is much better in Berwick now it is free but the main issue is the parkingoutside of the school for parents, jokingly said for Northumberland County Council to provide them with alarger car park.
Hainsworths Menswear, 108 Marygate, Berwick-upon-Tweed TD15 1BN
4.4.18 Doesn’t park, partner drops off and only member of staff in the shop so not applicable. Customers parkwherever they can but usually at the back of Castlegate car park. The main issue is the lack of parking. Interms of more general comments, states that it is bad, people come to the business and partners business forsuits and wedding dresses and many people have been ticketed and are now saying they will not come backdue to the parking situation. Thinks that charging for parking should be re-introduced so that the money fromthe parking tickets would still come in but people would stop parking in the town centre for free.
The Flower Room, 18 Hide Hill, Berwick-upon-Tweed TD15 1AB
4.4.19 Staff park in the Quayside car park, doesn’t know where customers park, doesn’t ask. Issue with parking is thenew traffic warden, runs a delivery service and now can’t get parked outside of own shop, doesn’t have time towalk up and down all day. Considers that can’t run a successful business if you can’t park outside your ownshop.

AECOMBerwick-upon-Tweed Parking Study
30
Optimus Accounting, 90 Marygate, Berwick-upon-Tweed TD15 1BN
4.4.20 The staff have to move around different car parks all day so it is difficult. Clients park wherever they can getparked, one client spent half an hour driving round trying to get parked. Issue is the lack of parking, the GWAbuilding added 100 staff and parking provision wasn’t added so it is a real struggle to get parked. Also othercar parks have been closed so more staff have been added to Berwick town centre and the number of parkingspaces has decreased. No other issue in Berwick other than it is very difficult to get parked and it is affectingbusiness.
Brucegate Dentist, 2-4 Brucegate, Berwick-upon-Tweed TD15 1LP
4.4.21 There are four spaces outside of the surgery but try to avoid parking in them so usually park in the Castlegatecar park. Customers use the four spaces at the surgery or have to drive around until they find one. Issues arethat the four spaces are two and two so often people get blocked in the car park causing real issues. Alsosome patients aren’t able to walk very far so if they can’t get parked outside it is resident only around thestreets so they can’t find anywhere to park. Overall it is ridiculous and it makes it really difficult for patients
Fairbairn G O Ltd, 14-26 Church St, Berwick-upon-Tweed TD15 1DY
4.4.22 Staff park wherever possible which is usually Parade. Staff are unsure where customers park as they oftenjust visit a different town because parking is so difficult. There is an issue trying to find a space in the morning;a staff member spent 20 minutes trying to get a space this morning. There just isn’t enough parking, and youneed to arrive at 8:20am just to get a parking space. Overall it is horrendous and Berwick needs more publiccar parking spaces.
4.5 Northumberland County Council’s Parking Enforcement Team Consultation4.5.1 A meeting was held with members of Northumberland County Council’s parking enforcement team on 23 rd
June 2017. The notes of the meeting are summarised below:
· There has been a big change in demand since 2014 when free parking was introduced, now a muchhigher demand for long stay parking.
· From 2009 – 2014 parking was pay and display and there were not the problems that are faced now.
· Quayside, Foul Ford, Parade and Coxons Lane are all busy car parks.
· Possible re-opening for car park on Hatters Lane, managed by Arch and they have been contactedregarding this but waiting to hear back.
· In terms of disc parking there has to be different signs on-street compared to off-street parking, bigsigns displaying rules of car park for off-street but not possible for on-street parking.
· Long stay parking works but catering for the demand is the real problem for Berwick.
· Struggle to get parked past 8:30am for long stay car parks.
· Considering imposing restrictions on Castlegate car park to limit stays to maximum of three days, alsoconsidering at railway station car park.
· There was an experimental order for bays on Marygate which were short stay but these didn’t work sothey have been returned to loading only.
· There is a big problem for enforcement on Marygate as people often park vehicles there and go toGreggs and Costa to get food/drink

AECOMBerwick-upon-Tweed Parking Study
31
· Sports direct parking is outside of the Eastern Lane car park and there are several private parts to thecar park.
· Considering making Palace Street dual use, so residents only or two hours max stay, to try andincrease short stay parking in the South of Berwick.
· West St is a problem, it is very narrow and once a car parks on there it is very difficult to get anotherdown there, enforcement officer believes there should be double yellow lines on there to really enforcethe area, as currently there are only signs which people may miss.
· Alongside the town hall is an area that about 3 cars can park but enforcement can’t do anything aboutit.
· Disc parking is very hard to manage with limited staff and is very time consuming, but it works.
· Disabled badge holders can park up to 3 hours
· Highlighted an area of land to the south of Berwick off Palace Street East which could have capacityfor a car park, seems to be a council owned building.
· Park and ride was discussed but generally felt that it would be very difficult to implement successfully.
4.6 Berwick-upon-Tweed Town Council and Local Councillors Consultation4.6.1 A meeting was held with Gareth Davis, the Clerk of Berwick-upon-Tweed Town Council and the Councillor for
Berwick North, Catherine Seymour, on 1st September 2017. Councillor Georgina Hill was unable to attend themeeting but subsequently provided comments by e-mail. The comments made by the Town Council and theCouncillors are summarised below:
· Overall Berwick is short of parking.
· Hatters Lane has been opened to provide 24 more car park spaces free of charge. Chapel StreetCoach Park is to be re-opened as a car park to provide a further 25 spaces. There is potential foranother 40 spaces at the Greaves West and Ayre office but the land is barren at the moment in time.
· There are ideas for possible increased provision up to 4 hours.
· Gareth has looked at the parking issue in Berwick for a long time but has never seen any reliable datato back it up.
· There is a sense of under delivery and that Castlegate has been badly managed and badly designed.People often just change the time on their parking discs so they can park all day.
· Strongly seasonal traffic from tourists, but there is considerable local traffic on Wednesdays andSaturdays.
· Believe there is a demand for shorter time retail parking in the town centre.
· There is a plan for a marina to be built on the Quayside with room for 18-20 yachts in the summer. AtBerwick Dock, owner is charging £10 per night for lorries to park there, had 8/9 lorries therepreviously, could be a potential short term solution for parking. Also the golf course has some landwhich could be available.

AECOMBerwick-upon-Tweed Parking Study
32
· There is an area of land opposite Berwick train station which could potentially be used for parking, butthis is green space and has a very steep gradient for access so unsure if it can be engineered for carparking, and they don’t really want to take green space away from Berwick.
· Councillors also made reference to a warehouse opposite the station which used to be a factory runby Flannigan’s but it is likely high value development land, most likely for more flats in Berwick-upon-Tweed.
· They are also thinking about introducing a residents permit at £15 a year but think it would beopposed.
· There are lots of different restrictions for parking in Berwick and the town council want it simplifying,they have ideas for a long term parking permit but no other alternatives or other management of carparks.
· Tweedmouth doesn’t seem to have the problems that Berwick does in terms of parking.
· There was talk of a multi-storey car park at the train station but they have been dismissed as it simplyisn’t feasible; although Virgin Rail who own the car park are looking into development plans.
· The council want Castlegate short stay car park to be for shoppers and they ideally want three typesof parking in Berwick: Retail, Tourists and Workers but there is no rational plan as of yet.
· There has never been any data collected in relation to parking so they are looking forward to seeingthe formal dataset.
· Berwick has a number of large events but they cannot continue putting these events on if there is noparking for visitors as they often have to close car parks to cater for the events.
· Overall they want parking in Berwick to be simple.

AECOMBerwick-upon-Tweed Parking Study
33
Existing ParkingSituation
05

AECOMBerwick-upon-Tweed Parking Study
34
5 Existing Parking Situation5.1 Introduction
5.1.1 In order to establish the existing parking situation within the study area in a neutral month, parking surveyswere carried out on Wednesday 15th March 2017, a market day, Thursday 16th March 2017, a neutralweekday, and Saturday 18th March 2017 by survey specialists Streetwise Services.
5.1.2 To establish the existing parking situation in the peak summer period, further surveys were then carried out onWednesday 5th July 2017, a market day, Thursday 6th July 2017, a neutral weekday, and Saturday 8th July2017.
5.1.3 The surveys were between 0700 and 1900 on each day. The numbers and stay durations of parked vehicleswere recorded using registration matching during hourly beat surveys.
5.2 Analysis5.2.1 The parking survey data was analysed to determine the maximum occupancy and how occupancy varied
through the day and between the six surveyed days. This was done for each of the car parks and on-streetparking sub groups described in section 2.2, and for individual car parks and streets.
5.2.2 The average stay duration was also determined for the sub groups and for individual car parks and streets forthe three surveyed days.
5.2.3 Parking occupancy and duration of stays for each car park category and each area of on-street parking arefully discussed in Appendix B which also contains tables for each area summarising maximum occupancy andduration of stay data. The findings of the analysis are summarised below.
5.2.4 Figures 6 to 11 show diagrammatically how maximum occupancy varies across the study area on each of thestudied days.
NCC Public Car ParksOccupancy – March Surveys
5.2.5 Overall key findings from analysis of the March occupancy surveys are as follows:
· 6 of the 11 car parks reached capacity on at least one of the surveyed days.· 9 of the 11 car parks exceeded 95% capacity on at least one of the surveyed days.· 10 of the 11 car parks exceeded 85% capacity, the maximum recommended for efficient operation, on
at least one of the surveyed days; the exception being Waugh Place which only has 12 spaces andreached 83% occupancy.
· Across all the car parks, the highest combined occupancy occurred on the Thursday between 1100and 1200 and was 92%.
· Across all the car parks the combined occupancy exceeded the recommended 85% maximum forefficient operation on all three of the surveyed days.
· Bridge Street is relatively underused on weekdays but reaches close to capacity on a Saturday.· Berwick Railway Station and Quayside car parks have significantly lower maximum occupancies on a
Saturday than weekdays indicating that a high proportion of weekday users are employees.
Occupancy – July Surveys
5.2.6 Overall key findings from analysis of the July occupancy surveys are as follows:
· The car parks were busier during the July surveys than during the March surveys on a Wednesdayand Thursday but less busy on a Saturday.
AECOMBerwick-upon-Tweed Parking Study
35
· 7 of the 11 car parks reached capacity on at least one of the surveyed days.· 9 of the 11 car parks exceeded 95% capacity on at least one of the surveyed days.· 10 of the 11 car parks exceeded 85% capacity, the maximum recommended for efficient operation, on
at least one of the surveyed days; the exception being Castlegate Long Stay/Overflow which stillreached 85% occupancy on the Wednesday.
· Across all the car parks the highest combined occupancy occurred on the Wednesday between 1200and 1300 and was 95%.
· Bridge Street is relatively underused on Saturday but reaches close to capacity on Wednesday andThursday, the opposite to what occurred during the March surveys.
· Quayside car park has a significantly lower maximum occupancy on a Saturday than on weekdaysindicating that a high proportion of weekday users are employees.
Issues
5.2.7 The parking surveys indicate that the NCC Public Car Parks do not have sufficient capacity to cope with thecurrent demand. Seven car parks reached or exceeded capacity on at least one of the surveyed days, nineexceeded 95% occupancy on at least one of the surveyed days and all eleven exceeded 85% occupancy, themaximum recommended for efficient operation, on at least one of the surveyed days. As all the car parkssuffer capacity issues at some time, simply encouraging motorists to use less busy car parks as opposed tothe busiest car parks is not an option.
5.2.8 During the Saturday parking surveys a number of vehicles parked in Woolmarket car park for significantlylonger than the permitted maximum stay of 3 hours.
Private Car Parks in Public Use / Use Specific Car ParksOccupancy – March Surveys
5.2.9 Overall key findings from analysis of the March occupancy surveys are as follows:
· The Asda car park remains well below the recommended maximum occupancy for efficient operationof 85% on all of the three surveyed days with the maximum occupancy being 67% on the Saturday.
· At Berwick Infirmary the Mather Unit car park exceeds capacity on the Wednesday and Thursday andthe Infirmary Unit car park exceeds 95% occupancy on the Thursday and exceeds 85% occupancy onthe Wednesday. The Mather Unit car park exceeds capacity due to vehicles being parked in areas notdesignated as parking spaces.
· The Berwick Infirmary car parks are busier on weekdays with plenty of spare capacity on a Saturday.
Occupancy – July Surveys
5.2.10 Overall key findings from analysis of the July occupancy surveys are as follows:
· The Asda car park again remains well below the recommended maximum occupancy for efficientoperation of 85% on all of the three surveyed days with the maximum occupancy being 72% on theSaturday. The maximum occupancies on Thursday and Saturday are higher than during the Marchsurveys but the Wednesday maximum occupancy is lower.
· At Berwick Infirmary the Mather Unit car park reaches capacity on the Wednesday and Thursday andthe Infirmary unit car park exceeds 95% occupancy on the Wednesday and Thursday.
· As for the March surveys the Berwick Infirmary car parks are busier on weekdays with plenty of sparecapacity on a Saturday.
Issues
5.2.11 The parking surveys indicate that there are the following potential issues in the Private Car Parks in PublicUse / Use Specific Car Parks:

AECOMBerwick-upon-Tweed Parking Study
36
· The Berwick Infirmary – Mather Unit car park is over capacity during the week.· The Berwick Infirmary – Infirmary Unit car park operated close to capacity and above the 85%
occupancy recommended for efficient operation during the week.
5.2.12 However given that the Minor Injuries Unit car park is very close to the Mather Unit car park and has sparecapacity during the week and that the Maternity Unit car park is very close to the Infirmary Unit car park andhas spare capacity during the week it is not considered that these currently represent serious issues that needaddressing.
On-Street Parking & Adjacent Parking Areas – Major Roads Where ParkingForbidden/UnlikelyOccupancy – March Surveys
5.2.13 Overall key findings from analysis of the March occupancy surveys are as follows:
· The only parking occurring on these roads is on Golden Square which reached a maximum occupancyof four vehicles on the Thursday and Saturday.
· It is thought that this parking is a mixture of vehicles parking on the wide footways / vehicular accessalong Golden Square and loading by vehicles parking on the double yellow lines.
Occupancy – July Surveys
5.2.14 Overall key findings from analysis of the July occupancy surveys are as follows:
· Again the only parking occurring on these roads is on Golden Square which reached a maximum offour vehicles on the Wednesday.
Issues
5.2.15 The parking surveys indicate that there are the following potential issues with parking on major roads whereparking is forbidden / unlikely:
· Some vehicles are parking on the wide footways on Golden Square.
On-Street Parking & Adjacent Parking Areas – Major Roads Where Parking AllowedOccupancy – March Surveys
5.2.16 Overall key findings from analysis of the March occupancy surveys are as follows:
· Castlegate (High Greens to Marygate) reached an occupancy of 114% on the Wednesday howeverthis was after 1800 when the single yellow line restrictions end and the effective capacity will increasesignificantly. However occupancy did still reach 109% before 1800 indicating that some loading and/orillegal parking must have been occurring.
· Main Street (Church Road to Mount Road) exceeded capacity on all three days, hence some parkingmust be occurring here in non-designated parking areas. Footway parking on areas of widenedfootway has been observed in this area so this is likely the cause of occupancy exceeding capacity.
· Prince Edward Road exceeds the 85% occupancy recommended for efficient operation on all threesurvey days and Marygate and Main Street (West End to Prince Edward Road) came close to the 85%on the Wednesday.
Occupancy – July Surveys
5.2.17 Overall key findings from analysis of the July occupancy surveys are as follows:

AECOMBerwick-upon-Tweed Parking Study
37
· Prince Edward Road greatly exceeded maximum capacity on the weekdays. This occurred at schoolpick-up/drop-off times and is therefore likely due to school parking. There are wide footways in thearea so this is likely where the parking in excess of capacity is occurring.
· Castlegate (High Greens to Marygate) came close to capacity on all three survey days, and this wasat times before the single yellow line restrictions had ended.
· Main Street (West End to Prince Edward Road) and Main Street (Church Road to Mount Road) bothexceeded 85% capacity on at least one of the survey days.
Issues
5.2.18 The parking surveys indicate that there are the following potential issues on the major roads where parking isallowed:
· Parking exceeds capacity on Main Street (Church Road to Mount Road)· Parking exceeds capacity at school pick-up and drop-off times on Prince Edward Road· Parking exceeds 85% occupancy on Castlegate (High Greens to Marygate) and Main Street (Church
Road to Mount Road)
On-Street Parking & Adjacent Parking Areas – NorthwestOccupancy – March Surveys
5.2.19 Overall key findings from analysis of the March occupancy surveys are as follows:
· None of the streets reached parking capacity or the 85% maximum occupancy recommended forefficient operation.
· The busiest street is Castle Terrace which reached 75% occupancy on all three survey days. Theleast busy street is Castle Drive which reached a maximum of 20% occupancy.
Occupancy – July Surveys
5.2.20 Overall key findings from analysis of the July occupancy surveys are as follows:
· Castle Terrace exceeded the 85% threshold on the Wednesday.· The other three streets had relatively low occupancies at all times.· It is possible the high occupancy on Castle Terrace is at least partly due to overspill parking from the
train station.
Issues
5.2.21 The parking surveys indicate that there are the following potential issues with the on-street parking in thenorthwest area:
· On Castle Terrace parking occupancy exceeded the 85% threshold for efficient operation on one ofthe survey days and was close to it on other days. This may be due to overspill parking from the trainstation.
On-Street Parking & Adjacent Parking Areas – NorthOccupancy – March Surveys
5.2.22 Overall key findings from analysis of the March occupancy surveys are as follows:
· Lovaine Terrace had the highest occupancy on all three survey days and reached the 85% thresholdrecommended for efficient operation on the Thursday. The times of maximum occupancy on LovaineTerrace coincided with pick-up and drop-off times at the adjacent school so this is likely the reason for

AECOMBerwick-upon-Tweed Parking Study
38
the high occupancy. There is a residents only parking restriction in place but this only operatesbetween drop-off and pick-up times.
· Occupancy on the other three streets remained relatively low on all three survey days.
Occupancy – July Surveys
5.2.23 Overall key findings from analysis of the July occupancy surveys are as follows:
· Again Lovaine Terrace had the highest occupancy and reached capacity on the Saturday. This was atschool drop-off time so will likely be associated with a weekend event at the school. The maximumoccupancy on the Wednesday and Thursday occurred at school pick-up time and reached the 85%threshold on the Thursday.
· Occupancy on the other three streets remained relatively low on all three survey days except onNorthumberland Street on the Wednesday where occupancy reached 78%.
Issues
5.2.24 The parking surveys indicate that there are the following potential issues with the on-street parking in the northarea
· Lovaine Terrace reached capacity on one of the survey days and the 85% threshold on a further twoof the survey days. It is likely school drop-off / pick-up parking is contributing to the high parkingdemand here.
On-Street Parking & Adjacent Parking Areas – CentralOccupancy – March Surveys
5.2.25 Overall key findings from analysis of the March occupancy surveys are as follows:
· Brucegate reached capacity on the Thursday and exceeded 85% capacity on the other two surveydays.
· Well Close Square exceeded the 85% threshold on the Wednesday.· Castlegate Court exceeded the 85% threshold on the Saturday.· On both Ivy Place and Scotts Place some parking was recorded despite their capacity being zero due
to double yellow lines, indicating that some illegal parking is occurring here.
Occupancy – July Surveys
5.2.26 Overall key findings from analysis of the July occupancy surveys are as follows:
· Castlegate Court and Brucegate exceeded the 85% threshold on the Saturday and Well Close andHigh Greens did on the Thursday.
· Some parking was recorded again on Ivy Place and Scotts Place indicating that some illegal parking isoccurring here.
Issues
5.2.27 The parking surveys indicate that there are the following potential issues with the on-street parking in thecentral area:
· Brucegate reached capacity on one of the survey days and exceeded the 85% threshold on a furtherthree days.
· Castlegate Court, Well Close Square and High Greens exceeded the 85% threshold on at least one ofthe survey days.
· Some illegal parking is occurring in Ivy Place and Scotts Place.

AECOMBerwick-upon-Tweed Parking Study
39
On-Street Parking & Adjacent Parking Areas – StationOccupancy – March Surveys
5.2.28 Overall key findings from analysis of the March occupancy surveys are as follows:
· Railway Street is shown to have significant parking even though the capacity is shown as zero. This isas there is a single yellow line restriction on Railway Terrace which operates 1000 to 1600 making thecapacity zero for most of the day. However outside these times it has a capacity of approximately 14meaning that parking does still reach capacity outside of the single yellow line restriction hours.
· The surveys do also show that some parking is occurring on Railway Terrace within the single yellowline restriction operating hours, therefore some illegal parking or loading must be occurring here.
· Tweed Street is shown to be over capacity but this is due to some of the street having single yellowline restrictions from 1000 to 1600. Outside of these hours, when maximum occupancy occurs, thereare an additional 12 spaces giving a total of 26 and meaning that occupancy actually reaches amaximum of 76%.
Occupancy – July Surveys
5.2.29 Overall key findings from analysis of the July occupancy surveys are as follows:
· Outside of the single yellow line restriction times Railway Street exceeds its then capacity of 14reaching a maximum of 107% occupancy indicating that some illegal parking and/or loading isoccurring.
· Again some parking is occurring during the operational hours of the single yellow line restriction furtherindicating that illegal parking and/or loading is occurring.
· Outside of the single yellow line restriction hours Tweed Street reaches a maximum occupancy of65% of its then capacity.
Issues
5.2.30 The parking surveys indicate that there are the following potential issues with the on-street parking in thestation area:
· Railway Street exceeded its capacity outside of the single yellow line restriction hours on two of thesurvey days indicating that some illegal parking and/or loading is occurring here.
· Parking is occurring on Railway Street during the operational hours of the single yellow line restrictionfurther indicating that some illegal parking and/or loading is occurring here.
On-Street Parking & Adjacent Parking Areas – East 1Occupancy – March Surveys
5.2.31 Overall key findings from analysis of the March occupancy surveys are as follows:
· Walkergate, Hatters Lane, Wallace Green, Crawford’s Alley, Church Road and Parade all exceedcapacity on at least one of the survey days.
· Chapel Street reaches capacity on two of the survey days.· Only Coxons Lane and Ravensdowne remain below capacity throughout the surveys and
Ravensdowne exceeds the 85% threshold on the Saturday.· On Walkergate there is a section of double yellow lines that are very faded and parking has been
observed here. This is the likely cause of the parking in excess of capacity.· Illegal parking has also been observed on Hatters Lane on a section of wide footway adjacent to
double yellow lines so this is the likely cause of parking in excess of capacity here.

AECOMBerwick-upon-Tweed Parking Study
40
· On Wallace Green the parking slightly in excess of capacity is likely to be because of some illegalparking and/or loading or parking in non-designated areas.
· On Crawfords Alley, some illegal parking was observed so this is the likely cause of parking in excessof capacity here.
· Part of Church Street is covered by a single yellow line restriction which only operates between 0800and 1800 however parking in excess of capacity was observed within these hours so some illegalparking and/or loading must be occurring here.
· On Parade one additional car was recorded in excess of capacity, this could be due to cars beingparked very closely within the designated parking area or due to illegal parking.
· On Woolmarket the parking significantly in excess of capacity must be due to illegal parking and/orloading.
Occupancy – July Surveys
5.2.32 Overall key findings from analysis of the July occupancy surveys are as follows:
· Again Walkergate, Hatters Lane, Wallace Green, Crawfords Alley, Church Street and Woolmarketexceeded capacity on at least one of the survey days. This will be for the same reasons describedabove for the March surveys.
· Coxons Lane was also slightly over capacity during the July surveys. This occurred during theoperational hours of the single yellow line restriction here so must be a result of illegal parking orparking in non-designated areas.
· Parade reached capacity during the July surveys.· Occupancy on Ravensdowne exceeded the 85% threshold on the Saturday.
Issues
5.2.33 The parking surveys indicate that there are the following potential issues with the on-street parking in the east1 area:
· Walkergate is over capacity with illegal parking occurring.· Hatters Lane is over capacity with illegal parking occurring.· Coxons Lane was over capacity due to illegal parking or parking in non-designated areas.· Wallace Green is slightly over capacity due to illegal parking and/or loading or parking in non-
designated parking areas· Chapel Street is at capacity· Some illegal parking is occurring in Crawford’s Alley· Church Street is over capacity due to illegal parking and/or loading· Parade is at capacity· Woolmarket is over capacity due to illegal parking and/or loading
On-Street Parking & Adjacent Parking Areas – East 2Occupancy – March Surveys
5.2.34 Overall key findings from analysis of the March occupancy surveys are as follows:
· Bank Hill, West Street and Easter Wynd, Love Lane, Bridge Terrace, Bridge End, and Bridge Streetare all shown to be over capacity on all days and Eastern Lane on two days. In all cases it isconsidered that this is due to illegal parking and/or loading.
· No parking was recorded on either Drivers Lane which has a capacity of zero, or Dewars Lane whichhas a capacity of one.

AECOMBerwick-upon-Tweed Parking Study
41
Occupancy – July Surveys
5.2.35 Overall key findings from analysis of the July occupancy surveys are as follows:
· Bank Hill, West Street and Easter Wynd, Eastern Terrace, Love Lane, Bridge Terrace, Bridge End,and Bridge Street are all shown to be over capacity on all days. In all cases it is considered that this isdue to illegal parking and/or loading.
· Again no parking was recorded on either Drivers Lane which has a capacity of zero, or Dewars Lanewhich has a capacity of one.
Issues
5.2.36 The parking surveys indicate that there are the following potential issues with the on-street parking in thestation east 2 area:
· Bank Hill, West Street and Easter Wynd, Eastern Terrace, Love Lane, Bridge Terrace, Bridge End,and Bridge Street are all over capacity due to illegal parking and/or loading.
On-Street Parking & Adjacent Parking Areas – East 3Occupancy – March Surveys
5.2.37 Overall key findings from analysis of the March occupancy surveys are as follows:
· Silver Street, Foul Ford and Oil Mill Lane are all shown to be over capacity on more than one of thesurvey days.
· Parking on Hide Hill and Ness Street is shown to exceed the 85% threshold on two of the survey days.· On Silver Street the parking shown to be in excess of capacity is due to a single yellow line restriction
which only operates from 0800 to 1800. The parking in excess of capacity only occurs outside of therestriction hours so in effect remains below capacity.
· On Foul Ford there is an area next to double yellow lines where it is not clear if parking is forbidden bythe lines or if the lane is private property and parking is allowed. This area has space for three carsand has not been included within the capacity assessment. Parking is occurring here and it is this areathat is therefore causing the occupancy to show as over capacity.
· There is a similar situation on Oil Mill Lane with an area with sufficient space for two cars to parkwhere it is not clear if parking is prohibited by double yellow lines. This area has not been includedwithin the capacity assessment but parking is occurring here and causing the indicated occupancy inexcess of capacity.
Occupancy – July Surveys
5.2.38 Overall key findings from analysis of the July occupancy surveys are as follows:
· Sandgate is shown to be over capacity on the Wednesday. This is due to illegal parking and/or loadingon the double yellow lines in this street.
· Silver Street and Foul Ford are again shown to have occupancy in excess of capacity due to thereasons described above.
· Ness Street is shown to be at capacity on all three survey days.· The Avenue is shown to be at capacity on the Saturday.· Hide Hill is again shown to be over the 85% threshold, this time on all three of the survey days.
Issues
5.2.39 The parking surveys indicate that there are the following potential issues with the on-street parking in the east3 area:

AECOMBerwick-upon-Tweed Parking Study
42
· Sandgate exceeded capacity on one of the survey days due to illegal parking and/or loading occurringon double yellow lines.
· Illegal parking is possibly occurring in two areas on Foul Ford and Oil Mill Lane but it is unclear if theadjacent double yellow line restrictions apply to the areas in question.
· The Avenue and Ness Street reached capacity on at least one of the survey days· Hide Hill exceeded the 85% threshold on five of the six survey days.
On-Street Parking & Adjacent Parking Areas – West 1Occupancy – March Surveys
5.2.40 Overall key findings from analysis of the March occupancy surveys are as follows:
· Occupancies remained well below capacity on all streets on all survey days except on BlakewellGardens which exceeded the 85% threshold on the Wednesday.
Occupancy – July Surveys
5.2.41 Overall key findings from analysis of the July occupancy surveys are as follows:
· Occupancies remained well below capacity on all streets on all survey days.
Issues
5.2.42 The parking surveys indicate that there are the following potential issues with the on-street parking in the west1 area:
· The occupancy on Blakewell Gardens exceeded the 85% threshold on one of the survey days.
On-Street Parking & Adjacent Parking Areas – West 2Occupancy – March Surveys
5.2.43 Overall key findings from analysis of the March occupancy surveys are as follows:
· Lee’s Lane reached capacity on the Wednesday.· Church Road exceeded the 85% threshold on the Wednesday.
Occupancy – July Surveys
5.2.44 Overall key findings from analysis of the July occupancy surveys are as follows:
· The occupancy on Well Road slightly exceeded capacity on all three survey days.· The occupancy on Lee’s Lane reached capacity on all three days.· The occupancy on Brewery Bank exceeded the 85% threshold on the Thursday.· The occupancy on Well Square exceeded it on the Saturday.· It is thought that the occupancy on Well Road is exceeding capacity due to vehicles parking in an area
not designated for parking, namely the turning head at the end of the road.
Issues
5.2.45 The parking surveys indicate that there are the following potential issues with the on-street parking in the west2 area:
· Occupancy slightly exceeded capacity on Well Road on three of the survey days due to vehiclesparking in areas not designated for parking.
· Occupancy reached capacity on Lee’s Lane on four of the survey days.

AECOMBerwick-upon-Tweed Parking Study
43
· Occupancies on Church Road, Brewery Bank and Well Square exceeded the 85% threshold on one ofthe survey days.
5.3 Overall Situation for Mixed Parking Areas5.3.1 The analysis in Appendix B, summarised in Section 5.2 considers peak demand on individual streets and in
individual car parks at their own individual peak times, irrespective of the timings of peak demand in adjacentstreets or car parks. This is considered sufficient for streets in purely residential areas, or where parking isrestricted to resident only, or in streets where mixed parking is likely to occur but there are no surrounding carparks or mixed use streets to use as alternative parking locations. In these locations parking demand is verystreet specific and not significantly interchangeable with other streets or car parks.
5.3.2 Similarly parking demand in the private car parks for public use/use specific car parks within the study area isconsidered not to be significantly interchangeable with surrounding car parks and streets and thereforeanalysis of individual car park peaks is appropriate.
5.3.3 However in streets where the majority of parking is available to all users and close to similar streets or publiccar parks, it is considered that car parking is interchangeable between these streets and car parks anddemand should be considered at an overall peak demand for the area. It is considered that there is one sucharea within the study boundary located around the town centre core and encompassing all the public carparks, with the possible exception of the railway station car park, and the following streets:
· Castlegate (High Greens to Marygate)
· Marygate
· Scott’s Place
· Railway Street
· Wallace Green
· Chapel Street
· Church Street
· Woolmarket
· West Street
· Easter Wynd
· Bridge End
· Bridge Street
· Drivers Lane
· Dewars Lane
· Hide Hill
· Sandgate
· Silver Street
· Foul Ford
5.3.4 Not all parking within these streets and car parks will be interchangeable; for example those wishing to stay forlong durations will not be able to park in short stay car parks or on-street parking areas and some may have tobe within a very short distance of their final destination limiting parking choice, however it is considered thatparking is sufficiently interchangeable that current and future demand should be considered for the area as awhole.

AECOMBerwick-upon-Tweed Parking Study
44
5.3.5 The peak demand across all the public car parks combined has already been considered in section 5.2 andtherefore the demand within the above listed streets at the corresponding times simply needs adding in to givethe total demand for the area as a whole. Peak demand across the car parks and streets combined occurredon the Wednesday for both the March and July surveys.
5.3.6 Spreadsheet output in Appendix C shows the full area peak demand calculations and the table below showsthe peak demand for March and July alongside the existing parking capacity and the resultant free spaces atpeak demand. The table also shows the resulting free spaces if maximum occupancy is limited to 85%, therecommended maximum occupancy for efficient operation of parking. It should be noted that the existingcapacity figure in the table includes the recently opened Hatters car park discussed in Section 6.2.
5.3.7 As mentioned above it is debatable as to whether the railway station car park should be considered within theoverall area. This is because it is slightly removed from the other car parks and streets being considered and itis the only public car park which is charged. The table therefore also shows the capacity, demand and freespace results for a scenario excluding this car park.
Scenario CapacityPeak Demand Free Spaces
Free Spaceswith 85% MaxOccupancy
Mar July Mar July Mar July
Existing Situation 1162 1027 1067 135 95 -39 -79Existing Situation ExcludingRailway Station Car Park 1036 906 938 130 98 -25 -57
5.3.8 It can be seen that over the area as a whole there are 135 free spaces at the time of peak demand in Marchand 95 free spaces at the time of peak demand in July. To keep maximum occupancy at 85% of capacity anadditional 39 spaces would be required in March and an additional 79 spaces would be required in July.
5.3.9 If the railway station car park is excluded from the area under consideration there are 130 free spaces duringthe March peak and 98 spaces during the July peak with an additional 25 spaces required to achieve 85%maximum capacity in March and 57 spaces required to achieve this in July.
5.3.10 If the railway station car park is considered as a standalone car park it would require an additional 24 spacesto achieve 85% maximum occupancy in March and an additional 27 spaces to achieve it in July based oncurrent peak demand.

AECOMHartlepool Pedestrian Connectivity Improvements
45
.
Future ParkingSituation
06

AECOMBerwick-upon-Tweed Parking Study
46
6 Future Parking Situation6.1 Introduction
6.1.1 The future parking situation within the study area will potentially be affected in three ways:
· Through provision of new developments and the parking they generate,
· Through provision of new developments on areas of existing parking that is not replaced,
· Through general background growth in traffic levels and hence parking demand.
6.1.2 These three sources of potential impact are analysed in the following sections together with their likelycombined impact on the future parking situation. Assessments have been made for 2020 and 2030 as agreedin the study brief
6.2 Proposed Developments6.2.1 A review of potential developments likely to affect parking within the study area was carried out. This involved
a review of Northumberland County Council Local Plan documents, a search of the Northumberland CountyCouncil online planning portal, meetings with Northumberland County Council officers including the CoreStrategy Team and a discussion with Arch regarding any proposed developments they have in the area.Details of the discussions with the Core Strategy Team and ARCH are given in Chapter 4.
6.2.2 A number of specific developments with the potential to affect parking supply and/or demand within the studyarea have been identified through the research and discussions described above. These developments arediscussed below.
Premier Inn - Sandgate
6.2.3 A planning application has been approved for a five storey 60 bedroom hotel on the site of the formerplayhouse cinema on Sandgate. No parking is to be provided as part of this development with guestsexpected to park in surrounding car parks or on-street parking bays.
6.2.4 The March and July parking surveys showed that existing parking peak demand occurs between 1000 and1400 with the exact peak time varying across the different days of the week. The Transport Statement for theproposed Premier Inn development considers that within this time period the peak parking demand generatedby the hotel will be approximately 15 cars. Therefore it is assumed that the hotel will add 15 cars to currentpeak parking demand on all days.
Train Station Car Park
6.2.5 Northumberland County Council is exploring the possibility of constructing an additional 102 space car park tothe north of the station and tracks. This would be run by NCC and charged as per the existing station car park.There are difficulties in utilising this site with multiple issues to overcome. Progress of the scheme is currentlyon hold, partly due to a lack of finance and partly due to hold ups from Network Rail and Virgin Trains.
Chapel Street Coach Park
6.2.6 The Chapel Street Coach Park was constructed on the site of a former car park and opened in March 2017.During the March parking surveys it was closed to both cars and coaches while construction works wereunderway.
6.2.7 There are now plans to convert the coach park back to a car park providing 23 parking spaces.

AECOMBerwick-upon-Tweed Parking Study
47
Hatters Lane Car Park
6.2.8 The former car park on Hatters Lane has recently reopened on a short term lease providing 24 parkingspaces. The car park was closed during the March and July parking surveys.
Overall Impact
6.2.9 Assuming that implementation of the additional train station car park is impractical at this time, the overallimpact of the remaining three development proposals described above will be to increase parking provision by47 spaces and increase parking demand by 15 spaces.
6.3 Traffic GrowthPublic Car Parks
6.3.1 It has been assumed that the general background growth in parking demand in public car parks will be thesame as background growth in traffic levels. TEMPRO was used to establish predicted background trafficgrowth in the Berwick area from 2017 to the assessment years of 2020 and 2030. The established rates wereas follows:
· 2017 to 2020: 3.7%
· 2017 to 2030: 10.6%
Private / Use Specific Car Parks
6.3.2 Given that these car parks each serve a specific development of fixed size they will not be subject tobackground growth in demand for parking spaces. Any change to use or increase in size of the developmentswould be subject to the relevant planning applications when any increase in demand could be assessed andadditional parking provision stipulated as appropriate.
On-Street Parking and Adjacent Parking Areas
6.3.3 It has been assumed that growth in parking demand for on-street parking on non-residential or mixed usestreets will be the same as background growth in traffic levels as established above. The following streetswere classified as non-residential or mixed use streets:
· Castlegate (High Greens to Marygate)
· Marygate
· Scott’s Place
· Railway Street
· Wallace Green
· Chapel Street
· Church Street
· Woolmarket
· West Street
· Easter Wynd
· Bridge End
· Bridge Street
· Drivers Lane

AECOMBerwick-upon-Tweed Parking Study
48
· Dewars Lane
· Hide Hill
· Sandgate
· Silver Street
· Foul Ford
· Castlegate (Castle Terrace to High Greens)
· Royal Tweed Bridge
· Berwick Bridge
· Golden Square
· Main Street (Prince Edward Road to Church Road)
· Main Street (West End to Prince Edward Road)
· Main Street (Church Road to Mount Road)
· Brucegate
· Well Close Square
· Walkergate
· Crawford’s Alley
6.3.4 In residential areas it has been assumed that the only growth in parking demand will be from growth in carownership levels. TEMPRO was therefore used to establish predicted growth in car ownership rates for theBerwick area of Northumberland. The established rates were as follows:
· 2017 to 2020: 3.6%
· 2017 to 2030: 13.2%
6.4 Overall ImpactTown Centre Core Parking Area
6.4.1 As defined in section 5.3 the town centre core parking area consists of all town centre public car parks, withthe possible exception of the railway station car park and the surrounding streets where the majority of parkingis available to all users. In this area it is considered that parking is interchangeable to a high degree betweenthe various car parks and on-street parking areas and therefore the overall area peak demand can beconsidered rather than the individual peaks of the separate car parks and streets.
6.4.2 Predicted traffic growth derived in section 6.3 can be applied to all car parks and streets in this area toestimate the peak parking demand for the combined area in 2020 and 2030. Spreadsheet output in AppendixC shows the full area peak demand calculations and the table below shows the peak demand for the existingsituation, repeated from the section 5.3, together with the predicted demand for 2020 and 2030. The table alsoshows the resultant numbers of free spaces and the free spaces if maximum occupancy is limited to 85%.Results are also shown for scenarios excluding the railway station car park.
6.4.3 It should be noted that as general traffic growth to 2020 increases demand by significantly more than the 15predicted from the Premier Inn development, this 15 has not been added in addition to general growth which isin theory already accounting for such developments.

AECOMBerwick-upon-Tweed Parking Study
49
Scenario CapacityPeak Demand Free Spaces
Free Spaceswith 85% MaxOccupancy
Mar July Mar July Mar July
Existing Situation 1162 1027 1067 135 95 -39 -792020 Situation 1162 1065 1106 97 56 -77 -1192030 Situation 1162 1136 1180 26 -18 -148 -192Existing Situation ExcludingRailway Station Car Park 1036 906 938 130 98 -25 -57
2020 Situation ExcludingRailway Station Car Park 1036 940 973 96 63 -59 -92
2030 Existing SituationExcluding Railway StationCar Park
1036 1002 1037 34 -1 -121 -157
6.4.4 It can be seen that the current free spaces at peak demand of 135 in March and 95 in July reduces to 97 and56 by 2020 and 26 and -18 by 2030. To keep maximum occupancy at 85% of capacity by 2020 an additional77 free spaces would be required in March and an additional 119 free spaces would be required in July. By2030 an additional 148 free spaces would be required in March and an additional 192 free spaces would berequired in July.
6.4.5 Assuming that the Castlegate overflow car park is lost between 2018 and 2020 and that the Chapel Streetcoach park reverts to a 23 space car park between 2018 and 2020, the new car parking space provisionrequired to achieve 100% maximum occupancy and 85% maximum occupancy, with and without the railwaystation car park included as part of the town centre core parking area, will be as shown in the table below.
6.4.6 It should be noted that the ‘required new spaces to achieve 85% maximum occupancy’ are calculated as(current max occupancy/0.85) – current capacity. This calculation includes an allowance for the fact that whenyou change the number of car parking spaces provided, you change the number of free spaces required toachieve 85% occupancy. For instance if you currently had 100 spaces and 95 maximum occupancy, you are10 spaces above 85% occupancy; however if you simply provide 10 more spaces you still don’t achieve 85%occupancy, only 86.3%, as more free spaces are now required. Using the above calculation the requirednumber of additional spaces to achieve 85% maximum occupancy is (95 / 0.85) – 100 = 11.76 spaces.
Scenario
Required newspaces for 100%Max Occupancy
Required newspaces for 85%Max Occupancy
Mar July Mar July
Existing Situation 0 0 46 93
2020 Situation 21 62 209 258
2030 Situation 92 136 292 344Existing Situation ExcludingRailway Station Car Park 0 0 30 68
2020 Situation ExcludingRailway Station Car Park 22 55 187 226
2030 Existing SituationExcluding Railway StationCar Park
84 119 261 303

AECOMBerwick-upon-Tweed Parking Study
50
6.4.7 It can be seen that based on the above assumptions the new space requirement will be between 0 and 93depending on which criteria are to be met and this requirement will rise to between 21 and 258 by 2020 and tobetween 84 and 344 by 2030.
6.4.8 If the railway station car park is considered as a standalone car park, as stated in section 5.3, it would requirean additional 24 spaces to achieve 85% maximum occupancy in March and an additional 27 spaces toachieve it in July based on current peak demand. This would rise to 29 and 32 spaces by 2020 and 38 and 41spaces by 2030.
Streets Outside Town Centre Core Parking Area
6.4.9 Traffic growth or car ownership growth rates were used as appropriate to estimate the maximum percentageoccupancy across the six survey days for each street in 2020 and 2030. Spreadsheet output showing thecurrent maximum occupancy across the six days established from the parking surveys, together withestimated maximum occupancies in 2020 and 2030 is included in Appendix C.
6.4.10 Section 5.2 has already described the streets which are over capacity or over the 85% threshold for theexisting situation. These are also illustrated in Figure 14. The predicted maximum occupancies for 2020indicate that the following additional street will be over capacity on at least one of the six surveyed days bythen:
· Castlegate Court
6.4.11 Furthermore the predicted 2020 occupancies indicate that the following additional streets will be over the 85%threshold on at least one of the six surveyed days by then:
· Bell Tower Place and Bell Tower Park
6.4.12 The streets predicted to be over capacity or over the 85% threshold by 2020 are illustrated in Figure 15.
6.4.13 By 2030 the predicted maximum occupancies indicate that the following additional streets will be over capacityon at least one of the survey days:
· Main Street (West End to Prince Edward Road)
· High Greens
· Well Close Square
· Blakewell Gardens
· Brewery Bank
· Church Road
6.4.14 Also by 2030 the predicted maximum occupancies indicate that the following additional streets will be over the85% threshold:
· Northumberland Avenue
· Riverside Road
· Kiln Hill
· Brewery Lane
· Tower Road
6.4.15 The streets predicted to be over capacity or over the 85% threshold by 2030 are illustrated in Figure 16.

AECOMHartlepool Pedestrian Connectivity Improvements
51
Recommendations
07

AECOMBerwick-upon-Tweed Parking Study
52
7 Recommendations
7.1.1 The following sections contain recommended actions regarding the future parking provision within the studyarea. The recommendations are based on consideration of the analysis carried out in the previous sectionsincluding reviews of the following:
· Existing parking provision, condition and occupancy levels,
· Associated infrastructure such as signage and pedestrian routes to the car parks,
· Relevant policy
· Consultations,
· Predicted future parking demand
7.1.2 The majority of the recommendations are standalone items which could be implemented independently. Theset of recommendations therefore represents a ‘shopping list’ of works that can be carried out as fundingbecomes available.
7.2 Town Centre Core Parking ProvisionNumber of Additional Spaces
7.2.1 Assuming that the Castlegate overflow car park is lost between 2018 and 2020, that the Chapel Street coachpark reverts to a 23 space car park between 2018 and 2020, and that the railway station car park should notbe considered as part of the Town Centre Core Parking Area, it is recommended that the following numbers ofadditional public parking spaces are provided:
· As soon as possible 50 spaces· By 2020 187 spaces· By 2030 261 spaces
7.2.2 This level of provision will give a maximum occupancy in March of 85% and a maximum occupancy in July of88% across the Town Centre Core Parking Area, based on the parking survey data and predicted growth inparking demand. It should be noted that the recommended immediate provision of 50 spaces could include the23 spaces at Chapel Street car park but the 187 space and 261 space recommendations by 2020 and 2030are in addition to the Chapel Street car park being provided. The reopened Hatters Lane car park is alreadyaccounted for in the existing capacity figures and therefore cannot be included as part of the recommendedadditional provision.
7.2.3 Furthermore it is recommended that Northumberland County Council continue to investigate ways of providingadditional parking capacity close to the railway station to deal with the current capacity issues in the existingcar park, the potential existing overspill of parking into surrounding on-street parking areas and the likely futuregrowth in parking demand at the station.
Locations of Additional Spaces
7.2.4 The study area and surrounding area were reviewed to identify potential locations for additional Town CentreCore parking provision either as extensions to existing car parks or as new car parks. Any currentlyunoccupied or disused areas of land were considered as potential car parking locations as long as they wereclose enough to the Town Centre Core Parking Area to provide viable alternatives to the existing core areaparking options.
7.2.5 Multi-storey car parking on existing or potential future parking areas was not considered due to both theaesthetic impact in a heritage rich area such as Berwick and the high cost in comparison to surface car

AECOMBerwick-upon-Tweed Parking Study
53
parking. The cost implications are particularly important as parking is currently free and therefore no cost canbe offset against future parking revenues.
7.2.6 Six potential areas of land were identified for provision of additional parking. The locations of these are shownin Figure 12 and they are described below.
Land to East of Parade Car Park
7.2.7 There is a grassed area to the east of the existing Parade car park between Parade and Berwick ParishChurch graveyard. Additional parking spaces could be provided here as an extension to the existing Paradecar park. It is estimated that approximately 90 spaces could be provided on this land.
7.2.8 The advantages and disadvantages of progressing this option as an additional parking area were consideredand are set out below:
· Advantageso Can be accessed from existing Parade car parko Flat area of ground so no earthworks costso In a reasonably central areao In an area of high parking demando Could be surfaced with grasscrete to minimise aesthetic impacto Land owned by NCC
· Disadvantageso Visual impact on both Barracks to south and church/church graveyard to northo Is a conservation area and close to the Town Wallso Land currently used as events areao Not close to main vehicular route through Berwick
Land at 76 Ravensdowne
7.2.9 This land is located on the east side of Ravensdowne and consists of disused buildings and a surfaced yardwith a wide vehicular access. It is estimated that approximately 35 spaces could be provided here.
7.2.10 The advantages and disadvantages of this option were considered and are set out below:
· Advantageso Good vehicular access off Ravensdowneo Large area already hard surfacedo In area of high parking demand
· Disadvantageso Building demolition necessaryo Land not owned by NCCo Routes traffic along residential street which is narrow at north endo Not close to main vehicular route through Berwicko Planning permission has been granted for housing on the site
Former Youth and Community Centre Site
7.2.11 This land is located off Palace Street East on the site of the disused Youth and Community Centre. There is ahard surfaced area located behind the existing buildings on Palace Street East that is reached via a narrowvehicular access and could be used for parking. It is estimated that approximately 50 spaces could beprovided here.
7.2.12 The advantages and disadvantages of this option were considered and are set out below:
· Advantageso Large part of site already hard surfaced

AECOMBerwick-upon-Tweed Parking Study
54
o Existing main buildings could be retained for reuse with just smaller single storey buildings torear demolished
o Land already owned by NCCo Flat site so no earthworks requiredo Close to existing car parks with high parking demand
· Disadvantageso Not close to main vehicular route through Berwicko Very narrow vehicular access between buildings, vehicles could not pass each other on it,
may require signalled access/egresso Some building demolition necessary to achieve full parking space potential
Palace Street East Garage Site
7.2.13 This land is located on the west side of Palace Street East on the site of a former garage. It is estimated thatapproximately 90 spaces could be provided here.
7.2.14 The advantages and disadvantages of this option were considered and are set out below:
· Advantageso Large part of site already hard surfacedo Flat site so no earthworks requiredo Good vehicular access off Palace Street East and/or Silver Streeto Close to existing car parks with high parking demand
· Disadvantageso Not close to main vehicular route through Berwicko Building demolition required to achieve full parking space potentialo Planning permission was granted for flats/housing on the site but this has now possibly
expired.
Land to East of Quayside Car Park
7.2.15 This land is located to the east of the existing Quayside car park and adjacent to the river. It is currentlydisused with just a single small building on the site. Additional parking could be provided here as an extensionto the existing car park. It is estimated that approximately 125 spaces could be provided here.
7.2.16 The advantages and disadvantages of this option were considered and are set out below:
· Advantageso Flat site so no earthworks requiredo Could be accessed from existing Quayside car park.o No existing building demolition requiredo No developments currently have planning permission for the siteo Adjacent to well used car park
· Disadvantageso None of site currently hard surfacedo Not close to main vehicular route through Berwick
Land to North of Castle Terrace/Castlegate Junction
7.2.17 This is an area of greenfield land to the north of the Castle Terrace/Castlegate junction and west of the railwayline. It is estimated that approximately 100 spaces could be provided here.
7.2.18 The advantages and disadvantages of this option were considered and are set out below:
· Advantageso Adjacent to main vehicular route through Berwick

AECOMBerwick-upon-Tweed Parking Study
55
· Disadvantageso Not that close to Town Centre Core Parking Area so may be little used as an alternative to the
parking here, but may be used as an alternative to busy station car parko None of site currently surfacedo Ramped vehicular access necessary from Castlegate due to level differenceo Access would be located close to existing junction/accesses so would probably require more
than simple T-junction access.o Loss of green spaceo Felling of some trees may be necessary
Land to Northwest of Railway Station
7.2.19 This is an area of brownfield land immediately to the west of the railway station on the other side of the tracks.It is the area where NCC are exploring the possibility of constructing an additional 102 space car park, asdiscussed in paragraph 6.2.5.
7.2.20 The advantages and disadvantages of this option were considered and are set out below:
· Advantageso Adjacent to main vehicular route through Berwick
· Disadvantageso Not that close to Town Centre Core Parking Area so may be little used as an alternative to the
parking here, but could be used as an alternative to busy station car parko Access located at junction of two roads which would need realignment to allow right turns in
and out of access.o Access road down to car park site is single lane only and would have to be used by 2 way
traffic and pedestrians unless alternative pedestrian route providedo Although located close to railway station rail travellers parking here would have an
approximately 400m walk to the station building unless a new footbridge was provided acrossthe tracks
o Successful negotiations with Network Rail and Virgin Trains required before car park can beprogressed.
7.2.21 Based on the above assessments of each of the six sites it is recommended that they be considered forfurther investigation for potential parking provision in the following order:
1.) Land to East of Quayside Car Park
2.) Former Youth and Community Centre Site
3.) Palace Street East Garage Site
4.) Land to Northwest of Railway Station
5.) Land at 76 Ravensdowne
6.) Land to East of Parade Car Park
7.) Land to North of Castle Terrace/Castlegate Junction
7.2.22 The Quayside site could accommodate the 50 spaces recommended for provision as soon as possible. TheQuayside site in conjunction with the Garage site could accommodate the 187 spaces recommended forprovision by 2020. The Quayside site in conjunction with the Youth Centre site and the Garage site couldaccommodate the 261 spaces recommended for provision by 2030.

AECOMBerwick-upon-Tweed Parking Study
56
Park and Ride
7.2.23 As an alternative to provision of additional spaces within the Town Centre Core Parking Area or tocomplement some additional provision, a park and ride scheme could be introduced. Realistically a park andride scheme would not be viable without reintroduction of charges for town centre parking, both to help make apark and ride scheme financially viable and to incentivise parkers to use it.
7.2.24 In order for parkers to use a park and ride system there must either be a financial or time saving benefit. Whilethere remains any spare parking capacity within the town centre a park and ride system is unlikely to representa time saving over driving directly to the town centre and then around parking areas to find a space; theremust therefore be a financial incentive. The cost of any parking and/or bus fare charges for using the park andride would have to be significantly less than charges for parking in the town centre.
7.2.25 The area surrounding the study area and on its outskirts was reviewed to identify potential locations for parkand ride sites. Any currently unoccupied or disused areas of land, brownfield or greenfield were considered aspotential park and ride locations as long as they were close to the main routes into Berwick and not too remotefrom its centre.
7.2.26 Six sites were identified for potential park and ride provision two to the north of Berwick, two to the west andtwo to the south. The locations of these are shown in Figure 13 and they are described below.
Land to South of Ramparts Business Park
7.2.27 This land is a playing fields/football pitch area to the south of Ramparts Business Park, north of Berwick.
7.2.28 The advantages and disadvantages of utilising this land for a park and ride site were considered and are setout below:
· Advantageso Adjacent to main route into Berwick from Northo Good access from A1o Flat area of land so minimal earthworks
· Disadvantageso Loss of playing fieldso Not practical location for traffic from south of Berwick
Land to West of Ramparts Business Park
7.2.29 This land is currently used for agriculture and is located to the north and west of the A1 and west of RampartsBusiness Park to the north of Berwick.
7.2.30 The advantages and disadvantages of utilising this land for a park and ride site were considered and are setout below:
· Advantageso Adjacent to main route into Berwick from Northo Good access from A1
· Disadvantageso Not practical location for traffic from south of Berwick
Land to West of Tesco
7.2.31 This land is currently used for agriculture and is located west of Tesco on the north side of the A698 to thewest of Berwick town centre.
7.2.32 The advantages and disadvantages of utilising this land for a park and ride site were considered and are setout below:

AECOMBerwick-upon-Tweed Parking Study
57
· Advantageso On main signed route into Berwick for traffic from the southo Good access from A698o Could potentially be used by traffic from north and south of Berwick
· Disadvantageso Not as close to residential areas as sites to north and south of Berwick so less potential for
use as walk and ride
Land North of Berwick Fire Station
7.2.33 This land is greenfield not currently in use and is located north of the fire station on the north side of the A698to the west of Berwick town centre.
7.2.34 The advantages and disadvantages of utilising this land for a park and ride site were considered and are setout below:
· Advantageso On main signed route into Berwick for traffic from the southo Good access from A698o Could potentially be used by traffic from north and south of Berwicko Closest of potential sites to town centre
· Disadvantageso Land has planning permission for new care home and associated housing
Land to East of Swan Centre
7.2.35 This land consists of currently unused grassed areas on the east side of the Swan Centre to the south ofBerwick town centre.
7.2.36 The advantages and disadvantages of utilising this land for a park and ride site were considered and are setout below:
· Advantageso On major route into Berwick from the southo Good access from A1167 already in placeo Land already owned by NCCo Existing Swan Centre parking could be extended to provide large joint use parking area for
Swan Centre visitors and park and ride users.o Could attract more custom to Swan Centreo Would provide a bus link between town centre and Swan Centreo Close to surrounding residential areas for potential use as walk and ride.
· Disadvantageso Not practical location for traffic from north of Berwick
Former Coal Yard Site
7.2.37 This land is a currently disused former coal yard site to the east of the A1167 and south of Mount Road, to thesouth of Berwick town centre.
7.2.38 The advantages and disadvantages of utilising this land for a park and ride site were considered and are setout below:
· Advantageso On major route into Berwick from the southo Land is for sale

AECOMBerwick-upon-Tweed Parking Study
58
· Disadvantageso The existing access to the site from the A1167 is not suitable for use for a park and ride site. It
will need upgrading and is constrained by the adjacent railway bridge and two nearbyjunctions onto A1167. Signalised junction may be necessary
o May be contaminated land issueso Not practical location for traffic from north of Berwicko Planning permission has been granted for housing on the site
7.2.39 Based on the above assessments of each of the six sites it is considered that the Swan Centre provides thebest option for a potential park and ride site.
7.2.40 It is estimated that approximately 150 new parking spaces could be accomodated on the site without loss ofany existing facilities, however some removal of existing earth mounding and construction of some lengths ofretaining wall would be needed to achieve this number. As the Swan Centre falls outside the parking studyboundary it is not known whether there is any spare capacity in the existing 107 parking spaces that couldadditionally be utilised for the park and ride facility.
7.3 Parking Restrictions7.3.1 It is considered that the current range of parking restrictions within the study area is too complex. The
following restrictions are all present in at least one location:
· Short stay 3 hours no return within 4 hours· Short stay 2 hours no return within 3 hours· Short stay 1 hour no return within 2 hours· Short stay 1 hour no return within 1 hour· Short stay 30 mins no return within 1 hour· Short stay 20 mins no return within 1 hour· Resident only· Resident or 3 hours no return within 1 hour· Resident or 2 hours no return within 1 hour· Resident or 1 hour no return within 1 hour
7.3.2 Consideration should be given to reducing the range of short stay restrictions to the following:
· 3 hours no return within 4 hours in the short stay car parks other than Eastern Lane and BridgeStreet, as per current restrictions.
· 2 hours no return within 2 hours in Eastern Lane and Bridge Street car parks and all on-street bays.
7.3.3 A simple colour coding scheme could then be used on all parking information and possibly on signing with agreen symbol for the long stay car parks, orange for the 3 hour stay car parks and red for the 2 hour stay carparks and on-street bays.
7.3.4 Regarding the split of short stay and long stay parking numbers it is considered that the current arrangementwhereby the more central car parks and on street parking are short stay to encourage high turnover and themore outlying car parks are long stay, is appropriate for the current conditions.
7.3.5 Because all car parks are very busy at times there is no scope at present to make changes to the currentarrangements. If there were underused, more outlying car parks, more of Castlegate car park could be givenover to short stay parking to force long stay parkers into the underused outlying car parks, however as thereare currently no underused car parks this cannot be done without further parking provision first being created.
7.3.6 It is recommended that parking enforcement staff be advised of the findings of the parking surveys regarding anumber of vehicles being parked in Woolmarket car park for significantly longer than the permitted maximumstay of 3 hours during the Saturday surveys.

AECOMBerwick-upon-Tweed Parking Study
59
7.4 Streets Outside Town Centre Core Parking Area7.4.1 The parking surveys analysis and predicted traffic growth forecasts have shown that parking on some of the
streets outside the Town Centre Core Parking Area are already over capacity, some are reaching capacity andmore will be over or reaching capacity by 2020 and 2030.
7.4.2 Capacity issues on some of these streets will be assisted by provision of the additional Town Centre CoreParking Area spaces or additional railway station parking as recommended in section 7.1, however this islikely to be limited to a few streets close to the locations of the proposed additional parking; namely CastleTerrace, Ness Street and Oil Mill Lane. The issues on most of the streets will therefore not be addressed byprovision of the additional Town Centre Core Parking Area spaces or additional railway station parking. Toaddress these issues it is recommended that the following actions be carried out:
· All future developments within the study area should be required to provide sufficient parking,including visitor parking to avoid any overspill to neighbouring streets.
· The streets and parking areas where capacity issues have been identified or are predicted to occur inthe future should be analysed in detail for opportunities to provide further parking and/or ways tomaximise existing parking. This could include marking of individual bays to ensure the existing parkingspace is utilised efficiently, identification of any under-utilised area of land that could be given over toparking and a review of any areas of single or double yellow lines to ensure they are necessary
· Where school pick up/drop off parking is occurring in residential areas produce a travel plan for theschool or review any existing plan with the aim of reducing vehicular pick-ups/ drop-offs on busyresidential streets.
· Advise parking enforcement staff of streets where potential illegal parking has been identified duringthe parking surveys.
7.4.3 It is considered that the following particular actions are applicable to particular streets as listed below:
· Advise enforcement staff of potential illegal parking – Golden Square, Ivy Place, Tweed Street,Walkergate, Hatters Lane, Coxons Lane, Crawfords Alley, Bank Hill, Eastern Lane, Love Lane, BridgeTerrace, Oil Mill Lane, The Avenue, Union Brae
· Produce / review school travel plan – Lovaine Terrace, Prince Edward Road, Union Brae
· Provide additional Town Centre Core/Railway Station parking as recommended in Section 7.1 –Golden Square, Brucegate, Ivy Place, Walkergate, Hatters Lane, Coxons Lane, Eastern Lane, NessStreet, Castle Terrace
· Review opportunities to increase/maximise parking provision – Main Street (West End to PrinceEdward Road)
7.5 Coach Parking7.5.1 It is intended that the current coach parking facility at Chapel Street which has four coach parking spaces,
revert back to a car park. It is therefore desirable to locate another site for a potential coach parking facility.The looked-for attributes of a coach parking facility include:
· Easy vehicular access from the main traffic route through Berwick
· Located such that parked coaches do not interfere with vehicular flow on adjacent roads
· Close to tourist attractions and main shopping streets
· Close to toilet / eating / drinking facilities for driver and passengers
· Suitable area for passengers to disembark from coach in safety and without blocking through route forpassing pedestrians
· Good footway connections to main surrounding pedestrian routes

AECOMBerwick-upon-Tweed Parking Study
60
7.5.2 A review was carried out of the study area to identify potential locations for coach parking. Three types of areawere considered as follows:
· Existing car parks that could be wholly or partially converted to provide coach parking
· The sites identified in section 7.1 as potential locations for additional parking provision
· Areas within the highway boundary where coach stands could be provided either on the existingcarriageway or in newly constructed laybys.
7.5.3 The use of any existing car parks was immediately ruled out as the parking data shows that other thanpossibly Waugh Place and Castlegate Long Stay / Overflow they simply do not have any spare capacity togive over to coach parking. Even Castlegate Long Stay / Overflow exceeded the 85% occupancyrecommended for efficient operation on one of the survey days. Considering this, the potential loss of theoverflow parking area and the safety and congestion issues associated with introducing coaches into analready busy car park where cars and pedestrians already converge at a single access point off a main road,the use of Castlegate car park for coach parking was not considered further. Waugh Place car park was alsodiscounted as it is too small to accommodate coach parking.
7.5.4 Of the six sites identified in Section 7.1 as potential additional parking provision sites the Quayside and YouthCentre sites were rejected due to the narrow accesses unsuitable for coaches. The land to east of Parade carpark, the land at 76 Ravensdowne and Palace Street Garage sites were rejected due to their distance from themajor vehicular routes through Berwick and the route coaches would have to take to reach them along narrowresidential streets. The land to north of Castle Terrace/Castlegate junction site was rejected due to its distancefrom the main shopping streets, tourist attractions and toilet/eating/drinking facilities.
7.5.5 Two potential locations for coach parking provision within the existing highway boundary were identified usingthe above desirable attributes. Coach parking provision within the highway boundary will minimise coachparking manoeuvres, eliminate the need for coaches to reverse and minimise the travel distance from themain highway to the coach parking facility, however there are a limited number of locations where a coachparking facility can be fitted within the existing highway boundary without an unacceptable level of detriment toother existing facilities within the highway. The two identified locations were Golden Square and Castlegatebetween High Greens and Castlegate car park access. These are discussed below:
Golden Square
7.5.6 Coach parking could be provided on Golden Square through narrowing of sections of the wide footway toprovide coach layby parking. A northbound facility could be provided to the east of the existing bus layby and asouthbound facility could be provided to the west of the existing bus layby. This would provide a facility forcoaches travelling in both directions. It would also provide a parking point very close to the main shoppingstreets and tourist attractions. .It is also approximately 200m walking distance from both the Castlegate andEastern Lane public toilets.
7.5.7 This option would lead to a narrowing of the wide footways on Golden Square over two lengths of around 30m,as has already been done for the two bus laybys here.
Castlegate between High Greens and Castlegate Car Park
7.5.8 The ideal location on Castlegate for coach parking would be near to Castlegate car park so it would be asclose as possible to the toilet facilities here and the main shopping streets and tourist attractions of Berwick. Asingle coach layby could be provided on Castlegate by narrowing a section of the western footway and thetraffic lane widths, and by moving the signalised pedestrian crossing approximately 20m to the north. Thelayby would ideally be provided on the southbound side of the road for easy access to the Castlegate car parkfacilities but parked coaches here would have a detrimental effect on visibility for vehicles exiting the car park,so the northbound side would be a better location. Provision for a second coach could be made here but onlywith the loss of the four short stay parking bays to the north and by having the signalised crossing between thetwo parking laybys.

AECOMBerwick-upon-Tweed Parking Study
61
7.6 Disabled Parking Spaces7.6.1 The provision of disabled bays across the Northumberland County Council car parks is approximately in line
with commonly used standards, as is the on-street provision in the town centre. However on Main Streetbetween West End and Prince Edward Road where 40 short stay or short stay/resident bays are provided,there are no disabled parking bays. It is recommended that two disabled bays be provided here.
7.7 Electric Vehicle Charging Spaces7.7.1 There is currently just one electric vehicle charging space within the study area, located in the Berwick
Infirmary Maternity Unit car park. With a view to the projected rapid increase in electric vehicle use it isrecommended that further spaces be provided across the larger Northumberland County Council public carparks including Castlegate, Quayside and Parade. Initially two bays could be provided in each car park to helpmeet current and potential future demand.
7.8 Car Parks Condition7.8.1 It is recommended that the following actions be carried out to address identified issues regarding the condition
of existing car parks:
· Quayside Remark disabled bays
· Foul Ford Redo all markings
· Waugh Place Redo all markings
· Parade Redo all markings
7.9 Signing to Parking Areas7.9.1 It is recommended that the following be carried out to address identified deficiencies in the existing signing to
car parks.
· Provide signing to Quayside parking at the junction of Marygate / Golden Square for trafficapproaching from the north.
7.10 Pedestrian Routes7.10.1 It is recommended that the following be carried out to address identified deficiencies in the existing pedestrian
routes between the main shopping streets and car parks:
· Provide a raised pedestrian route through Castlegate long stay and short stay car parks connecting tothe existing section of footway outside the public conveniences.
· Provide a marked pedestrian crossing point on a ramp raised to footway level in Castlegate car parkfrom the footway in front of B&M Bargains access steps to the footway on the opposite side of thevehicular access.
· If possible ensure that a footway is provided on the north side of Driver’s Lane as part of the proposedPremier Inn development.

AECOMHartlepool Pedestrian Connectivity Improvements
62
Figures

AECOMBerwick-upon-Tweed Parking Study
63
Figures

AECOMBerwick-upon-Tweed Parking Study
64
Appendices

AECOMBerwick-upon-Tweed Parking Study
65
APPENDIX A – Existing Parking Capacity Schedule

Name
Unrestricted Residents Only Resi or 1 hr Resi or 2hr Resi or 3hrShort Stay
20minShort Stay 30
minShort stay
1hrShort Stay 2hr
Short Stay3hr
Short Stay 4hrPay &
DisplayDisabled EV P & C Staff Loading Taxi Total MC BC Locker BC Stand
Car ParksPublic Car Parks - NCCBerwick Railway Station Short Stay 10 10Berwick Railway Station Long Stay 110 6 116 16Bridge Street 45 3 48 5 8Eastern Lane 43 7 5 55Castlegate Short Stay 100 5 105 9 6Castlegate Long Stay 72 72Castlegate Overflow 141 141Waugh Place 10 2 12Woolmarket 4 2 6Coxons Lane 55 55Foul Ford 30 30Parade 74 4 78Quayside 124 4 128
Private Car Parks In Public Use / Use Specific Car ParksAsda 136 6 5 147Berwick Infirmary - Maternity Unit 25 1 26Berwick Infirmary - Mather Unit 4 4 4 12Berwick Infirmary - Infirmary Unit 26 26Berwick Infirmary - Minor Injuries Unit 10 2 12
On-Street Parking & Adjacent Parking AreasMajor Roads Where Parking is Unlikely / ForbiddenCastlegate (Castle Terrace to High Greens) 0 0Royal Tweed Bridge 0 0Berwick Bridge 0 0Golden Square 0 0Main Street (Prince Edward Road to Church Road) 0 0
Major Roads Where Parking is AllowedCastlegate (High Greens to Marygate) 8 7 28 4 27 74Marygate 6 18 4 28Prince Edward Road 14 14Main Street (West End to Prince Edward Road) 12 7 15 25 59Main Street (Church Road to Mount Road) 16 16
NorthwestCastle Drive 94 94Castle Terrace 19 13 32Windsor Crescent 48 48North Road 37 37
NorthNorthumberland Avenue 25 15 40Warkworth Terrace 28 28Percy Terrace 10 10Lovaine Terrace 20 20Back alleys between Warkworth Terrace and Lovaine Terrace 19 19
CentralHigh Greens 18 18Low Greens 24 52 76Back Alley from Low Greens to Lord's Mount 0 0Violet Terrace 8 8Bell Tower Place 0 0Bell Tower Park 24 24Lords Mount 15 15Castlegate Court 35 35Brucegate 3 13 5 21Well Close Square 2 20 22Ivy Place 0Scott's Place 0 0
StationRailway Street 0 0Tweed Street 14 14
East 1Walkergate 5 5Hatters Lane 3 3Coxons Lane 6 6Wallace Green 4 62 66Chapel Street 8 8Crawford's Alley 0 0Church Street 13 18 31Parade 12 12Ravensdowne 54 54Woolmarket 7 7
East 2Bank Hill 1 1West Street 0 0Easter Wynd 0 0Eastern Lane 7 7Love Lane 0 0Bridge Terrace 5 5Bridge End 0Bridge Street 0 0Drivers Lane 0 0Dewars Lane 1 1
East 3Hide Hill 42 42Sandgate 25 25Silver Street 0 0Ness Street 2 6 8Weddell's Lane 0 0Foul Ford 0 0Oil Mill Lane 2 2Palace Street 47 1 48Palace Green 28 28Palace Street East 18 18The Avenue 3 3
West 1Blakewell Gardens 30 30Riverside Road 30 3 33Bower's Crescent 16 16Blakewell Road 25 7 32West End to west of southern junction with Blakewell Road & West End Parking Area 42 42West End to south of southern junction with Blakewell Road 21 10 31
West 2Union Brae 0 0Kiln Hill 32 32Dock Road 117 117Mill Strand 20 20Brewery Lane 9 9Brewery Bank 9 9Church Road 46 46Well Square 16 16Lee's Lane 3 3Tower Road 16 16Well Road 3 3Mount Road 35 35
Totals 1326 453 28 37 13 10 4 122 267 183 0 165 55 1 5 5 18 9 2701 14 0 30
No of Spaces 2-wheel Vehicle Spaces

AECOMBerwick-upon-Tweed Parking Study
66
APPENDIX B – Existing Parking Situation Analysis

AECOMBerwick-upon-Tweed Parking Study
67
9.1 Introduction9.1.1 In order to establish the existing parking situation within the study area in a neutral month, parking surveys
were carried out on Wednesday 15th March 2017, a market day, Thursday 16th March 2017, a neutralweekday, and Saturday 18th March 2017 by survey specialists Streetwise Services.
9.1.2 To establish the existing parking situation in the peak summer period, further surveys were then carried out onWednesday 5th July 2017, a market day, Thursday 6th July 2017, a neutral weekday, and Saturday 8th July2017.
9.1.3 The surveys were between 0700 and 1900 on each day. The numbers and stay durations of parked vehicleswere recorded using registration matching during hourly beat surveys.
9.2 Analysis9.2.1 The parking survey data was analysed to determine the maximum occupancy and how occupancy varied
through the day and between the six surveyed days. This was done for each of the car parks and on-streetparking sub groups described in section 2.2, and for individual car parks and streets.
9.2.2 The average stay duration was also determined for the sub groups and for individual car parks and streets forthe three surveyed days.
9.2.3 Parking occupancy and duration of stays for each car park category and each area of on-street parking arediscussed in the following sections. Tables are given for each area summarising maximum occupancy andduration of stay data.
9.2.4 Figures 6 to 11 show diagrammatically how maximum occupancy varies across the study area on each of thestudied days.
NCC Public Car ParksOccupancy – March Surveys
9.2.5 The table below shows the maximum occupancy observed in each car park across each survey day for theMarch 2017 surveys.
Name CapacityMax Occ Max % Occ Unused Spaces
Wed Thu Sat Wed Thu Sat Wed Thu SatBerwick Railway Station 126 121 131 96 96% 104% 76% 5 -5 30Bridge Street (Short Stay) 48 29 33 47 60% 69% 98% 19 15 1Eastern Lane (Short Stay) 55 65 66 66 118% 120% 120% -10 -11 -11Castlegate Short Stay 105 99 96 103 94% 91% 98% 6 9 2Castlegate LongStay/Overflow 213 184 182 179 86% 85% 84% 29 31 34
Waugh Place (Short Stay) 12 10 10 10 83% 83% 83% 2 2 2Woolmarket (Short Stay) 6 6 6 6 100% 100% 100% 0 0 0Coxons Lane 55 57 56 56 104% 102% 102% -2 -1 -1Foul Ford 30 29 30 28 97% 100% 93% 1 0 2Parade 78 77 76 78 99% 97% 100% 1 2 0Quayside 128 124 119 97 97% 93% 76% 4 9 31Total 856 801 805 766 94% 94% 89% 55 51 90
9.2.6 On the Wednesday 3 car parks reached maximum capacity, these were Eastern Lane, which reached 118% ofcapacity, Woolmarket and Coxons Lane. Foul Ford, Parade and Quayside car parks were all over 95% of

AECOMBerwick-upon-Tweed Parking Study
68
capacity and Castlegate Long Stay/Overflow was over 85% of capacity, the maximum recommended forefficient operation of a car park. Bridge Street had the lowest maximum occupancy at 60%.
9.2.7 On the Thursday 5 car parks reached full capacity and these were Berwick Railway Station, Eastern Lane,Woolmarket, Coxons Lane and Foul Ford. Parade car park was over 95% capacity and Castlegate Short Stayand Quayside were over 85%. The lowest occupancy was Bridge Street at 69%.
9.2.8 On the Saturday 4 car parks were at full capacity and these were Eastern Lane, Woolmarket, Coxons Laneand Parade. Both Bridge Street and Castlegate Short Stay car parks were over 95% capacity and Foul Fordwas over 85%. Quayside car park had the lowest maximum occupancy at 76%.
9.2.9 Further occupancy analysis was carried out to identify the maximum occupancy that occurred across all of thecar parks combined, on each of the three survey days. The maximum occupancy that occurred in each carpark at the time of maximum occupancy across all of the car parks combined is shown in the table below foreach survey day.
Name CapacityMax Occ Max % Occ Unused Spaces
Wed Thu Sat Wed Thu Sat Wed Thu SatBerwick Railway Station 126 121 124 96 96% 98% 76% 5 2 30Bridge Street (Short Stay) 48 27 31 40 56% 65% 83% 21 17 8Eastern Lane (Short Stay) 55 56 59 66 102% 107% 120% -1 -4 -11Castlegate Short Stay 105 99 94 97 94% 90% 92% 6 11 8Castlegate LongStay/Overflow 213 184 182 179 86% 85% 84% 29 31 34
Waugh Place (Short Stay) 12 8 10 10 67% 83% 83% 4 2 2Woolmarket (Short Stay) 6 6 5 6 100% 83% 100% 0 1 0Coxons Lane 55 56 56 54 102% 102% 98% -1 -1 1Foul Ford 30 29 30 28 97% 100% 93% 1 0 2Parade 78 77 76 76 99% 97% 97% 1 2 2Quayside 128 120 119 97 94% 93% 76% 8 9 31Total 856 783 786 749 91% 92% 88% 73 70 107
9.2.10 It can be seen that the maximum occupancy across all the car parks on the Wednesday was 91% whichoccurred between 1000 and 1100. At this time there were 73 unused spaces with 29 of these being inCastlegate Long Stay/Overflow and 21 being in Bridge Street.
9.2.11 On the Thursday the maximum occupancy across all car parks was 92% which occurred between 1100 and1200. At this time there were 70 unused spaces with 31 of these being in Castlegate Long Stay/Overflow and17 being in Bridge Street.
9.2.12 On the Saturday the maximum occupancy across all car parks was 88% which occurred between 1200 and1300. At this time there were 107 unused spaces with 34 of these being in Castlegate Long Stay/Overflow, 31being in Quayside and 30 being in Berwick Railway Station.
9.2.13 Overall key findings from analysis of the March occupancy surveys are as follows:
· 6 of the 11 car parks reached capacity on at least one of the surveyed days.· 9 of the 11 car parks exceeded 95% capacity on at least one of the surveyed days.· 10 of the 11 car parks exceeded 85% capacity, the maximum recommended for efficient operation, on
at least one of the surveyed days; the exception being Waugh Place which only has 12 spaces andreached 83% occupancy.
· Across all the car parks, the highest combined occupancy occurred on the Thursday between 1100and 1200 and was 92%.

AECOMBerwick-upon-Tweed Parking Study
69
· Across all the car parks the combined occupancy exceeded the recommended 85% maximum forefficient operation on all three of the surveyed days.
· Bridge Street is relatively underused on weekdays but reaches close to capacity on a Saturday.· Berwick Railway Station and Quayside car parks have significantly lower maximum occupancies on a
Saturday than weekdays indicating that a high proportion of weekday users are employees.
Occupancy – July Surveys
9.2.14 The table below shows the maximum occupancy observed in each car park across each survey day for theJuly 2017 surveys.
Name CapacityMax Occ Max % Occ Unused Spaces
Wed Thu Sat Wed Thu Sat Wed Thu SatBerwick Railway Station 126 134 130 114 106% 103% 91% -8 -4 12Bridge Street (Short Stay) 48 47 44 30 98% 92% 63% 1 4 18Eastern Lane (Short Stay) 55 63 64 62 115% 116% 113% -8 -9 -7Castlegate Short Stay 105 108 104 105 103% 99% 100% -3 1 0Castlegate LongStay/Overflow 213 181 179 177 85% 84% 83% 32 34 36
Waugh Place (Short Stay) 12 11 11 10 92% 92% 83% 1 1 2Woolmarket (Short Stay) 6 7 6 7 117% 100% 117% -1 0 -1Coxons Lane 55 56 56 51 102% 102% 93% -1 -1 4Foul Ford 30 30 30 29 100% 100% 97% 0 0 1Parade 78 78 77 77 100% 99% 99% 0 1 1Quayside 128 127 125 96 99% 98% 75% 1 3 32Total 856 842 826 758 98% 96% 89% 14 30 98
9.2.15 On the Wednesday 7 out of the 11 car parks reached maximum capacity and these were Berwick RailwayStation and Eastern Lane, Castlegate Short Stay, Woolmarket, Coxons Lane, Foul Ford and Parade. 5 out ofthe 11 were over capacity with Woolmarket reaching 117% of capacity. Of the 4 car parks that did not reachcapacity Bridge Street and Quayside reached over 95% of capacity and Waugh Place reached over 85% ofcapacity.
9.2.16 On the Thursday 5 car parks reached maximum capacity and these were Berwick Railway Station, EasternLane, Woolmarket, Coxons Lane and Foul Ford. 3 of these were over capacity with Eastern Lane reaching116% of capacity. Castlegate short stay, Parade and Quayside reached over 95% of capacity and BridgeStreet and Waugh Place reached over 85% of capacity.
9.2.17 On the Saturday 2 car parks reached capacity and these were Eastern Lane and Woolmarket. Both were overcapacity with Woolmarket reaching 117%. Castlegate Short Stay, Foul Ford and Parade reached over 95% ofcapacity and Berwick Railway Station and Coxon’s Lane reached over 85% of capacity.
9.2.18 Further occupancy analysis was carried out to identify the maximum occupancy that occurred across all of thecar parks combined, on each of the three survey days. The maximum occupancy that occurred in each carpark at the time of maximum occupancy across all of the car parks combined is shown in the table below foreach survey day.
Name Capacity Max Occ Max % Occ Unused Spaces
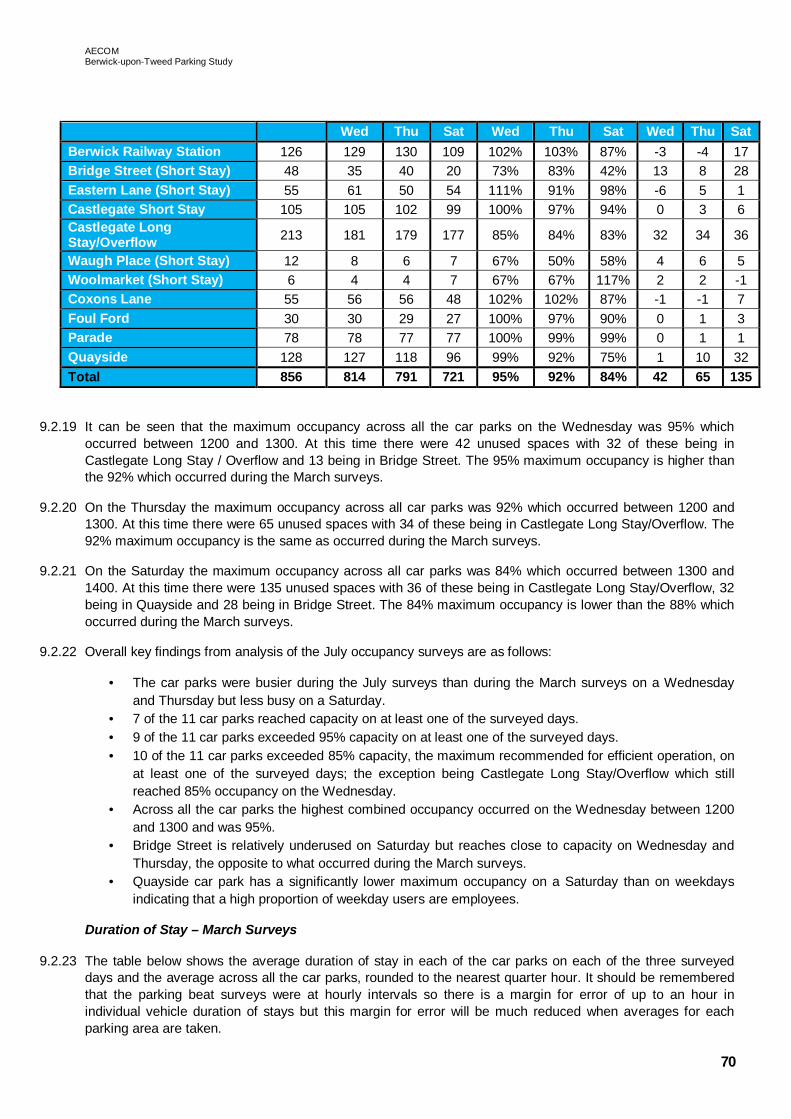
AECOMBerwick-upon-Tweed Parking Study
70
Wed Thu Sat Wed Thu Sat Wed Thu SatBerwick Railway Station 126 129 130 109 102% 103% 87% -3 -4 17Bridge Street (Short Stay) 48 35 40 20 73% 83% 42% 13 8 28Eastern Lane (Short Stay) 55 61 50 54 111% 91% 98% -6 5 1Castlegate Short Stay 105 105 102 99 100% 97% 94% 0 3 6Castlegate LongStay/Overflow 213 181 179 177 85% 84% 83% 32 34 36
Waugh Place (Short Stay) 12 8 6 7 67% 50% 58% 4 6 5Woolmarket (Short Stay) 6 4 4 7 67% 67% 117% 2 2 -1Coxons Lane 55 56 56 48 102% 102% 87% -1 -1 7Foul Ford 30 30 29 27 100% 97% 90% 0 1 3Parade 78 78 77 77 100% 99% 99% 0 1 1Quayside 128 127 118 96 99% 92% 75% 1 10 32Total 856 814 791 721 95% 92% 84% 42 65 135
9.2.19 It can be seen that the maximum occupancy across all the car parks on the Wednesday was 95% whichoccurred between 1200 and 1300. At this time there were 42 unused spaces with 32 of these being inCastlegate Long Stay / Overflow and 13 being in Bridge Street. The 95% maximum occupancy is higher thanthe 92% which occurred during the March surveys.
9.2.20 On the Thursday the maximum occupancy across all car parks was 92% which occurred between 1200 and1300. At this time there were 65 unused spaces with 34 of these being in Castlegate Long Stay/Overflow. The92% maximum occupancy is the same as occurred during the March surveys.
9.2.21 On the Saturday the maximum occupancy across all car parks was 84% which occurred between 1300 and1400. At this time there were 135 unused spaces with 36 of these being in Castlegate Long Stay/Overflow, 32being in Quayside and 28 being in Bridge Street. The 84% maximum occupancy is lower than the 88% whichoccurred during the March surveys.
9.2.22 Overall key findings from analysis of the July occupancy surveys are as follows:
· The car parks were busier during the July surveys than during the March surveys on a Wednesdayand Thursday but less busy on a Saturday.
· 7 of the 11 car parks reached capacity on at least one of the surveyed days.· 9 of the 11 car parks exceeded 95% capacity on at least one of the surveyed days.· 10 of the 11 car parks exceeded 85% capacity, the maximum recommended for efficient operation, on
at least one of the surveyed days; the exception being Castlegate Long Stay/Overflow which stillreached 85% occupancy on the Wednesday.
· Across all the car parks the highest combined occupancy occurred on the Wednesday between 1200and 1300 and was 95%.
· Bridge Street is relatively underused on Saturday but reaches close to capacity on Wednesday andThursday, the opposite to what occurred during the March surveys.
· Quayside car park has a significantly lower maximum occupancy on a Saturday than on weekdaysindicating that a high proportion of weekday users are employees.
Duration of Stay – March Surveys
9.2.23 The table below shows the average duration of stay in each of the car parks on each of the three surveyeddays and the average across all the car parks, rounded to the nearest quarter hour. It should be rememberedthat the parking beat surveys were at hourly intervals so there is a margin for error of up to an hour inindividual vehicle duration of stays but this margin for error will be much reduced when averages for eachparking area are taken.

AECOMBerwick-upon-Tweed Parking Study
71
NameAvg. Duration of Stay
(Hours)Wed Thu Sat
Berwick Railway Station 8.75 8 6.25Bridge Street (Short Stay) 2.25 1.75 2.25Eastern Lane (Short Stay) 2 2 1.75Castlegate Short Stay 1.5 1.5 1.5Castlegate Long Stay/Overflow 7 6.75 4.75Waugh Place (Short Stay) 2.5 2.75 2Woolmarket (Short Stay) 2.25 2.5 4Coxons Lane 7.5 7.75 5.25Foul Ford 6.25 7.25 5.5Parade 6.5 7 6.25Quayside 5.75 7 5Average 4.75 5 4
9.2.24 The average duration of stay varies greatly between different car parks with, as would be expected, the carparks with short stay restrictions all having lower duration of stays than all of the car parks without stayrestrictions. Castlegate short stay car park has the shortest average duration of stay on all three days at 1.5hours. Berwick Railway Station car park has the longest average duration of stay on all three days, probablydue to a high proportion of commuters / employees parking for long durations.
9.2.25 The average duration of stays across all car parks are 4.75 hours on a Wednesday, 5 hours on a Thursdayand 4 hours on a Saturday. The shorter duration on a Saturday is probably due to there being a smallerproportion of commuters/employees parking for long stays than during the week.
9.2.26 The average duration of stay for Bridge Street car park on a Wednesday and a Saturday is slightly longer thanthe permitted maximum stay of 2 hours however this is due to the restriction not applying to the 3 disabledspaces in the car park which were occupied for long stay durations which increased the overall average for thecar park. Without inclusion of the disabled bays, the average duration of stay for Bridge Street car park was1.75 hours on all three survey days.
9.2.27 The average duration of stay for Woolmarket car park on a Saturday is significantly longer than the permittedmaximum stay of 3 hours. There are 2 disabled spaces within the car park which permit longer stays but evenwith these bays excluded the average duration is significantly longer than the permitted maximum stay. In allother car parks with short stay restrictions the average duration of stay was less than the permitted maximumstay length.
Duration of Stay – July Surveys
9.2.28 The table below shows the average duration of stay in each of the car parks on each of the three surveyeddays and the average across all the car parks, rounded to the nearest quarter hour.
Name Avg. Duration of Stay

AECOMBerwick-upon-Tweed Parking Study
72
(Hours)Wed Thu Sat
Berwick Railway Station 7.75 8 7.25Bridge Street (Short Stay) 1.75 1.75 2Eastern Lane (Short Stay) 2 2 2.25Castlegate Short Stay 1.5 1.5 1.5Castlegate Long Stay/Overflow 7.5 7.25 5.5Waugh Place (Short Stay) 2 2 2.25Woolmarket (Short Stay) 2.5 2.5 4.25Coxons Lane 7.75 7.25 5.5Foul Ford 7.75 8 7.25Parade 6 5.75 5.5Quayside 6.25 5.75 4.5Average 4.75 4.75 4.25
9.2.29 As with the March surveys the average duration of stay varies greatly between different car parks with, aswould be expected, the car parks with short stay restrictions all having lower duration of stays than all of thecar parks without stay restrictions. Castlegate short stay car park again has the shortest average duration ofstay on all three days at 1.5 hours. Berwick Railway Station car park again has the longest average duration ofstay on all three days, probably due to a high proportion of commuters / employees parking for long durations.
9.2.30 The average duration of stays across all car parks are very similar to those from the March surveys at 4.75hours on a Wednesday, 4.75 hours on a Thursday and 4.25 hours on a Saturday.
9.2.31 The average duration of stay for Eastern Lane car park on a Saturday is slightly longer than the permittedmaximum stay of 2 hours however this is due to the restriction not applying to the 7 disabled spaces and 5staff parking spaces within the car park. Without these bays included the average duration of stay drops to thepermitted 2 hours.
9.2.32 As in March, the average duration of stay for Woolmarket car park on a Saturday is significantly longer thanthe permitted maximum stay of 3 hours even with the disabled bays excluded. In all other car parks with shortstay restrictions the average duration of stay was less than the permitted maximum stay length.
Issues
9.2.33 The parking surveys indicate that the NCC Public Car Parks do not have sufficient capacity to cope with thecurrent demand. Seven car parks reached or exceeded capacity on at least one of the surveyed days, nineexceeded 95% occupancy on at least one of the surveyed days and all eleven exceeded 85% occupancy, themaximum recommended for efficient operation, on at least one of the surveyed days. As all the car parkssuffer capacity issues at some time, simply encouraging motorists to use less busy car parks as oppose to thebusiest car parks is not an option.
9.2.34 During the Saturday parking surveys a number of vehicles parked in Woolmarket car park for significantlylonger than the permitted maximum stay of 3 hours.
Private Car Parks in Public Use / Use Specific Car ParksOccupancy – March Surveys
9.2.35 The table below shows the maximum occupancy observed in each car park across each survey day for theMarch 2017 surveys.

AECOMBerwick-upon-Tweed Parking Study
73
Name CapacityMax Occ Max % Occ Unused Spaces
Wed Thu Sat Wed Thu Sat Wed Thu SatASDA Car Park 147 96 87 99 65% 59% 67% 51 60 48Berwick Infirmary -Maternity Unit 26 21 20 9 81% 77% 35% 5 6 17
Berwick Infirmary -Mather Unit 12 14 15 4 117% 125% 33% -2 -3 8
Berwick Infirmary –Infirmary Unit 26 24 25 15 92% 96% 58% 2 1 11
Berwick Infirmary –Minor Injuries Unit 12 7 8 7 58% 67% 58% 5 4 5
Total 223 162 155 134 73% 70% 60% 61 68 89
9.2.36 It can be seen that the Asda car park remains well below the recommended maximum occupancy for efficientoperation of 85% on all of the three surveyed days with the maximum occupancy being 67% on the Saturday.
9.2.37 At Berwick Infirmary the Mather Unit car park exceeds capacity on the Wednesday and Thursday and theInfirmary Unit car park exceeds 95% occupancy on the Thursday and exceeds 85% occupancy on theWednesday. The Mather Unit car park exceeds capacity due to vehicles being parked in areas not designatedas parking spaces.
9.2.38 The Berwick Infirmary car parks are busier on weekdays with plenty of spare capacity on a Saturday.
Occupancy – July Surveys
9.2.39 The table below shows the maximum occupancy observed in each car park across each survey day for theJuly 2017 surveys.
Name CapacityMax Occ Max % Occ Unused Spaces
Wed Thu Sat Wed Thu Sat Wed Thu SatASDA Car Park 147 85 98 106 58% 67% 72% 62 49 41Berwick Infirmary -Maternity Unit 26 19 19 6 73% 73% 23% 7 7 20
Berwick Infirmary -Mather Unit 12 12 12 3 100% 100% 25% 0 0 9
Berwick Infirmary –Infirmary Unit 26 25 25 13 96% 96% 50% 1 1 13
Berwick Infirmary –Minor Injuries Unit 12 6 7 4 50% 58% 33% 6 5 8
Total 223 147 161 132 66% 72% 59% 76 62 91
9.2.40 It can be seen that the Asda car park again remains well below the recommended maximum occupancy forefficient operation of 85% on all of the three surveyed days with the maximum occupancy being 72% on theSaturday. The maximum occupancies on Thursday and Saturday are higher than during the March surveysbut the Wednesday maximum occupancy is lower.
9.2.41 At Berwick Infirmary the Mather Unit car park reaches capacity on the Wednesday and Thursday and theInfirmary unit car park exceeds 95% occupancy on the Wednesday and Thursday.
9.2.42 As for the March surveys the Berwick Infirmary car parks are busier on weekdays with plenty of spare capacityon a Saturday.
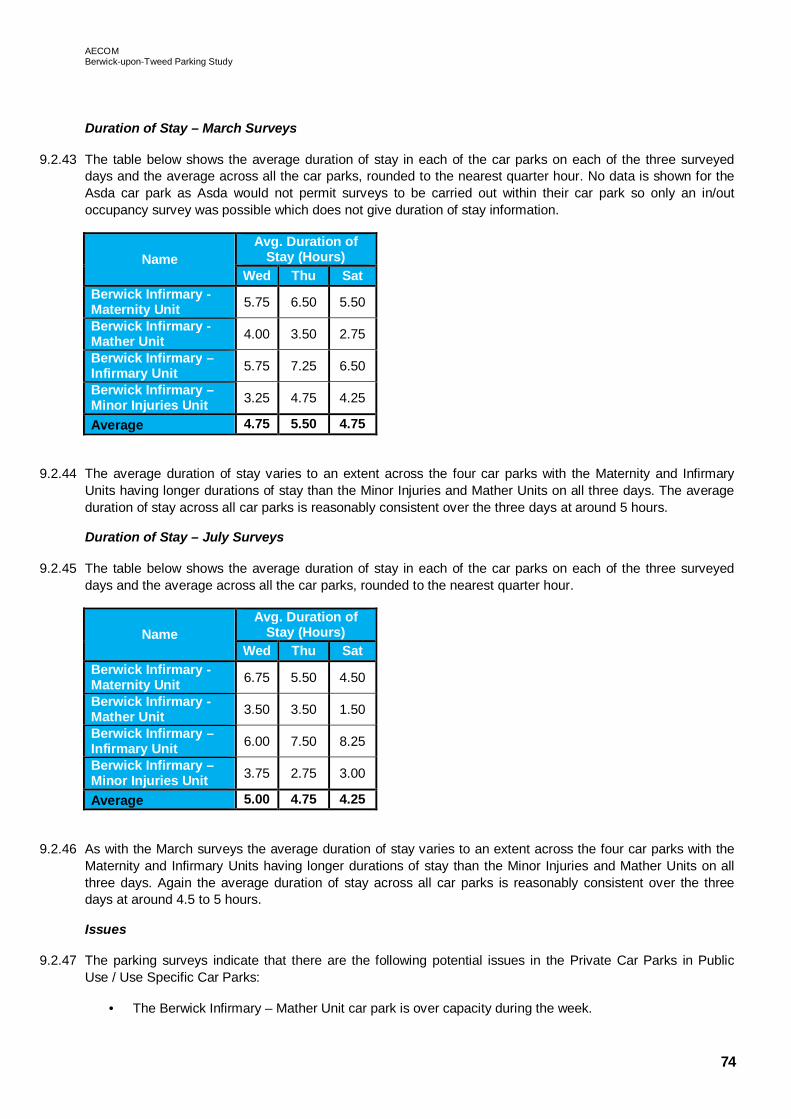
AECOMBerwick-upon-Tweed Parking Study
74
Duration of Stay – March Surveys
9.2.43 The table below shows the average duration of stay in each of the car parks on each of the three surveyeddays and the average across all the car parks, rounded to the nearest quarter hour. No data is shown for theAsda car park as Asda would not permit surveys to be carried out within their car park so only an in/outoccupancy survey was possible which does not give duration of stay information.
NameAvg. Duration of
Stay (Hours)Wed Thu Sat
Berwick Infirmary -Maternity Unit 5.75 6.50 5.50
Berwick Infirmary -Mather Unit 4.00 3.50 2.75
Berwick Infirmary –Infirmary Unit 5.75 7.25 6.50
Berwick Infirmary –Minor Injuries Unit 3.25 4.75 4.25
Average 4.75 5.50 4.75
9.2.44 The average duration of stay varies to an extent across the four car parks with the Maternity and InfirmaryUnits having longer durations of stay than the Minor Injuries and Mather Units on all three days. The averageduration of stay across all car parks is reasonably consistent over the three days at around 5 hours.
Duration of Stay – July Surveys
9.2.45 The table below shows the average duration of stay in each of the car parks on each of the three surveyeddays and the average across all the car parks, rounded to the nearest quarter hour.
NameAvg. Duration of
Stay (Hours)Wed Thu Sat
Berwick Infirmary -Maternity Unit 6.75 5.50 4.50
Berwick Infirmary -Mather Unit 3.50 3.50 1.50
Berwick Infirmary –Infirmary Unit 6.00 7.50 8.25
Berwick Infirmary –Minor Injuries Unit 3.75 2.75 3.00
Average 5.00 4.75 4.25
9.2.46 As with the March surveys the average duration of stay varies to an extent across the four car parks with theMaternity and Infirmary Units having longer durations of stay than the Minor Injuries and Mather Units on allthree days. Again the average duration of stay across all car parks is reasonably consistent over the threedays at around 4.5 to 5 hours.
Issues
9.2.47 The parking surveys indicate that there are the following potential issues in the Private Car Parks in PublicUse / Use Specific Car Parks:
· The Berwick Infirmary – Mather Unit car park is over capacity during the week.

AECOMBerwick-upon-Tweed Parking Study
75
· The Berwick Infirmary – Infirmary Unit car park operated close to capacity and above the 85%occupancy recommended for efficient operation during the week.
9.2.48 However given that the Minor Injuries Unit car park is very close to the Mather Unit car park and has sparecapacity during the week and that the Maternity Unit car park is very close to the Infirmary Unit car park andhas spare capacity during the week it is not considered that these currently represent serious issues that needaddressing.
On-Street Parking & Adjacent Parking Areas – Major Roads Where Forbidden/UnlikelyOccupancy – March Surveys
9.2.49 The table below shows the maximum occupancy observed on each street on each survey day for the March2017 surveys.
9.2.50 It can be seen that the only parking occurring on these roads is on Golden Square which reached a maximumoccupancy of four vehicles on the Thursday and Saturday. It is thought that this parking is a mixture ofvehicles parking on the wide footways / vehicular access along Golden Square and loading by vehiclesparking on the double yellow lines.
Occupancy – July Surveys
9.2.51 The table below shows the maximum occupancy observed on each street on each survey day for the July2017 surveys.
Name CapacityMax Occ Max % Occ Unused Spaces
Wed Thu Sat Wed Thu Sat Wed Thu SatCastlegate (CastleTerrace to High Greens) 0 0 0 0 N/A N/A N/A 0 0 0
Royal Tweed Bridge 0 0 0 0 N/A N/A N/A 0 0 0Berwick Bridge 0 0 0 0 N/A N/A N/A 0 0 0Golden Square 0 2 4 4 N/A N/A N/A -2 -4 -4Main Street (PE Rd toChurch Rd) 0 0 0 0 N/A N/A N/A 0 0 0
Total 0 2 4 4 N/A N/A N/A -2 -4 -4
Name CapacityMax Occ Max % Occ Unused Spaces
Wed Thu Sat Wed Thu Sat Wed Thu SatCastlegate(Castle Terraceto High Greens)
0 0 0 0 N/A N/A N/A 0 0 0
Royal TweedBridge 0 0 0 0 N/A N/A N/A 0 0 0
Berwick Bridge 0 0 0 0 N/A N/A N/A 0 0 0Golden Square 0 4 2 1 N/A N/A N/A -4 -2 -1Main Street (PERd to ChurchRd)
0 0 0 0 N/A N/A N/A 0 0 0
Total 0 4 2 1 N/A N/A N/A -4 -2 -1

AECOMBerwick-upon-Tweed Parking Study
76
9.2.52 Again the only parking occurring on these roads is on Golden Square which reached a maximum of fourvehicles on the Wednesday.
Duration of Stay – March Surveys
9.2.53 The table below shows the average duration of stay on each street on each of the three surveyed days andthe average across all the streets, rounded to the nearest quarter hour.
NameAverage Duration of Stay
(hrs)Wed Thurs Sat
Castlegate (CastleTerrace to High Greens) N/A N/A N/A
Royal Tweed Bridge N/A N/A N/ABerwick Bridge N/A N/A N/AGolden Square 2.25 1.75 1.5Main Street (PE Rd toChurch Rd) N/A N/A N/A
Average Stay N/A N/A N/A
9.2.54 The vehicles parking on Golden Square had reasonable short durations of stay which averaged from 1.5 hoursto 2.25 hours across the three survey days.
Duration of Stay – July Surveys
9.2.55 The table below shows the average duration of stay on each street on each of the three surveyed days andthe average across all the streets, rounded to the nearest quarter hour.
NameAverage Duration of Stay
(hrs)Wed Thurs Sat
Castlegate (CastleTerrace to High Greens) N/A N/A N/A
Royal Tweed Bridge N/A N/A N/ABerwick Bridge N/A N/A N/AGolden Square 2 1 1Main Street (PE Rd toChurch Rd) N/A N/A N/A
Average Stay N/A N/A N/A
9.2.56 Again the vehicles parking on Golden Square had reasonable short durations of stay which averaged from 1hour to 2 hours across the three survey days.
Issues
9.2.57 The parking surveys indicate that there are the following potential issues with parking on major roads whereparking is forbidden / unlikely:
· Some vehicles are parking on the wide footways on Golden Square.

AECOMBerwick-upon-Tweed Parking Study
77
On-Street Parking & Adjacent Parking Areas – Major Roads Where Parking AllowedOccupancy – March Surveys
9.2.58 The table below shows the maximum occupancy observed on each street on each survey day for the March2017 surveys.
Name CapacityMax Occ Max % Occ Unused Spaces
Wed Thu Sat Wed Thu Sat Wed Thu SatCastlegate (HighGreens to Marygate) 74 84 68 56 114% 92% 76% -10 6 18
Marygate 28 23 16 18 82% 57% 64% 5 12 10Prince Edward Road 14 13 12 12 93% 86% 86% 1 2 2Main Street (West Endto Prince Edward Road) 59 48 38 39 81% 64% 66% 11 21 20
Main Street (ChurchRoad to Mount Road) 16 17 17 18 106% 106% 113% -1 -1 -2
Total 191 185 151 143 97% 79% 75% 6 40 48
9.2.59 Castlegate (High Greens to Marygate) reached an occupancy of 114% on the Wednesday however this wasafter 1800 when the single yellow line restrictions end and the effective capacity will increase significantly.However occupancy did still reach 109% before 1800 indicating that some loading and/or illegal parking musthave been occurring. Main Street (Church Road to Mount Road) exceeded capacity on all three days, hencesome parking must be occurring here in non-designated parking areas. Footway parking on areas of widenedfootway has been observed in this area so this is likely the cause of occupancy exceeding capacity.
9.2.60 Prince Edward Road exceeds the 85% occupancy recommended for efficient operation on all three surveydays and Marygate and Main Street (West End to Prince Edward Road) came close to the 85% on theWednesday.
Occupancy – July Surveys
9.2.61 The table below shows the maximum occupancy observed on each street on each survey day for the July2017 surveys.
Name CapacityMax Occ Max % Occ Unused Spaces
Wed Thu Sat Wed Thu Sat Wed Thu SatCastlegate (HighGreens to Marygate) 74 68 68 70 92% 92% 95% 6 6 4
Marygate 28 16 18 17 57% 64% 61% 12 10 11Prince Edward Road 14 29 17 10 207% 121% 71% -15 -3 4Main Street (West Endto Prince Edward Road) 59 44 46 55 75% 78% 93% 15 13 4
Main Street (ChurchRoad to Mount Road) 16 14 11 14 88% 69% 88% 2 5 2
Total 191 171 160 166 90% 84% 87% 20 31 25
9.2.62 It can be seen that Prince Edward Road greatly exceeded maximum capacity on the weekdays. This occurredat school pick-up/drop-off times and is therefore likely due to school parking. There are wide footways in thearea so this is likely where the parking in excess of capacity is occurring.

AECOMBerwick-upon-Tweed Parking Study
78
9.2.63 Castlegate (High Greens to Marygate) came close to capacity on all three survey days, and this was at timesbefore the single yellow line restrictions had ended. Main Street (West End to Prince Edward Road) and MainStreet (Church Road to Mount Road) both exceeded 85% capacity on at least one of the survey days.
Duration of Stay – March Surveys
9.2.64 The table below shows the average duration of stay on each street on each of the three surveyed days andthe average across all the streets, rounded to the nearest quarter hour.
NameAverage Duration of Stay
(hrs)Wed Thurs Sat
Castlegate (HighGreens to Marygate) 2.5 2 2.25
Marygate 2.25 1.25 1.5Prince Edward Road 3.25 3.25 4Main Street (West Endto Prince Edward Road) 2.5 2.25 2.25
Main Street (ChurchRoad to Mount Road) 3.75 2.75 3.75
Average Stay 2.75 2.25 2.75
9.2.65 Marygate has the shortest average duration of stays which is due to its high proportion of loading and taxibays. Castlegate (High Greens to Marygate) and Main Street (West End to Prince Edward Road) have thenext shortest stays due to the short stay restrictions in place here.
9.2.66 The average duration of stays for all the streets is similar across the three survey days at around 2.5 hours.
Duration of Stay – July Surveys
9.2.67 The table below shows the average duration of stay on each street on each of the three surveyed days andthe average across all the streets, rounded to the nearest quarter hour.
NameAverage Duration of Stay
(hrs)Wed Thurs Sat
Castlegate (HighGreens to Marygate) 2.00 2.00 2.25
Marygate 1.25 1.00 1.25Prince Edward Road 2.50 2.25 2.25Main Street (West Endto Prince Edward Road 2.25 2.25 2.00
Main Street (ChurchRoad to Mount Road) 2.5 2.75 3.25
Average Stay 2 2 2.25
9.2.68 As for the March surveys, Marygate has the shortest duration of stays followed by Castlegate (High Greens toMarygate). The average stay duration on Prince Edward Road is lower than during the March surveys butstays are similar to the July surveys for all other streets.

AECOMBerwick-upon-Tweed Parking Study
79
Issues
9.2.69 The parking surveys indicate that there are the following potential issues on the major roads where parking isallowed:
· Parking exceeds capacity on Main Street (Church Road to Mount Road)· Parking exceeds capacity at school pick-up and drop-off times on Prince Edward Road· Parking exceeds 85% occupancy on Castlegate (High Greens to Marygate) and Main Street (Church
Road to Mount Road)
On-Street Parking & Adjacent Parking Areas – NorthwestOccupancy – March Surveys
9.2.70 The table below shows the maximum occupancy observed on each street on each survey day for the March2017 surveys.
Name CapacityMax Occ Max % Occ Unused Spaces
Wed Thu Sat Wed Thu Sat Wed Thu SatCastle Drive 94 19 19 17 20% 20% 18% 75 75 77Castle Terrace 32 24 24 24 75% 75% 75% 8 8 8WindsorCrescent 48 17 20 20 35% 42% 42% 31 28 28
North Road 37 9 14 22 24% 38% 59% 28 23 15
Total 211 69 77 83 33% 36% 39% 142 134 128
9.2.71 It can be seen that none of the streets reached parking capacity or the 85% maximum occupancyrecommended for efficient operation. The busiest street is Castle Terrace which reached 75% occupancy onall three survey days. The least busy street is Castle Drive which reached a maximum of 20% occupancy.
Occupancy – July Surveys
9.2.72 The table below shows the maximum occupancy observed on each street on each survey day for the July2017 surveys.
Name CapacityMax Occ Max % Occ Unused Spaces
Wed Thu Sat Wed Thu Sat Wed Thu SatCastle Drive 94 19 20 22 20% 21% 23% 75 74 72Castle Terrace 32 28 23 25 88% 72% 78% 4 9 7WindsorCrescent 48 27 26 26 56% 54% 54% 21 22 22
North Road 37 16 15 15 43% 41% 41% 21 22 22
Total 211 90 84 88 43% 40% 42% 121 127 123
9.2.73 During the July surveys Castle Terrace exceeded the 85% threshold on the Wednesday. The other threestreets had relatively low occupancies at all times. It is possible the high occupancy on Castle Terrace is atleast partly due to overspill parking from the train station.

AECOMBerwick-upon-Tweed Parking Study
80
Duration of Stay – March Surveys
9.2.74 The table below shows the average duration of stay on each street on each of the three surveyed days andthe average across all the streets, rounded to the nearest quarter hour.
NameAverage Duration of Stay
(hrs)Wed Thurs Sat
Castle Drive 5.25 4.75 3.5Castle Terrace 7.75 7.5 5.5Windsor Crescent 4.25 4.75 5North Road 2.5 2.75 4.5
Total 5 5 4.75
9.2.75 Castle Terrace has by far the longest duration of stays, especially on weekdays, despite a 3 hour stayrestriction for non-residents in some of its parking areas. This further indicates that overspill parking from thetrain station may be occurring here.
9.2.76 The other three streets have similar durations of stays varying between 2.5 and 5.25 hours across the threesurvey days.
Duration of Stay – July Surveys
9.2.77 The table below shows the average duration of stay on each street on each of the three surveyed days andthe average across all the streets, rounded to the nearest quarter hour.
NameAverage Duration of Stay
(hrs)Wed Thurs Sat
Castle Drive 3.5 5 4.75Castle Terrace 6 6.75 6Windsor Crescent 4 4.25 5.75North Road 3.75 4 5
Total 4.25 5 5.5
9.2.78 Again Castle Terrace has the longest average duration of stays although these are slightly shorter than duringthe March surveys. The other three streets have similar duration of stays varying between 3.5 and 5.75 hours.
Issues
9.2.79 The parking surveys indicate that there are the following potential issues with the on-street parking in thenorthwest area:
· On Castle Terrace parking occupancy exceeded the 85% threshold for efficient operation on one ofthe survey days and was close to it on other days. This may be due to overspill parking from the trainstation.

AECOMBerwick-upon-Tweed Parking Study
81
On-Street Parking & Adjacent Parking Areas – NorthOccupancy – March Surveys
9.2.80 The table below shows the maximum occupancy observed on each street on each survey day for the March2017 surveys.
9.2.81 It can be seen that Lovaine Terrace had the highest occupancy on all three survey days and reached the 85%threshold recommended for efficient operation on the Thursday. The times of maximum occupancy on LovaineTerrace coincided with pick-up and drop-off times at the adjacent school so this is likely the reason for the highoccupancy. There is a residents only parking restriction in place but this only operates between drop-off andpick-up times.
9.2.82 Occupancy on the other three streets remained relatively low on all three survey days.
Occupancy – July Surveys
9.2.83 The table below shows the maximum occupancy observed on each street on each survey day for the July2017 surveys.
9.2.84 Again Lovaine Terrace had the highest occupancy and reached capacity on the Saturday. This was at schooldrop-off time so will likely be associated with a weekend event at the school. The maximum occupancy on theWednesday and Thursday occurred at school pick-up time and reached the 85% threshold on the Thursday.
9.2.85 Occupancy on the other three streets remained relatively low on all three survey days except onNorthumberland Street on the Wednesday where occupancy reached 78%.
Name CapacityMax Occ Max % Occ Unused Spaces
Wed Thu Sat Wed Thu Sat Wed Thu SatNorthumberlandAvenue 40 24 26 21 60% 65% 53% 16 14 19
WarkworthTerrace 28 13 13 14 46% 46% 50% 15 15 14
Percy Terrace*inc back alleys 29 16 15 16 55% 52% 55% 13 14 13
Lovaine Terrace 20 16 17 16 80% 85% 80% 4 3 4
Total 117 69 71 67 59% 61% 57% 48 46 50
Name CapacityMax Occ Max % Occ Unused Spaces
Wed Thu Sat Wed Thu Sat Wed Thu SatNorthumberlandAvenue 40 31 25 20 78% 63% 50% 9 15 20
WarkworthTerrace 28 18 12 13 64% 43% 46% 10 16 15
Percy Terrace*inc back alleys 29 16 16 17 55% 55% 59% 13 13 12
Lovaine Terrace 20 16 17 20 80% 85% 100% 4 3 0
Total 117 81 70 70 69% 60% 60% 37 47 47

AECOMBerwick-upon-Tweed Parking Study
82
Duration of Stay – March Surveys
9.2.86 The table below shows the average duration of stay on each street on each of the three surveyed days andthe average across all the streets, rounded to the nearest quarter hour.
NameAverage Duration of Stay
(hrs)Wed Thurs Sat
NorthumberlandAvenue 5.5 5.75 6
Warkworth Terrace 2.75 2.25 5Percy Terrace 4 4.25 6Lovaine Terrace 3.5 3.5 6
Total 4 4 5.75
9.2.87 Warkworth Terrace has the shortest duration of stays on all three survey days, shorter even than LovaineTerrace where school pick-ups and drop-offs occur, indicating that school pick-ups and drop-offs are alsolikely to be occurring here. Warkworth Terrace has the same residents only parking restriction as LovaineTerrace which operates only between drop-off and pick-up times.
9.2.88 Northumberland Avenue has the longest duration of stays on weekdays and joint longest on the weekends.This is likely because the parking on Northumberland Avenue on the approach to the school is residents onlyreducing the likelihood of drop-offs and pick-ups occurring here.
Duration of Stay – July Surveys
9.2.89 The table below shows the average duration of stay on each street on each of the three surveyed days andthe average across all the streets, rounded to the nearest quarter hour.
NameAverage Duration of Stay
(hrs)Wed Thurs Sat
NorthumberlandAvenue 4.75 5.75 5.75
Warkworth Terrace 2.75 2.75 4.75Percy Terrace 3.5 3 4.25Lovaine Terrace 3 3 4.75
Total 3.5 3.75 5
9.2.90 The duration of stays from the July surveys follow a similar pattern to the March surveys with WarkworthTerrace having the shortest stays and Northumberland Avenue the longest.
Issues
9.2.91 The parking surveys indicate that there are the following potential issues with the on-street parking in the northarea
· Lovaine Terrace reached capacity on one of the survey days and the 85% threshold on a further twoof the survey days. It is likely school drop-off / pick-up parking is contributing to the high parkingdemand here.

AECOMBerwick-upon-Tweed Parking Study
83
On-Street Parking & Adjacent Parking Areas – CentralOccupancy – March Surveys
9.2.92 The table below shows the maximum occupancy observed on each street on each survey day for the March2017 surveys.
9.2.93 Brucegate reached capacity on the Thursday and exceeded 85% capacity on the other two survey days. WellClose Square exceeded the 85% threshold on the Wednesday and Castlegate Court did so on the Saturday.
9.2.94 On both Ivy Place and Scotts Place some parking was recorded despite their capacity being zero due todouble yellow lines, indicating that some illegal parking is occurring here.
Occupancy – July Surveys
9.2.95 The table below shows the maximum occupancy observed on each street on each survey day for the July2017 surveys.
Name CapacityMax Occ Max % Occ Unused Spaces
Wed Thu Sat Wed Thu Sat Wed Thu SatHigh Greens 18 12 14 14 67% 78% 78% 6 4 4Low Greens &Violet Terrace 84 38 39 36 45% 46% 43% 46 45 48
Bell Tower Park &Bell Tower Place 24 19 15 11 79% 63% 46% 5 9 13
Lords Mount 15 1 1 2 7% 7% 13% 14 14 13Castlegate Court 35 27 28 34 77% 80% 97% 8 7 1Brucegate 21 18 21 18 86% 100% 86% 3 0 3Well CloseSquare 22 20 17 13 91% 77% 59% 2 5 9
Ivy Place 0 1 1 0 N/A N/A N/A -1 -1 0Scotts Place 0 0 1 0 N/A N/A N/A 0 -1 0
Total 219 136 137 128 62% 63% 58% 83 82 91
Name CapacityMax Occ Max % Occ Unused Spaces
Wed Thu Sat Wed Thu Sat Wed Thu SatHigh Greens 18 15 17 13 83% 94% 72% 3 1 5Low Greens &Violet Terrace 84 39 40 36 46% 48% 43% 45 44 48
Bell Tower Park &Bell Tower Place 24 15 20 14 63% 83% 58% 9 4 10
Lords Mount 15 10 5 5 67% 33% 33% 5 10 10Castlegate Court 35 29 28 31 83% 80% 89% 6 7 4Brucegate 21 16 17 19 76% 81% 90% 5 4 2Well CloseSquare 22 0 19 7 0% 86% 32% 22 3 15
Ivy Place 0 0 1 0 N/A N/A N/A 0 -1 0Scotts Place 0 3 3 1 N/A N/A N/A -3 -3 -1
Total 219 127 150 126 58% 68% 58% 92 69 93

AECOMBerwick-upon-Tweed Parking Study
84
9.2.96 Castlegate Court and Brucegate exceeded the 85% threshold on the Saturday and Well Close and HighGreens did on the Thursday.
9.2.97 Some parking was recorded again on Ivy Place and Scotts Place indicating that some illegal parking isoccurring here.
Duration of Stay – March Surveys
9.2.98 The table below shows the average duration of stay on each street on each of the three surveyed days andthe average across all the streets, rounded to the nearest quarter hour.
NameAverage Duration of Stay
(hrs)Wed Thurs Sat
High Greens 3.25 3 5.5Low Greens & VioletTerrace 4.75 4.75 5.5
Bell Tower Park &Bell Tower Place 2.5 2.75 5.5
Lords Mount 5 5.5 2Castlegate Court 3.75 4.25 4.5Brucegate 4 4 5.75Well Close Square 1.25 1.5 1.75Ivy Place 7 5 0Scotts Place 0 2 0
Total 3.5 3.75 3.5
9.2.99 Well Close Square had the shortest stay durations which will be due to the one hour maximum stay restrictionwhich operates from 0900 to 1730. The other streets with parking capacity all had similar average duration ofstays ranging between 2.5 hours and 5.5 hours.
Duration of Stay – July Surveys
9.2.100 The table below shows the average duration of stay on each street on each of the three surveyed days andthe average across all the streets, rounded to the nearest quarter hour.

AECOMBerwick-upon-Tweed Parking Study
85
NameAverage Duration of Stay
(hrs)Wed Thurs Sat
High Greens 2.75 3.5 4.75Low Greens & VioletTerrace 5 4.75 5.5
Bell Tower Park &Bell Tower Place 2.75 3.5 6.5
Lords Mount 5.75 5.25 5.75Castlegate Court 4.5 4.25 5.75Brucegate 3.75 6.25 5.5Well Close Square 1.5 1.25 1.5Ivy Place 0 1 0Scotts Place 1 1.5 1.25
Total 3.25 3.5 4.5
9.2.101 Again Well Close Square had the shortest stay durations due to the one hour maximum stay restriction. LordsMount and Brucegate had the longest stay durations
Issues
9.2.102 The parking surveys indicate that there are the following potential issues with the on-street parking in thecentral area:
· Brucegate reached capacity on one of the survey days and exceeded the 85% threshold on a furtherthree days.
· Castlegate Court, Well Close Square and High Greens exceeded the 85% threshold on at least one ofthe survey days.
· Some illegal parking is occurring in Ivy Place and Scotts Place.
On-Street Parking & Adjacent Parking Areas – StationOccupancy – March Surveys
9.2.103 The table below shows the maximum occupancy observed on each street on each survey day for the March2017 surveys.
Name CapacityMax Occ Max % Occ Unused Spaces
Wed Thu Sat Wed Thu Sat Wed Thu SatRailwayStreet 0 13 14 9 N/A N/A N/A -13 -14 -9
TweedStreet 14 15 20 18 107% 143% 129% -1 -6 -4
Total 14 28 34 27 200% 243% 193% -14 -20 -13
9.2.104 Railway Street is shown to have significant parking even though the capacity is shown as zero. This is asthere is a single yellow line restriction on Railway Terrace which operates 1000 to 1600 making the capacityzero for most of the day. However outside these times it has a capacity of approximately 14 meaning thatparking does still reach capacity outside of the single yellow line restriction hours. The surveys do also show

AECOMBerwick-upon-Tweed Parking Study
86
that some parking is occurring on Railway Terrace within the single yellow line restriction operating hours,therefore some illegal parking or loading must be occurring here.
9.2.105 Similarly Tweed Street is shown to be over capacity but this is due to some of the street having single yellowline restrictions from 1000 to 1600. Outside of these hours, when maximum occupancy occurs, there are anadditional 12 spaces giving a total of 26 and meaning that occupancy actually reaches a maximum of 76%.
Occupancy – July Surveys
The table below shows the maximum occupancy observed on each street on each survey day for the July2017 surveys.
Name CapacityMax Occ Max % Occ Unused Spaces
Wed Thu Sat Wed Thu Sat Wed Thu SatRailwayStreet 0 15 13 12 N/A N/A N/A -15 -13 -12
TweedStreet 14 15 17 15 107% 121% 107% -1 -3 -1
Total 14 30 30 27 214% 214% 193% -16 -16 -13
9.2.106 Outside of the single yellow line restriction times Railway Street exceeds its then capacity of 14 reaching amaximum of 107% occupancy indicating that some illegal parking and/or loading is occurring. Again someparking is occurring during the operational hours of the single yellow line restriction further indicating thatillegal parking and/or loading is occurring.
9.2.107 Outside of the single yellow line restriction hours Tweed Street reaches a maximum occupancy of 65% of itsthen capacity.
Duration of Stay – March Surveys
9.2.108 The table below shows the average duration of stay on each street on each of the three surveyed days andthe average across all the streets, rounded to the nearest quarter hour.
NameAverage Duration of Stay
(hrs)Wed Thurs Sat
Railway Street 2.25 1.75 2Tweed Street 3.5 3.5 4.75
Total 3 2.75 3.5
9.2.109 Railway Street had the shortest duration of stays but this will be as the single yellow line restrictions onlypermit parking here before 1000 and after 1600.
Duration of Stay – July Surveys
9.2.110 The table below shows the average duration of stay on each street on each of the three surveyed days andthe average across all the streets, rounded to the nearest quarter hour.

AECOMBerwick-upon-Tweed Parking Study
87
NameAverage Duration of Stay
(hrs)Wed Thurs Sat
Railway Street 1.75 2 2.25Tweed Street 3 3.5 4
Total 2.5 2.75 3.25
9.2.111 Again Railway Street had the shortest duration of stays due to the single yellow line restrictions only permittingparking here before 1000 and after 1600.
Issues
9.2.112 The parking surveys indicate that there are the following potential issues with the on-street parking in thestation area:
· Railway Street exceeded its capacity outside of the single yellow line restriction hours on two of thesurvey days indicating that some illegal parking and/or loading is occurring here.
· Parking is occurring on Railway Street during the operational hours of the single yellow line restrictionfurther indicating that some illegal parking and/or loading is occurring here.
On-Street Parking & Adjacent Parking Areas – East 1Occupancy – March Surveys
9.2.113 The table below shows the maximum occupancy observed on each street on each survey day for the March2017 surveys.
Name CapacityMax Occ Max % Occ Unused Spaces
Wed Thu Sat Wed Thu Sat Wed Thu SatWalkergate 5 10 4 8 200% 80% 160% -5 1 -3Hatters Lane 3 6 5 4 200% 167% 133% -3 -2 -1
Coxons Lane 6 1 1 0 17% 17% 0% 5 5 6WallaceGreen 66 68 59 39 103% 89% 59% -2 7 27
Chapel Street 8 8 8 2 100% 100% 25% 0 0 6Crawford’sAlley 0 3 2 1 N/A N/A N/A -3 -2 -1
Church Street 31 34 28 37 110% 90% 119% -3 3 -6
Parade 12 13 12 12 108% 100% 100% -1 0 0
Ravensdowne 54 47 47 59 87% 87% 109% 7 7 -5
Woolmarket 7 9 10 14 129% 143% 200% -2 -3 -7
Total 201 224 192 188 111% 96% 94% -23 9 13
9.2.114 It can be seen from the table that Walkergate, Hatters Lane, Wallace Green, Crawford’s Alley, Church Road,Parade, Ravensdowne and Woolmarket all exceed capacity on at least one of the survey days. In additionChapel Street reaches capacity on two of the survey days. Only Coxons Lane remains below capacitythroughout the surveys.

AECOMBerwick-upon-Tweed Parking Study
88
9.2.115 On Walkergate there is a section of double yellow lines that are very faded and parking has been observedhere. This is the likely cause of the parking in excess of capacity. Illegal parking has also been observed onHatters Lane on a section of wide footway adjacent to double yellow lines so this is the likely cause of parkingin excess of capacity here. This may have become less of an issue since the reopening of Hatters Lane carpark.
9.2.116 On Wallace Green the parking slightly in excess of capacity is likely to be because of some illegal parkingand/or loading or parking in non-designated areas. On Crawfords Alley, some illegal parking was observed sothis is the likely cause of parking in excess of capacity here.
9.2.117 Part of Church Street is covered by a single yellow line restriction which only operates between 0800 and1800 however parking in excess of capacity was observed within these hours so some illegal parking and/orloading must be occurring here.
9.2.118 A large section of Ravensdowne is covered by a single yellow line restriction which only operates between0800 and 1800. The maximum occupancy of 59 on the March Saturday occurs outside of these restrictiontimes and so is actually below the capacity of the street at that time. The maximum Saturday occupancy thatoccurs within the restriction hours is 47, equivalent to 87% occupancy.
9.2.119 On Parade one additional car was recorded in excess of capacity, this could be due to cars being parked veryclosely within the designated parking area or due to illegal parking. On Woolmarket the parking significantly inexcess of capacity must be due to illegal parking and/or loading.
Occupancy – July Surveys
9.2.120 The table below shows the maximum occupancy observed on each street on each survey day for the July2017 surveys.
Name CapacityMax Occ Max % Occ Unused Spaces
Wed Thu Sat Wed Thu Sat Wed Thu SatWalkergate 5 8 8 6 160% 160% 120% -3 -3 -1Hatters Lane 3 7 5 5 233% 167% 167% -4 -2 -2
Coxons Lane 6 7 7 7 117% 117% 117% -1 -1 -1WallaceGreen 66 67 64 47 102% 97% 71% -1 2 19
Chapel Street 8 6 5 3 75% 63% 38% 2 3 5Crawford’sAlley 0 2 3 2 N/A N/A N/A -2 -3 -2
Church Street 31 37 34 32 119% 110% 103% -6 -3 -1
Parade 12 12 11 9 100% 92% 75% 0 1 3
Ravensdowne 54 44 46 52 81% 85% 96% 19 17 11
Woolmarket 7 16 9 11 229% 129% 157% -9 -2 -4
Total 201 231 192 174 115% 96% 87% -30 9 27
9.2.121 Again Walkergate, Hatters Lane, Wallace Green, Crawfords Alley, Church Streetand Woolmarket exceededcapacity on at least one of the survey days. This will be for the same reasons described above for the Marchsurveys.
9.2.122 Coxons Lane was also slightly over capacity during the July surveys. This occurred during the operationalhours of the single yellow line restriction here so must be a result of illegal parking or parking in non-designated areas.

AECOMBerwick-upon-Tweed Parking Study
89
9.2.123 The maximum Saturday occupancy on Ravensdowne occurred outside the operating hours of the singleyellow line restriction. The maximum occupancy during the operating hours was 50, equivalent to 93%occupancy.
9.2.124 In addition to the above, Parade reached capacity on the Wednesday and Ravensdowne exceeded the 85%threshold on the Saturday (was this in 0800-1800).
Duration of Stay – March Surveys
9.2.125 The table below shows the average duration of stay on each street on each of the three surveyed days andthe average across all the streets, rounded to the nearest quarter hour.
NameAverage Duration of Stay
(hrs)Wed Thurs Sat
Walkergate 1 1.25 1.25Hatters Lane 4.5 3.5 9.25Coxons Lane 6 3.75 4.25Wallace Green 2.75 2 1.5Chapel Street 4.75 4 1.5Crawford's Alley 5.5 3.75 3.75Church Street 2.5 2 2.25Parade 4.5 5.75 5.25Ravensdowne 4.75 4.25 5.5Woolmarket 2.25 1.75 1.75
Total 3.25 3 3.25
9.2.126 Walkergate has the lowest duration of stays, as would be expected as the only parking areas here are taxibays and the illegal parking on the faded double yellow lines. The next lowest durations of stays are onWoolmarket and Wallace Green where all parking is subject to a 3 hour maximum stay.
9.2.127 The longest duration of stays occur on Parade, Ravensdowne and Hatters Lane which have no stayrestrictions in place.
9.2.128 The average duration of stay for all the streets combined is very similar across the three days at 3 to 3.25hours.
Duration of Stay – July Surveys
9.2.129 The table below shows the average duration of stay on each street on each of the three surveyed days andthe average across all the streets, rounded to the nearest quarter hour.

AECOMBerwick-upon-Tweed Parking Study
90
NameAverage Duration of Stay
(hrs)Wed Thurs Sat
Walkergate 1.25 1.25 1.5Hatters Lane 3.25 3 3.75Coxons Lane 6 3.75 4.25Wallace Green 2.25 2 1.75Chapel Street 2.75 2.25 3.5Crawford's Alley 3 1.75 2Church Street 2.25 2 2.25Parade 4.25 5.5 5.25Ravensdowne 4 4.5 5Woolmarket 2.25 2.5 2.5
Total 3.25 2.75 3.25
9.2.130 The durations of stay during the July surveys follow very similar patterns to those recorded in the Marchsurveys.
Issues
9.2.131 The parking surveys indicate that there are the following potential issues with the on-street parking in the east1 area:
· Walkergate is over capacity with illegal parking occurring.· Hatters Lane is over capacity with illegal parking occurring, although this may have become less of an
issue since the reopening of Hatters Lane car park.· Coxons Lane was over capacity due to illegal parking or parking in non-designated areas.· Wallace Green is slightly over capacity due to illegal parking and/or loading or parking in non-
designated parking areas· Chapel Street is at capacity· Some illegal parking is occurring in Crawford’s Alley· Church Street is over capacity due to illegal parking and/or loading· Parade is at capacity· Woolmarket is over capacity due to illegal parking and/or loading· Parking on Ravensdowne exceeded the 85% threshold on both of the surveyed Saturdays.
On-Street Parking & Adjacent Parking Areas – East 2Occupancy – March Surveys
9.2.132 The table below shows the maximum occupancy observed on each street on each survey day for the March2017 surveys.
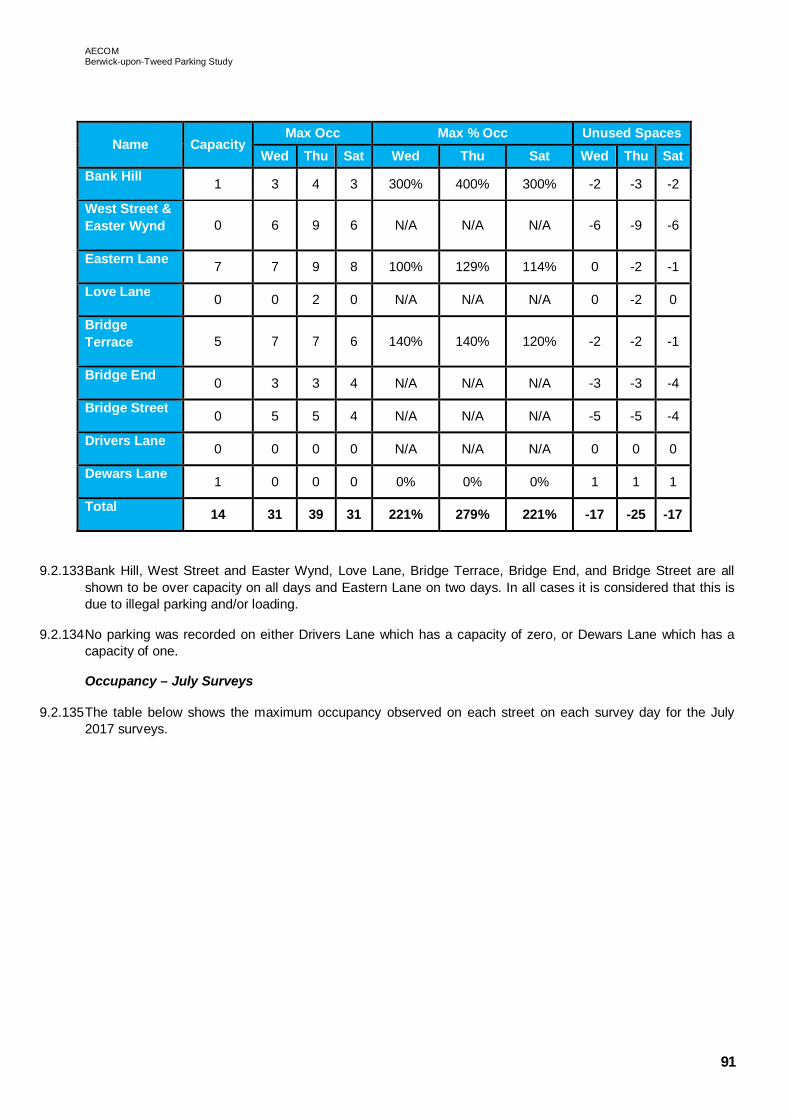
AECOMBerwick-upon-Tweed Parking Study
91
Name CapacityMax Occ Max % Occ Unused Spaces
Wed Thu Sat Wed Thu Sat Wed Thu SatBank Hill 1 3 4 3 300% 400% 300% -2 -3 -2
West Street &Easter Wynd 0 6 9 6 N/A N/A N/A -6 -9 -6
Eastern Lane 7 7 9 8 100% 129% 114% 0 -2 -1
Love Lane 0 0 2 0 N/A N/A N/A 0 -2 0
BridgeTerrace 5 7 7 6 140% 140% 120% -2 -2 -1
Bridge End 0 3 3 4 N/A N/A N/A -3 -3 -4
Bridge Street 0 5 5 4 N/A N/A N/A -5 -5 -4
Drivers Lane 0 0 0 0 N/A N/A N/A 0 0 0
Dewars Lane 1 0 0 0 0% 0% 0% 1 1 1
Total 14 31 39 31 221% 279% 221% -17 -25 -17
9.2.133 Bank Hill, West Street and Easter Wynd, Love Lane, Bridge Terrace, Bridge End, and Bridge Street are allshown to be over capacity on all days and Eastern Lane on two days. In all cases it is considered that this isdue to illegal parking and/or loading.
9.2.134 No parking was recorded on either Drivers Lane which has a capacity of zero, or Dewars Lane which has acapacity of one.
Occupancy – July Surveys
9.2.135 The table below shows the maximum occupancy observed on each street on each survey day for the July2017 surveys.

AECOMBerwick-upon-Tweed Parking Study
92
Name CapacityMax Occ Max % Occ Unused Spaces
Wed Thu Sat Wed Thu Sat Wed Thu SatBank Hill 1 5 3 2 500% 300% 200% -4 -2 -1
West Street &Easter Wynd 0 1 1 1 N/A N/A N/A -1 -1 -1
Eastern Lane 7 8 8 8 114% 114% 114% -1 -1 -1
Love Lane 0 0 1 1 N/A N/A N/A 0 -1 -1
BridgeTerrace 5 8 9 7 160% 180% 140% -3 -4 -2
Bridge End 0 4 4 2 N/A N/A N/A -4 -4 -2
Bridge Street 0 2 3 2 N/A N/A N/A -2 -3 -2
Drivers Lane 0 0 0 0 N/A N/A N/A 0 0 0
Dewars Lane 1 0 0 0 0 0 0 0 0 0
Total 14 28 29 23 200% 207% 164% -15 -16 -10
9.2.136 Bank Hill, West Street and Easter Wynd, Eastern Terrace, Love Lane, Bridge Terrace, Bridge End, and BridgeStreet are all shown to be over capacity on all days. In all cases it is considered that this is due to illegalparking and/or loading.
9.2.137 Again no parking was recorded on either Drivers Lane which has a capacity of zero, or Dewars Lane whichhas a capacity of one.
Duration of Stay – March Surveys
9.2.138 The table below shows the average duration of stay on each street on each of the three surveyed days andthe average across all the streets, rounded to the nearest quarter hour.
NameAverage Duration of Stay
(hrs)Wed Thurs Sat
Bank Hill 2.5 1.5 3West Street & EasterWynd 3.5 5.25 7
Eastern Lane 7.25 7.25 9.75Love Lane 0 4.25 1Bridge Terrace 7.5 5.25 5.5Bridge End 3 2.25 2Bridge Street 1.75 1.25 1.25Drivers Lane 0 0 0Dewar’s Lane 0 0 0
Total 3.25 3.5 3.5

AECOMBerwick-upon-Tweed Parking Study
93
9.2.139 The average durations of stay vary from 1.25 hours to 9.75 hours with Bridge Street having the shortest staysacross the three survey days and Eastern Lane having the longest followed by Bridge Terrace. This isunsurprising as Eastern Lane and Bridge Terrace or the only streets with designated parking capacity otherthan Bank Hill and Dewar’s Lane which only have one space each. None of the streets have short stayrestrictions in place.
9.2.140 The average duration of stay for all the streets combined is very similar across the three days at 3.25 to 3.5hours.
Duration of Stay – July Surveys
9.2.141 The table below shows the average duration of stay on each street on each of the three surveyed days andthe average across all the streets, rounded to the nearest quarter hour.
NameAverage Duration of Stay
(hrs)Wed Thurs Sat
Bank Hill 2 2.5 3.75West Street & EasterWynd 1.75 1 1
Eastern Lane 6.75 9 8Love Lane 0 1 1Bridge Terrace 9 7.75 5.75Bridge End 2.5 1.75 2.25Bridge Street 1 1 1.25Drivers Lane 0 0 0Dewar’s Lane 0 0 0
Total 3 3 3
9.2.142 The July durations of stay follow a similar pattern to the March ones. Love Lane and Bridge Street have theshortest durations of stay and Eastern Lane and Bridge Terrace the longest.
9.2.143 The average duration of stay for all the streets combined is the same for every day at 3 hours, and similar tothe March surveys.
Issues
9.2.144 The parking surveys indicate that there are the following potential issues with the on-street parking in thestation east 2 area:
· Bank Hill, West Street and Easter Wynd, Eastern Terrace, Love Lane, Bridge Terrace, Bridge End,and Bridge Street are all over capacity due to illegal parking and/or loading.
On-Street Parking & Adjacent Parking Areas – East 3Occupancy – March Surveys
9.2.145 The table below shows the maximum occupancy observed on each street on each survey day for the March2017 surveys.

AECOMBerwick-upon-Tweed Parking Study
94
Name CapacityMax Occ Max % Occ Unused Spaces
Wed Thu Sat Wed Thu Sat Wed Thu SatHide Hill 42 41 35 40 98% 83% 95% 1 7 2Sandgate 25 15 16 19 60% 64% 76% 10 9 6Silver Street 0 4 6 2 N/A N/A N/A -4 -6 -2Ness Street 8 6 7 7 75% 88% 88% 2 1 1Weddell's Lane 0 0 0 0 N/A N/A N/A 0 0 0Foul Ford 0 2 2 1 N/A N/A N/A -2 -2 -1Oil Mill Lane 2 3 4 0 150% 200% 0% -1 -2 2Palace Street 48 28 28 31 58% 58% 65% 20 20 17Palace Green 28 11 9 8 39% 32% 29% 17 19 20Palace StreetEast 18 11 11 11 61% 61% 61% 7 7 7
The Avenue 3 0 1 0 0% 33% 0% 3 2 3
Total 174 121 119 119 70% 68% 68% 53 55 55
9.2.146 Silver Street, Foul Ford and Oil Mill Lane are all shown to be over capacity on more than one of the surveydays. In addition parking on Hide Hill and Ness Street is shown to exceed the 85% threshold on two of thesurvey days.
9.2.147 On Silver Street the parking shown to be in excess of capacity is due to a single yellow line restriction whichonly operates from 0800 to 1800. The parking in excess of capacity only occurs outside of the restriction hoursso in effect remains below capacity.
9.2.148 On Foul Ford there is an area next to double yellow lines where it is not clear if parking is forbidden by thelines or if the lane is private property and parking is allowed. This area has space for three cars and has notbeen included within the capacity assessment. Parking is occurring here and it is this area that is thereforecausing the occupancy to show as over capacity. There is a similar situation on Oil Mill Lane with an area withsufficient space for two cars to park where it is not clear if parking is prohibited by double yellow lines. Thisarea has not been included within the capacity assessment but parking is occurring here and causing theindicated occupancy in excess of capacity.
Occupancy – July Surveys
9.2.149 The table below shows the maximum occupancy observed on each street on each survey day for the July2017 surveys.

AECOMBerwick-upon-Tweed Parking Study
95
Name CapacityMax Occ Max % Occ Unused Spaces
Wed Thu Sat Wed Thu Sat Wed Thu SatHide Hill 42 39 38 38 93% 90% 90% 3 4 4Sandgate 25 28 23 20 112% 92% 80% -3 2 5Silver Street 0 3 5 3 N/A N/A N/A -3 -5 -3Ness Street 8 8 8 8 100% 100% 100% 0 0 0Weddell's Lane 0 0 0 0 N/A N/A N/A 0 0 0Foul Ford 0 2 3 2 N/A N/A N/A -2 -3 -2Oil Mill Lane 2 0 0 0 0% 0% 0% 2 2 2Palace Street 48 33 33 29 69% 69% 60% 15 15 19Palace Green 28 9 12 9 32% 43% 32% 19 16 19Palace StreetEast 18 13 12 13 72% 67% 72% 5 6 5
The Avenue 3 1 1 3 33% 33% 100% 2 2 0
Total 174 153 135 125 88% 78% 72% 21 39 49
9.2.150 Sandgate is shown to be over capacity on the Wednesday. This is due to illegal parking and/or loading on thedouble yellow lines in this street.
9.2.151 Silver Street and Foul Ford are again shown to have occupancy in excess of capacity due to the reasonsdescribed above. Ness Street is shown to be at capacity on all three survey days, The Avenue is shown to beat capacity on the Saturday and Hide Hill is again shown to be over the 85% threshold, this time on all three ofthe survey days.
Duration of Stay – March Surveys
9.2.152 The table below shows the average duration of stay on each street on each of the three surveyed days andthe average across all the streets, rounded to the nearest quarter hour.
NameAverage Duration of Stay
(hrs)Wed Thurs Sat
Hide Hill 1.25 1.25 1.5Sandgate 1.5 1.75 1.5Silver Street 2 2.5 7Ness Street 3 4.75 8Weddells Lane N/A N/A N/AFoul Ford 6 4.25 1Oil Mill Lane 4.25 9 N/APalace Street 4.5 4.5 6Palace Green 3.5 3.5 5.5Palace Street E 6.25 5 6.75The Avenue 0 10 0
Total 3 4.25 3.5

AECOMBerwick-upon-Tweed Parking Study
96
9.2.153 Hide Hill and Sandgate have the shortest duration of stays, which is as expected due to the short stayrestrictions in place here. The average stays on Hide Hill are slightly in access of the 1 hour maximum but therestriction only applies from 0900 to 1730 so longer stays outside of this period will be increasing the average.
9.2.154 Palace Street East had the longest durations of stay on all three survey days.
Duration of Stay – July Surveys
9.2.155 The table below shows the average duration of stay on each street on each of the three surveyed days andthe average across all the streets, rounded to the nearest quarter hour.
NameAverage Duration of Stay
(hrs)Wed Thurs Sat
Hide Hill 1.5 1.5 1.25Sandgate 2.5 1.5 1.5Silver Street 3.25 2.5 2.25Ness Street 5.75 6.5 9.75Weddells Lane N/A N/A N/AFoul Ford 1.75 6.25 5Oil Mill Lane N/A N/A N/APalace Street 6.25 6 6Palace Green 3.25 4.25 4.75Palace Street E 4.75 4.5 6.5The Avenue 1.5 3 5.25
Total 2.75 3.25 3.75
9.2.156 Again Hide Hill and Sandgate have the shortest duration of stays. Palace Street and Ness Street have thelongest durations of stays.
Issues
9.2.157 The parking surveys indicate that there are the following potential issues with the on-street parking in the east3 area:
· Sandgate exceeded capacity on one of the survey days due to illegal parking and/or loading occurringon double yellow lines.
· Illegal parking is possibly occurring in two areas on Foul Ford and Oil Mill Lane but it is unclear if theadjacent double yellow line restrictions apply to the areas in question.
· The Avenue and Ness Street reached capacity on at least one of the survey days· Hide Hill exceeded the 85% threshold on five of the six survey days.
On-Street Parking & Adjacent Parking Areas – West 19.2.158 Occupancy – March Surveys
9.2.159 The table below shows the maximum occupancy observed on each street on each survey day for the March2017 surveys.

AECOMBerwick-upon-Tweed Parking Study
97
Name CapacityMax Occ Max % Occ Unused Spaces
Wed Thu Sat Wed Thu Sat Wed Thu SatBlakewellGardens 30 28 23 24 93% 77% 80% 2 7 6
RiversideRoad 33 25 17 14 76% 52% 42% 8 16 19
Bower'sCrescent 16 6 6 8 38% 38% 50% 10 10 8
BlakewellRoad 32 12 12 14 38% 38% 44% 20 20 18
West End 73 34 36 33 47% 49% 45% 39 37 40
Total 184 105 94 93 57% 51% 51% 79 90 91
9.2.160 It can be seen that occupancies remained well below capacity on all streets on all survey days except onBlakewell Gardens which exceeded the 85% threshold on the Wednesday.
Occupancy – July Surveys
9.2.161 The table below shows the maximum occupancy observed on each street on each survey day for the July2017 surveys.
Name CapacityMax Occ Max % Occ Unused Spaces
Wed Thu Sat Wed Thu Sat Wed Thu SatBlakewellGardens 30 17 18 22 57% 60% 73% 13 12 8
RiversideRoad 33 16 18 18 48% 55% 55% 17 15 15
Bower'sCrescent 16 5 6 7 31% 38% 44% 11 10 9
BlakewellRoad 32 14 12 12 44% 38% 38% 18 20 20
West End 73 33 34 30 45% 47% 41% 40 39 43
Total 184 85 88 89 46% 48% 48% 99 96 95
9.2.162 It can be seen that occupancies remained well below capacity on all streets on all survey days.
Duration of Stay – March Surveys
9.2.163 The table below shows the average duration of stay on each street on each of the three surveyed days andthe average across all the streets, rounded to the nearest quarter hour.

AECOMBerwick-upon-Tweed Parking Study
98
NameAverage Duration of Stay
(hrs)Wed Thurs Sat
Blakewell Gardens 3.5 3.5 3.75Riverside Road 3.25 3.5 4Bower's Crescent 3.75 3.5 3.25Blakewell Road 3 3.75 4.25West End 3.5 3.5 3
Total 3.5 3.5 3.75
9.2.164 It can be seen that the average durations of stay were very consistent across all streets on all three surveydays, only varying between 3 hours and 4.25 hours.
Duration of Stay – July Surveys
9.2.165 The table below shows the average duration of stay on each street on each of the three surveyed days andthe average across all the streets, rounded to the nearest quarter hour.
NameAverage Duration of Stay
(hrs)Wed Thurs Sat
Blakewell Gardens 2.75 2.75 4Riverside Road 3.5 3.5 4.5Bower's Crescent 6.5 3.75 3.5Blakewell Road 3 3.5 4.5West End 2.75 3 2.75
Total 3.75 3.25 3.75
9.2.166 The average durations of stay varied a little more than during the March surveys with a minimum of 2.75 hoursand a maximum of 6.5 hours. Bower’s Crescent had slightly longer durations of stay than the other streets.
Issues
9.2.167 The parking surveys indicate that there are the following potential issues with the on-street parking in the west1 area:
· The occupancy on Blakewell Gardens exceeded the 85% threshold on one of the survey days.
On-Street Parking & Adjacent Parking Areas – West 2Occupancy – March Surveys
9.2.168 The table below shows the maximum occupancy observed on each street on each survey day for the March2017 surveys.

AECOMBerwick-upon-Tweed Parking Study
99
Name CapacityMax Occ Max % Occ Unused Spaces
Wed Thu Sat Wed Thu Sat Wed Thu Sat
Union Brae 0 5 4 0 N/A N/A N/A -5 -4 0Kiln Hill 32 19 19 16 59% 59% 50% 13 13 16Dock Road 117 16 16 15 14% 14% 13% 101 101 102Mill Strand 20 6 6 6 30% 30% 30% 14 14 14BreweryLane 9 5 4 1 56% 44% 11% 4 5 8
BreweryBank 9 7 6 5 78% 67% 56% 2 3 4
ChurchRoad 46 43 31 34 93% 67% 74% 3 15 12
WellSquare 16 10 12 11 63% 75% 69% 6 4 5
Lee's Lane 3 3 2 2 100% 67% 67% 0 1 1TowerRoad 16 4 7 4 25 44% 25% 12 9 12
Well Road 3 1 1 1 33% 33% 33% 2 2 2MountRoad 35 13 13 12 37% 37% 34% 22 22 23
Total 306 132 121 107 43% 40% 35% 174 185 199
9.2.169 It can be seen that Lee’s Lane reached capacity on the Wednesday and Church Road exceeded the 85%threshold on the Wednesday.
Occupancy – July Surveys
9.2.170 The table below shows the maximum occupancy observed on each street on each survey day for the July2017 surveys.

AECOMBerwick-upon-Tweed Parking Study
100
Name CapacityMax Occ Max % Occ Unused Spaces
Wed Thu Sat Wed Thu Sat Wed Thu Sat
Union Brae 0 4 3 0 N/A N/A N/A -4 -3 0Kiln Hill 32 26 26 18 81% 81% 56% 6 6 14Dock Road 117 18 18 14 15% 15% 12% 99 99 103Mill Strand 20 8 7 6 40% 35% 30% 12 13 14BreweryLane 9 7 5 3 78% 56% 33% 2 4 6
BreweryBank 9 7 8 7 78% 89% 78% 2 1 2
ChurchRoad 46 31 31 32 67% 67% 70% 15 15 14
WellSquare 16 11 11 14 69% 69% 88% 5 5 2
Lee's Lane 3 3 3 3 100% 100% 100% 0 0 0TowerRoad 16 10 12 13 63% 75% 81% 6 4 3
Well Road 3 4 4 4 133% 133% 133% -1 -1 -1MountRoad 35 14 14 15 40% 40% 43% 21 21 20
Total 306 143 142 129 47% 46% 42% 163 164 177
9.2.171 The occupancy on Well Road slightly exceeded capacity on all three survey days and the occupancy on Lee’sLane reached capacity on all three days. The occupancy on Brewery Bank exceeded the 85% threshold onthe Thursday and the occupancy on Well Square exceeded it on the Saturday.
9.2.172 It is thought that the occupancy on Well Road is exceeding capacity due to vehicles parking in an area notdesignated for parking, namely the turning head at the end of the road.
Duration of Stay – March Surveys
9.2.173 The table below shows the average duration of stay on each street on each of the three surveyed days andthe average across all the streets, rounded to the nearest quarter hour.

AECOMBerwick-upon-Tweed Parking Study
101
NameAverage Duration of Stay
(hrs)Wed Thurs Sat
Union Brae 1.25 1.25 N/A
Kiln Hill 5 6.25 4.5
Dock Road 3.75 3.5 4.25
Mill Strand 3.75 2.75 2.75
Brewery Lane 5.75 5.25 6
Brewery Bank 3 4.25 4.25
Church Road 3.25 4.75 4.75
Well Square 5 4.5 5
Lees Lane 3.75 2.5 3.5
Tower Road 2 3 4.25
Well Road 1 3 1.25
Mount Road 2.5 3.5 4
Total 3.25 3.75 3.75
9.2.174 Union Brae, where all the parking will be illegal or for loading, had the shortest average durations of stay. Thelongest average durations of stay were on Kiln Hill and Brewery Lane.
Duration of Stay – July Surveys
9.2.175 The table below shows the average duration of stay on each street on each of the three surveyed days andthe average across all the streets, rounded to the nearest quarter hour.
NameAverage Duration of Stay
(hrs)Wed Thurs Sat
Union Brae 1.25 1.25 N/A
Kiln Hill 3.75 3.75 4.25
Dock Road 4 4.25 4
Mill Strand 3.5 3.5 3.25
Brewery Lane 2.75 2.5 4.5
Brewery Bank 3.75 4.25 4.25
Church Road 3.5 3.75 4.25
Well Square 3.25 3 4.25
Lees Lane 5.5 5 4
Tower Road 4.25 4.25 4
Well Road 5.75 9.5 11.75
Mount Road 2.5 3.25 3.75
Total 3.75 4 4.25
9.2.176 Again Union Brae had the shortest average durations of stay. Well Road had the longest durations of stay.

AECOMBerwick-upon-Tweed Parking Study
102
Issues
9.2.177 The parking surveys indicate that there are the following potential issues with the on-street parking in the west2 area:
· Occupancy slightly exceeded capacity on Well Road on three of the survey days due to vehiclesparking in areas not designated for parking.
· Occupancy reached capacity on Lee’s Lane on four of the survey days.· Occupancies on Church Road, Brewery Bank and Well Square exceeded the 85% threshold on one of
the survey days.
9.3 Overall Situation for Mixed Parking Areas9.3.1 The analysis in Section 5.2 considers peak demand on individual streets and in individual car parks at their
own individual peak times, irrespective of the timings of peak demand in adjacent streets or car parks. This isconsidered sufficient for streets in purely residential areas, or where parking is restricted to resident only, or instreets where mixed parking is likely to occur but there are no surrounding car parks or mixed use streets touse as alternative parking locations. In these locations parking demand is very street specific and notsignificantly interchangeable with other streets or car parks.
9.3.2 Similarly parking demand in the private car parks for public use/use specific car parks within the study area isconsidered not to be significantly interchangeable with surrounding car parks and streets and thereforeanalysis of individual car park peaks is sufficient.
9.3.3 However in streets where the majority of parking is available to all users and close to similar streets or publiccar parks, it is considered that car parking is interchangeable between these streets and car parks anddemand should be considered at an overall peak demand for the area. It is considered that there is one sucharea within the study boundary located around the town centre core and encompassing all the public carparks, with the possible exception of the railway station car park, and the following streets:
· Castlegate (High Greens to Marygate)
· Marygate
· Scott’s Place
· Railway Street
· Wallace Green
· Chapel Street
· Church Street
· Woolmarket
· West Street
· Easter Wynd
· Bridge End
· Bridge Street
· Drivers Lane
· Dewars Lane
· Hide Hill
· Sandgate

AECOMBerwick-upon-Tweed Parking Study
103
· Silver Street
· Foul Ford
9.3.4 Not all parking within these streets and car parks will be interchangeable; for example those wishing to stay forlong durations will not be able to park in short stay car parks or on-street parking areas and some may have tobe within a very short distance of their final destination limiting parking choice, however it is considered thatparking is sufficiently interchangeable that current and future demand should be considered for the area as awhole.
9.3.5 The peak demand across all the public car parks combined has already been considered in section 5.2. andtherefore the demand within the above listed streets at the corresponding times simply needs adding in to givethe total demand for the area as a whole. Peak demand across the car parks and streets combined occurredon the Wednesday for both the March and July surveys.
9.3.6 Spreadsheet output in Appendix C shows the full area peak demand calculations and the table below showsthe peak demand for March and July alongside the existing parking capacity and the resultant free spaces atpeak demand. The table also shows the resulting free spaces if maximum occupancy is limited to 85%, therecommended maximum occupancy for efficient operation of parking. It should be noted that the existingcapacity figure in the table includes the recently opened Hatters car park discussed in Section 6.2.
9.3.7 As mentioned above it is debatable as to whether the railway station car park should be considered within theoverall area. This is because it is slightly removed from the other car parks and streets being considered and itis the only public car park which is charged. The table therefore also shows the capacity, demand and freespace results for a scenario excluding this car park.
Scenario CapacityPeak Demand Free Spaces
Free Spaceswith 85% MaxOccupancy
Mar July Mar July Mar July
Existing Situation 1162 1027 1067 135 95 -39 -79Existing Situation ExcludingRailway Station Car Park 1036 906 938 130 98 -25 -57
9.3.8 It can be seen that over the area as a whole there are 135 free spaces at the time of peak demand in Marchand 95 free spaces at the time of peak demand in July. To keep maximum occupancy at 85% of capacity anadditional 39 spaces would be required in March and an additional 79 spaces would be required in July.
9.3.9 If the railway station car park is excluded from the area under consideration there are 130 free spaces duringthe March peak and 98 spaces during the July peak with an additional 25 spaces required to achieve 85%maximum capacity in March and 57 spaces required to achieve this in July.
9.3.10 If the railway station car park is considered as a standalone car park it would require an additional 24 spacesto achieve 85% maximum occupancy in March and an additional 27 spaces to achieve it in July based oncurrent peak demand.

AECOMBerwick-upon-Tweed Parking Study
104
APPENDIX C – Parking Occupancy Analysis Data

Town Centre Core Parking Area Demand Calculations
Name
Wed Thu Sat Wed Thu Sat Wed Thu Sat Wed Thu Sat Wed Thu Sat Wed Thu Sat1000-1100 1100-1200 1200-1300 1200-1300 1200-1300 1300-1400 1000-1100 1100-1200 1200-1300 1200-1300 1200-1300 1300-1400 1000-1100 1100-1200 1200-1300 1200-1300 1200-1300 1300-1400
Car ParksPublic Car Parks - NCCBerwick Railway Station 126 121 124 96 129 130 109 5 2 30 -3 -4 17 -14 -17 11 -22 -23 -2Bridge Street 48 27 31 40 35 40 20 21 17 8 13 8 28 14 10 1 6 1 21Eastern Lane 55 56 59 66 61 50 54 -1 -4 -11 -6 5 1 -9 -12 -19 -14 -3 -7Castlegate Short Stay 105 99 94 97 105 102 99 6 11 8 0 3 6 -10 -5 -8 -16 -13 -10Castlegate Long Stay & Overflow 213 184 182 179 181 179 177 29 31 34 32 34 36 -3 -1 2 0 2 4Waugh Place 12 8 10 10 8 6 7 4 2 2 4 6 5 2 0 0 2 4 3Woolmarket 6 6 5 6 4 4 7 0 1 0 2 2 -1 -1 0 -1 1 1 -2Coxons Lane 55 56 56 54 56 56 48 -1 -1 1 -1 -1 7 -9 -9 -7 -9 -9 -1Foul Ford 30 29 30 28 30 29 27 1 0 2 0 1 3 -4 -5 -3 -5 -4 -2Parade 78 77 76 76 78 77 77 1 2 2 0 1 1 -11 -10 -10 -12 -11 -11Quayside 128 120 119 97 127 118 96 8 9 31 1 10 32 -11 -10 12 -18 -9 13
On-Street Parking & Adjacent Parking AreasMajor Roads Where Parking is AllowedCastlegate (High Greens to Marygate) 74 59 59 60 64 59 68 15 15 14 10 15 6 4 4 3 -1 4 -5Marygate 28 23 12 15 12 16 14 5 16 13 16 12 14 1 12 9 12 8 10
CentralScott's Place 0 0 1 0 0 1 0 0 -1 0 0 -1 0 0 -1 0 0 -1 0
StationRailway Street 0 8 8 6 8 4 4 -8 -8 -6 -8 -4 -4 -8 -8 -6 -8 -4 -4
East 1Wallace Green 66 63 54 39 66 64 47 3 12 27 0 2 19 -7 2 17 -10 -8 9Chapel Street 8 4 8 1 1 3 2 4 0 7 7 5 6 3 -1 6 6 4 5Church Street 31 31 23 32 27 28 27 0 8 -1 4 3 4 -5 3 -6 -1 -2 -1Woolmarket 7 6 4 7 6 6 6 1 3 0 1 1 1 0 2 -1 0 0 0
East 2West Street & Easter Wynd 0 4 6 5 1 0 0 -4 -6 -5 -1 0 0 -4 -6 -5 -1 0 0Bridge End 0 2 3 2 3 2 1 -2 -3 -2 -3 -2 -1 -2 -3 -2 -3 -2 -1Bridge Street 0 3 5 3 2 3 1 -3 -5 -3 -2 -3 -1 -3 -5 -3 -2 -3 -1Drivers Lane 0 0 0 0 0 0 0 0 0 0 0 0 0 0 0 0 0 0 0Dewars Lane 1 0 0 0 0 0 0 1 1 1 1 1 1 1 1 1 1 1 1
East 3Hide Hill 42 32 30 32 34 33 31 10 12 10 8 9 11 4 6 4 2 3 5Sandgate 25 8 7 17 28 22 20 17 18 8 -3 3 5 13 14 4 -7 -1 1Silver Street 0 1 1 1 1 1 1 -1 -1 -1 -1 -1 -1 -1 -1 -1 -1 -1 -1Foul Ford 0 0 1 0 0 3 2 0 -1 0 0 -3 -2 0 -1 0 0 -3 -2 Required new spaces for 85% Max Occupancy
Mar JulyCurrent Total 1138 1027 1008 969 1067 1036 945 111 130 169 71 102 193 -60 -41 -2 -100 -69 22 70 117Current Total with Hatters 1162 1027 1008 969 1067 1036 945 135 154 193 95 126 217 -39 -20 19 -79 -48 43 46 93Current Total with Hatters, with Chapel Street, without Castlegate Overflow 1044 1027 1008 969 1067 1036 945 17 36 75 -23 8 99 -140 -121 -82 -180 -149 -58 164 2112020 Total with Hatters 1162 1065 1045 1005 1106 1074 980 97 117 157 56 88 182 -77 -58 -17 -119 -87 8 91 1402020 Total with Hatters, with Chapel Street, without Castlegate Overflow 1044 1065 1045 1005 1106 1074 980 -21 -1 39 -62 -30 64 -178 -158 -117 -219 -187 -93 209 2582030 Total with Hatters 1162 1136 1115 1072 1180 1146 1045 26 47 90 -18 16 117 -148 -127 -84 -192 -158 -57 174 2262030 Total with Hatters, with Chapel Street, without Castlegate Overflow 1044 1136 1115 1072 1180 1146 1045 -92 -71 -28 -136 -102 -1 -248 -227 -184 -293 -258 -158 292 344
Totals excluding current and proposed railway station car parksCurrent Total with Hatters 1036 906 884 873 938 906 836 130 152 163 98 130 200 -25 -3 8 -57 -25 45 30 68Current Total with Hatters, with Chapel Street, without Castlegate Overflow 918 906 884 873 938 906 836 12 34 45 -20 12 82 -126 -104 -93 -158 -126 -56 148 186
2020 Total with Hatters 1036 940 917 905 973 940 867 96 119 131 63 96 169 -59 -36 -25 -92 -59 14 69 1082020 Total with Hatters, with Chapel Street, without Castlegate Overflow 918 940 917 905 973 940 867 -22 1 13 -55 -22 51 -159 -136 -125 -192 -159 -87 187 226
2030 Total with Hatters 1036 1002 978 966 1037 1002 925 34 58 70 -1 34 111 -121 -97 -85 -157 -121 -44 143 1852030 Total with Hatters, with Chapel Street, without Castlegate Overflow 918 1002 978 966 1037 1002 925 -84 -60 -48 -119 -84 -7 -222 -197 -185 -257 -222 -144 261 303
CapacityArea Peak Occupancy Free Spaces Free Spaces if 85% Max Capacity
March July March July March July

Streets Outside Town Centre Core Parking Area Demand Calculations
Wed Thu Sat Wed Thu Sat Wed Thu Sat Wed Thu Sat Wed Thu Sat Wed Thu Sat Wed Thu Sat Wed Thu Sat Wed Thu Sat Wed Thu Sat Wed Thu Sat Wed Thu Sat1000-1100 1100-1200 1200-1300 1200-1300 1200-1300 1300-1400 1000-1100 1100-1200 1200-1300 1200-1300 1200-1300 1300-1400 1000-1100 1100-1200 1200-1300 1200-1300 1200-1300 1300-1400 1000-1100 1100-1200 1200-1300 1200-1300 1200-1300 1300-1400 1000-1100 1100-1200 1200-1300 1200-1300 1200-1300 1300-1400 1000-1100 1100-1200 1200-1300 1200-1300 1200-1300 1300-1400
Car ParksOn-Street Parking & Adjacent Parking AreasMajor Roads Where Parking is Unlikely / ForbiddenCastlegate (Castle Terrace to High Greens) 0 0 0 0 0 0 0 N/A N/A N/A N/A N/A N/A 0 0 0 0 0 0 N/A N/A N/A N/A N/A N/A 0 0 0 0 0 0 N/A N/A N/A N/A N/A N/ARoyal Tweed Bridge 0 0 0 0 0 0 0 N/A N/A N/A N/A N/A N/A 0 0 0 0 0 0 N/A N/A N/A N/A N/A N/A 0 0 0 0 0 0 N/A N/A N/A N/A N/A N/ABerwick Bridge 0 0 0 0 0 0 0 N/A N/A N/A N/A N/A N/A 0 0 0 0 0 0 N/A N/A N/A N/A N/A N/A 0 0 0 0 0 0 N/A N/A N/A N/A N/A N/AGolden Square 0 2 4 4 4 2 1 N/A N/A N/A N/A N/A N/A 2 4 4 4 2 1 N/A N/A N/A N/A N/A N/A 2 4 4 4 2 1 N/A N/A N/A N/A N/A N/AMain Street (Prince Edward Road to Church Road) 0 0 0 0 0 0 0 N/A N/A N/A N/A N/A N/A 0 0 0 0 0 0 N/A N/A N/A N/A N/A N/A 0 0 0 0 0 0 N/A N/A N/A N/A N/A N/A
Major Roads Where Parking is AllowedPrince Edward Road 14 13 12 12 29 17 10 93% 86% 86% 207% 121% 71% 13 12 12 30 18 10 96% 89% 89% 215% 126% 74% 15 14 14 33 19 11 105% 97% 97% 234% 137% 81%Main Street (West End to Prince Edward Road) 59 48 38 39 44 46 55 81% 64% 66% 75% 78% 93% 50 39 40 46 48 57 84% 67% 69% 77% 81% 97% 53 42 43 49 51 61 90% 71% 73% 82% 86% 103%Main Street (Church Road to Mount Road) 16 17 17 18 14 11 14 106% 106% 113% 88% 69% 88% 18 18 19 15 11 15 110% 110% 117% 91% 71% 91% 19 19 20 15 12 15 118% 118% 124% 97% 76% 97%
NorthwestCastle Drive 94 19 19 17 19 20 22 20% 20% 18% 20% 21% 23% 20 20 18 20 21 23 21% 21% 19% 21% 22% 24% 22 22 19 22 23 25 23% 23% 20% 23% 24% 26%Castle Terrace 32 24 24 24 28 23 25 75% 75% 75% 88% 72% 78% 25 25 25 29 24 26 78% 78% 78% 91% 74% 81% 27 27 27 32 26 28 85% 85% 85% 99% 81% 88%Windsor Crescent 48 17 20 20 27 26 26 35% 42% 42% 56% 54% 54% 18 21 21 28 27 27 37% 43% 43% 58% 56% 56% 19 23 23 31 29 29 40% 47% 47% 64% 61% 61%North Road 37 9 14 22 16 15 15 24% 38% 59% 43% 41% 41% 9 15 23 17 16 16 25% 39% 62% 45% 42% 42% 10 16 25 18 17 17 28% 43% 67% 49% 46% 46%
NorthNorthumberland Avenue 40 24 26 21 31 25 20 60% 65% 53% 78% 63% 50% 25 27 22 32 26 21 62% 67% 54% 80% 65% 52% 27 29 24 35 28 23 68% 74% 59% 88% 71% 57%Warkworth Terrace 28 13 13 14 18 12 13 46% 46% 50% 64% 43% 46% 13 13 15 19 12 13 48% 48% 52% 67% 44% 48% 15 15 16 20 14 15 53% 53% 57% 73% 49% 53%Percy Terrace inc Back Alleys 29 16 15 16 16 16 17 55% 52% 55% 55% 55% 59% 17 16 17 17 17 18 57% 54% 57% 57% 57% 61% 18 17 18 18 18 19 62% 59% 62% 62% 62% 66%Lovaine Terrace 20 16 17 16 16 17 20 80% 85% 80% 80% 85% 100% 17 18 17 17 18 21 83% 88% 83% 83% 88% 104% 18 19 18 18 19 23 91% 96% 91% 91% 96% 113%
CentralHigh Greens 18 12 14 14 15 17 13 67% 78% 78% 83% 94% 72% 12 15 15 16 18 13 69% 81% 81% 86% 98% 75% 14 16 16 17 19 15 75% 88% 88% 94% 107% 82%Low Greens & Violet Terrace 84 38 39 36 39 40 36 45% 46% 43% 46% 48% 43% 39 40 37 40 41 37 47% 48% 44% 48% 49% 44% 43 44 41 44 45 41 51% 53% 49% 53% 54% 49%Bell Tower Place & Bell Tower Park 24 19 15 11 15 20 14 79% 63% 46% 63% 83% 58% 20 16 11 16 21 15 82% 65% 47% 65% 86% 60% 22 17 12 17 23 16 90% 71% 52% 71% 94% 66%Lords Mount 15 1 1 2 10 5 5 7% 7% 13% 67% 33% 33% 1 1 2 10 5 5 7% 7% 14% 69% 35% 35% 1 1 2 11 6 6 8% 8% 15% 75% 38% 38%Castlegate Court 35 27 28 34 29 28 31 77% 80% 97% 83% 80% 89% 28 29 35 30 29 32 80% 83% 101% 86% 83% 92% 31 32 38 33 32 35 87% 91% 110% 94% 91% 100%Brucegate 21 18 21 18 16 17 19 86% 100% 86% 76% 81% 90% 19 22 19 17 18 20 89% 104% 89% 79% 84% 94% 20 23 20 18 19 21 95% 111% 95% 84% 90% 100%Well Close Square 22 20 17 13 0 19 7 91% 77% 59% 0% 86% 32% 21 18 13 0 20 7 94% 80% 61% 0% 90% 33% 22 19 14 0 21 8 101% 85% 65% 0% 96% 35%Ivy Place 0 1 1 0 0 1 0 N/A N/A N/A N/A N/A N/A 1 1 0 0 1 0 N/A N/A N/A N/A N/A N/A 1 1 0 0 1 0 N/A N/A N/A N/A N/A N/A
StationTweed Street 14 15 20 18 15 17 15 107% 143% 129% 107% 121% 107% 16 21 19 16 18 16 111% 148% 133% 111% 126% 111% 17 23 20 17 19 17 121% 162% 146% 121% 137% 121%
East 1Walkergate 5 10 4 8 8 8 6 200% 80% 160% 160% 160% 120% 10 4 8 8 8 6 207% 83% 166% 166% 166% 124% 11 4 9 9 9 7 221% 88% 177% 177% 177% 133%Hatters Lane 3 6 5 4 7 5 5 200% 167% 133% 233% 167% 167% 6 5 4 7 5 5 207% 173% 138% 242% 173% 173% 7 6 5 8 6 6 226% 189% 151% 264% 189% 189%Coxons Lane 6 1 1 0 7 7 7 17% 17% 0% 117% 117% 117% 1 1 0 7 7 7 17% 17% 0% 121% 121% 121% 1 1 0 8 8 8 19% 19% 0% 132% 132% 132%Crawford's Alley 0 3 2 1 2 3 2 N/A N/A N/A N/A N/A N/A 3 2 1 2 3 2 N/A N/A N/A N/A N/A N/A 3 2 1 2 3 2 N/A N/A N/A N/A N/A N/AParade 12 13 12 12 12 11 9 108% 100% 100% 100% 92% 75% 13 12 12 12 11 9 112% 104% 104% 104% 95% 78% 15 14 14 14 12 10 123% 113% 113% 113% 104% 85%Ravensdowne 54 47 47 59 44 46 52 87% 87% 109% 81% 85% 96% 49 49 61 46 48 54 90% 90% 113% 84% 88% 100% 53 53 67 50 52 59 99% 99% 124% 92% 96% 109%
East 2Bank Hill 1 3 4 3 5 3 2 300% 400% 300% 500% 300% 200% 3 4 3 5 3 2 311% 414% 311% 518% 311% 207% 3 5 3 6 3 2 340% 453% 340% 566% 340% 226%Eastern Lane 7 7 9 8 8 8 8 100% 129% 114% 114% 114% 114% 7 9 8 8 8 8 104% 133% 118% 118% 118% 118% 8 10 9 9 9 9 113% 146% 129% 129% 129% 129%Love Lane 0 0 2 0 0 1 1 N/A N/A N/A N/A N/A N/A 0 2 0 0 1 1 N/A N/A N/A N/A N/A N/A 0 2 0 0 1 1 N/A N/A N/A N/A N/A N/ABridge Terrace 5 7 7 6 8 9 7 140% 140% 120% 160% 180% 140% 7 7 6 8 9 7 145% 145% 124% 166% 186% 145% 8 8 7 9 10 8 158% 158% 136% 181% 204% 158%
East 3Ness Street 8 6 7 7 8 8 8 75% 88% 88% 100% 100% 100% 6 7 7 8 8 8 78% 91% 91% 104% 104% 104% 7 8 8 9 9 9 85% 99% 99% 113% 113% 113%Weddell's Lane 0 0 0 0 0 0 0 N/A N/A N/A N/A N/A N/A 0 0 0 0 0 0 N/A N/A N/A N/A N/A N/A 0 0 0 0 0 0 N/A N/A N/A N/A N/A N/AOil Mill Lane 2 3 4 0 0 0 0 150% 200% 0% 0% 0% 0% 3 4 0 0 0 0 155% 207% 0% 0% 0% 0% 3 5 0 0 0 0 170% 226% 0% 0% 0% 0%Palace Street 48 28 28 31 33 33 29 58% 58% 65% 69% 69% 60% 29 29 32 34 34 30 60% 60% 67% 71% 71% 63% 32 32 35 37 37 33 66% 66% 73% 78% 78% 68%Palace Green 28 11 9 8 9 12 9 39% 32% 29% 32% 43% 32% 11 9 8 9 12 9 41% 33% 30% 33% 44% 33% 12 10 9 10 14 10 44% 36% 32% 36% 49% 36%Palace Street East 18 11 11 11 13 12 13 61% 61% 61% 72% 67% 72% 11 11 11 13 12 13 63% 63% 63% 75% 69% 75% 12 12 12 15 14 15 69% 69% 69% 82% 75% 82%The Avenue 3 0 1 0 1 1 3 0% 33% 0% 33% 33% 100% 0 1 0 1 1 3 0% 35% 0% 35% 35% 104% 0 1 0 1 1 3 0% 38% 0% 38% 38% 113%
West 1Blakewell Gardens 30 28 23 24 17 18 22 93% 77% 80% 57% 60% 73% 29 24 25 18 19 23 97% 79% 83% 59% 62% 76% 32 26 27 19 20 25 106% 87% 91% 64% 68% 83%Riverside Road 33 25 17 14 16 18 18 76% 52% 42% 48% 55% 55% 26 18 15 17 19 19 78% 53% 44% 50% 57% 57% 28 19 16 18 20 20 86% 58% 48% 55% 62% 62%Bower's Crescent 16 6 6 8 5 6 7 38% 38% 50% 31% 38% 44% 6 6 8 5 6 7 39% 39% 52% 32% 39% 45% 7 7 9 6 7 8 42% 42% 57% 35% 42% 50%Blakewell Road 32 12 12 14 14 12 12 38% 38% 44% 44% 38% 38% 12 12 15 15 12 12 39% 39% 45% 45% 39% 39% 14 14 16 16 14 14 42% 42% 50% 50% 42% 42%West End 73 34 36 33 33 34 30 47% 49% 45% 45% 47% 41% 35 37 34 34 35 31 48% 51% 47% 47% 48% 43% 38 41 37 37 38 34 53% 56% 51% 51% 53% 47%
West 2Union Brae 0 5 4 0 4 3 0 N/A N/A N/A N/A N/A N/A 5 4 0 4 3 0 N/A N/A N/A N/A N/A N/A 6 5 0 5 3 0 N/A N/A N/A N/A N/A N/AKiln Hill 32 19 19 16 26 26 18 59% 59% 50% 81% 81% 56% 20 20 17 27 27 19 62% 62% 52% 84% 84% 58% 22 22 18 29 29 20 67% 67% 57% 92% 92% 64%Dock Road 117 16 16 15 18 18 14 14% 14% 13% 15% 15% 12% 17 17 16 19 19 15 14% 14% 13% 16% 16% 12% 18 18 17 20 20 16 15% 15% 15% 17% 17% 14%Mill Strand 20 6 6 6 8 7 6 30% 30% 30% 40% 35% 30% 6 6 6 8 7 6 31% 31% 31% 41% 36% 31% 7 7 7 9 8 7 34% 34% 34% 45% 40% 34%Brewery Lane 9 5 4 1 7 5 3 56% 44% 11% 78% 56% 33% 5 4 1 7 5 3 58% 46% 12% 81% 58% 35% 6 5 1 8 6 3 63% 50% 13% 88% 63% 38%Brewery Bank 9 7 6 5 7 8 7 78% 67% 56% 78% 89% 78% 7 6 5 7 8 7 81% 69% 58% 81% 92% 81% 8 7 6 8 9 8 88% 75% 63% 88% 101% 88%Church Road 46 43 31 34 31 31 32 93% 67% 74% 67% 67% 70% 45 32 35 32 32 33 97% 70% 77% 70% 70% 72% 49 35 38 35 35 36 106% 76% 84% 76% 76% 79%Well Square 16 10 12 11 11 11 14 63% 75% 69% 69% 69% 88% 10 12 11 11 11 15 65% 78% 71% 71% 71% 91% 11 14 12 12 12 16 71% 85% 78% 78% 78% 99%Lee's Lane 3 3 2 2 3 3 3 100% 67% 67% 100% 100% 100% 3 2 2 3 3 3 104% 69% 69% 104% 104% 104% 3 2 2 3 3 3 113% 75% 75% 113% 113% 113%Tower Road 16 4 7 4 10 12 13 25 44% 25% 63% 75% 81% 4 7 4 10 12 13 26% 45% 26% 65% 78% 84% 5 8 5 11 14 15 28% 50% 28% 71% 85% 92%Well Road 3 1 1 1 4 4 4 33% 33% 33% 133% 133% 133% 1 1 1 4 4 4 35% 35% 35% 138% 138% 138% 1 1 1 5 5 5 38% 38% 38% 151% 151% 151%Mount Road 35 13 13 12 14 14 15 37% 37% 34% 40% 40% 43% 13 13 12 15 15 16 38% 38% 36% 41% 41% 44% 15 15 14 16 16 17 42% 42% 39% 45% 45% 49%
COLUMN KEY COLUMN KEY COLUMN KEY
= Max % occupancy over 85% = Growth increases max %occupancy to over 85% = Growth increases max %occupancy to over 85%
=Max % occupancy 100% or over =Growth increases max % occupancy to 100% or over =Growth increases max % occupancy to 100% or over
2030 Max Occupancy 2030 Max % OccupancyMarch July March July
CapacityName
2020 Max % OccupancyMarch July
2017 Max Occupancy 2017 Max % Occupancy 2020 Max OccupancyMarch July March July March July

AECOMBerwick-upon-Tweed Parking Study
105