best effort identification - fenix.tecnico.ulisboa.pt · this dissertation presents a best effort...
TRANSCRIPT

Best Effort Identification
Fábio Miguel Calisto Constantino
Dissertation submitted to obtain the Master Degree inCommunication Networks Engineering
JuryPresident: Prof. Paulo Jorge Pires FerreiraSupervisor: Prof. Carlos Nuno da Cruz RibeiroVogal: Prof. Ricardo Jorge Fernandes Chaves
November 2012


Acknowledgments
I would like to thank my parents for giving me the opportunity of having a good education, and
for always supporting me my entire life, a task which I’m sure was not easy.
A big thanks is also in order for all my friends, who gave me continuous support and motivation
throughout this course, giving me the strength to endure some of the more difficult times, and for
their friendship which made my life better every day.
Finally, I would also like to thank my supervisor to whom I express my gratitude for all his
advice, patience and understanding.


Abstract
This dissertation presents a Best Effort Identification system which provides an identification
service of people in the vicinity of a set of sensors. This service is intended to supply applications
that create a customized interaction for each client with the needed identification information of
this person. Typical approaches to obtain the identification of an individual, mainly based on the
filling of forms, are often intrusive and time-consuming, making them unappealing. As such, this
system intends to carry out the identification of individuals in a non-intrusive, automatic fashion,
collecting available information, avoiding user interaction unless strictly necessary. The main
focus of the system, in order to make good identifications, is the correlation of the collected data
from the various sensors along with some external data, given their synergy. We expect this
approach to facilitate the lives of marketers and improve the overall customer experience when
using applications equipped with this system.
Keywords
Identification, Location, Middleware, Event, Sensor, Synergy
iii


Resumo
Esta dissertação apresenta um sistema de identificação "Best Effort" que providencia um
serviço de identificação de pessoas na proximidade de um conjunto de sensores. Este serviço
irá fornecer informação de identificação de clientes a aplicações que criam interacções person-
alizadas para cada indivíduo que a utilize. Abordagens típicas para se obter a identificação de
um indivíduo consistem, em grande parte, no preenchimento de formulários, sendo muitas vezes
intrusivas e um grande desperdício de tempo, o que as torna pouco atractivas. Como tal, este
sistema pretende efectuar a identificação dos indivíduos de uma forma automática e não intru-
siva, coleccionando a informação disponível, evitando a interacção do utilizador excepto quando
estritamente necessário. O foco principal do sistema baseia-se na correlação dos dados recolhi-
dos pelos vários sensores juntamente com alguns dados externos, dada a sua sinergia, de modo
a produzir boas identificações. Espera-se que esta abordagem facilite a vida dos comerciantes e
melhore a experiência do utilizador, ao utilizar aplicações que façam uso este sistema.
Palavras Chave
Identificação, Localização, Middleware, Evento, Sensor, Sinergia
v


Contents
1 Introduction 1
1.1 Motivation . . . . . . . . . . . . . . . . . . . . . . . . . . . . . . . . . . . . . . . . . 3
1.2 Problem formulation . . . . . . . . . . . . . . . . . . . . . . . . . . . . . . . . . . . 3
1.3 Main contribution . . . . . . . . . . . . . . . . . . . . . . . . . . . . . . . . . . . . . 4
1.4 Dissertation outline . . . . . . . . . . . . . . . . . . . . . . . . . . . . . . . . . . . . 4
2 State of the art 7
2.1 Multisensor data fusion . . . . . . . . . . . . . . . . . . . . . . . . . . . . . . . . . 9
2.2 Wi-Fi (IEEE 802.11) . . . . . . . . . . . . . . . . . . . . . . . . . . . . . . . . . . . 9
2.3 Facial Detection/Recognition . . . . . . . . . . . . . . . . . . . . . . . . . . . . . . 11
2.4 Social Networks: Facebook . . . . . . . . . . . . . . . . . . . . . . . . . . . . . . . 14
2.5 Smart Card . . . . . . . . . . . . . . . . . . . . . . . . . . . . . . . . . . . . . . . . 16
3 Architecture 19
3.1 Overall system design . . . . . . . . . . . . . . . . . . . . . . . . . . . . . . . . . . 21
3.1.1 System requirements . . . . . . . . . . . . . . . . . . . . . . . . . . . . . . 21
3.1.2 The sensors . . . . . . . . . . . . . . . . . . . . . . . . . . . . . . . . . . . 21
3.1.3 Confidence levels of identification . . . . . . . . . . . . . . . . . . . . . . . 23
3.1.4 Development environment . . . . . . . . . . . . . . . . . . . . . . . . . . . . 23
3.2 Architecture tools . . . . . . . . . . . . . . . . . . . . . . . . . . . . . . . . . . . . . 25
3.2.1 Event manager . . . . . . . . . . . . . . . . . . . . . . . . . . . . . . . . . . 25
3.2.2 Kinect . . . . . . . . . . . . . . . . . . . . . . . . . . . . . . . . . . . . . . . 26
4 Implementation 29
4.1 Social network sensor . . . . . . . . . . . . . . . . . . . . . . . . . . . . . . . . . . 31
4.1.1 Privacy & Registration . . . . . . . . . . . . . . . . . . . . . . . . . . . . . . 31
4.1.2 Graph API . . . . . . . . . . . . . . . . . . . . . . . . . . . . . . . . . . . . . 32
4.2 Wi-Fi sensor . . . . . . . . . . . . . . . . . . . . . . . . . . . . . . . . . . . . . . . 33
4.2.1 Capturing and filtering network information . . . . . . . . . . . . . . . . . . 33
4.2.2 Locating the individuals . . . . . . . . . . . . . . . . . . . . . . . . . . . . . 35
vii
Contents
4.2.3 Client association . . . . . . . . . . . . . . . . . . . . . . . . . . . . . . . . 36
4.2.3.A Learning mechanism . . . . . . . . . . . . . . . . . . . . . . . . . 37
4.2.3.B Generating the identification event . . . . . . . . . . . . . . . . . . 38
4.3 Biometric sensor . . . . . . . . . . . . . . . . . . . . . . . . . . . . . . . . . . . . . 38
4.3.1 Face detection . . . . . . . . . . . . . . . . . . . . . . . . . . . . . . . . . . 40
4.3.2 Image pre-processing . . . . . . . . . . . . . . . . . . . . . . . . . . . . . . 40
4.3.3 Capturing test images . . . . . . . . . . . . . . . . . . . . . . . . . . . . . . 41
4.3.4 Face recognition . . . . . . . . . . . . . . . . . . . . . . . . . . . . . . . . . 42
4.3.5 Face distance . . . . . . . . . . . . . . . . . . . . . . . . . . . . . . . . . . . 43
4.3.6 Generating the events . . . . . . . . . . . . . . . . . . . . . . . . . . . . . . 44
4.4 Smart card sensor . . . . . . . . . . . . . . . . . . . . . . . . . . . . . . . . . . . . 46
4.4.1 Combining the events from other sensors . . . . . . . . . . . . . . . . . . . 48
4.5 Event manager . . . . . . . . . . . . . . . . . . . . . . . . . . . . . . . . . . . . . . 49
4.5.1 Event Stream Analysis . . . . . . . . . . . . . . . . . . . . . . . . . . . . . . 49
4.5.2 Event synergy example . . . . . . . . . . . . . . . . . . . . . . . . . . . . . 51
4.6 Final output . . . . . . . . . . . . . . . . . . . . . . . . . . . . . . . . . . . . . . . . 53
5 Tests and results evaluation 55
5.1 Test contextualization . . . . . . . . . . . . . . . . . . . . . . . . . . . . . . . . . . 57
5.2 Scenario 1 - Unknown individual . . . . . . . . . . . . . . . . . . . . . . . . . . . . 58
5.3 Scenario 2 - Registered individual, first visit . . . . . . . . . . . . . . . . . . . . . . 58
5.4 Scenario 3 - Registered individual, repeated visit . . . . . . . . . . . . . . . . . . . 60
5.5 Scenario 4 - Multiple registered individuals, first visits . . . . . . . . . . . . . . . . 62
5.6 Scenario 5 - Multiple registered individuals, repeated visits . . . . . . . . . . . . . 63
5.7 Scenario 6 - Registered individual, multiple mobile devices . . . . . . . . . . . . . 64
6 Conclusions 67
6.1 Main conclusions . . . . . . . . . . . . . . . . . . . . . . . . . . . . . . . . . . . . . 69
6.2 Future work . . . . . . . . . . . . . . . . . . . . . . . . . . . . . . . . . . . . . . . . 69
viii

List of Figures
3.1 Network topology of the developed system. . . . . . . . . . . . . . . . . . . . . . . 24
4.1 Sample of packets captured by tcpdump. . . . . . . . . . . . . . . . . . . . . . . . 34
4.2 Some of the networks seen by the Wi-Fi card. . . . . . . . . . . . . . . . . . . . . . 35
4.3 Wi-Fi coverage and worthy/discarded mobile devices. . . . . . . . . . . . . . . . . 36
4.4 Example picture. . . . . . . . . . . . . . . . . . . . . . . . . . . . . . . . . . . . . . 40
4.5 Original image with face area marked (left); Cropped facial image (right). . . . . . . 40
4.6 Greyscale image of the face (left); Equalized greyscale facial image (right). . . . . 41
4.7 Simple video frame captured with the RGB camera (left); Depth map of the envi-
ronment (right). . . . . . . . . . . . . . . . . . . . . . . . . . . . . . . . . . . . . . . 42
4.8 Face recognition with distance measurements. . . . . . . . . . . . . . . . . . . . . 44
4.9 Sensor setup. . . . . . . . . . . . . . . . . . . . . . . . . . . . . . . . . . . . . . . . 47
4.10 Portuguese Citizen Card application output. . . . . . . . . . . . . . . . . . . . . . . 47
5.1 Confidence level of identifications for scenario 2. . . . . . . . . . . . . . . . . . . . 59
5.2 Confidence level of identifications for scenario 3. . . . . . . . . . . . . . . . . . . . 61
5.3 Confidence level of identifications for scenario 4. . . . . . . . . . . . . . . . . . . . 62
5.4 Confidence level of identifications for scenario 5. . . . . . . . . . . . . . . . . . . . 64
ix


List of Acronyms
RSS Received Signal Strength
PDU Protocol Data Unit
DOD Department of Defense
LOS Line of Sight
AOA Angle of Arrival
TOA Time of Arrival
TDOA Time Difference of Arrival
UWB Ultra-Wideband
OSN Online Social Network
SIM Subscriber Information Module
ICC Integrated Circuit Card
PIN Personal Identification Number
PKI Public-Key Infrastructure
JDBC Java Database Connectivity
IDE Integrated Development Environment
ESP Event Stream Processing
CEP Event Correlation Engine
OSS Open-Source Software
EDA Event Driven Architecture
SQL Structured Query Language
EPL Event Processing Language
xi

List of Figures
POJO Plain Old Java Object
OpenCV Open Source Computer Vision Library
OS Operating System
LBPH Local Binary Patterns Histograms
pteidlib (Portugal eID Library)
NFC Near Field Communication
API Application Programming Interface
XML Extensible Markup Language
xii

1Introduction
Contents1.1 Motivation . . . . . . . . . . . . . . . . . . . . . . . . . . . . . . . . . . . . . . . 31.2 Problem formulation . . . . . . . . . . . . . . . . . . . . . . . . . . . . . . . . . 31.3 Main contribution . . . . . . . . . . . . . . . . . . . . . . . . . . . . . . . . . . . 41.4 Dissertation outline . . . . . . . . . . . . . . . . . . . . . . . . . . . . . . . . . . 4
1

1. Introduction
2

1.1 Motivation
In this chapter the problem of identifying and profiling individuals in current context aware
systems is introduced as the motivation for the writing of this dissertation. The problem to be
solved is also explained, followed by the main contributions of this work.
1.1 Motivation
In current times, almost every piece of information is placed online through several means.
With the appearance of social networks, this has become even more evident, and almost everyone
uses them. In an age where technology has reached a point that enables information to be
gathered and analyzed with relative ease, having an identification of an individual leads to much
more information about the subject through searches on the Internet.
Certain applications which serve a vast diversity of goals, such as an online store or a simple
clothes shop in the supermarket, require information such as this about the people using them.
This information must come from somewhere. The usual approach to this revolves around pre-
senting a series of predefined boring questions to the clients, in the shape of forms, which most
people don’t have the time or patience to answer.
Given the slow and uninteresting nature of these typical information gathering systems, the
need is rising to create something flexible and more advanced to captivate people’s attention. A
more interesting method would be to create a system which would gather this information in a
non-intrusive, automatic fashion, allowing the users to focus on their task instead of wasting time.
1.2 Problem formulation
The work proposed by this dissertation makes use of the technologies and information men-
tioned above, proposing a middleware that aims to provide a best effort identification service of
people around a set of sensors to registered applications, based on the available information.
Each sensor will gather particular features of the individual, such as network communications
made by their mobile devices through Wi-Fi, an image of their face, the use of an identifying
smart card, among others, generating special events containing information about the collected
features. Identification will then be inferred from all the information collected given the synergy
between the sensors/features - "The whole is greater than the sum of its parts".
This identification is crucial in order to successfully create a profile of a given individual with
his personal information. The applications interacting with the middleware may require distinct
levels of identification, depending on the functions to be performed. As such, the identification
provided might be as loose as to merely classify the individuals as part of a group, or as tight as
providing an unequivocal identification for more strict functions, e.g. the payment of a debt.
Since most of the information that this middleware intends to use is already made available by
the users, even if indirectly, all that needs to be done is capture the identifying attributes of a given
3

1. Introduction
individual in order to make an online search.
After identifying an individual, many things about him can be found, especially through searches
in social networks, such as personal information (sex, age, address, work place, etc.) or things
that interest them (products, brands, groups, etc.) effectively creating a profile for that individual.
This middleware also aims to provide the service to as many people as possible, making use of
various sensors for different types of sensing. This will allow for an identification even if an indi-
vidual does not have the necessary attributes for all the different types of sensors. However, the
more information extracted from a single individual, the more accurate the identification will be.
The service provided by this middleware will allow marketers to have more information about
their customers, enabling them to provide a better service. Service will improve by, for example,
making good suggestions of products the customers might enjoy, given the profiles created by the
system. This will facilitate the work of the marketers and will improve the overall experience of the
customers, serving them better.
All of the information used by this system is gathered respecting the privacy of the users.
1.3 Main contribution
The main contribution of this dissertation consists on correlating the information generated
by the various sensors. The data gathered by each sensor is, by itself, mostly useless given
that the level of certainty of discrete events is low. It is the ability to take these pieces and form
more complex, more meaningful information that will constitute the core of this work, leading to
an adequate identification of the individuals and subsequent association to their personal profiles.
1.4 Dissertation outline
The present dissertation is organized as follows:
Chapter 1 starts by explaining the motivation for this work, followed by the problem to be solved
and the main contributions of this dissertation.
Chapter 2 presents the state of the art and related work on the technologies suitable for this
master’s thesis.
Chapter 3 describes the implemented architecture along with an explanation for each of the
implementation decisions.
Chapter 4 gives a more detailed overview of the tools used in the development of this work
explaining the reason behind choosing each of them.
Chapter 5 presents some of the experimental results obtained. Results are presented for each
of the different sensors, ending with the results gathered from a fully functional system, correlating
all of the different events generated by each sensor.
4

1.4 Dissertation outline
Chapter 6 presents conclusions about this dissertation along with some suggestions for future
work.
5

1. Introduction
6

2State of the art
Contents2.1 Multisensor data fusion . . . . . . . . . . . . . . . . . . . . . . . . . . . . . . . . 92.2 Wi-Fi (IEEE 802.11) . . . . . . . . . . . . . . . . . . . . . . . . . . . . . . . . . . 92.3 Facial Detection/Recognition . . . . . . . . . . . . . . . . . . . . . . . . . . . . 112.4 Social Networks: Facebook . . . . . . . . . . . . . . . . . . . . . . . . . . . . . 142.5 Smart Card . . . . . . . . . . . . . . . . . . . . . . . . . . . . . . . . . . . . . . . 16
7

2. State of the art
8

2.1 Multisensor data fusion
This chapter will reference some of the related work in the area, as well as the current state
of the art on the technologies chosen to be used in this work, giving a general understanding of
their functionality in order to better introduce them for the future sections of this dissertation.
2.1 Multisensor data fusion
Multisensor data fusion has been an emerging technology for some time now. It had a lot
of popularity in Department of Defense (DOD) areas such as automated target recognition, bat-
tlefield surveillance, and guidance and control of autonomous vehicles. It was also applied to
non-DoD applications such as monitoring of complex machinery, medical diagnosis, and smart
buildings. Techniques for multisensor data fusion are drawn from a wide range of areas including
artificial intelligence, pattern recognition, statistical estimation, and other areas
Data fusion techniques combine data from multiple sensors, and related information from as-
sociated databases or relevant external data to achieve improved accuracies and more specific
inferences than could be achieved by the use of a single sensor alone. As an analogy, one can
think that it might not be possible to assess the quality of an edible substance based solely on the
sense of vision or touch, but evaluation of edibility may be achieved using a combination of sight,
touch, smell and taste. This is something that has been used by humans and animals, which have
evolved the capability to use multiple senses to improve their ability to survive.
While this concept is not new, the emergence of new sensors, advanced processing tech-
niques, and improved processing hardware make real-time fusion of data increasingly possible.
In principle, fusion of multisensor data provides significant advantages over single source data.
In addition to the statistical advantage gained by combining same-source data (e.g., obtaining an
improved estimate of a physical phenomena via redundant observations), the use of multiple types
of sensors may increase the accuracy with which a quantity can be observed and characterized
[13].
With the development of the Internet in recent years it has become possible and useful to
access many different information systems anywhere in the world to obtain information. While
there is much research of the integration of heterogeneous information systems, most commer-
cial systems stop short of the actual integration of available data. Data fusion is the process
of fusing multiple records representing the same real-world object into a single, consistent, and
clean representation [5].
2.2 Wi-Fi (IEEE 802.11)
Wireless technologies have entered the realms of consumer applications, as well as medical,
industrial, public safety, logistics, and transport system along with many other applications.
9

2. State of the art
The main challenge now, in wireless networks, has shifted from speed and capacity to ser-
vices, where context-aware computing became an emerging paradigm [18]. Context is the knowl-
edge of a user’s location, activity, or goals that can be used to filter and modify the way information
is presented, its content or even trigger automatic behaviors that benefit the user. With the tech-
nical advances in ubiquitous computing and wireless networking, there has been a rising need to
capture this context information and feed it into applications.
From the context information available, one of the most interesting features to look at is loca-
tion. Active Badge [31] is one of the first systems designed for indoor location based on infrared
ranging. Since it is necessary to maintain a Line of Sight (LOS) propagation path between the
transmitter and the receiver when using infrared signal, objects in-between can easily block the
signal and degrade the performance of the system. Active Bat [32] and MIT Cricket [25] came
as the successors of Active Badge and are based on the ultrasound technology. The main con-
cern with this technology is that the propagation velocity of the ultrasound is easily affected by
the temperature and humidity, which introduce ranging errors over the long term. A system us-
ing Ultra-Wideband (UWB) was also presented in the Ubisense localization system [29], which
achieves fine-grained indoor localization with good accuracy and precision. However, the cost for
a Ubisense UWB reader is currently a lot higher than that of an 802.11 AP.
Indoor radio-location systems consist of two separate hardware components: a signal trans-
mitter and a measuring unit (where most of the system "intelligence" is placed) and can be classi-
fied on the signal types (infrared, ultrasound, ultra-wideband, and radio frequency), signal metrics
(Angle of Arrival (AOA), Time of Arrival (TOA), Time Difference of Arrival (TDOA), and Received
Signal Strength (RSS)), and the metric processing methods (triangulation and scene profiling).
Systems based on AOA, TOA or TDOA have been proposed and have reportedly achieved
good precision, however, these measurements necessitate special hardware at either the infras-
tructure side or the client side which contributes to increase the cost of these solutions and makes
its use intrusive. Since RSS measurement is based on a sensory function already available in
most 802.11 interfaces, RSS-based indoor localization therefore receives significant attention.
In order to make sense of the measurements collected, most of the location based systems
that use the IEEE 802.11 infrastructure, make a scene analysis of the area and use a probabilistic
approach in order to predict where an object might be located. This technique uses an adequate
representation of an area under observation from a particular point of view in order to identify
scene characteristics and thus draw conclusions about the localization of an object inside this
area, RSS profiling being one of the most popular methods. This is done in two phases: off-line
training and online location determination. The system collects RSS data over a predefined area
in the off-line phase. The RSS data is regarded as the observed data, and the positions are
considered to be class labels. In the online phase, the real time RSS detected on the mobile user
is recorded, and the system is supposed to predict the location of the user based on the RSS [15].
10

2.3 Facial Detection/Recognition
This method has some problems since it requires time to setup, a person needs to walk around
an area with a mobile device registering the RSS values and labeling the positions, and is very
dependent of the environment since in an indoor environment, RF signal propagation is affected
by a number of factors such as multi-path fading, temperature and humidity variations, opening
and closing of doors, furniture relocations, and the presence and mobility of human beings [19].
This technique is thus, not scalable to large environments such as enterprise buildings and fac-
tory floors because they require extremely cumbersome and intrusive re-calibrations in order to
maintain high accuracy in the presence of these changes.
There are also the range-based approaches that collect RSS measurements, estimate the
distances between a client and reference points (usually 802.11 APs), and then apply the trian-
gulation method to derive the client location, which takes away some of the effort of creating an
area model. This method is somewhat more convenient than scene analysis for applications that
merely require the relative location of an individual in the area, rather than its absolute location.
Several systems have been created using the RSS measurement technique to provide local-
ization services to their users. Bahl et al. [2] proposed an in-building user location and tracking
system - RADAR, which operates by recording and processing signal strength information at mul-
tiple base stations positioned to provide overlapping coverage in the area of interest. The goal
of RADAR is to complement the data networking capabilities of RF wireless LANs with accurate
user location and tracking capabilities, thereby enhancing the value of such networks and en-
able location-aware services and applications. RADAR uses the RSS measurements gathered
at multiple receiver locations to triangulate the coordinates of the user. Triangulation is done by
using both empirically-determined and theoretically-computed RSS information corresponding to
a scene analysis of the area of interest.
Horus [36] is another example of a localization system based on RSS measurements. This
system works in a similar way as RADAR, but where RADAR uses deterministic techniques to
estimate the user location, Horus makes a probabilistic approach, storing information about the
signal strength distributions from the access points in the radio-map and using probabilistic infer-
ence algorithms to estimate the user location. Horus system analyzes an aspect of the temporal
characteristics of the wireless channel: samples correlation from the same access point, showing
that the autocorrelation between consecutive samples can be as high as 0.9 and taking this high
autocorrelation into account, to achieve better accuracy.
2.3 Facial Detection/Recognition
A facial recognition system is a computer application that allows for an automatic identification
or verification of a person from a digital image or video frame from a video source. This is done
by comparing the collected facial features from the image with a facial database.
11
2. State of the art
Face recognition systems usually proceed by detecting the face in an image, estimating and
normalizing it for translation, scale and in-plane rotation. Given a normalized image, the features
are extracted and condensed in a compact face representation which can then be stored in a
database or smart card and compared with face representations derived at later times.
Although there are other, extremely reliable methods of biometric personal identification, such
as fingerprint analysis and retinal or iris scans, these methods rely on the cooperation of the
individuals, whereas an identification system based on analysis of images of the face is often
effective without the cooperation or even knowledge of the individuals. It is the nature of this
system that makes it appealing for ubiquitous applications.
For a face recognition system to be successfully deployed, it must be fully automatic. A fully
automatic system detects and identifies/verifies a face in an image or video sequence without
human intervention. Fully automatic face recognition systems generally have two components,
detection and recognition. The detection component serves to locate the face area inside an
image, allowing its retrieval in order to do some processing. The recognition component identifies
or verifies the face [24].
As just mentioned, in order to proceed to face recognition, the first step in this process is to
detect the face. In some cooperative systems, face detection is obviated by constraining the user.
This however goes against the concept of ubiquity and is therefore, more restraining in the range
of applications that can make use of it. This is seen e.g. in common laptops which bring facial
recognition software for login purposes, which forces the user to put his head in a specific position
in order to be recognized. Most systems, however, do not employ this method, given its inherent
problem, using instead, a combination of skin-tone and face texture to determine the location of a
face and use an image pyramid to allow faces of varying sizes to be detected. The use of neural
networks [26] was one of the first most popular methods to perform facial detection.
The most typical use of this technology is in security systems, such as access to restricted
areas and buildings, banks, embassies, military sites, airports, law enforcement. The facial recog-
nition system used by law enforcement to identify people given their mugshots is one of the most
commonly known applications of facial recognition [22]. However, recently many more applica-
tions have been emerging that make use of this technology such as Google’s Picasa digital image
organizer1 that has a built in facial recognition system which associates faces with persons in
order to enable queries to be run on pictures to return all pictures with a specific group of peo-
ple together. Apple iPhoto2 also includes this technology and lets people tag recognized people
on photos and later search them using Spotlight. Facebook3 also included a facial recognition
system in which it would also associate faces to persons and group all the pictures in which an
individual would appear, in their profile [23].
1GooglePicasa - http://picasa.google.com/2Apple iPhoto - http://www.apple.com/ilife/iphoto/3Facebook - www.facebook.com
12

2.3 Facial Detection/Recognition
Biometric devices normally consist of 3 elements:
• a scanner / reader that captures the user’s biometrics characteristics.
• a software that converts this data into digital form and compares it with data previously
recorded.
• a database, which stores the biometric data.
The process of identifying an individual using these systems comprises 4 main steps: sample
capture, feature extraction, template comparison, and matching. At enrollment, the biometric
features of the individual are captured by the scanner. The software converts the biometric input
into a template and identifies specific points of data as "match points". The match points are then
processed by specific algorithms, into a value that can be compared with biometric data in the
database.
Biometric facial recognition systems will measure and analyze the overall structure, shape and
proportions of the face: distance between the eyes, nose, mouth, and jaw edges; upper outlines
of the eye sockets, the sides of the mouth, the location of the nose and eyes, the area surrounding
the cheekbones. [4]
Most approaches are based on a principal components representation of the face image in-
tensities. This representation scheme was first devised for face image compression and subse-
quently used for recognition. In recognition, eigenfaces [20] are the most commonly used for this
type of representation together with a principal component analysis. It’s algorithms are explained
in [20], [16] respectively. These principal components represent the typical variations seen be-
tween faces and provide a concise encapsulation of the appearance of a sample face image, and
a basis for its comparison with other face images.
The common approach to face recognition involves the following initialization operations:
1. Acquire an initial set of faces (training set).
2. Create a face space with the templates generated from the unique data (features) extracted
from the samples.
With the system initialized, new faces may be fed to it, following these steps in order to do
recognition:
1. Preprocess the new test images in order to normalize the pictures, making it easier to do
recognition - resize to standard resolution, greyscale the image, normalize light and contrast,
etc.
2. Calculate the differences (distance) between the test image and the face space.
13

2. State of the art
3. Determine which of the faces in the face space is the most similar to the test image and
return the most likely match.
After having processed a face and extracted its features, these are stored and transmitted as a
face template. For each representation type, a distance or similarity measure is defined that allows
"similar" faces to be determined. This similarity measurement is what correctly discriminates
between samples from the same person and samples from different people. As with any biometric
system, some threshold on similarity must be chosen above which two face images are deemed
to be of the same person. Altering this threshold gives different False Accept and False Rejection
rates. Choosing one over the other depends on the level of security required. This is a trade-
off against convenience and security: user-friendly matchers have a low false reject rate, while
secure matchers have a low false accept rate.
Even though being described here as the best type of biometric identification system, facial
recognition is not perfect and still struggles to overcome some obstacles. Problems such as phys-
ical changes: facial expression change; aging; personal appearance (make-up, glasses, facial
hair, hair style), viewing angle of the face and imaging changes such as lighting variation and
camera variations can lead to failures in recognition. A good example of this is the Canadian
passport, in which the authorities now only authorize the use of neutral facial expressions in pass-
port photos [27].
Currently, an emerging technique, claimed to achieve improved accuracies, is three-dimensional
face recognition. This technique has several advantages over the 2D systems, namely that it is
not affected by changes in lighting like other techniques and it can also identify a face from a
range of viewing angles, including a profile view. If the collected image is 3D and the database
contains 3D images, then matching will take place without any changes being made to the image.
However, there is a challenge currently facing databases that are still in 2D images.
2.4 Social Networks: Facebook
"One can say that social is the engine of Web 2.0: many websites evolved into Web applica-
tions built around users, letting them create a Web of links between people, to share thoughts,
opinions, photos, travel tips, etc" [7].
Social networks are the most relevant change in the use of the World Wide Web, and are often
considered the next step in its evolution. Millions of people are creating profiles for themselves,
entities, organizations or groups, creating a digital social structure.
Given that social networks represent not only an online socialization platform but also a sort
of database of knowledge about each of the users, a new topic comes to mind: information
extraction.
In this subsection, Facebook will be addressed given that it is currently the most popular Online
14

2.4 Social Networks: Facebook
Social Network (OSN) available.
As is well known, Facebook is currently the center of attentions in OSNs, having more than
800 million active users, more than 900 million objects that people interact with (pages, groups,
events and community pages) and more than 250 million pictures uploaded per day [33].
The typical Facebook user makes personal information available for everyone to see in their
profile. Information such as their full name, address, schools, place of work, date of birth, etc. is
shown on their page. Aside from this personal information, all the "likes" a person has made and
pictures uploaded are discriminated in their profile. By making friends in Facebook and creating
relationships with them or special relationship bonds with family members, Facebook creates an
entire network for the given user, showing their friends and even all family members. This enables
for quick searches by their friends to find out about their daily activities and current events, but
also for third parties seeking to extract information. Add to this the fact that Facebook has and is
improving a location based service where people can share their location when they generate a
Facebook event, and almost everything about the user is known at any given time.
A face recognition software was also included that allows to associate persons with faces. This
feature was presented to users as an option to tag their friends in pictures, to give the option of
later another friend reaching the profile of that individual just by having access to the picture. This
tagging feature, although liked by many, was seen as a grave privacy breach by others.
Facebook has been fighting several law suits over their facial recognition software which allows
the identification of individuals from pictures. Not only this, but the technology can also help third
parties locate the social security numbers of Facebook users, just from the information on their
Facebook profiles and their photo. This is an harmful example, but exemplifies the potential
of information extraction from social networks. "About 90% of Facebook users use their real
identities on the network. If you combine this fact with another, i.e., that the vast majority also use
frontal face photos of themselves as their primary profile photos (which, by the way, Facebook
makes visible to all by default), you end up with the concept of a de facto Real ID" [12].
It is the fact that a Real ID can be attained from a profile photo combined with the possibility to
extract this information that makes Facebook an interesting tool to look at in terms of using it as
an identification service.
The task of extracting and analyzing data from OSNs has attracted the interest of many re-
searchers. These networks are a very interesting topic to many, since a complete study of the
structure of large real communities were impossible or at the very least expensive before, and the
ability to discover real-life relationships, often hardly identifiable. In order to make these studies,
it is necessary to develop the tools to acquire and analyze the data from very large OSNs. It
was estimated in 2010 that the crawling overhead required to collect the entire Facebook graph
would be 44 Terabytes of data [11]. Various different techniques were developed to crawl large
social networks and collect data from them. Various algorithms were created by third parties
15

2. State of the art
that took into consideration factors like: Node Similarity Detection, Community Detection, Influ-
ential User Detection, etc. The major goal of these efforts is best described by Kleinberg [17]:
"topological properties of graphs may be reliable indicators of human behaviors". Most of the de-
veloped techniques based themselves in crawling the front-end of websites, given that the OSNs
datasets are not usually publicly accessible, data is stored in back-end databases that are only
accessible through the Web interface [10]. The typical approach for crawling these websites for
information was carried out by utilizing search algorithms such as Breadth-First Search or Ran-
dom Walk such as used by Gjoka et al. However, some problems appear to those seeking to
mine information from Facebook, in the form of user privacy. These restrictions make it harder
to extract information through the conventional crawling methods. More recently, in order to facil-
itate the work of developers, Facebook made available a tool by the name of "Graph Application
Programming Interface (API)" [34] which presents a simple, consistent view of the Facebook so-
cial graph, uniformly representing objects in the graph (e.g., people, photos, events, and pages)
and the connections between them (e.g., friend relationships, shared content, and photo tags).
From a business perspective, this tool would "give marketers new ways to make sense of a user’s
preferences, passions and connections, which are the ’objects’ of their lives." [37].
2.5 Smart Card
This section will provide an overview of the current state of the art in Smart Cards. Its main
benefits, utilities and characteristics will be described.
By definition, a Smart Card is an electronic device that can participate in an automated elec-
tronic transaction, with security, and is not easily forged or copied. This is mainly what distin-
guishes a Smart Card from the regular magnetic stripe cards, since these do not have processing
power and can easily be copied or forged.
Smart cards can be seen as many different things: microcomputer card, electronic purse, train
ticket, Subscriber Information Module (SIM) card for mobile phones, etc.
Smart cards were invented due to the difficulties posed by the expensive telecommunications
required for the much cheaper magnetic-stripe technology. Because any individual with access
to the appropriate device can read, rewrite or delete data on a magnetic-stripe card, such cards
are unsuitable for storing sensitive data. As such, they require extensive online, centralized, back-
end infrastructures for verification and processing. Given the costs and problems derived from
establishing these infrastructures, an alternative which could operate securely offline was sought.
Starting with concept definition in the early 1960s and following patents in 1968, developers made
huge improvements over magnetic-stripe technology introducing the Integrated Circuit Card (ICC),
also dubbed the "smart card" or "chip card". As significant progress was made in cryptography
during the 1960s, smart cards proved an ideal medium for safely storing cryptographic keys and
16

2.5 Smart Card
algorithms of the type needed in bank cards. [14]
The three core functions of smart cards are:
• Information storage and management
• Identification of the card holder
• Calculation (especially for encryption/decryption)
These functions lead to a large variety of uses, having authentication, portable personality,
portable data files, data transport and stored value, as the five most popular ones. Given the
nature of this master’s thesis, more emphasis will be given to the authentication feature, since
smart cards offer good means of identifying an individual. Usually this is based on a user name
and a password or Personal Identification Number (PIN), but other authentication methods are
already available or under test, such as biometrics. Fingerprint scanning along with smart identity
cards is in routine use already in some countries and retinal scanning is widely used for military
access control.
From a consumer marketer perspective, online commerce represents great opportunities for
growth and profit. But it also poses new challenges, primarily in terms of authentication and
non-repudiation for the prevention of fraud.
The smart cards with Public-Key Infrastructure (PKI) capabilities allow consumers to attach
digital signatures to online transactions they make. Technologies such as cryptography make it
virtually impossible to forge or alter these signatures. This means that a strong identification of the
individual is provided and the consumer marketers know precisely with whom they are conducting
business. Moreover, an anti-fraud system is also provided because a cardholder cannot deny or
repudiate a transaction verified by a digital signature. These features add motivation for the use
of the technology in order to create safe and easy online commerce [6]..
Smart cards are also a very portable technology enabling their users to access privileges
virtually anywhere. They will be able to insert their cards into computers, telephones or terminals
that are equipped with smart card readers, turning a generic device into a highly personalized
one.
In order to assure interoperability between different Smart Cards and the terminals, standards
were created, defining the proper ways to communicate with the cards as detailed in [8].
The citizen card4 is a very good and relevant example of a smart card used for authentication
purposes.
4CartaoCidadao - http://www.cartaodecidadao.pt/
17

2. State of the art
18

3Architecture
Contents3.1 Overall system design . . . . . . . . . . . . . . . . . . . . . . . . . . . . . . . . 213.2 Architecture tools . . . . . . . . . . . . . . . . . . . . . . . . . . . . . . . . . . . 25
19

3. Architecture
20

3.1 Overall system design
This chapter will cover the architecture of the developed system starting by presenting the
overall system design followed by the system requirements. The development environment and
external tools used are also presented here.
3.1 Overall system design
This section presents the overall system design chosen for the development of the present
work.
The system created here acts a middleware, serving applications that have registered in the
system. These applications expect to receive information about people inside certain areas of
interest, allowing some personalized action or information to be presented to that person. As
such, the main focus of this work resides on the identification of individuals that enter these areas
of interest which consist of the coverage area of a set of sensors. These sensors could be of
many different types, but what is important is that each of the sensors is capable of sensing a
particular set of data. Relevant data is defined as the personal characteristics of each individual,
which may come from different sources, but all have something that is specific to that user and
adds knowledge to the system. This relevant data is not only comprised of identifying attributes
of the individual, but also information that is somehow connected to this person, which serves to
create a user profile. After an identification is made, all information about that given individual is
sent to the registered applications.
3.1.1 System requirements
For the system to be able to provide good quality of service for the users, a set of system
requirements must be ensured.
1. The identification of the individuals should be as non-intrusive as possible, i.e. the interaction
between the user and the sensors should be as little as possible and adequate to the level
of identification requirement.
2. The system should try to identify as many people as possible, relating information gathered
from the various sensors in order to gain more information.
3. Identification must be made in a time window that makes sense to the business logic.
4. Disclosure of private information should be explicitly controlled by the users.
3.1.2 The sensors
In this architecture, four different types of sensor were implemented. They are: Wi-Fi sensor
for mobile devices; Smart card sensor; Biometric sensor (Kinect) for facial recognition; Social
21

3. Architecture
network (Facebook) sensor. Each of these sensors will collect specific kinds of data and were
chosen considering that simplicity and ubiquity was desired.
• The Wi-Fi sensor will scan for the periodic communications made by Wi-Fi devices. Wi-
Fi capable mobile devices are something which is nowadays used by everyone and their
Wi-Fi communications contain some powerful data, such as a unique identifier and location
information.
• The smart card sensor will make use of identifying smart cards in order to retrieve as much
information as possible, by accessing the card’s data. These smart cards are small, very
portable items, packed with important and useful features, namely authentication and the
storage of personal data. Looking at citizen cards, which nowadays are also smart cards,
this becomes another item which is also used by everyone.
• Facial recognition is an identification technique which is performed over images of an in-
dividual’s face, which by using the biometric sensor, can be captured easily and analyzed.
Again, this is usable by everyone, as long as a non-obstructed face is presented.
• Finally, the social network sensor will complement the profile of an individual with his publicly
available information on this person’s Facebook page. The choice of the social network was
obvious, since it is the current number one social network in the world, and the number of
people using it is very large and is continuing to rise.
As can be seen, each of the sensors is equipped with very distinct sensory capabilities. They
will capture different types of data in very different ways and it is important that each of the sensors
performs well to guarantee a smooth operation of the overall system. One of the most important
parts for this is the collection and management of the available data. As was just mentioned, each
of the sensors operates in a very specific way and the data each one collects is unique, however,
in order for the system to function correctly, the data must be analyzed properly by a common unit
to every sensor, which can process the information from each of them and make sense of it as a
whole. Therefore, when one of the sensors captures meaningful data, it must be able to send it to
the system, and this is done in the form of an event. The information captured by the sensors is
encapsulated in events and sent to an event management unit, which is programmed to receive
them and take some sort of action upon them.
The events generated by these sensors will be correlated by the event manager which con-
sumes them, stores them and generates new events. By storing information the event manager
will enrich its knowledge, thus allowing for the generation of more complex events. One of the rele-
vant aspects for the effective correlation of the events is the combination of localization and timing.
The sensors will, as best as possible, tag all the events generated with the spatial-temporal loca-
tion of the individual that originated it. This feature will effectively allow the middleware to decide
that several events generated in the same spatial-temporal area, relate to the same individual.
22

3.1 Overall system design
The type of correlation between events is configured in order to provide a high-level inter-
face for the specification of the business logic. As such, a generic event manager was used,
programmed through a specific high-level language, in this case, Java.
3.1.3 Confidence levels of identification
One of the most important characteristics of this system is the fact that it deals with a lot of
uncertainty. Each of the sensors chosen have a specific margin for error which must be taken into
account in order to produce good results. As the title of this dissertation suggests, the system
operates on a best effort premise, and as such, most of the times, the information generated will
not be 100% accurate. The most challenging aspect of this work is precisely dealing with these
uncertainties in such a way, that by looking at several events generated from different sources,
more information can be inferred, producing better results even if the original pieces of informa-
tion were not very reliable. A case where this can be easily demonstrated is when capturing Wi-Fi
information in the coverage area. Even if the Wi-Fi sensor is working perfectly and generating
extremely accurate information, the information itself is mostly useless. The applications regis-
tered in the system would have no use for information about a random Wi-Fi capable device in
the coverage area. The same happens with facial recognition, as an image of a face alone also
means nothing. It is the fact that this information can be correlated that makes this work interest-
ing and worthwhile for the registered applications, e.g. if the Wi-Fi information previously captured
could be associated with an individual, this would provide an accurate identification in future visits
by this person. Also, if the previously captured face image could be matched against a training
facial database which contained sample images of registered clients, an identification could be
performed with that face image.
After such associations are made, the system has much better means of identifying individuals
in the area. This identification can come from an event generated by a single sensor, given a
correct association to this type of sensor had been done previously. But again, each sensor
has a specific error margin, which means that identifications made from different sensors would
have distinct accuracy. To manage this, each identification made has its own confidence level
corresponding to which and how many sensors participated in that identification.
3.1.4 Development environment
This section presents the environment in which the system was developed. Figure 3.1 illus-
trates the network topology used.
As shown in figure 3.1, this work was developed on three different machines.
This topology was chosen, taking into account that at least two different machines were
needed to work as Wi-Fi sensors. As will be explained in more detail in the respective sec-
tion, the Wi-Fi sensors communicate with each other, to determine which mobile devices are in
23

3. Architecture
Figure 3.1: Network topology of the developed system.
both sensors’ coverage area. As such, machine 1 and 2 are both equipped with a Wi-Fi sensor.
Machine 1 holds most of the remaining sensors, the biometric sensor and the smart card sensor.
Both these sensors make sense to be placed in the same machine since useful information can
be obtained this way, such as capturing face images of the person using the smart card. Machine
3 was chosen to carry the part of the work corresponding to the social network sensor and the
system’s database. This machine also had the advantage of being one of the machines in cam-
pus available to students, which allowed external connections to the network. With this feature,
many more tests could be made, having many different people use the social network sensor from
their homes. The choice of placement of the database here was made because this is a machine
operating all day, every day, accessable by the remaining machines in the system, and is well
managed.
Machines 1 and 2 were running the Linux Ubuntu operating system version 11.04, and ma-
chine 3 had Debian 6.0.5. Most of the programming done for this work was written in Java with
the assistance of external Linux programs. HTML and PHP were also used for web development,
Python and C++ for programming some of the face recognition functions, and MySQL to create
the system database along with Java Database Connectivity (JDBC) to access it using Java. The
entire development was made using Eclipse, a multi-language software development environment
comprising an Integrated Development Environment (IDE) and an extensible plug-in system. The
specific libraries and external programs used are referenced and explained in their respective
sections.
24

3.2 Architecture tools
3.2 Architecture tools
In the development of this dissertation, some external tools were used to perform some of
the core functionalities of the work. This section presents those tools along with the reasons that
motivated their choice.
3.2.1 Event manager
As has been mentioned along this dissertation, the implemented system makes use of sev-
eral sensors, each capable of sensing a different type of feature. These sensors are constantly
collecting data and need to feed it to the system in order to make sense of it. As such, each of
the sensors will generate an event when meaningful data is captured and feed it to applications or
services which generate new events on their turn. To provide this feature, an event management
unit was chosen in order to correlate events generated by the various sensors. This will allow
the system to generate more complex and meaningful events, leading to more information and a
better identification of a person.
"Information is critical to make wise decisions. This is true in real life but also in computing.
Information flows in from different sources in the form of messages or events, giving a hint on the
state at a given time" [9]. That said, looking at discrete events is most of the time meaningless.
The system needs to look at the events received possibly combined with other information to make
the best identification at the right time. The software required to work with these events is Esper1,
an open source Event Stream Processing (ESP) and Event Correlation Engine (CEP) written in
Java.
While there are other solutions for managing complex event processing, such as: Oracle
CEP2, SQLStream3, IBM WebSphere4, ActiveInsight5, among others, Esper was chosen taking
into consideration that it is Open-Source Software (OSS), well-documented, designed specifically
for real-time architectures, and written in Java, providing an easy programming interface and is
suitable for integration into any Java process.
Esper enables rapid development of applications that process large volumes of incoming mes-
sages or events. It filters and analyzes events in various ways, and responds to conditions of
interest in real-time.
While discrete events when looked one by one might be meaningless, event streams, i.e.
that is a continuous set of events, considered over various factors, such as time or location of
occurrence, and further correlated, are highly meaningful, providing the applications using the
middleware with enough information to take decisive action.
1Esper - http://esper.codehaus.org/2Oracle CEP - http://www.oracle.com/technetwork/middleware/complex-event-processing/overview/3SQLStream - http://www.sqlstream.com/4WebSphere - http://www-01.ibm.com/software/websphere/5ActiveInsight - http://www.activeinsight.org/
25

3. Architecture
Targeted to real-time Event Driven Architecture (EDA), Esper basically instead of working as
a database where data is stored to later poll it using Structured Query Language (SQL) queries,
Esper works as a real time engine that triggers actions when event conditions occur among event
streams. A tailored Event Processing Language (EPL) allows registering queries in the engine,
using Java objects (Plain Old Java Object (POJO), JavaBean) to represent events. A listener
class - which is basically also a POJO - will then be called by the engine when the EPL condition
is matched as events come in. The EPL allows expressing complex matching conditions that
include temporal windows, and join different event streams, as well as filter and sort them.
The Esper engine provides a high abstraction and can be thought of as a database turned
upside-down: instead of storing the data and running queries against stored data, Esper al-
lows applications to store queries and run the data through. Response from the Esper engine
is real-time when conditions occur that match user defined queries. The execution model is thus
continuous rather than only when a query is submitted.
3.2.2 Kinect
The Kinect is a motion sensing input device by Microsoft for the Xbox 360 video game console.
Based around a webcam-style add-on peripheral for the Xbox 360 console, it enables users to
control and interact with the Xbox 360 without the need to touch a game controller, through a
natural user interface using gestures and spoken commands [21].
The Kinect is equipped with two cameras, one RGB, for face recognition and display video, and
one infrared, for tracking movement and depth. Although this is a proprietary product of Microsoft,
open-source drivers for the Kinect are being made available, which are interesting in the scope of
this dissertation, mainly to perform face detection and recognition.
In the work developed, the Kinect will be used since it has great potential in the fields of motion
tracking and facial recognition. It will make use of a biometric trait that every person (in normal
conditions) has, a face, and provide the middleware with an identifying feature of the individuals,
enabling the search for these people in social networks, given the captured face.
The way the optical system works, on a hardware level, is fairly basic. An infrared laser is
projected into the room and the sensor is able to detect what is going on based on what is reflected
back at it. Together, the projector and sensor create a depth map. The regular video camera is
placed at a specific distance from the 3D part of the optical system in a precise alignment, so that
the Kinect can blend together the depth map and RGB picture [35].
The regular camera does the traditional camera work, while the infrared light sensor mea-
sures depth, position and motion. The RGB camera needs light while the other does not. Facial
recognition uses both.
The infrared camera will allow the system to know when an individual has stepped in front of
the camera, using the motion detector. By measuring depth, the Kinect is able to determine if the
26

3.2 Architecture tools
individual is close or far away, in order to decide if it is necessary to take action or not, depending
on the requirements of the application. By combining the RGB camera captures with the depth
map, it is possible to detect the face of the individual, the distance it is at, and afterwards, attempt
face recognition using the collected facial features.
27

3. Architecture
28

4Implementation
Contents4.1 Social network sensor . . . . . . . . . . . . . . . . . . . . . . . . . . . . . . . . 314.2 Wi-Fi sensor . . . . . . . . . . . . . . . . . . . . . . . . . . . . . . . . . . . . . . 334.3 Biometric sensor . . . . . . . . . . . . . . . . . . . . . . . . . . . . . . . . . . . 384.4 Smart card sensor . . . . . . . . . . . . . . . . . . . . . . . . . . . . . . . . . . . 464.5 Event manager . . . . . . . . . . . . . . . . . . . . . . . . . . . . . . . . . . . . . 494.6 Final output . . . . . . . . . . . . . . . . . . . . . . . . . . . . . . . . . . . . . . 53
29

4. Implementation
30

4.1 Social network sensor
After presenting the system architecture, this chapter will provide the implementation details
for each of the relevant parts of the system.
4.1 Social network sensor
The first sensor presented is the social network sensor. Facebook was used for this part of the
work as it is currently the most popular social network around, contains a lot of useful information,
is very easy to use, and offers several important development tools through its Graph API. It
consists of a big network of people which have their own profiles available online, filled with as
much personal information as the user chooses to upload. A system such as the one presented
in this dissertation has a lot of use for information such as this in order to profile and identify
individuals.
Since the system requires a registration from the users in order to identify them, the privacy
and registration choices implemented are described.
4.1.1 Privacy & Registration
In order to protect the privacy of the individuals in the system’s coverage area, personal infor-
mation will only be gathered and used if the individual is already a registered client in the system.
To provide this feature, a small registration step is required, having the user simply do a Facebook
login on the system’s Facebook page. This page was created with simple HTML and PHP in order
to interact with Facebook’s Graph API, and placed online as an App on Facebook. Having the
page be seen as an App by Facebook, enables special developer functionalities which proved
useful as will be explained here. At the time of the login, the user is presented with an information
disclosure agreement, which, if accepted, successfully registers the new client in the system. This
registration method was chosen taking into account the fact that people do not want to waste their
time with boring registrations, and that the login feature in Facebook is fast, simple to use and is
known to everyone using this social network. The (customizable) disclosure agreement is one of
the many useful features of Facebook’s Apps.
When a new client is registered, some more steps are taken by the server managing these
requests. If the information disclosure agreement is accepted, all information from the user is
pulled from Facebook by the system and stored in a database. Information such as:
• Facebook id
• Facebook link
• Profile picture
31
4. Implementation
• Name
• Birth date
• Gender
• Hometown
• Workplaces
• Relationship status
• Likes
The items presented here are not the only ones which can be collected from Facebook, more
can be obtained for other uses, however, for the work developed here, these were the attributes
used. As can be seen, a lot of information can easily be obtained from a social network, and all
that was needed were two simple clicks from the user. By having the user agree to the information
disclosure agreement, the system is able to bypass the privacy barriers imposed on the user’s
profile by Facebook, which is often only visible by their close friends. This is done by using
Facebook’s Graph API.
4.1.2 Graph API
"At Facebook’s core is the social graph; people and the connections they have to everything
they care about. The Graph API presents a simple, consistent view of the Facebook social graph,
uniformly representing objects in the graph (e.g., people, photos, events, and pages) and the
connections between them (e.g., friend relationships, shared content, and photo tags)." [34].
This API allows developers to access many different functions, namely, information extraction.
To be able to access these functions and start pulling information from a user’s profile, the sys-
tem’s Facebook app requires an "access token" which is generated the moment the user accepts
the privacy agreement. This access token is also stored in the database, together with the user’s
personal information, allowing for future accesses when they are required. Without this token,
Facebook would reject all attempts of pulling information from a user’s profile, except the public
information. Out of the different types of tokens, the long-term access token was chosen, to pro-
vide the system with the longest access time (60 days). Further user visits to the system’s page
will also refresh the access token which enables virtually endless access as long as the user is
interested in using the system.
In order to keep the clients’ information fresh, every time the system triggers an event which
corresponds to an identification of a user, the user’s information is pulled from Facebook once
more, updating the database.
32
4.2 Wi-Fi sensor
If, for some reason a client no longer wishes to be part of this identification system, all that
needs to be done is remove the access control corresponding to the application from his Facebook
profile, actively revoking the access token, making further attempts to pull information fail.
From the attributes collected, the most relevant ones for identification are the name, birth date
and profile picture. These are the attributes that are checked when trying to associate Smart
Card data with a client’s profile (more detailed in the Smart Card sensor section), where the
name is compared, followed by the birth date, and if there is still some ambiguity after these two
verifications, facial recognition is also performed, trying to match the facial picture in the card
with the profile picture from Facebook. This association assumes that the client uses a Facebook
profile picture of himself containing a frontal view of his face, the name used in the profile also
corresponds to his real name (at least the first and last name, case and accentuation do not
need to match) and the birth date given is either empty (some people don’t like to divulge this
information in social networks) or the correct one. For a face recognition identification only the
profile picture of the user is needed. The rest of the attributes are mostly used for informational
purposes, in order to create a profile of the client.
Since the id given to users by Facebook is unique and every registered client in the system has
a Facebook account, this id is used in every other type of identification when some id is needed
to refer a client.
4.2 Wi-Fi sensor
One of the sensors implemented as part of this middleware for identification is the Wi-Fi sen-
sor. This sensor will monitor the network, searching for signals which correspond to potential
customers.
The Wi-Fi sensor used in this work is composed by the receiver, a simple Wi-Fi card in monitor
mode, and the transmitter, the user’s mobile device. Since ubiquity is desired, the choice for these
two components was very straightforward. A Wi-Fi card is now a very common component in any
computer, and having the users’ mobile devices serve as the transmitters removes the need for
any other specialized hardware that the user would need to carry otherwise (very intrusive).
This sensor was developed using tcpdump1 and iwlist2 managed by a Java program, and
aircrack-ng3 to set the Wi-Fi cards to monitor mode.
4.2.1 Capturing and filtering network information
In order to capture network information, the following tcpdump command is used: "tcpdump
-i mon0 -s0 -nn -vv -e -tttt". The -i mon0 simply indicates which interface to monitor; -s0 is used
1tcpdump - www.tcpdump.org2iwlist - http://linux.die.net/man/8/iwlist3aircrack-ng - http://www.aircrack-ng.org
33

4. Implementation
because tcpdump does not usually collect the entire packet, and using this option forces it to do
so; the -nn option disables name and port resolution of the network addresses; -vv creates a more
verbose output which is easier to read and parse; the -e option is very important since it prints the
link-level header on each dump line, which, without it, no MAC address would be seen; -tttt prints
a timestamp in default format proceeded by date on each dump line. An example output of this
program call is shown in figure 4.1, showing the packets captured by the network, after the Wi-Fi
card has been set to monitor mode.
Figure 4.1: Sample of packets captured by tcpdump.
With these options enabled, the fields needed by the system are present, such as the time the
packet was sent, its source and destination addresses, RSS value and type of packet. This output
is then parsed to only obtain the relevant sections of the dump lines, creating Wi-Fi events and
sending them to the event manager.
It works by capturing all the packets in the network, filtering out the undesirable information.
Since the goal of this work is to do identification, the only useful information for this sensor is
the information corresponding to potential customers. Since every Wi-Fi device has a unique
identifier, the MAC address, it is easy to identify and differentiate incoming packets, grouping
them up based on their types. The first step is to filter out the MAC addresses of access points.
This is done by doing a network scan with an iwlist scan command, sending out probe requests
and listening to which devices answer back, as shown in figure 4.2.
This process is made periodically in case new access points enter the area. Since some
access points might be hidden, i.e, do not respond to probe requests, any devices that send out
beacons are also filtered out. When all the AP packets have been filtered out, it is assumed that
the remaining activity in the network is generated by client devices which will be tagged as clients
by the system and identified by their MAC address.
34

4.2 Wi-Fi sensor
Figure 4.2: Some of the networks seen by the Wi-Fi card.
4.2.2 Locating the individuals
Another very important aspect of this sensor is the ability to gather location information about
the mobile devices in the area. This can be done since the signals generated by the devices are
emitted with a certain power, which can be measured by the Wi-Fi cards listening. The Wi-Fi
cards receiving the packets will be able to measure the RSS of each one and use this information
to have some notion of distance. The usual approach to measure distance and determine a
location by location based systems would be to triangulate the signals received after a scene
analysis of the area, however, these methods assume a constant stream of packets coming from
the mobile devices at a very high rate, which is usually achieved by having the client carry some
sort of specialized hardware or modified software in their mobile devices, since the use given to
the mobile devices by the clients is unpredictable (which would not generate enough information
for this type of localization). Given this constraint, the method developed here consists only of two
computers acting as listeners (both Wi-Fi cards in monitor mode), which will try to determine a
relative position based on as much Wi-Fi activity as they can capture.
From all the signals received, each Wi-Fi sensor will determine if a client is within a certain
power range and tag it as a "worthy client" or discard it if the RSS is too low. When a given packet
is deemed "worthy", the sensor will generate an event, and send it to the middleware. This event
will contain all the information gathered by the sensor, such as the MAC address, time seen and
RSS value, as illustrated in table 4.1, and is stored in the event manager.
Wi-Fi eventMAC address 04:1e:64:ef:bd:37
RSS value -36dBTime seen 2012-08-21 12:10:16
Table 4.1: Example Wi-Fi event.
If a "worthy" event is generated by both Wi-Fi sensors in a small time window having the same
35

4. Implementation
MAC address, it means that this network information is being generated from the same mobile
device and that it is inside the coverage area, between both sensors. This is seen by the event
manager as a meaningful event and will generate a new event type named "wi-fi client event".
Only this type of Wi-Fi event will be considered by the developed middleware as a client event
for Wi-Fi identification purposes. Using this method, network information generated out of the
interest zone but still being picked up by one of the sensors is discarded. Figure 4.3 illustrates
this.
Figure 4.3: Wi-Fi coverage and worthy/discarded mobile devices.
4.2.3 Client association
Having this new "wi-fi client event", more work can be done on the Wi-Fi information collected.
As stated before, network information by itself, is pretty much useless for identification purposes,
however, when it is associated with a client, the possibilities for this type of information increase.
After assigning a MAC address to a client, be it through facial recognition or smart card presence
(both methods will be explained in their respective section), any future visits by this client will
generate more, and better data for the system, as an identification can now be produced by merely
analyzing the Wi-Fi data. Every time a client event is generated, the MAC address information it
contains is matched against the system’s database, in order to check if it belongs to any registered
client. If the MAC address does belong to a registered client, given that it is a unique identifier, an
identification can already be made, since it is known that this client is now present in the system’s
coverage area.
The confidence level assigned to identifications made by the Wi-Fi sensor alone will be of a
medium level. Since a MAC address is unique, there is not much room for error when trying to
find out if the mobile device originating the detected packet is present in the coverage area or not,
making it a very good way to detect the presence of a client.
36

4.2 Wi-Fi sensor
4.2.3.A Learning mechanism
Given that sometimes more than one Wi-Fi signal may have a strong RSS at the time of
association, the system allows for the association of more than one MAC address to each client,
which the system stores in the database as pertinent information, ordered by confidence level
based on the RSS of the signals. Doing this enables various possibilities for identification. One
way of handling this would be to allow the identification of a client to be made from any of the
several MAC addresses associated to him, creating a lower confidence value but also a higher
identification rate, even if that would mean more false positives. In the current implementation,
only the best match is considered. To make the system more flexible, all that is needed to change
this identification behavior is modify a simple database query to accept a more wide array of
results. Tables 4.2 and 4.3 show an example of Wi-Fi associations made to the client, starting
with its initial state.
Client Wi-Fi associationsFábio
Table 4.2: Initial client state.
Mac addresses present Client Wi-Fi associations04:1e:64:ef:bd:37 Fábio 04:1e:64:ef:bd:37 -37dB4c:aa:16:17:47:8e Fábio 4c:aa:16:17:47:8e -41dB00:04:23:bd:b7:08 Fábio 00:04:23:bd:b7:08 -42dB00:b0:d0:86:bb:f7 Fábio 00-b0-d0-86-bb-f7 -47dB
Table 4.3: First association made to the client (with multiple mobile devices present in the area).
However, since the amount of packets generated by the clients’ devices is unpredictable (de-
pends on the activity of the user, if the device is in standby mode or even if it has Wi-Fi turned on
or off), an incorrect association of the MAC address to a client might be created, e.g. a mobile de-
vice further away from the sensor might be generating higher power signals, confusing the system
into assuming that this is the closest mobile device and therefore, it must belong to the user. In
order to try and correct this problem, the system learns from every visit made. If a client that had
been assigned a given MAC address is detected in a future visit by some other sensor and that
MAC address is not present in the coverage area, it is assumed that an error was possibly made
in the association step, having measures being taken, from the replacement of the MAC address
by a new, more probable one, to a complete reset by the system erasing any Wi-Fi association
made to that client. This will allow for future identifications made on a client to strengthen the
value of the stored Wi-Fi data, and also for the removal of possible mix-ups from erroneous MAC
addresses that happened to be detected in a close vicinity of the client at the same time, which
could cause some confusion. Table 4.4 represents the evolution of the Wi-Fi associations made
to the example client in table 4.3, by following the process explained here.
37

4. Implementation
Mac addresses present Client Wi-Fi associations4c:aa:16:17:47:8e Fábio 4c:aa:16:17:47:8e -41dB00:08:c7:1b:8c:02 Fábio0c:0c:0b:42:ad:e9 Fábioe0:f8:47:3b:2f:94 Fábio
Table 4.4: Posterior association made to the client.
The system thus learns, by making an intersection from the known client associations and
the Wi-Fi data present in the area, effectively removing MAC addresses that did not belong to
the client and maintaining the most likely ones. This learning mechanism is particularly useful in
this case, where the system, in case of ambiguity, associates multiple MAC addresses to each
client. While it has the advantages described above, and allows for new ways of identification,
more associations to a client also equals a higher uncertainty. As such, by learning from each
visit, the system filters out bad associations previously made, increasing the confidence of the
identifications.
4.2.3.B Generating the identification event
To avoid an excessive amount of identification events being sent in the system, identifications
made by Wi-Fi will only be refreshed every so often, i.e. these events are only produced for
each client from time to time. To conserve flexibility and simplicity, to change such behavior all
that needs to be done is alter an event statement to accept a higher or lower time interval, more
events per interval, among many other options accepted by the event manager. This allows for
the administrators configuring this system to set the time intervals which make sense for their
applications easily. In the current implementation, the test value of ten minutes was used.
4.3 Biometric sensor
For the biometric sensor, face recognition was the method chosen to perform identification of
individuals. This type of sensor was chosen given its innate ubiquitous nature, especially when
compared with other types of biometric sensors, and the fact that biometric information is provided
when a user registers in the system, the Facebook profile picture. One of the biggest problems
of this sensor comes from the fact that a person may have a picture not corresponding to himself
or a facial picture containing sun glasses or some sort of mask as a profile picture in Facebook.
In these cases, the profile picture is useless as the system will not even be able to detect a face
to later use as comparison for recognition. For this reason it is assumed that the clients have a
profile picture containing the frontal face of themselves, otherwise, face recognition would not be
possible from Facebook information alone.
One of the first problems encountered when using this type of identification was the fact that
the normal way of doing it required a large amount of sample images of the users to be rec-
38

4.3 Biometric sensor
ognized. When using the profile picture from Facebook, only one sample image was obtained,
which caused some bad results as will be explained in more detail in the current section. To try
and resolve this issue, a different approach was experimented for sample image collection. Face-
book’s graph API also enables developers to access data about a given client’s pictures. This
data contains information about which people are present in the picture (if they were tagged by
their friends) and also the coordinates of the face, which seemed like a very appealing feature.
This extra information would allow the system to search for the client’s face not only on his profile
picture, but in all photos in which the client was tagged. However, this method was not imple-
mented in the final version of this work. Although it seemed like a very interesting way of dealing
with the problem, it originated more uncertainty than actually contributing. The problem here is
that the tags in the pictures are inserted by humans through a very simple interface provided by
Facebook, which pretty much tells a person to draw a square or rectangle around the desired
person’s face in order to tag it. This means that most of the times these tags would represent an
area much larger/smaller than the actual face area, introducing a lot of error. Combining this with
the fact that the only coordinates given by Facebook for the face area correspond to the top left
corner of that area, and it becomes a lot more difficult to obtain accurate information. After testing
with several picture albums of various people, the samples obtained with this method, more often
than not, corresponded to incorrect people in the image, effectively degrading the sample data
even more. Another interesting case that produces incorrect data is when people take a picture
that contains zero faces, but tag it anyway, simply to say that certain people were present when
the picture was taken.
The facial recognition part of this work was developed using Microsoft’s XBOX360 Kinect as
the sensor; OpenKinect4 to provide the open source drivers, libfreenect, that enables the Kinect
to be used with Windows, Linux and Mac; Open Source Computer Vision Library (OpenCV)5
as the library of programming functions for real time computer vision; haarcascades to perform
face detection in the video frames or pictures of the individual; libfacerec6 as a complement of
OpenCV for more specific recognition functions. A Java wrapper, JavaCV7, was used to integrate
this development section in the remaining code, and a Python wrapper was used in order to
be able to program both the Kinect interactions and the face recognition algorithm in the same
language.
To do face recognition on pictures or video frames from a live video feed, several steps must
be followed. The first step is to train the recognition system with a set of facial pictures to be able
to later have a matching set for the test pictures. This set of training facial pictures will come from
the system’s face database, comprised of the profile pictures collected from each individual upon
their registration on Facebook, Smart Card pictures in case the client uses the Smart Card sensor,4OpenKinect - http://openkinect.org5OpenCV - http://opencv.org6libfacerec - https://github.com/bytefish/libfacerec7JavaCV - http://code.google.com/p/javacv
39

4. Implementation
and some video frame captures which are stored in very specific conditions. Every face image
will be stored in the face database, identified by the clients’ respective Facebook id. However,
the pictures in this database need some pre-processing before being stored to clean up the facial
image for easier recognition. The following steps are used to do this:
4.3.1 Face detection
The pictures coming from the above mentioned sources need to be cropped in order to only
save a smaller image which only contains the face section. Figure 4.4 shows a test image in its
initial state.
Figure 4.4: Example picture.
This image cropping is done since all image data aside from the face is irrelevant for recog-
nition. For the system to know which area of the image to crop, the face must first be detected.
To achieve this, haarcascades are used which provide the system with face classifiers, and with
OpenCV, using these face classifiers is a lot simpler. Instead of using the facial detection function
directly, OpenCV provides a great API to call a face detection function which uses a provided
haarcascade to automatically detect a face in a given image. Figure 4.5 shows an example of
face detection applied to a video frame and the resulting image after cropping.
Figure 4.5: Original image with face area marked (left); Cropped facial image (right).
After the cropped image has been created, it is subjected to a series of pre-processing tech-
niques, which are explained in the following subsection.
4.3.2 Image pre-processing
When a cropped image of the face is created, it still needs some processing before it is stored
in the database. The reason for this is that most face recognition algorithms are extremely sen-
sitive to lighting conditions, so sensitive that typically when trying to do recognition on a non
pre-processed image, the results tend to have under 10% accuracy. Therefore, it is extremely
40

4.3 Biometric sensor
important to apply various image pre-processing techniques to standardize the images supplied
to a face recognition system. In the current implementation, the following pre-processing methods
were applied:
1. Resize of the images, so that every picture is in the same resolution.
2. Converting the color image to greyscale.
3. Apply Histogram Equalization for consistent brightness and contrast of the facial images.
Figure 4.6 shows the cropped image after being greyscaled and the final pre-processed face
image ready to be stored in the facial database.
Figure 4.6: Greyscale image of the face (left); Equalized greyscale facial image (right).
The equalized greyscale face image seen above represents the final state of the image after
being subjected to preprocessing, and is now ready to be stored in the face database. These
steps are applied to every image given to the system, with the purpose of being used as training
data.
4.3.3 Capturing test images
After having the training set ready, test images can be given to the system in order to do face
recognition. The previous subsections refer to using a set of methods and software to obtain
preprocessed face images from pictures. There is a difference, however, from pictures to live
video feed frames. The pictures are simple image files given to the system, either by pulling them
from Facebook, using the face picture contained by the Smart Card, or video frames saved in the
database in specific occasions. In the work developed, for face recognition to make sense, the
test images must come from a real time environment to enable recognition of the people inside
the sensor coverage area on the spot. Therefore, the first step is to capture the test images.
To capture images, a camera is required. For the current implementation, Microsoft’s XBOX360
Kinect was chosen to perform the captures. A simpler, cheaper camera could also have been used
for this function, however, the Kinect is not only a camera, but it is also a sensor, equipped with
some features that proved useful in other identification purposes. Since this work was developed
in Linux and the Kinect was originally designed to be used with Microsoft’s XBOX360, some soft-
ware configurations are needed before being able to use the Kinect. For Ubuntu (Operating
41

4. Implementation
System (OS) chosen for the implementation), it is required to install the OpenKinect drivers,
libfreenect, to be able to access the Kinect’s sensory functions.
It is now possible to start capturing video with the Kinect. As stated before, the Kinect is not
only a camera, but a sensor, having a RGB camera for common video capture and a depth sensor
which creates a depth map of what is in range. Figure 4.7 shows a video frame example captured
with the Kinect, along with its corresponding depth map.
Figure 4.7: Simple video frame captured with the RGB camera (left); Depth map of the environ-ment (right).
4.3.4 Face recognition
Before doing face recognition, the same preprocessing of images as described above, in sub-
section image pre-processing, is applied to the captured video frames. Since the video being
captured is no more than a set of frame images, the exact same process can be applied, once
more having only the face section of the image being processed and used for matching in face
recognition.
Finally, the system is ready to recognize faces. This is done by taking the face images of
the live video feed and matching them to the face database in order to seek which of the stored
known faces is most similar. This process is more commonly done using the well-known models,
Eigenfaces or Fisherfaces [3]. These models were tested in the development phase and proved
to give very bad results. This happens because these models need data to work, the more the
better. As such, they are not well suited for conditions such as the ones restricted by this work,
which bases itself on using only a small set of training images. Both these methods are based
on estimating the variance of the data, requiring a larger training set to do recognition at a decent
level. Later, Local Binary Patterns Histograms (LBPH) [1] was used, which proved to work a lot
better in this small sample scenario. This method is very different from the other two, since it works
as a local feature based method, which is more robust against variations in pose or illumination
than holistic methods.
Since one of the most determining factors to decide if recognition is made successfully is
illumination, and given that there is no control by the system on the conditions in which the client’s
Facebook profile picture was taken, another preprocessing method was used, TanTriggs [28],
combining it with LBPH, thus creating a more robust face recognition model.
42

4.3 Biometric sensor
Most of these methods are implemented in the latest version of OpenCV, which was the library
chosen to implement this part of the work, using libfacerec for some extra functions.
The implementation made in this work is different from common face recognition systems.
Instead of taking a face image and attempting only a single match with the face database, several
attempts are made from the stream of video frames being fed to the system. This method allows
to make a somewhat inaccurate system more reliable, only accepting a recognition as successful
if a training face is chosen as the best match 70% more times than other potential faces, from at
least 20 recognition attempts (20 different video frames). An example of this evaluation process
is illustrated in table 4.5.
Match Occurrences Best matchFábio 15 XHugo 3
Eduardo 2
Table 4.5: Successful recognition from video frames.
If, however, no match reaches the 70% acceptance rate, or not enough samples have been
provided, the recognition is considered as failed, as demonstrated in table 4.6.
Match Occurrences Best matchFábio 10Hugo 6
Eduardo 3Scarlett 1
Table 4.6: Failed recognition from video frames.
This acceptance threshold of 70% was chosen after some testing, which proved to give good
balance over client recognition and false positives. The value can be easily configured, to serve
different requirements, enabling a more robust and precise recognition with lower recognition
rates, or higher recognition rates with a higher number of false positives.
If a person leaves detection range/pose the current capture is terminated, generating a result if
the match attempts reached its minimum required value, or simply resetting the algorithm, making
it ready for the next face.
4.3.5 Face distance
Besides the previously mentioned processes, another important feature for this work is the
detection of how far away the client is from the camera. This is done using the Kinect’s Depth
sensor and it’s open source library, libfreenect. As was demonstrated in figure 4.7, the depth
sensor creates a depth map of the area, allowing developers to access information about this map.
Using libfreenect, it is possible to describe this map as a matrix, where each position corresponds
to a given point in the image, containing the distance value of each point in millimeters.
43

4. Implementation
Figure 4.8 demonstrates face recognition working over video frame images, with this distance
method applied.
Figure 4.8: Face recognition with distance measurements.
This distance measurement of the face is done by capturing the area of the face, accessing its
central point, and using the distance value of this point (typically it corresponds to the nose), as
illustrated in figure 4.8 as the dot in the center of the face.
Distance is important because it allows the system to isolate faces in the camera’s range.
When several people are in range of the Kinect, the face detection algorithm detects every face in
the area. This can have its uses for other applications or future work, however, for face recognition,
it would only generate confusion when trying to match the several test images at the same time.
As such, only the closest face is considered by the system, since it is more likely that the closest
person is the one doing some sort of relevant action near the camera (e.g. using the smart card).
With this face isolation, confusion in the recognition of a person is greatly minimized.
4.3.6 Generating the events
When a recognition is made, it must be evaluated to decide if it has been successful or not. In
case of success, the sensor will generate an event named "camera client" and send it to the event
manager. This event will have information regarding the recognized client, in this case, its Face-
book id, which is the unique identifier associated to each client. This event always corresponds
to a registered client since failed attempts of recognition do not generate any event in the system.
From this event, the middleware knows that this client is present in the coverage area, the time of
the occurrence, and the position of the user inferred from the depth information of the Kinect.
At the time of this identification, more complex events can be generated if enough information
is available. By having an identification being made from the client’s face, a direct connection can
be made to that client’s profile, opening up more possibilities, namely for the Wi-Fi sensor. Every
time a face is detected by the system, a storage of Wi-Fi events begins. These events are contin-
uously stored as long as that face is being detected. When the face leaves detection range/pose,
the Wi-Fi event storage is stopped and an analysis of the stored events is performed. From all
44
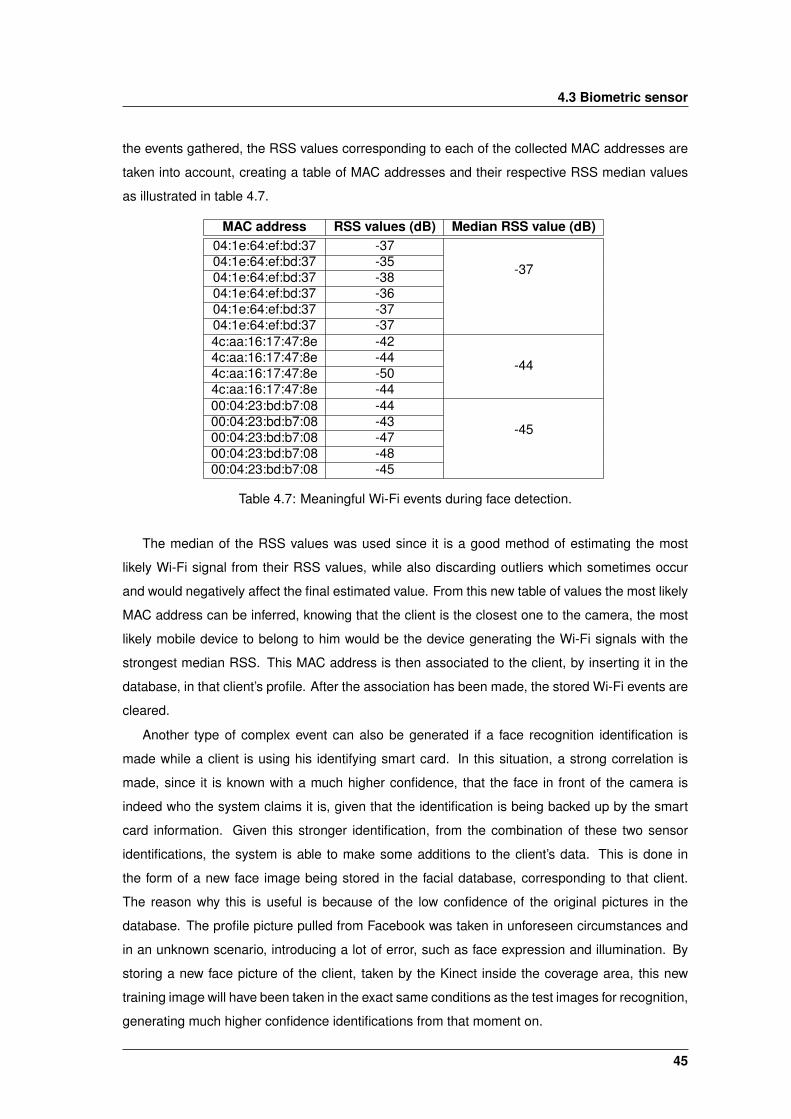
4.3 Biometric sensor
the events gathered, the RSS values corresponding to each of the collected MAC addresses are
taken into account, creating a table of MAC addresses and their respective RSS median values
as illustrated in table 4.7.
MAC address RSS values (dB) Median RSS value (dB)04:1e:64:ef:bd:37 -37
-3704:1e:64:ef:bd:37 -3504:1e:64:ef:bd:37 -3804:1e:64:ef:bd:37 -3604:1e:64:ef:bd:37 -3704:1e:64:ef:bd:37 -374c:aa:16:17:47:8e -42
-444c:aa:16:17:47:8e -444c:aa:16:17:47:8e -504c:aa:16:17:47:8e -4400:04:23:bd:b7:08 -44
-4500:04:23:bd:b7:08 -4300:04:23:bd:b7:08 -4700:04:23:bd:b7:08 -4800:04:23:bd:b7:08 -45
Table 4.7: Meaningful Wi-Fi events during face detection.
The median of the RSS values was used since it is a good method of estimating the most
likely Wi-Fi signal from their RSS values, while also discarding outliers which sometimes occur
and would negatively affect the final estimated value. From this new table of values the most likely
MAC address can be inferred, knowing that the client is the closest one to the camera, the most
likely mobile device to belong to him would be the device generating the Wi-Fi signals with the
strongest median RSS. This MAC address is then associated to the client, by inserting it in the
database, in that client’s profile. After the association has been made, the stored Wi-Fi events are
cleared.
Another type of complex event can also be generated if a face recognition identification is
made while a client is using his identifying smart card. In this situation, a strong correlation is
made, since it is known with a much higher confidence, that the face in front of the camera is
indeed who the system claims it is, given that the identification is being backed up by the smart
card information. Given this stronger identification, from the combination of these two sensor
identifications, the system is able to make some additions to the client’s data. This is done in
the form of a new face image being stored in the facial database, corresponding to that client.
The reason why this is useful is because of the low confidence of the original pictures in the
database. The profile picture pulled from Facebook was taken in unforeseen circumstances and
in an unknown scenario, introducing a lot of error, such as face expression and illumination. By
storing a new face picture of the client, taken by the Kinect inside the coverage area, this new
training image will have been taken in the exact same conditions as the test images for recognition,
generating much higher confidence identifications from that moment on.
45
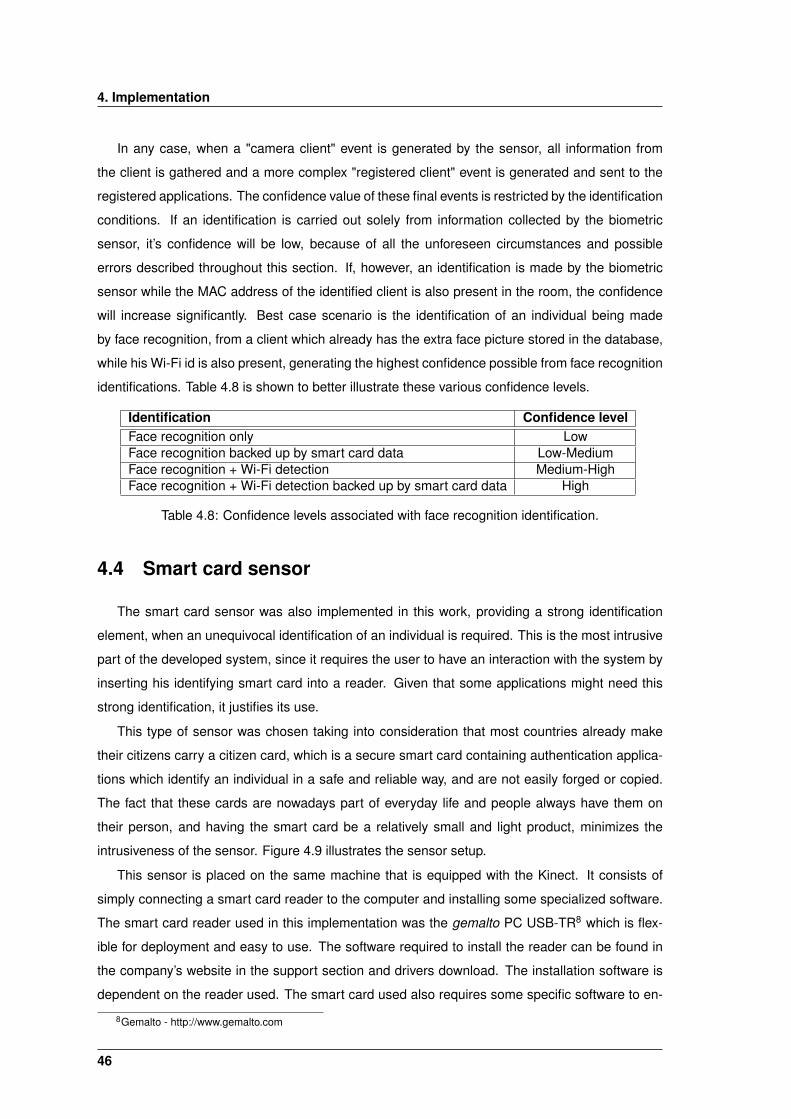
4. Implementation
In any case, when a "camera client" event is generated by the sensor, all information from
the client is gathered and a more complex "registered client" event is generated and sent to the
registered applications. The confidence value of these final events is restricted by the identification
conditions. If an identification is carried out solely from information collected by the biometric
sensor, it’s confidence will be low, because of all the unforeseen circumstances and possible
errors described throughout this section. If, however, an identification is made by the biometric
sensor while the MAC address of the identified client is also present in the room, the confidence
will increase significantly. Best case scenario is the identification of an individual being made
by face recognition, from a client which already has the extra face picture stored in the database,
while his Wi-Fi id is also present, generating the highest confidence possible from face recognition
identifications. Table 4.8 is shown to better illustrate these various confidence levels.
Identification Confidence levelFace recognition only LowFace recognition backed up by smart card data Low-MediumFace recognition + Wi-Fi detection Medium-HighFace recognition + Wi-Fi detection backed up by smart card data High
Table 4.8: Confidence levels associated with face recognition identification.
4.4 Smart card sensor
The smart card sensor was also implemented in this work, providing a strong identification
element, when an unequivocal identification of an individual is required. This is the most intrusive
part of the developed system, since it requires the user to have an interaction with the system by
inserting his identifying smart card into a reader. Given that some applications might need this
strong identification, it justifies its use.
This type of sensor was chosen taking into consideration that most countries already make
their citizens carry a citizen card, which is a secure smart card containing authentication applica-
tions which identify an individual in a safe and reliable way, and are not easily forged or copied.
The fact that these cards are nowadays part of everyday life and people always have them on
their person, and having the smart card be a relatively small and light product, minimizes the
intrusiveness of the sensor. Figure 4.9 illustrates the sensor setup.
This sensor is placed on the same machine that is equipped with the Kinect. It consists of
simply connecting a smart card reader to the computer and installing some specialized software.
The smart card reader used in this implementation was the gemalto PC USB-TR8 which is flex-
ible for deployment and easy to use. The software required to install the reader can be found in
the company’s website in the support section and drivers download. The installation software is
dependent on the reader used. The smart card used also requires some specific software to en-
8Gemalto - http://www.gemalto.com
46

4.4 Smart card sensor
Figure 4.9: Sensor setup.
able communication between the reader and the card, and accessing the card’s data. The smart
card used for testing was the Portuguese Citizen Card, a smart card which contains important
information about their owner and is required by law that everyone carries it. Its software can be
found on the Portuguese Citizen Card website, containing information about its usage as well as
technical manuals. Upon installation of the citizen card’s software, one specific library is installed
which is important to refer. The (Portugal eID Library) (pteidlib)9 is contained in every installation
and was used to make direct accesses to the smart card’s data. This sensor was implemented
in Java, using the pteidlib as the API to retrieve information from the card. Figure 4.10 shows the
output of the citizen card application.
Figure 4.10: Portuguese Citizen Card application output.
The sensor is configured to get the reader ready as soon as the system is turned on, putting
it on a standby mode where it waits for a card to be inserted. Upon the insertion of the card,
communication with it is initialized and all relevant information about the client is retrieved. This
is easily done with the functions provided by pteidlib which serves to abstract the low level, much
harder to understand Protocol Data Unit (PDU) communications. Information such as illustrated
in figure 4.10 is obtained and the facial picture of the client is also stored in the system’s facial
database. This action will also trigger the generation of a "smart card event" which is sent to the
event manager, trying to figure out if the card belongs to a registered user. This event contains9pteidlib - http://www.cartaodecidadao.pt
47

4. Implementation
all the information retrieved from the smart card: name; gender; date of birth; nationality; civil id
number; parents names; facial picture. When the event is received by the event manager, the
system will look in the known users database searching for users with similar names. The search
is not made trying to find an exact name match since the names used in Facebook might be a
bit different from the user’s real name, caused by things such as the absence of accentuation or
the omission of middle names, as explained previously in the privacy & registration section. As
such, more than one user might seem like a positive result, given that people with the same name
are a reality. To further specify the search and remove the bad candidates, the birth date of the
individual is also matched. If more than one user is found by searching a name, the birth date will
certainly thin out the result space. If there is still some ambiguity in the identification (users with
the same name and same date of birth) the face recognition algorithm is called, using the photo
contained in the smart card as the test image.
After a user is successfully identified with the smart card, the client profile is updated, replacing
the Facebook name with the one in the citizen card which is the complete and exact name of the
person, the date of birth which might not have been filled in on Facebook is also replaced by
the one in the citizen card, and all remaining information retrieved from the card is added to the
client’s profile. Another important addition is the facial picture present in the card, which is also
added to the facial database of the system, increasing future facial recognitions. This sensor is,
thus, not only adding to the knowledge of the system but also actively improving the information
present in the system’s database with more accurate data. Given the nature of the sensor and
the card used, identifications produced by it will have the highest confidence in the system.
The high confidence of this sensor enables for good associations to be made with the other
sensors. An important factor that is taken into account for this is the timing and location. Since this
sensor requires the insertion of the smart card in the reader, the location of that client is known
with good accuracy. Having the sensor placed in the same machine as the one equipped with
the Kinect enables face recognition to be performed while the client is using his smart card, and
knowing the location of the client also allows for accurate association with Wi-Fi information.
4.4.1 Combining the events from other sensors
When a person uses the smart card, an event is triggered, warning the system of the presence
of a card. At this time, the event manager will start combining events generated from the smart
card sensor with the ones from the Wi-Fi sensor. The information contained by both events will
be joined in a more complex, combined event. These special events are only generated while the
presence of a smart card is detected. Since the events generated from the Wi-Fi sensor contain
information about the RSS of the signals present in the area, it is possible to determine which is
the most likely mobile device of the client. An interesting characteristic of these combined events
is the fact that there is no repetition of identifiers. What this means is that instead of creating a
48

4.5 Event manager
new data structure to store the Wi-Fi information and later look at it, the event manager is capable
of processing the events in such a way that when a new Wi-Fi event is received, all the events
with the same MAC address identifier are grouped up as one while having the median of the RSS
calculated simultaneously.
Just as is done with face recognition - Wi-Fi associations, a learning mechanism is also imple-
mented here. Since there might be more than one likely mobile device in the area, associations
of more than one mac address are also possible here. Just as before, the system learns from
repeated visits by the client, updating its profile, strengthening the correct data and filtering out
the bad.
Face recognition information being added to the system is the big difference here, as it was
not possible with any other sensor. Since the smart card sensor provides such strong confidence
in its identifications, and knowing that the user is in front of the Kinect at the time of that identifi-
cation, face images of the individual can be gathered and added to the facial database, strongly
contributing to future face recognition identifications being made.
4.5 Event manager
In the architecture tools section of this dissertation, the event manager software used in this
work was explained. However, it has been mentioned throughout the chapter, that events are
generated by the sensors and sent to the event manager, without fully detailing it’s functionality.
The present section intends to shed some light on the components developed to make this work.
The event manager is essentially a software component which is prepared to receive events
from multiple sources, passing each one through defined rules which will analyze these events
and decide if action needs to be taken upon them. Events are simple Java objects, which
are a simple, rich and versatile way to represent them in Esper. Maps and Extensible Markup
Language (XML) were alternative methods of representing the events, but given the development
environment for this work, Java objects was the most adequate choice.
Esper also provides a programming language, EPL, which allows developers to create state-
ments, similar to the well known SQL queries, to analyze and filter the events coming in. These
are continuous queries registered with an Esper engine instance that provides results to listeners
as new data arrives, in real-time, or by demand via the iterator (pull) API. Listeners are invoked
by the engine in response to one or more events that change a statement’s result set.
4.5.1 Event Stream Analysis
The above mentioned EPL statements derive and aggregate information from one or more
streams of events, to join or merge event streams, and to feed results from one event stream to
subsequent statements.
49
4. Implementation
As was referred, the EPL language is similar to SQL, especially in its use of the select and
where clauses. However, these statements instead of using tables use event streams and a
concept called views. These views will define the data available for querying and filtering, and
can represent windows over a stream of events. They can also sort events, derive statistics from
event properties, group events or handle unique event property values.
This is a sample EPL statement that looks at client events and filters the registered client ones:
select * from Client where fb_id is not 0
Since the sensors (especially Wi-Fi sensors) can generate a lot of events corresponding to
registered clients at a very fast pace, this statement can be altered to only accept the first regis-
tered client event that arrives for each identifier:
select * from Client.std:firstunique(fb_id) where fb_id is not 0
With this new statement, the event manager will keep track of every registered client event
being received and only accept the first one. This will, of course, accept the first client event for
every distinct identifier, otherwise only the first registered client entering the coverage area would
be identified, and that would simply not do! What this alteration does is make the event manager
"remember" the client identifiers received, accepting the first registered client event with a new
identifier and discarding all the others which had already been seen.
One problem that is easy to spot with this statement, is the fact that for the entire time the
system is running, a client would only be identified once. This might be useful for some applica-
tions, but it is not the case here. As such, another alteration to the statement is required, which
will change the behavior of the event manager to only "remember" a client identifier for a limited
amount of time, i.e. after this time has passed, a previously seen registered client can once more
be identified:
select * from Client.std:firstunique(fb_id).win:time(10 min) where fb_id is not 0
This statement is now set to only accept the same client identification event every 10 minutes
through the use of a configurable time window.
As was just shown, statements can easily be altered to answer specific needs, such as demon-
strated by these constraints. Many other different statements were used in the development of
this work, some as simple as the one shown here, others much more complex. Each of them are
used to answer specific needs and every single one can easily be modified if needed.
Five types of operators are available to use in statements:
1. Operators that control pattern finder creation and termination: every
2. Logical operators: and, or, not
50

4.5 Event manager
3. Temporal operators that operate on event order: -> (followed-by)
4. Guards are where-conditions that filter out events and cause termination of the pattern
finder, such as timer:within
5. Observers observe time events as well as other events, such as timer:interval, timer:at
Finally, by attaching a listener to the statement the engine provides the statement’s results to
the listener which can then do further work on the received data. These are used to do operations
over the data contained in the events, such as e.g. interactions with the system’s database to
match some of the event information received with it.
4.5.2 Event synergy example
Now, for a better explanation of the synergy between the sensors, another example is shown
here, detailing a more complex query involving the data generated from two distinct sensors:
"insert into CombinedEvent(macAddress, lastSeen, dbValue, name, gender, " +
nationality, birthdate, civilIdNumber, timeSeen)" +
"select WorthyWifiClient.macAddress," +
"WorthyWifiClient.lastSeen," +
"WorthyWifiClient.dbValue," +
"SCClient.name," +
"SCClient.gender," +
"SCClient.nationality," +
"SCClient.birthdate," +
"SCClient.civilIdNumber," +
"SCClient.timeSeen ";
where the CombinedEvent is a new event structure, created to hold the data shown here,
WorthyWifiClient is the event being sent from the Wi-Fi sensors after all have decided that the
MAC address does indeed correspond to a client (as explained in section 4.2) and the SCClient
corresponds to the event type being generated by the Smart Card sensor upon the insertion of
an identifying smart card by a client (note that dbValue is the RSS measurement). This statement
is essentially saying that whenever a smart card is being used, all of the events generated by the
Smart Card sensor and the Wi-Fi sensor are combined into the new event type, CombinedEvent.
As is simple to understand, if there are no Wi-Fi events being generated at the time, no combined
events will be created, and the same applies to the time periods where there are no smart cards
being used.
51

4. Implementation
This new event not only holds the information of the two simpler events, but also another very
important piece of data. Knowing that this combination of events was generated at the same time,
and by knowing where the Smart Card reader is, the system is now aware of location and timing
relating to the individual. Adding to this the data collected by the Wi-Fi sensor about the RSS of the
signals, and it is possible to check which of the detected mobile devices in the area is closer to the
Smart Card reader. After realizing this, the next logical step is to make the association between
the Smart Card data and the most likely network id, correlating the information and adding to
the personal profile of the client. From this point onward, if the MAC address was previously
unknown, it will now be enough to identify the individual in future visits. In case the MAC address
was already associated with the individual by some other mean, e.g, biometric association, the
smart card data will strengthen the confidence of any future identifications made with this MAC
address.
This can be done by creating another statement:
"create context averageRSSContext30Sec initiated by "+
"pattern[every-distinct(a.macAddress, 30 sec) " +
"a=CombinedEvent]@inclusive terminated after 30 sec");
In this statement, the event manager will now look at every generated CombinedEvent, for 30
seconds after the detection of the first one, i.e, immediately after the insertion of a smart card, and
for 30 seconds it will collect all the CombinedEvents generated for each MAC address. After this
time, the pattern will reset. This time constraint serves only to limit the number of events analyzed,
focusing on the most relevant, the ones generated at the time of the smart card usage. Another
option would be to use different time windows or simply look at every single event generated for
the full duration which the card remained in the reader, possibly introducing more room for error
by adding more network communications by different mobile devices into the analysis. In order to
provide a faster result and try to minimize error, the exemplified approach was the one used.
With this, another statement can then be created, making use of this intermediate filter:
"context averageRSSContext30Sec select civilIdNumber, name, gender, birthdate, " +
"macAddress, median(dbValue) as avgDbValue, count(*) as count from " +
"CombinedEvent(macAddress=context.a.macAddress) output last when terminated")
This new statement will be the last one for this analysis, creating a context which uses the
previously shown statement and gathers all the relevant information contained by it. It will also
add two new pieces of information to the result, the count and median RSS of the received events,
52

4.6 Final output
grouping them up by MAC address, making it easier to understand and adding value to the iden-
tification. This statement will provide the event manager with the needed information to make a
good and robust association between the smart card data and the Wi-Fi data, by looking at the
RSS median and the number of network packets collected. The mobile device generating the
highest value median and with a sufficient number of packets generated, will thus be associated
as the best match for the client identified by the Smart Card.
The information collected by this set of statements will be seen by a listener added to this final
statement, which will be responsible for ordering the events, based on how good a match they
are, and inserting all of the information into the system’s database.
4.6 Final output
Throughout this chapter, the implementation details and choices made in the development
of this work have been presented. However, after an identification has been made, something
must be sent to the applications registered in the middleware. Since these applications are only
concerned with the identification results, there is no need for them to also implement an event
manager in order to manage the final events generated by the system. As such, when the system
detects that a good identification event has been generated, all the information contained by this
event is converted into XML format using the xstream10 library, making it ready to deliver to the
applications. XML format was chosen since it provides simplicity, generality and usability. This
xstream library also simplifies things, since it is capable of serializing Java objects into XML and
back again through a very simple API, making the conversion of any type of event a breeze. The
fact that XML is a universally accepted language, using this type of output will make it simple for
any application wanting to use the middleware, to read and parse the output though one of the
many available APIs for XML parsing.
10XStream - http://xstream.codehaus.org
53

4. Implementation
54

5Tests and results evaluation
Contents5.1 Test contextualization . . . . . . . . . . . . . . . . . . . . . . . . . . . . . . . . . 575.2 Scenario 1 - Unknown individual . . . . . . . . . . . . . . . . . . . . . . . . . . 585.3 Scenario 2 - Registered individual, first visit . . . . . . . . . . . . . . . . . . . 585.4 Scenario 3 - Registered individual, repeated visit . . . . . . . . . . . . . . . . . 605.5 Scenario 4 - Multiple registered individuals, first visits . . . . . . . . . . . . . 625.6 Scenario 5 - Multiple registered individuals, repeated visits . . . . . . . . . . 635.7 Scenario 6 - Registered individual, multiple mobile devices . . . . . . . . . . . 64
55

5. Tests and results evaluation
56

5.1 Test contextualization
In this chapter some of the experimental results are shown regarding the identifications ob-
tained from several individuals by the system.
5.1 Test contextualization
The main focus of this work has always been the identification of individuals. This identification
is to be done through several sensors, each of them collecting a specific kind of information, but
what is most important is the information gain by correlating the data being generated by the
various sensors, along with extra information such as time, location, and repeated visits of the
customer.
In this chapter, various test scenarios are presented, and the information collected, along with
its confidence level is shown for each identifying sensor, as well as for the overall system.
The test environment consists of a small room with 2 computers, each equipped with a Wi-Fi
sensor and placed on opposite sides of the room, having the Kinect and smart card sensor placed
on the furthest machine from the entrance. The social network sensor and system database are
placed in another computer, not present in the room. Throughout this chapter, the machines
will be referenced as machine 1 (computer at the end of the room, equipped with Wi-Fi, smart
card, and biometric sensor), machine 2 (computer near the entrance of the room, equipped with
a Wi-Fi sensor), and machine 3 (computer not present in the room, equipped with the system’s
database, and social network sensor). Every scenario presented contains at least one individual
inside the coverage area, and every individual is equipped with a personal Wi-Fi capable device
and identifying smart card (Portuguese citizen card). The machines are connected via ethernet.
For testing, 7 clients were registered in the system.
The following test cases were created:
1. Non-registered individual enters coverage area, walks to the end of the room, does a simple
action in front of machine 1 and then leaves.
2. Registered user enters the coverage area of the system for the first time and stays in the
room for a while. During this time he walks around the room, stops to perform an action with
his smart card and then leaves.
3. Same user from test 2 re-enters the coverage area, walks around the room and leaves.
4. Two registered users enter the room. User B stays idle near the entrance while user A walks
to machine 1 and does an action requiring the use of his smart card. Both users leave at
the same time, after user A’s action is completed.
5. User A from previous test enters the room with a different registered individual. They both
walk around the entire room making quick stops at each machine and then proceed to
leaving the area.
57

5. Tests and results evaluation
6. Registered user carrying 2 mobile devices was identified by the system in an older visit. This
same user now enters the room with only one of those mobile devices.
These test cases were chosen since they demonstrate how the system deals with most of the
possible situations, and how the confidence levels in identification grows as the system learns
more from the individuals.
For the evaluation of these test cases, a graph is produced to better illustrate the information
gain of the system. It will show the confidence levels of the identifications done by the system
over time, qualitatively evaluating these values over 3 different levels: low, medium, and high. It is
important to note that the graph will depict the confidence level at each time, taking into account
the amount of sensors identifying the individual at that given time and the amount of data that
the system has for that person. Every time an identification is made, it is also displayed in the
graph a simple annotation indicating which sensor(s) generated it, represented by the initials of
their respecting sensors: w for Wi-Fi identification; b for biometric identification; sc for smart card
identification.
5.2 Scenario 1 - Unknown individual
For this test, an individual not registered in the system was sent into the coverage area of the
sensors. The test results obtained were expected, as no identification was made.
The individual’s Wi-Fi signals were detected by both machine 1 and machine 2 while he was
inside the room, however, since no association had been made to the collected MAC address, the
system assumed it was from an unknown person. When the individual spent some time in front
of machine 1, his face was captured by the Kinect camera and face recognition was attempted.
As explained in the implementation section of the biometric sensor, the face recognition algorithm
created tries to identify a person multiple times, and only considers that a correct identification
was made if one of the match possibilities is matched 70% more times than the others. When
the system tried to do face recognition of this person, it did not reach the accepted threshold, and
therefore, was unable to do identification. Since the system had no knowledge from this user’s
social network information, there was no sample picture of this person in the facial database,
leading to much less accurate matches from the recognition algorithm.
5.3 Scenario 2 - Registered individual, first visit
In this scenario, a registered client is brought into the room to interact with the smart card
reader. This test was successful as identification events were generated from multiple sensors
during the presence of the client. The best identification made was of the highest level possible,
generated by the smart card sensor.
58

5.3 Scenario 2 - Registered individual, first visit
Figure 5.1 shows the graph of the confidence levels of identification throughout the experiment,
based on the information gain of the system.
Figure 5.1: Confidence level of identifications for scenario 2.
Some time after the entrance of the client in the coverage area, represented by instant t1,
Wi-Fi communications from his mobile device were detected by the Wi-Fi sensors. However, no
identification events are generated since this is the client’s first visit, and Wi-Fi data has not yet
been associated with his profile.
As can be seen on figure 5.1, the first identification provided by the system, at instant t2, is
of low confidence. This moment corresponds to the time when the client entered the Kinect’s
camera range. As soon as the client’s face was captured by the Kinect, the facial recognition
algorithm was initialized and, after 7 seconds, the client was identified by the biometric sensor.
Since at the time the only information in the system was the data pulled from Facebook upon
this client’s registration, identifications produced through face recognition have a low confidence.
However, an association was also made between the client in front of the camera and the Wi-Fi
signals present in the room, effectively increasing the knowledge of the system, complementing
the client’s profile with Wi-Fi information.
The next relevant part of the graph corresponds to instant t3 where the client inserts his iden-
tifying smart card into the reader. This time the system will gain a lot of information about the
client, as this is the highest confidence sensor in the system, producing the best identification
event possible. Not only this, but it will also improve and add data to the client’s profile, effectively
augmenting the system’s knowledge about this person. Once more, Wi-Fi data was checked,
improving the current association, and a new facial picture of the client was added to the facial
database.
After the client has finished his action, the smart card was removed and the level of confidence
for identifications from this moment on decreases, since an identification from the smart card
59
5. Tests and results evaluation
sensor is no longer possible. In this particular test, when the client removed his card, he looked
down to do so, resetting the face recognition algorithm. As such, after the card was removed,
another facial recognition was made, identifying the client once more, but this time with increased
confidence. The reason behind the better confidence level of identifications generated from the
biometric sensor is because of the added information from the smart card associations. Not only
is there an extra facial picture in the training set providing more reliable recognitions, but since
there is now an association between the client’s face and Wi-Fi data, and the client’s Wi-Fi id is
also being detected at the time of the identification, the confidence level will rise even more. This
is evidenced at instant t4.
When the client leaves the detection range of the Kinect, all that is left to identify him now
are the Wi-Fi sensors. Contrary to the first time the Wi-Fi data from this client is detected, the
system can now generate events since it now has knowledge about the owner of the mobile
device generating this data. As can be seen in the graph at instant t5, the confidence level of the
identification generated by these sensors is of medium confidence.
When the client leaves the coverage area, at instant t6, the confidence level falls to 0 which
indicates that no identification of this individual is possible, given that no sensor is able to capture
any identifying feature of the person.
Even though this test was successful, there are certain problems that might have occurred to
make it generate some incorrect identifications. In the event that the face recognition generated
an identification event corresponding to an incorrect client, the Wi-Fi association of this mobile
device would be made to that incorrect client. This would generate some bad identifications until
the system realized there was a problem using the learning algorithm. The same problem might
occur if the client does not have a mobile device or is carrying a mobile device that does not
belong to him. These problems are also corrected with the learning mechanism, however, it is
assumed that the users only carry their own personal devices.
5.4 Scenario 3 - Registered individual, repeated visit
This scenario is very similar to the previous one, once more including just one person (same
client from the previous test), but this time the individual is not visiting for the first time, i.e. the
system already has good associations made to this person and possesses a lot of relevant data
in his profile. The results were good, as a correct identification of the individual was obtained. The
best identification level achieved was "High" since this time there was no use of the smart card.
Figure 5.2 shows the results graph of this experiment.
As is shown in the result graph, instant t1 corresponds to the entrance of the user. At the
time, no identification has been made because no Wi-Fi signals have been detected by the Wi-
Fi sensors. After a few seconds, while the client was walking around the room, the first Wi-Fi
60

5.4 Scenario 3 - Registered individual, repeated visit
Figure 5.2: Confidence level of identifications for scenario 3.
signals were detected by the sensors and, this time, since a previous association of this type
of information had been made, an identification was possible. Instant t2 represents the moment
where the identification is made, generating an event containing all current information about the
client.
Throughout this experiment, the client also spent some time in the area in front of the Kinect.
During this time, several face recognition attempts were made, where 2 out of 5 attempts were
successful. This happened because the user, while having his face detected, by moving around
changed his pose into an undetectable angle, causing the recognition to be interrupted before
the minimum required number of frames had been captured. In both times that an identification
event was generated, the user was correctly identified by the biometric sensor at instant t3. These
identifications however, were not made in perfection. During one of the biometric sensor identi-
fications, no Wi-Fi signal from the client was detected. This can happen since the default Wi-Fi
activity of mobile devices is unpredictable if the user simply has Wi-Fi turned on, but is not actually
using it. As such, one of the identification events was generated with a "High" confidence level,
where the other one merely had a "Low-Medium" confidence. In the graph, only the highest one
achieved is represented.
Instant t4 is when the user leaves the Kinect’s coverage, and only Wi-Fi identifications can
be made. The level of confidence of these identifications is the same as at the start since no
information was altered in the user’s profile, dropping to 0 when the client leaves the room and
can no longer be identified by any sensor at instant t5.
61

5. Tests and results evaluation
5.5 Scenario 4 - Multiple registered individuals, first visits
This fourth scenario introduces the concept of multiple individuals in the test area at the same
time. This particular test required the participation of two individuals, both registered in the sys-
tem, where one of them (user A) walks around in the room and interacts with the smart card
reader while the other person (user B) stands idle near machine 2. Both users were visiting the
system’s coverage area for the first time. The results produced by this test were expected, gener-
ating the highest confidence identification possible for user A and no identification being made for
user B as shown in figure 5.3, having a line representation for each user.
Figure 5.3: Confidence level of identifications for scenario 4.
While having no identification being made for user B sounds like a negative result, it is quite
normal. Since it is the first visit from this user, even when his Wi-Fi signals are detected, the
system is not aware of any previous connection and will, therefore, tag it as a random mobile
device. Given that for this test the user is left idle near the machine 2, no other sensor will sense
this person’s presence making information association and subsequent identification not possible.
User A however, is recognized by all the sensors. Initially, at instant t1, when the user enters
the room, no identification is provided, for the same reason as user B. Even if Wi-Fi communi-
cations are detected from the user, given that it is the first visit he makes, the system has no
knowledge that the Wi-Fi data actually belongs to him.
At instant t2, the client sits in front of machine 1 and even before inserting his smart card, is
identified by the biometric sensor. This identification is successful, even if barely reaching the
minimum threshold required. Before the user inserted his card, he spent some time sitting in the
coverage area of the biometric sensor, chatting with user B. Given the movements of user A’s face,
the recognition algorithm was reset several times, doing 7 more recognition attempts. Out of these
7 attempts, 4 failed to reach the minimum required frames and out of the remaining 3 attempts,
62

5.6 Scenario 5 - Multiple registered individuals, repeated visits
2 were successful and 1 generated an identification event indicating the presence of a different
user. This type of error is more evident in users for which the Facebook profile picture is not very
adequate. Just as was explained in the face recognition section, factors such as illumination, head
position and contrast heavily affect the recognition results. The correct identification’s confidence
level for this recognition is shown in the result graph at instant t2.
Upon the insertion of the client’s smart card at instant t3, an identification event is generated
producing the highest confidence level of any identification, just as in test scenario 2. The differ-
ence here is when the system tries to make an association of the Wi-Fi events being generated in
the area with this client’s profile. This time there is more than one person generating Wi-Fi events,
and events from user A and user B are both seen as valid data, for which the system inserts them
in user A’s profile, which could generate some confusion in specific occasions.
Instant t4 represents the removal of the smart card by the user. At this time, the user immedi-
ately stands ups and walks away from machine 1, not giving any time for the biometric sensor to
do any kind of recognition. Therefore, the next identification event being generated came from the
Wi-Fi sensor, which now sees the network data as something relevant. As was mentioned in the
previous instant, an incorrect Wi-Fi association was made to user A’s profile, which would cause
some problems. However, given the current implementation choice of the system to only consider
the most likely network address for identification purposes, the fact that at the time of the asso-
ciation the Wi-Fi signals being generated from user A’s mobile device had a stronger RSS than
user B’s, and knowing that this type of information is ordered by relevance before being stored in
a client’s profile, the identification given by this sensor was still accurate. In a future visit, when
user A makes use of his identifying smart card again, the learning algorithm will be employed,
removing the second Wi-Fi association and strengthening the confidence of the association that
remains.
Instant t5 represents the exit of both clients from the room.
5.6 Scenario 5 - Multiple registered individuals, repeated vis-its
This test scenario brings no new information about the identifications being made or the con-
fidence levels achieved, it serves only to better illustrate the difference in confidence from identi-
fications made on clients with rich profiles and those with basic ones. Once more, two registered
users enter the coverage area of the system. One of these clients, was also present in the previ-
ous test, user A. The other client (user C) is also entering the room for the second time, however,
on his first visit, he did not use his identifying smart card, leading to less information gain by the
system. To better demonstrate the difference in levels of identification between these two clients,
the two individuals did the exact same route through the room, being subjected to the same tests.
63
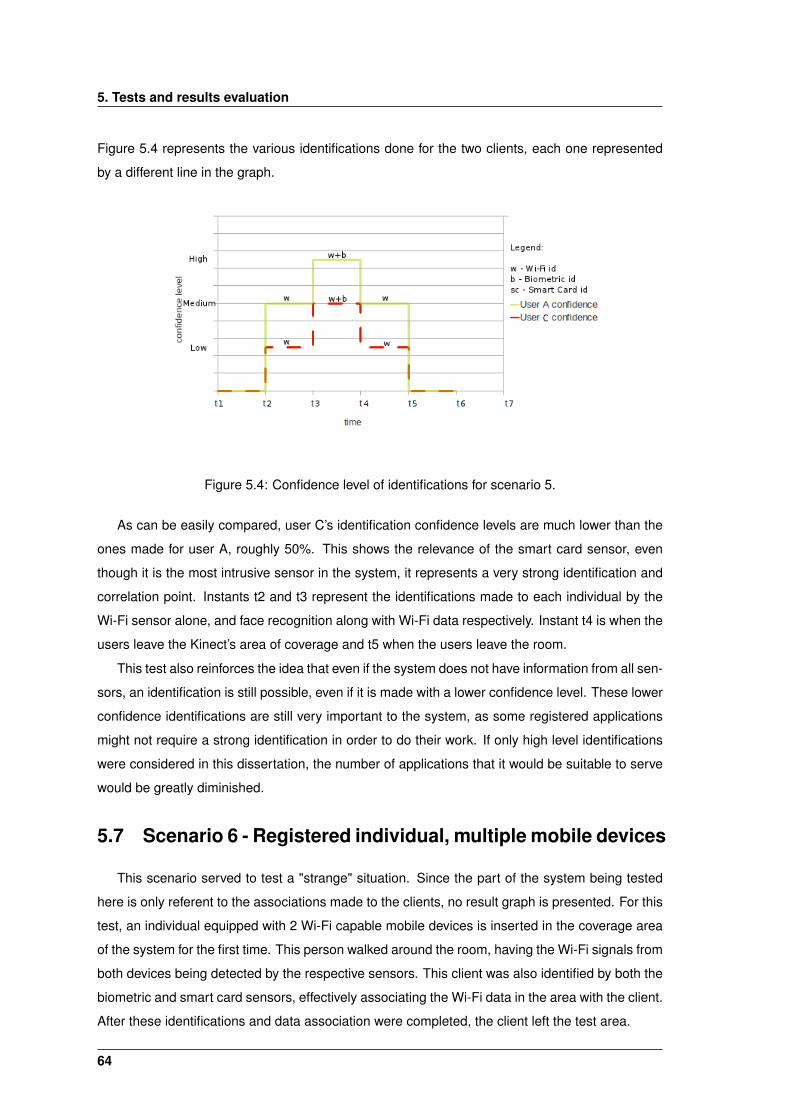
5. Tests and results evaluation
Figure 5.4 represents the various identifications done for the two clients, each one represented
by a different line in the graph.
Figure 5.4: Confidence level of identifications for scenario 5.
As can be easily compared, user C’s identification confidence levels are much lower than the
ones made for user A, roughly 50%. This shows the relevance of the smart card sensor, even
though it is the most intrusive sensor in the system, it represents a very strong identification and
correlation point. Instants t2 and t3 represent the identifications made to each individual by the
Wi-Fi sensor alone, and face recognition along with Wi-Fi data respectively. Instant t4 is when the
users leave the Kinect’s area of coverage and t5 when the users leave the room.
This test also reinforces the idea that even if the system does not have information from all sen-
sors, an identification is still possible, even if it is made with a lower confidence level. These lower
confidence identifications are still very important to the system, as some registered applications
might not require a strong identification in order to do their work. If only high level identifications
were considered in this dissertation, the number of applications that it would be suitable to serve
would be greatly diminished.
5.7 Scenario 6 - Registered individual, multiple mobile devices
This scenario served to test a "strange" situation. Since the part of the system being tested
here is only referent to the associations made to the clients, no result graph is presented. For this
test, an individual equipped with 2 Wi-Fi capable mobile devices is inserted in the coverage area
of the system for the first time. This person walked around the room, having the Wi-Fi signals from
both devices being detected by the respective sensors. This client was also identified by both the
biometric and smart card sensors, effectively associating the Wi-Fi data in the area with the client.
After these identifications and data association were completed, the client left the test area.
64

5.7 Scenario 6 - Registered individual, multiple mobile devices
At a later time, the client entered the room once more, this time having one of the mobile
devices turned off. Upon a second identification by either the smart card or biometric sensor,
the learning mechanism came into play, removing the MAC address of the offline mobile device
from the user’s profile. Since this Wi-Fi identifier is now tagged as a bad association for this
client, even if communications from this mobile device are detected in future visits, it will no longer
be associated to the client even though it belongs to him. Only when none of the previously
associated Wi-Fi identifiers are detected upon an identification of this individual (which clears
the Wi-Fi data from this client’s profile) will it be possible to associate this MAC address to that
client again. This test served to demonstrate one of the features that the system is not currently
equipped to handle, since it assumes that a client only carries a single personal mobile device.
This would also be an interesting topic for future work, further improving the learning function.
65

5. Tests and results evaluation
66

6Conclusions
Contents6.1 Main conclusions . . . . . . . . . . . . . . . . . . . . . . . . . . . . . . . . . . . 696.2 Future work . . . . . . . . . . . . . . . . . . . . . . . . . . . . . . . . . . . . . . 69
67

6. Conclusions
68

6.1 Main conclusions
This chapter draws the main conclusions that can be extracted from the work produced and
suggests some points that can be improved or further developed as future work on this subject.
6.1 Main conclusions
In this dissertation, a best effort identification system was developed. This system is composed
of several different sensors, each sensing a specific kind of feature, relevant for the identification
of the individuals inside the sensors’ coverage area. The main goal of this work was to take each
of the features gathered by the sensors, correlating them in an event manager in order to produce
better, more meaningful identifications, feeding applications registered in the system with personal
information known about its clients.
The goal of this work was achieved, by setting up a diversity of sensors which contributed to
the identifications, while keeping the system as ubiquitous as possible. As was presented in the
results section, all this was possible by working with the information coming from the sensors as
well as external data, such as timing, location and repeated visits by the clients. With this, the
system is able to learn about its clients, leading to a more complete profile of each individual at
each step. A function was also created, to place each identification made in a certain confidence
range, since different sensors have different levels of accuracy when producing an action.
During the development phase, several identification methods were tested, having been de-
tailed throughout this dissertation, allowing for an easier choice of which mechanisms to imple-
ment. This work could have been done in many different ways, producing more accurate infor-
mation with lower recognition rates, or more identifications with a higher false positive rate. In
the final version of this work, an intermediate solution was created, as to not limit the system too
much. The confidence levels attached to every identification allow the applications receiving the
information to have a better understanding of where the identifications are coming from and how
much they can "trust" it.
Even though the system works as desired, providing identifications while respecting the sys-
tem requirements, some limitations still exist. Things such as users carrying more than one mobile
device; using a mobile device that does not belong to them; a high number of individuals close to
each other being identified at the same time; among other external factors can cause disruptions
in the identifications. Even if many of these incidents are covered by the learning mechanism
implemented, some bad results may be generated, even if only for a little time.
6.2 Future work
With a system such as this, which works with a lot of unreliable data, many different kinds of
additions could be made. The first additions that come to mind would be different sensors to either
further refine and improve the data collected by the already implemented ones, or to enable new
69

6. Conclusions
identification possibilities and a wider range of customers. Something like a Bluetooth or Near
Field Communication (NFC) sensor would already open a number of possibilities.
Aside from the addition of new sensors, since the most unreliable identifications at the moment
are being generated from the biometric sensor due to lack of training data, some sort of mech-
anism could be developed to collect a larger number of samples, either from Facebook or even
using more social networks, or to further improve the facial recognition mechanism by adding
some more pre-processing techniques to each image.
One thing that could greatly improve the confidence level of each identification would be the
addition of a human sensor. A scenario where an employee would have a computer screen that
displayed the identification information being generated at each time would allow the employee
to confirm the identification of a given person through a simple interface, leading to much higher
confidence information.
70

Bibliography
[1] Timo Ahonen, Abdenour Hadid, and Matti Pietik. Face Recognition with Local Binary Pat-
terns. pages 469–481, 2004.
[2] Paramvir Bahl and Venkata N Padmanabhan. RADAR : An In-Building RF-based User Loca-
tion and Tracking System. Data Processing.
[3] P.N. Belhumeur, J.P. Hespanha, and D.J. Kriegman. Eigenfaces vs. Fisherfaces: recognition
using class specific linear projection. IEEE Transactions on Pattern Analysis and Machine
Intelligence, 19(7):711–720, July 1997.
[4] Biometricnewsportal. Face biometrics. http://www.biometricnewsportal.com/face_
biometrics.asp.
[5] Jens Bleiholder and Felix Naumann. Data fusion. ACM Computing Surveys, 41(1):1–41,
December 2008.
[6] Projecto Cart. Projecto Cartão de Cidadão Manual técnico do Middleware Cartão de
Cidadão. 2007.
[7] Salvatore Catanese, Pasquale De Meo, Emilio Ferrara, and Alessandro Provetti. Extraction
and Analysis of Facebook Friendship Relations. Analysis, pages 1–33.
[8] National Informatics Centre and Information Technology. Specifications for the Smart-Card
Operating System with Contact-less Interface. Methods, pages 1–42, 2007.
[9] EsperTech. Tutorials and case studies. http://esper.codehaus.org/tutorials/
tutorial/tutorial.html, 2011.
[10] Emilio Ferrara, Giacomo Fiumara, and Robert Baumgartner. Web Data Extraction , Applica-
tions and Techniques : A Survey. V(June):1–20, 2010.
[11] Minas Gjoka, U C Irvine, Carter T Butts, U C Irvine, and U C Irvine. Walking in Facebook : A
Case Study of Unbiased Sampling of OSNs. Convergence.
[12] Rebecca Greenfield. Hints Facebook Is Becoming a Full-On Identifi-
cation Service. http://www.theatlanticwire.com/technology/2011/08/
71

Bibliography
facial-recognition-facebook-becoming-full-identification-service/40675/,
2011.
[13] David L Hall, Senior Member, and James Llinas. An Introduction to Multisensor Data Fusion.
85(1), 1997.
[14] IBM. Multi-Application Smart Cards.
[15] Kuo-fong Kao, I-en Liao, and Jia-siang Lyu. An Indoor Location-Based Service Using Access
Points as Signal Strength Data Collectors. System, (September):15–17, 2010.
[16] Kyungnam Kim. Face Recognition using Principle Component Analysis. Science, pages
1–7.
[17] Jon Kleinberg. The Small-World Phenomenon : An Algorithmic Perspective. Development ,
pages 1–14.
[18] John Krumm and Eric Horvitz. L OCADIO : Inferring Motion and Location from Wi-Fi Signal
Strengths. In Practice, 2004, 2004.
[19] Hyuk Lim, Lu-Chuan Kung, Jennifer C. Hou, and Haiyun Luo. Zero-configuration indoor
localization over IEEE 802.11 wireless infrastructure. Wireless Networks, 16(2):405–420,
October 2008.
[20] A. Pentland M. Turk. Eigenfaces for recognition.pdf.
[21] Microsoft. Kinect. http://www.xbox.com/en-US/kinect.
[22] B. Moghaddam and A. Pentland. Probabilistic visual learning for object detection. In Com-
puter Vision, 1995. Proceedings., Fifth International Conference on, pages 786 –793, jun
1995.
[23] Steven Musil. Facebook faces lawsuit over facial-recognition
feature. http://news.cnet.com/8301-1023_3-57322815-93/
facebook-faces-lawsuit-over-facial-recognition-feature/.
[24] P Jonathon Phillips and R Michael Mccabe. BIOMETRIC IMAGE PROCESSING AND
RECOGNITION. Technology .
[25] Nissanka B Priyantha, Anit Chakraborty, and Hari Balakrishnan. The Cricket Location-
Support System. System, 2000(August), 2000.
[26] Henry A Rowley, Student Member, Shumeet Baluja, and Takeo Kanade. Neural Network-
Based Face Detection. Analysis, 20(1):23–38, 1998.
72
Bibliography
[27] Andrew W Senior and Ruud M Bolle. Chapter 4 FACE RECOGNITION AND ITS APPLICA-
TIONS. pages 101–115.
[28] Xiaoyang Tan and Bill Triggs. Enhanced local texture feature sets for face recognition under
difficult lighting conditions. IEEE transactions on image processing : a publication of the IEEE
Signal Processing Society , 19(6):1635–50, June 2010.
[29] Ubisense. Ubisense. http://www.ubisense.net.
[30] Paul Castro, Patrick Chiu, Ted Kremenek, and Richard Muntz. A Probabilistic Room Location
Service for Wireless Networked Environments. System.
[31] Roy Want, Andy Hopper, Veronica Falcão, and Jonathan Gibbons. The Active Badge Loca-
tion System. Computer , 1965.
[32] Andy Ward, Alan Jones, and Andy Hopper. A New Location Technique for the Active Office.
System.
[33] Www.facebook.com. Facebook Statistics. http://www.facebook.com/press/info.php?
statistics.
[34] Www.facebook.com. Graph API. http://developers.facebook.com/docs/reference/
api/.
[35] Www.gizmodo.com. Deep Inside Xbox 360 Kinect and Why
It’s the Future of Microsoft. http://gizmodo.com/5604308/
deep-inside-xbox-360-kinect-the-interface-of-microsofts-dreams.
[36] Moustafa Youssef. Handling Samples Correlation in the Horus System. Analysis, 00(C),
2004.
[37] Mark Zuckerberg. Open Graph. In f8 Developer Conference, 2010.
73

Bibliography
74


Bibliography
76