best of both worlds htert- immortalized primary cells
TRANSCRIPT

Best of Both Worlds – hTERT-immortalized Primary Cells
Kevin Grady, B.S., Senior Product Line Business Manager, ATCC
Chaozhong Zou, Ph.D., Senior Scientist, ATCC
1

ATCC Today
Founded in 1925, ATCC is a non-profit organization with HQ in Manassas, VA and an R&D & Services center in Gaithersburg, MD
World wide brand name and quality recognition
World’s premiere biological materials resource and standards development organization
• 4,000 cell lines
• 70,000 microbes
ATCC collaborates with and supports the scientific community with industry-standard and innovative biological solutions
• Growing portfolio of products and services
• Sales and distribution in 140 countries, 12 International distributors
Talented team of 475+ employees; > one third with advanced degrees
Multiple accreditations including ISO 9001 and ISO 13485
2

Agenda
hTERT-immortalized Primary Cells Portfolio
Kidney transporter models
• Current in vitro transporter cell models
• Generation of RPTEC renal transporter models
• Application data
3

Immortalized lung cells; NuLi-1 (ATCC® CRL-4011™)
ATCC classic and advanced cell models
ATCC is the complete solution supplier
From basic research through discovery and development to product testing
• Continuous cell lines
• Primary cells
• hTERT immortalized primary cells
Portfolio features
• Reliability
• Fully characterized cells
• Optimized growth protocols
4
Primary: Umbilical Endothelial Cells (ATCC® PCS-100-010™)
Continuous cell line: HeLa (ATCC® CCL-2™)

Pros and cons of different cell models
Primary cells
hTERTimmortalized
Oncogene, virally immortalized
Cancer cell lines
Mimic in vivo tissue phenotype
++++ +++ ++ +
Genotypic stability DiploidDiploid /
Near diploid Near diploid /
AneuploidAneuploid
Proliferativecapacity
+ +++ +++ +++
Supply + +++ +++ +++
Inter-experimental reproducibility
+ +++ +++ +++
Cost +++ ++ + +
Ease-of-use + ++ ++ +++
Predictability in toxicological studies
+++ +++ ++ +
5

Pros and cons of different cell models
Primary cells
hTERTimmortalized
Oncogene, virally immortalized
Cancer cell lines
Mimic in vivo tissue phenotype
++++ +++ ++ +
Genotypic stability DiploidDiploid /
Near diploid Near diploid /
AneuploidAneuploid
Proliferativecapacity
+ +++ +++ +++
Supply + +++ +++ +++
Inter-experimental reproducibility
+ +++ +++ +++
Cost +++ ++ + +
Ease-of-use + ++ ++ +++
Predictability in toxicological studies
+++ +++ ++ +
6

hTERT-immortalized cells are unique tools
hTERT-immortalized cells combine:
The in vivo nature of primary cells
The ability to be continuously cultured
hTERT-immortalized cells avoid the limitations of primary cells while still reaping their benefits
7
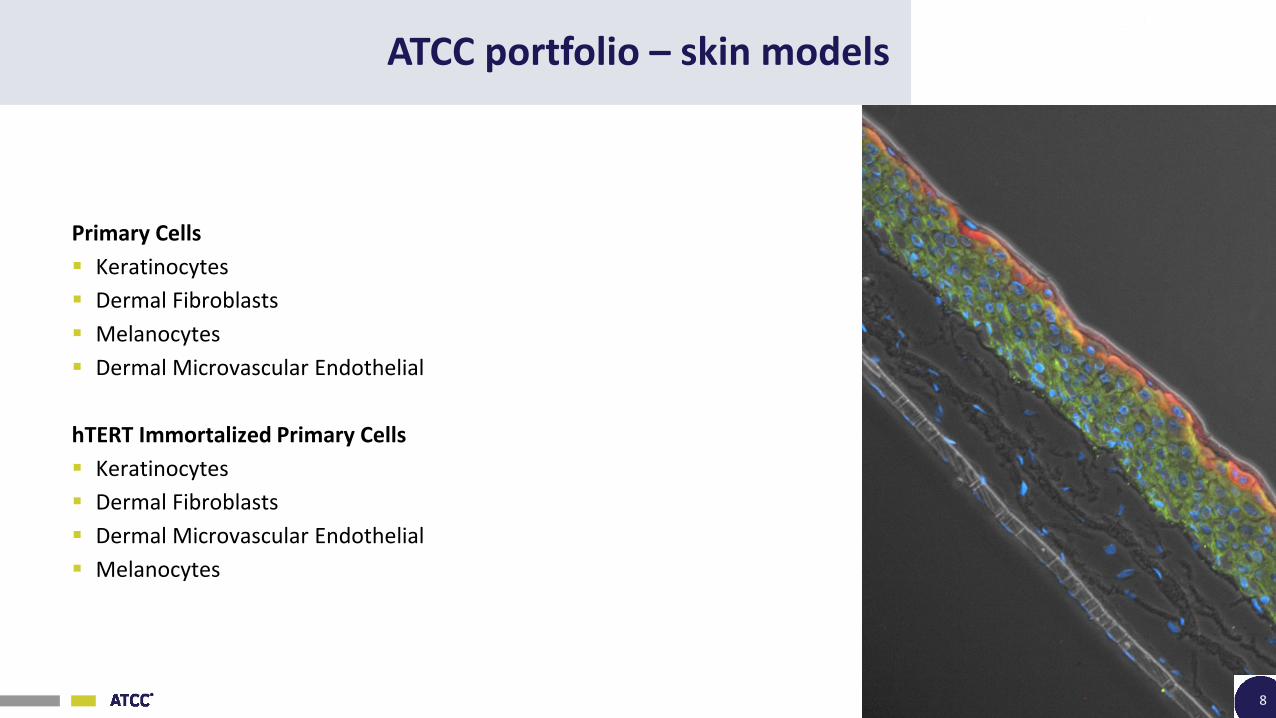
ATCC portfolio – skin models
Primary Cells
Keratinocytes
Dermal Fibroblasts
Melanocytes
Dermal Microvascular Endothelial
hTERT Immortalized Primary Cells
Keratinocytes
Dermal Fibroblasts
Dermal Microvascular Endothelial
Melanocytes
8

ATCC keratinocytes cultured at ALI display similar architecture to skin in vivo
KRT14DAPI
fibroblasts
keratinocytes
Filaggrin Overlay
Phase Contrast
9

ATCC portfolio – airway models
Primary Cells
Lung Fibroblasts
Bronchial/Tracheal Epithelial Cells
Small Airway Epithelial Cells
Lung Smooth Muscle Cells
Bronchial/Tracheal Smooth Muscle Cells
hTERT Immortalized Primary Cells
Bronchial/Tracheal Epithelial Cells
Small Airway Epithelial Cells
Lung Fibroblasts
10

ATCC portfolio – urogenital models
Primary Cells
Prostate Epithelial Cells
Vaginal Epithelial Cells
Uterine Fibroblast Cells
Uterine Smooth Muscle Cells
Bladder Epithelial (A/T/N) Cells
Bladder Smooth Muscle Cells
Bladder Fibroblast Cells
hTERT Immortalized Primary Cells
Prostate Fibroblast Cells
Prostate Cancer-associated Fibroblast Cells
Prostate Epithelial Cells
Endometrial Fibroblast Cells
11

hTERT-immortalized prostate cells differentially influence the tumor microenvironment
12
PrE
DU
1 4 5
A5 4 9
RW
PE 1
LnC a p
- 1
0
1
No
rma
liz
ed
Ch
an
ge
in G
row
th
+ N A F
+ C A F
* * * * n s* * *
A representative image of growth and staining of normal prostate epithelial cells in the presence of prostate normal-associated fibroblast (NAF) and prostate cancer-associated fibroblast (CAF). Data were then analyzed for percent change of growth of the experimental cells based on cell densities between the cells in the presence and absence of fibroblast cells.

ATCC portfolio – mesenchymal stem cells
Primary Stem Cells
Adipose-derived Mesenchymal Stem Cells
Subcutaneous Pre-adipocytes
Bone Marrow-derived Mesenchymal Stem Cells
Umbilical Cord-derived Mesenchymal Stem Cells
hTERT Immortalized Primary Cells
Adipose-derived Mesenchymal Stem Cells
13

hTERT-immortalized and primary mesenchymal stem cells express equivalent markers
Flow cytometric analysis of surface marker expression determined ATCC hTERT-mesenchymal stem cells (MSCs) were equivalent to primary MSCs: Bone marrow (BM), adipose tissue (AT), umbilical cord (UC), and hTERT-derived MSCs were tested
These data meet International Society for Cellular Therapy (ISCT) guidelines
14
CD MarkerCD14(%)
CD19(%)
CD34(%)
CD45(%)
CD29(%)
CD44(%)
CD73(%)
CD90(%)
CD105(%)
CD166(%)
BM-MSC 0.26 0.07 2.91 0.15 100 99 100 100 100 94
AT-MSC 0.55 0.23 2.86 0.29 100 100 100 99 100 90
UC-MSC 0.52 0.79 1.50 0.47 100 90 95 96 94 95
hTERT-MSC 0.25 0.23 0.99 0.55 100 100 100 100 99 96

GFP anti-αSMA Phase contrast Merged
What is the Angio-Ready™ System?
15
A co-culture system consisting of telomerase-immortalized endothelial cells and mesenchymal stem cells, providing an in vitro angiogenesis system that is more close to the in vivo situation
A mix of TeloHAEC-GFP (ATCC® CRL-4054™) and ASC52telo (ATCC® SCRC-4000™) provided with an optimized medium formulation

0μM 0.005μM 0.01μM 0.02μM 0.05μM 0.1μM
GFP
anti
-αSM
AM
erge
d
Sunitinib blocks tubular structure growth in dose- dependent manner in the Angio-Ready™ System
TeloHAEC-GFP and hTERT-MSC cells premixed, thawed and seeded immediately into wells of a 96-well plate, and treated with different doses of sunitinib; fixed and stained with anti-αSMA antibody at day 8
16

ATCC portfolio – kidney models
Primary Cells
Renal Proximal Tubule Epithelial Cells
Renal Cortical Epithelial Cells
Renal Mixed Epithelial Cells
hTERT Immortalized Primary Cells
Renal Proximal Tubule Epithelial Cells
Renal Proximal Tubule Epithelial Cells-OAT1
Renal Proximal Tubule Epithelial Cells-OCT2
Renal Proximal Tubule Epithelial Cells-OAT3 (coming soon)
17

Agenda
hTERT-immortalized Primary Cells Portfolio
Kidney transporter models
• Current in vitro transporter cell models
• Generation of RPTEC renal transporter models
• Application data
18
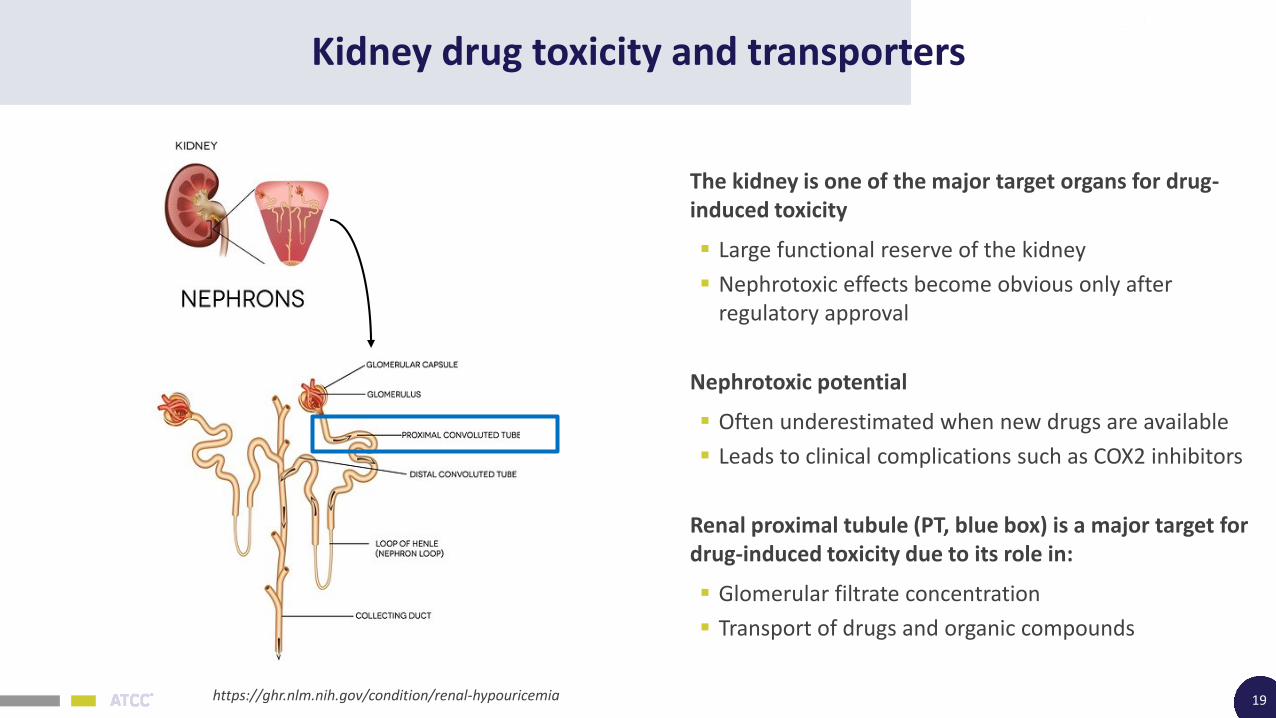
Kidney drug toxicity and transporters
19
The kidney is one of the major target organs for drug-induced toxicity
Large functional reserve of the kidney
Nephrotoxic effects become obvious only after regulatory approval
Nephrotoxic potential
Often underestimated when new drugs are available
Leads to clinical complications such as COX2 inhibitors
Renal proximal tubule (PT, blue box) is a major target for drug-induced toxicity due to its role in:
Glomerular filtrate concentration
Transport of drugs and organic compounds
https://ghr.nlm.nih.gov/condition/renal-hypouricemia

Kidney drug toxicity and transporters
2 major transporters (ATP-binding Cassette transporters and Solute Carrier transporters)
My talk today will only focus on SLC transporters
New (draft) regulatory documents published by FDA, EMA, and ITC (2010 & 2012):
“evaluate OAT1, OCT2, and OAT3 as major SLC targets for drug interaction testing expressed in the kidney”
20Pang K, et al. Enzyme- and Transporter-Based Drug–Drug Interactions. DOI 10.1007/978-1-4419-0840-7_2,C Am Assoc Pharmaceut Sci 2010

Searching for the best in vitro models
To evaluate the drug transporter interactions, we need a good in vitro model with:
High predictability
Mature kidney PT origin
Best mimics PT micro-environment
The central problem is the lack of good pre-clinical cell-based models
21
MDKC cells

Searching for the best models: Primary cells
22
Con
Primary RPTEC lose OAT1, OCT2, and OAT3 expression in culture very quickly
ProBest represents the in vivo situation

Searching for the best models: Renal cell lines
23
Cell Line ATCC® No. Species of origin Nephron segment of origin
LLC-PK1 CL-101™ Yorkshire Pig Proximal nephron
OK CRL-1840™ North American Opossum Proximal nephron
JTC-12 N/A Monkey Proximal nephron
MDCK CCL-34™ Dog Collecting duct
A6 CCL-102™ Xenopus Distal tubule
HK-2 CRL-2190™ HumanHPV16-transformed, Proximal/Distal
Caki-1 HTB-46™ Human Kidney carcinoma
HEK293 CRL-11268™ Human Embryonic, SV40T
None of the continuous renal epithelial cell lines have been fully characterized for recapitulating the functions of the PT cells in vivo

Searching for the best models: gene modification
24
First-generation models
Non-kidney or embryonic kidney
transformed models (U2OS, CHO, etc…)
HEK293T17 overexpressing OAT1 (ATCC® CRL-11268-OAT1™)
Next-generation models
ATCC hTERT-immortalized RPTEC, stably transfected

Immortalized human adult proximal tubular cells: RPTEC/TERT1
RPTEC/TERT1 (ATCC® CRL-4031™)
Derived from normal renal PT epithelium
Immortalized using only hTERT
RPTEC/TERT1 exhibit:
Uniform expression of E-cadherin and CD13 (aminopeptidase N)
Dome*-like structures
Stabilized TEER (Trans-Epithelial Electrical Resistance)
25
RPTEC/TERT1: CD13
Dome formation
RPTEC/TERT1: E-cadherin
*Domes are multicellular, cystic structures, which have been described previously in epithelia cultured from various tissues that have a known transport or secretory function in vivo and in vitro

Stable cell line generation
26
RPTEC/TERT1 cells, like its primary counterparts, lost OAT1, OCT2, and OAT3 expression in culture
RPTEC/ TERT1 cells
Surviving RPTEC/ TERT1 cells
OAT1
Antibiotic selection
Clonal selection,validation, and expansion
OAT1
OCT2
OAT3
OCT2
OAT3
or
or

Characterization of RPTEC/TERT1-OAT1
27Sequencing shows no mutation and 7 copies of OAT1 (vs 2 in the parental line)
RT-PCR
A.
Western Blot
75 kDa
50 kDa
50 kDa
anti-OAT1
anti-Tubulin
B.
C.OAT1 Merged with DAPI
RP
TEC/TER
T1-O
AT1Paren
tal
Scale bar: 100 µm

Characterization of RPTEC/TERT1-OCT2
28
100 kDa
75 kDa
50 kDa
50 kDa
anti-OCT2
anti-Tubulin
RT-PCR
Western Blot
Sequencing shows no mutation and 5 copies of OCT2 (vs 2 in the parental line)
A.
B.
C.OCT2 Merged with DAPI
RP
TEC/TER
T1-O
CT2
Parental
Scale bar: 100 µm

Preliminary characterization of RPTEC/TERT1-OAT3
29
OAT3 Merged with DAPIR
PTEC
/TERT1
-OAT3
Parental
Scale bar: 50 µm
RT-PCR
5 copies of OAT3 vs 2 parental

Dome formation – cells maintain original function
30
Parental OAT1
OCT2
Scale bar: 100 µm
OAT3Domes are shown by the green arrows
*Domes are multicellular, cystic structures, which have been described previously in epithelia cultured from various tissues that have a known transport or secretory function in vivo and in vitro

Key renal epithelial marker staining
31
Merged with DAPIE-cadherinCD13 Merged with DAPI
OC
T2O
AT1
Scale bar: 100 µm
Parental

Key renal epithelial marker staining
32
CScale bar: 100 µm
Merged with DAPIE-cadherinCD13 Merged with DAPI
Parental
OAT3

Agenda
ATCC toxicology tools
Kidney transporter models
• Current in vitro transporter cell models
• Generation of RPTEC renal transporter models
• Application data
33

Experimental design – brief assay protocol
Uptake assay:
Equal numbers of both parental and transporter cells were seeded into 96-well plate in triplicate and placed in an incubator at 37oC, 5.0% CO2
After 24 hours assays were performed
Increasing concentration of 6-CF or EAM1 were added and incubated for 20 minutes at 37oC
After wash with cold HBSS 4 times, cells were lysed and uptake intensity were measured
Inhibition assay:
Equal numbers of both parental and transporter cells were seeded into 96-well plate in triplicate and placed in an incubator at 37oC, 5.0% CO2
After 24 hours, assays were performed
Increasing concentration of inhibitors were added together with constant concentrations of the uptake substrate and incubated for 20 mins at 37oC
After wash with cold HBSS 4 times, cells were lysed and uptake intensity were measured
These protocols apply to the following series of experiments
34

OAT1, OCT2 and OAT3 displays high uptake sensitivity
35
6-CF concentration 0 µM 0.5 µM 1 µM 2 µM 3 µM 5 µM 10 µM 25 µM 50 µM 100 µM
Uptake ratio 1.16 169.67 226.94 239.13 260.74 274.13 287.70 198.19 146.07 84.16
EAM-1 concentration 0 µM 0.5 µM 1 µM 2 µM 3 µM 5 µM 10 µM 25 µM 50 µM 100 µM
Uptake ratio 2.27 21.56 23.01 22.65 22.73 28.13 29.92 23.72 21.58 21.22
6-CF concentration 0µM 0.5µM 1.0µM 1.5µM 2.0µM 2.5µM 5.0µM 7.5µM 10µM 20µM
Uptake ratio 1.00 5.47 9.05 7.50 7.46 8.58 9.12 3.60 4.51 3.66
OAT1 6-CF
OCT2 EAM-1
OAT3 6-CF

OAT1, OCT2 and OAT3 show accurate uptake specificity
36OAT1 OCT2 OAT3

Independent confirmation of the solute transport ability of RPTEC/TERT1-OCT2
37
Data kindly provided by:Kevin Huang, Graduate Research Associate, Ohio State University, College of PharmacyAlice Gibson, Ph.D., Senior Research Specialist, Ohio State University, College of Pharmacy
Brief Protocol: Aspirate growth media and wash once with warm 1X PBS; remove PBS and add 250 µL of cold inhibitors (prepared serum free DMEM, 0.5 µM) and incubate for 15 minutes; remove inhibitors and add 250 µL of radio-labeled TEA or metformin (prepared serum free DMEM, 4.5 µM) and incubate for 15 minutes; after 15 minutes, remove drug and wash 3 times with cold PBS; lyse the cells and count.
DM
SO
Vem
ura
fen
ib
Cim
eti
din
e
Dasat i
nib
0
1 0
2 0
3 0
4 0
5 0
TE
A U
pta
ke
(pm
ol/
mg
pro
tein
/min
) pa re n ta lO C T 2
DM
SO
Vem
ura
fen
ib
Cim
eti
din
e
Dasat i
nib
0
1 0
2 0
3 0
4 0
5 0
Me
tfo
rm
in U
pta
ke
(pm
ol/
mg
pro
tein
/min
)
p a re n ta l
O C T2

Applications for nephron toxicity studies
38
The following data was kindly provided by Merck & Co., Inc.
Brief Protocol: Cell Viability Assay
About 35000 cells were seeded per well in triplicate in a 96 well plate
• Incubated overnight
• Then incubated with a series of compounds at various concentrations as indicated for 3 days
Cell viability was subsequently determined using CellTiter-Glo® Luminescent Cell Viability (ATP) Assay per Promega’s instructions

Tenofovir decreases cell viability in RPTEC/TERT1-OAT1 but not RPTEC/TERT1 cells
39
Data kindly provided by: Merck & Co., Inc.
Addition of probenecid, an inhibitor of OAT1, abolished the decrease in RPTEC/TERT1-OAT1 cell viability by tenofovir
Blocking of MRP4, the efflux transporter of tenofovir diphosphate, by ceefourin 2, further decreases cell viability presumably through increase of tenofovir diphosphate concentration in the cell.

Cidofovir treatment decreases cell viability of RPTEC/TERT1-OAT1 but not RPTEC/TERT1 cells
40
Cidofovir is an OAT1 substrate
Data kindly provided by: Merck & Co., Inc.

Conclusions – Merck study
41
Modulation of cell viability with various test articles further indicates active transporter uptake
RPTEC/TERT1-OAT1 cells but not the parent RPTEC/TERT1 cells demonstrate decreased cell viability following treatment of tenofovir, a substrate of OAT1 and 3.
Blocking of MRP4, the efflux transporter of tenofovir diphosphate, by ceefourin 2, further decreases cell viability presumably through increase of tenofovirdiphosphate concentration in the cell.
Addition of probenecid, an inhibitor of OAT1, abolished the decrease in RPTEC/TERT1-OAT1 cell viability by tenofovir
Tenofovir, and cidofovir dose response curves show
• All 3 compounds are toxic to RPTEC/TERT1-OAT1 cells
• Tenofovir and cidofovir are not toxic to RPTEC/TERT1, since these compounds cannot enter the cells.
Data kindly provided by: Merck & Co., Inc.

Utility of ATCC next-gen models in drug development
42

Summary
ATCC RPTEC/TERT1 renal uptake cell models stably overexpress OAT1, OCT2, and OAT3
Expression has been confirmed by:
• PCR
• Western blot
• Immunocytochemistry
• Copy number-verified
The clonal stable cells retain important characteristics of in vivo adult renal cells
The performance of these stable cells are well characterized by:
6-CF and EAM-1 uptake assays
Inhibition assays
Confirmed by TEA, Metformin and PAH uptake assays
Tested against the well know renal toxic drugs
43
RPTEC/TERT1-OCT2 (ATCC® CRL-4031-OCT2™)

Resources
We have other hTERT cells – for a complete list download either:
hTERT-immortalized Cell Culture Guide
hTERT-immortalized Cells Brochure
For more information visit www.atcc.org/hTERT
44

Thank you
45
© American Type Culture Collection. The ATCC trademark and trade name, and any other trademarks listed in this publication are trademarks owned by the American Type Culture Collection unless indicated otherwise. The hTERT-immortalized cells are distributed under the terms of the ATCC Material Transfer Agreement and Addendum for TERT products.