best practice: generalized k- two-equation ... - ansys.com · ansys developed a new turbulence...
TRANSCRIPT

Copyright © 2019 ANSYS, Inc. All Rights Reserved.
Jan. 2019 Technical Report ANSYS
Best Practice: Generalized k- Two-Equation Turbulence
Model in ANSYS CFD (GEKO)
Version 1.00
F.R. Menter
R. Lechner
ANSYS German GmbH
A. Matyushenko
NTS, St. Petersburg

Copyright © 2019 ANSYS, Inc. All Rights Reserved.
Jan. 2019 Technical Report ANSYS
Table of Contents 1 Motivation ............................................................................................................. 3
The Generalized k-(GEKO) Model Formulation ............................................... 4
2.1 Basic Formulation .................................................................................... 4
2.2 Limiters and Realizability ........................................................................ 6
2.3 Near Wall Treatment................................................................................ 7
2.4 Terminology ............................................................................................. 9
3 The Influence of the Free GEKO Parameter ......................................................... 9
3.1 The ‘Separation’ Parameter CSEP ............................................................. 9
3.2 The ‘Near Wall’ Parameter CNW ............................................................ 16
3.3 The ‘Mixing’ Parameter CMIX ................................................................ 19
3.4 The ‘Jet’ Parameter CJET ........................................................................ 21
3.5 The ‘Corner’ Parameter CCORNER ........................................................... 22
3.6 The ‘Curvature’ Parameter CCURV ......................................................... 25
3.7 The Blending Function .......................................................................... 27
3.8 Other Special Coefficients ..................................................................... 32
4 Strategies for Model Optimization ...................................................................... 32
4.1 GEKO Defaults ...................................................................................... 32
4.2 Optimizing Coefficients ......................................................................... 33
5 Summary .............................................................................................................. 34
6 Example UDFs .................................................................................................... 35
7 References ........................................................................................................... 36

3
1 Motivation Two-equation turbulence models have matured to a point where a consolidation seems
desirable. The main models used in industrial CFD codes today are k- [14] (standard and
realizable/RKE), k- (SST, BSL, Wilcox) and to a lesser degree V2f [12]
(different versions). The differences between the models are not fundamental, but can
nevertheless have a strong impact on results. For boundary layers, the models differ mostly
in their ‘aggressiveness’ to predict separation onset. Furthermore, in the very near wall region,
models can predict vastly different results, especially for heat transfer simulations, due to their
differences in wall-treatment. There are also noticeable differences for free shear flows, where
each model tends to favor certain flows over others. Finally, different models feature different
limiters, which typically do not affect the baseline flows, but can have substantial influence
in complex applications.
ANSYS developed a new turbulence model family called Generalize k- (GEKO) model
with the goal of turbulence model consolidation. GEKO is a two-equation model, based on
the k- model formulation, but with the flexibility to tune the model over a wide range of
flow scenarios. The key to such a strategy is the provision of free parameters which the user
can adjust for specific types of applications without negative impact on the basic calibration
of the model. In other words, instead of providing users flexibility through a multitude of
different models, the current approach aims at providing one framework, using different
coefficients to cover different application sectors. This will substantially simplify code usage
for industrial CFD users. This approach also offers a much wider range of calibration
capabilities than currently covered by switching between existing models. Finally, GEKO is
(or will be made) compatible with all other options in the codes, so that there is no need to
select any other model for compatibility or accuracy reasons.
Historically, the coefficients of turbulence models are exposed in the GUI to users (e.g.
C1, C2, etc. in a k- model). However, this exposure is of little value, as most coefficients
are linked to the basic calibration of the model (namely the calibration for the logarithmic law
affecting e.g. flat plate simulations). Users can therefore not freely change these values
without affecting such flows. In the GEKO model, free coefficients are introduced, which do
not affect the logarithmic layer calibration and can therefore by tuned to achieve the desired
model behavior. The GEKO model offers six free parameters – two of them aiming at wall
bounded flows, two for the calibration of free shear flows, one coefficient to improve corner
flow simulations (corner separation) and finally a curvature correction term.
The generic idea behind the model will be discussed. Not all details can be provided as the
model is at present unpublished. However, the variability of the model will be demonstrated
for a variety of generic flows and Best Practice Guidelines for optimal usage will be provided.
In order to keep the document compact, only a sketch of the geometry is provided for the
test cases as well as a the reference to the publication. This is sufficient, as the test cases are
typically simple and it is only required to understand the basic flow challenge.

4
The Generalized k-(GEKO) Model Formulation
2.1 Basic Formulation
The main characteristics of the GEKO model is that it has several free parameters for
tuning the model to different flow scenarios. The starting point for the formulation is:
𝜕(𝜌𝑘)
𝜕𝑡+
𝜕(𝜌𝑈𝑗𝑘)
𝜕𝑥𝑗= 𝑃𝑘 − 𝐶𝜇𝜌𝑘𝜔 +
𝜕
𝜕𝑥𝑗[(𝜇 +
𝜇𝑡
𝜎𝑘)
𝜕𝑘
𝜕𝑥𝑗] (2.1)
𝜕(𝜌𝜔)
𝜕𝑡+
𝜕(𝜌𝑈𝑗𝜔)
𝜕𝑥𝑗= 𝐶𝜔1𝐹1
𝜔
𝑘𝑃𝑘 − 𝐶𝜔2𝐹2𝜌𝜔2 + 𝜌𝐹3𝐶𝐷 +
𝜕
𝜕𝑥𝑗[(𝜇 +
𝜇𝑡
𝜎𝜔)
𝜕𝜔
𝜕𝑥𝑗] (2.2)
𝜇𝑡 = 𝜌𝜈𝑡 = 𝜌𝑘
𝑚𝑎𝑥(𝜔, 𝑆/𝐶𝑅𝑒𝑎𝑙𝑖𝑧𝑒) (2.3)
𝑃𝑘 = −𝜏𝑖𝑗
𝜕𝑈𝑖
𝜕𝑥𝑗 (2.4)
𝜏𝑖𝑗𝐸𝑉 = −𝜌𝑢𝑖
′𝑢𝑗′ = 𝜇𝑡2𝑆𝑖𝑗 −
2
3𝜌𝑘𝛿𝑖𝑗 (2.5)
𝐶𝐷 =2
𝜎𝜔
1
𝜔
𝜕𝑘
𝜕𝑥𝑗
𝜕𝜔
𝜕𝑥𝑗 (2.6)
𝜏𝑖,𝑗=𝜏𝑖𝑗
𝐸𝑉 − 𝐶𝐶𝑂𝑅𝑁𝐸𝑅1.2𝜇𝑡
𝑚𝑎𝑥(0.3𝜔,√0.5(𝑆2+Ω2))(𝑆𝑖𝑘Ω𝑘𝑗 − Ω𝑖𝑘𝑆𝑘𝑗)
(2.7)
with
𝑆𝑖𝑗 =1
2(
𝜕𝑈𝑖
𝜕𝑥𝑗+
𝜕𝑈𝑗
𝜕𝑥𝑗) Ω𝑖𝑗 =
1
2(
𝜕𝑈𝑖
𝜕𝑥𝑗−
𝜕𝑈𝑗
𝜕𝑥𝑗𝑖)
𝑆 = √2𝑆𝑖𝑗𝑆𝑖𝑗 ; Ω = √2Ω𝑖𝑗Ω𝑖𝑗
The free coefficients of the GEKO model are implemented through the functions (F1,F2,F3)
which can be tuned by the user to achieve different goals in different parts of the simulation
domain. Currently there are six parameters included for that purpose:
CSEP
- Main parameter for adjusting separation prediction for boundary layers
- Affects all flows - Increasing CSEP reduces eddy-viscosity leading to
more sensitivity to adverse pressure gradients for boundary layers and to
lower spreading rates for free shear flows (compensated by CMIX)
CNW
- Affects mostly the inner part of wall boundary layers (limited to no
impact on free shear flows.
- Increasing CNW leads to higher wall shear stress and wall heat transfer
rates in non-equilibrium flows.

5
- Effect on non-generic flows (e.g. vortices) moderate but not
systematically tested
- Users can mostly use CNW = 0.5 (default)
CMIX
- Affects only free shear flows (boundary layer shielded due to function
Fblend).
- Increasing CMIX increases spreading rates of free shear flows
- For each value of CSEP an optimal value of CMIX exists, which maintains
optimal free shear flows. This value is given by the correlation
CMIX=CMixCor which is default
𝐶𝑀𝑖𝑥𝐶𝑜𝑟 = 0.35sign(𝐶𝑆𝑒𝑝 − 1)√(|𝐶𝑆𝑒𝑝 − 1|)
CJET
- Is active in a sub-model of CMIX (no impact for CMIX = 0).
- Affects mostly jet flows. Increasing CJET while CMIX is active, decreases
spreading rate for jets.
- Allows to adjust spreading rate of jet flows while maintaining spreading
rate of mixing layer.
- Users can mostly use CJET = 0.9 (default)
- Has no effect in case of CMIX = 0
CCORNER
- Non-linear stress-strain term to account for secondary flows in corners
(e.g. wing-body junctions etc. [17]).
CCURV
- An existing model for curvature correction, which can be combined with
the GEKO model [27,19]
All coefficients (except of CJET which is of minor importance) can be accessed globally or
locally through User Defined Functions (UDFs), allowing a global or zonal model
optimization.
The coefficients CSEP and CNW affect boundary layers, whereas CMIX and CJET are designed
for free shear flows. In order to avoid any influence of CMIX and CJET onto boundary layers, a
blending function is introduced, which de-activates CMIX and CJET in the boundary layer. The
function is similar to the blending function used in the BSL/SST model formulation and given
by:
𝐿𝑇 =√�̃�
𝐶𝜇𝜔
�̃� = 𝑚𝑎𝑥(𝑘, 𝐶𝐹𝑏𝐿𝑎𝑚 ∙ 𝜔)
𝑥𝑏𝑙𝑒𝑛𝑑 = 𝐶𝐹𝑏𝑇𝑢𝑟𝑏
𝐿𝑇
𝑦
𝐹𝐺𝐸𝐾𝑂 = 𝑡𝑎𝑛ℎ(𝑥𝑏𝑙𝑒𝑛𝑑4)
(2.8)
This function activates the free shear flow parameters as follows:

6
𝐹𝐹𝑟𝑒𝑒 = 𝐶𝑀𝐼𝑋𝐹𝐽𝑒𝑡(𝐶𝐽𝐸𝑇)(1 − 𝐹𝐵𝑙𝑒𝑛𝑑) (2.9)
There are two important aspects. Firstly, the function 𝐹𝐵𝑙𝑒𝑛𝑑 = 1 inside boundary layers
and 𝐹𝐵𝑙𝑒𝑛𝑑 = 0 for free shear flows. Secondly, the parameter CJET is a sub-parameter of CMIX.
It only affects the simulation in case 𝐶𝑀𝐼𝑋 ≠ 0.
The free coefficients should be in the range (defaults in parenthesis):
MIN Parameter MAX Default
0.7 ≤ CSEP ≤ 2.5 1.75
-2.0 ≤ CNW ≤ 2.0 0.50
... 0.5 ≤ CMIX ≤ 1.0… 𝐶𝑀𝑖𝑥𝐶𝑜𝑟 (2.10)
0.0 ≤ CJET ≤ 1.0 0.90
0.0 ≤ CCORNER ≤ 1.5 1.00
0.0 ≤ CCURV ≤ 1.5 1.00
The greyed values for CMIX are only suggestions. There might be situations where values
lower than 0.5 or higher than 1.0 can be appropriate.
As mentioned above, for the coefficient CMIX a correlation is provided as default, which
ensures that changes in CSEP do not negatively affect free mixing layers:
𝐶𝑀𝑖𝑥𝐶𝑜𝑟 = 0.35sign(𝐶𝑆𝑒𝑝 − 1)√(|𝐶𝑆𝑒𝑝 − 1|) (2.11)
2.2 Limiters and Realizability
It is well-known that any conventional two-equation model exhibits build-up of turbulence
in stagnation regions of bluff bodies (like leading edges of airfoils etc.). The reason lies in the
substitution of the eddy-viscosity assumption into the production term Pk of the two-equation
model. The eddy-viscosity assumption is not representing the physics correctly in such
regions and leads to an over-production of turbulence kinetic energy, which in turn can lead
to excessive eddy-viscosity levels in these areas. This can have a detrimental effect on the
flow over the rest of the geometry, as the boundary layers starting from the leading edge
stagnation point would be predicted incorrectly. This can cause large errors and even false
separation. Such situations do not only appear in classical stagnation zones of airfoils, but in
many technical flows, where flows hit on a surface or different flow streams collide to form
a stagnation region.
There are numerous remedies for that problem. The most widely known is the use of the
so-called Kato-Launder correction [15] whereby the square of the shear strain in Pk is replaced
by strain times vorticity:
𝑃𝑘 = 𝜇𝑡𝑆2 → 𝑃𝑘 = 𝜇𝑡𝑆𝛺 (2.12)

7
This option is available, albeit typically not by default. It is however activated when using
the GEKO model in combination with a model for laminar-turbulent transition, as it prevents
even small production rates which can have a significant effect on transitional flows. It should
be noted that the Kato-Launder modification can have an effect on flows with rotation and
swirl relative to the original model calibration. It also leads to un-physical production in
rotating systems as pointed out by Durbin and Reif [11] and should therefore be applied with
caution.
An alternative was proposed by Menter [17] in form of a production limiter:
�̃�𝑘 = 𝑚𝑖𝑛(𝑃𝑘 , 𝐶𝑃𝐾𝑙𝑖𝑚𝜌휀) (2.13)
The limiting coefficient can be chosen fairly large (typically CPKlim=10), relative to the
equilibrium relation Pk/()=1. It will therefore not affect any calibrated flow and still avoids
the stagnation build-up and is used as a default option in GEKO (as in all other k- based
models in ANSYS CFD).
A more theoretical concept can also be applied by imposing a realizability constraint.
Realizability demands e.g. that all normal Reynolds Stress components need to always remain
positive (e.g. [11]). This is clearly true from a physical standpoint, but can be violated by
eddy-viscosity models (as well as EARSM and RSM). One can argue about how important
this constraint is from a practical standpoint, as eddy-viscosity models do not attempt to
accurately describe each single Reynolds Stress, but model essentially the principal shear
stress. Still, the realizability constraint can, as a side-effect, help to avoid stagnation build up.
For eddy-viscosity models it reads:
𝜈𝑡 = 𝑚𝑖𝑛 (𝑘
𝜔, 𝐶𝑅𝑒𝑎𝑙𝑖𝑧𝑒
𝑘
𝑆) =
𝑘
𝑚𝑎𝑥(𝜔, 𝑆/𝐶𝑅𝑒𝑎𝑙𝑖𝑧𝑒); 𝐶𝑅𝑒𝑎𝑙𝑖𝑧𝑒 =
1
√3≈ 0.577 (2.14)
The realizability limiter has the additional benefit to prevent numerical break-down in case
approaches zero at any point in the domain. Without the constraint in the denominator, this
would lead to arbitrarily high eddy-viscosities, whereas with the limiter, such points are
typically handled gracefully.
In the GEKO model the realizability limiter is utilized in addition to the production limiter
by default. Users can change the values of both coefficients.
2.3 Near Wall Treatment
The near wall formulation of a turbulence model has a substantial effect on its accuracy
and its robustness. In addition, modern CFD codes typically feature so-called y+-insensitive
wall formulations, which allow the user to obtain sensible simulations over a wide range of
grids with different y+ near wall resolutions.
The GEKO model family was designed by sticking closely to the original k- model
formulation – following the argument that the modeled k is proportional to 𝑣′𝑣′̅̅ ̅̅ ̅ and not to the
physical turbulence kinetic energy. The peak observed in the turbulence kinetic energy in the
buffer layer is therefore not modelled, as it consists mostly of passive motion (no effect on
shear stress).
A y+-insensitive wall formulation has been developed for the GEKO model (similar to
what is used in the BSL and SST models). It allows the use of the model, on meshes of
8
arbitrary y+ values, as long as the y+-value lies in the logarithmic layer of the boundary layer,
and as long as the rest of the boundary layer is resolved with a sufficient number of cells.
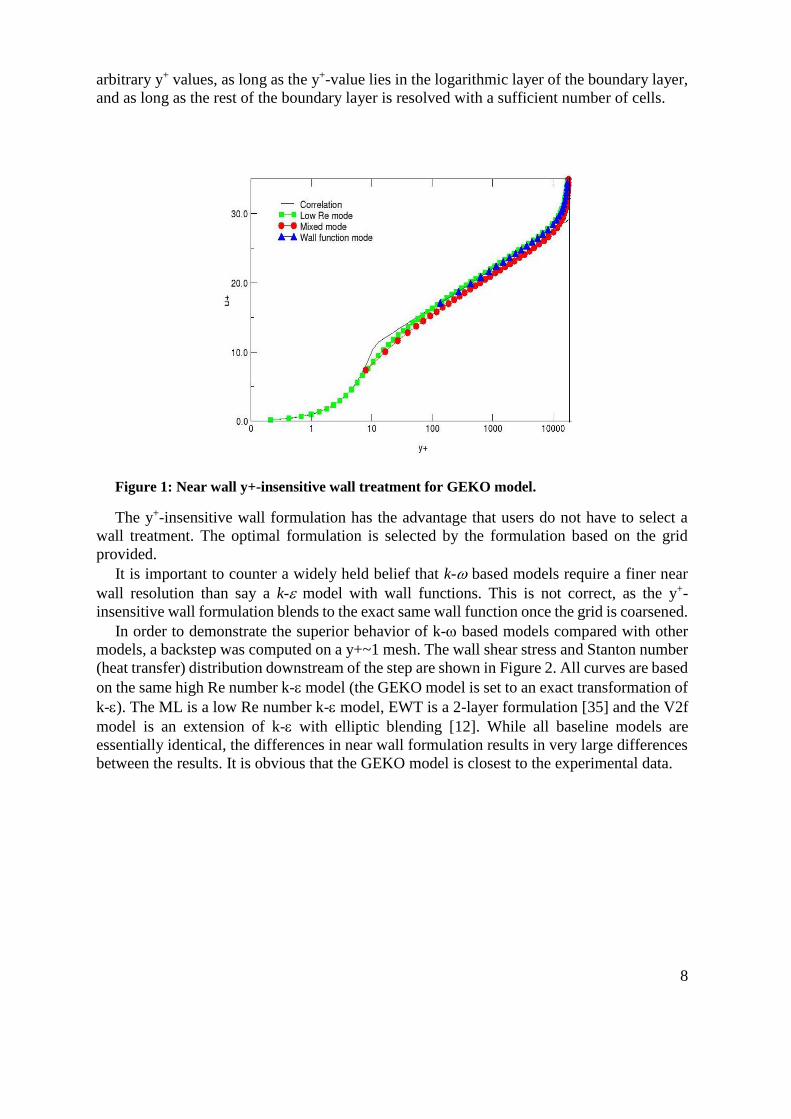
Figure 1: Near wall y+-insensitive wall treatment for GEKO model.
The y+-insensitive wall formulation has the advantage that users do not have to select a
wall treatment. The optimal formulation is selected by the formulation based on the grid
provided.
It is important to counter a widely held belief that k- based models require a finer near
wall resolution than say a k- model with wall functions. This is not correct, as the y+-
insensitive wall formulation blends to the exact same wall function once the grid is coarsened.
In order to demonstrate the superior behavior of k- based models compared with other
models, a backstep was computed on a y+~1 mesh. The wall shear stress and Stanton number
(heat transfer) distribution downstream of the step are shown in Figure 2. All curves are based
on the same high Re number k- model (the GEKO model is set to an exact transformation of
k-). The ML is a low Re number k- model, EWT is a 2-layer formulation [35] and the V2f
model is an extension of k- with elliptic blending [12]. While all baseline models are
essentially identical, the differences in near wall formulation results in very large differences
between the results. It is obvious that the GEKO model is closest to the experimental data.

9
Figure 2: Wall shear stress coefficient, Cf (left) and wall heat transfer coefficient, St, (right)
for backward-facing step flow [31]
2.4 Terminology
In order to clearly characterize the model variant used in an application, it is important to
have a unified terminology for the model. It is proposed to just name the coefficients which
are not default.
GEKO with CSEP=1.2, CNW=1.0, CMIX=1.0, CJET=0.9 would be termed
o GEKO:(CSEP=1.2, CNW=1.0, CMIX=1.0).
GEKO with CSEP=1.5, CNW=0.0, CMIX=CMixCor, CJET=1.0 would be termed
o GEKO:( CSEP=1.5, CNW=0.0, CJET=1.0).
Situations where only CSEP is changed (most frequent case) will just be
characterized in short notion:
o GEKO with CSEP=1.5 will be termed GEKO-1.5
3 The Influence of the Free GEKO Parameter
3.1 The ‘Separation’ Parameter CSEP
The ability to predict separation depends mostly on the level of the eddy-viscosity in the
boundary layer. A suitable approach for tuning the model to adverse pressure gradients and
separation is to allow a re-calibration of the basic model constants, while at the same time
maintaining the calibration for the slope of the logarithmic layer and the proper near wall
viscous damping required for achieving the correct shift in the log-layer (and thereby the
correct wall shear stress). This is achieved by using the free parameter CSEP.
Figure 3 shows the effect of CSEP on a flat plate boundary layer computation for the ratio
𝐸𝑉𝑅 = 𝜇𝑡 𝜇⁄ . Increasing CSEP from CSEP=1.00 to CSEP=1.75 leads to a significant reduction
in the ER levels. (Note that the effect is even more pronounced for flows with adverse pressure
gradients and separation).

10
Figure 3: Change of the eddy-viscosity ratio (EVR) under changes of CSEP for a flat plate.
Top: CSEP=1.0 (all else default). Bottom CSEP=1.75 (all else default)
Figure 4 shows that even large changes in CSEP do not have any effect on the wall shear
stress (Cf) and heat transfer coefficients (St). This is the basic design criterion for the GEKO
model. It ensures that the user can adjust coefficients like CSEP freely (within range).
Figure 4: Flat plate boundary layer under variation of CSEP (CNW=0.5). Left : Wall-
shear stress coefficient, Cf, Right: Wall heat transfer coefficient, St.
The independence of the mean flow velocity is also illustrated by the logarithmic velocity
profiles shown in Figure 5. Again, the logarithmic velocity profile is maintained over a wide
range of CSEP coefficients.

11
Figure 5: Velocity profiles in logarithmic plot under variation of CSEP for flat plate
The effect of CSEP on an equilibrium adverse pressure-gradient boundary layer flows is
demonstrated for the experiment of Skare and Krogstad (T=20 , Re*=1.0x10⁵) [21]. The
simulations are based on the equilibrium boundary layer equations as given by Wilcox [31].
The non-dimensional pressure gradient T=20 drives the flow close to separation, a regime,
which is very sensitive to turbulence modeling. The left part of Figure 6 shows the influence
of CSEP on the velocity profiles whereas the right part shows the impact on the non-
dimensional eddy-viscosity, 𝑁𝑈𝑇 = 𝜈𝑡 (𝑈𝛿𝛿∗)⁄ (U is the velocity at the edge of the
boundary layer and * is the displacement thickness). The velocity profile exhibits moderately
but visibly more decelerated with increasing CSEP. The eddy-viscosity, however, is drastically
reduced by more than a factor of two by the variation of CSEP between 1-2. The most accurate
solution is the one with CSEP=1.75. This reduction in eddy-viscosity is desirable for adverse
pressure-gradient boundary layers, as low values increase the sensitivity of the model to
adverse pressure gradients and separation. Note that the coefficients CMIX, CJET have little
effect on the boundary layer flows, due to the blending function being mostly equal to one
inside the boundary layer. The parameter CNW was set to its default value CNW=0.5 (as will
be detailed later). However, variations of CNW would have little effect on the current flow.
Figure 6: Impact of variation in CSEP on boundary layer with adverse pressure gradient. Left:
Velocity profile. Right Eddy-viscosity profiles

12
The effect of variation in CSEP is shown in Figure 7 for the axi-symmetric diffuser flow of
Driver et al [10] (CNW=0.5, CMIX=CMixCor, CJET=0.9). As expected from the results for the
equilibrium boundary layer, with increasing CSEP, the model becomes more sensitive to the
adverse pressure gradient in the diffuser and improves its separation predict up to a value of
CSEP~1.75-2.00. Higher values of CSEP lead to over-separation. Note that an optimal
calibration of a turbulence model for the CS0 diffuser, does not necessarily guarantee an
optimal solution for other similar flows. As will be shown below, for 2D airfoils more
‘aggressive’ settings are required to match the exp. data. It is therefore desirable that the
GEKO model can be pushed to over-separation for the CS0 case.
Figure 7: Impact of variation in CSEP on CS0 diffuser flow [10]. Left wall shear stress
coefficient, Cf. Right: Wall pressure coefficient Cp
Figure 8: Impact of variation in CSEP on velocity profiles for CS0 diffuser flow [10]
A more realistic application for tuning the CSEP coefficient is the simulation of 2D airfoil
profiles under variation of the angle of attack, . Figure 9 to Figure 13 compare lift curves
for numerous airfoils computed with the GEKO model. In these comparisons, it should be
kept in mind that 2D simulations are not entirely correct in the stall and post-stall region
(around and past maximum lift, CLmax), due to the formation of 3D structures in the
experiments. Despite of this, it is possible to adjust the GEKO model for the prediction of
such flows for angles of attack in 2D simulations. Increasing CSEP predicts earlier separation

13
onset, which improves agreement of the predicted pressure coefficient and results in an
improved agreement of the lift coefficient with the experimental data1 near stall. The optimal
value for CSEP for such flows is therefore somewhere between CSEP=2.00-2.50.
The current test cases demonstrate the advantage of the GEKO model over e.g. the SST
model. The SST model is tuned to match adverse pressure gradients flows and flows with
separation well on average. However, for the 2D airfoils the SST model is clearly too
conservative resulting in overly optimistic CLmax levels. This would be hard to correct within
the SST model and in any case would require expert knowledge in turbulence modeling.
Within the GEKO model, separation prediction can easily be adjusted by changing CSEP even
by a non-expert.
Figure 9: Prediction of lift and pressure coefficients with GEKO model for DU-96-W-180
(Left) and DU-97-W-300 (Right) airfoil at Re=3·106 [28]
1 There are no experimental data for the pressure coefficients for the DU-96-W-180 and
DU-97-W-300 airfoils. Only distribution of lift coefficient in wide range of angles of attack
are available.

14
Figure 10: Prediction of lift coefficient in wide range of angle of attacks (Left) and pressure
coefficient for α = 12o (Right) with GEKO model for S805 airfoil at Re=1·106 [23]
Figure 11: Prediction of lift coefficient in wide range of angle of attacks (Left) and pressure
coefficient for α = 17o (Right) with GEKO model for S825 airfoil at Re=2·106 [24]

15
Figure 12: Prediction of lift coefficient in wide range of angle of attacks (Left) and pressure
coefficient for α = 10o (Right) with GEKO model for S809 airfoil at Re=2·106 [25]
Figure 13: Prediction of lift coefficient in wide range of angle of attacks (Left) and pressure
coefficient for α = 18o (Right) with GEKO model for S814 airfoil at Re=1.5·106 [26]
It is important to understand that changes of CSEP affect not only boundary layers, but the
entire flow field. Increasing CSEP reduces the eddy-viscosity in all parts of the domain,
including for free shear flows (e.g. mixing layers etc.). Frequently, the adjustment of boundary
layer separation is the main optimization requirement and it is desirable to maintain the
performance and calibration for free shear flows (e.g. spreading rates for mixing layers and
jets etc.). In order to avoid any negative impact of CSEP on free shear flows, the reduction in
eddy-viscosity is corrected by modifying CMIX accordingly. This is achieved through the
correlation CMixCor given in Equation (2.11). This correlation increases CMIX with increasing
CSEP to maintain the spreading rates for mixing layers. As the correlation CMIX =CMixCor is
default, users do not have to adjust CMIX when changing CSEP. This effect will be demonstrated
in the Section 3.3 dealing with the impact of CMIX.

16
The Bachalo-Johnson NASA Bump flow experiment [2], as depicted in Figure 14, features a
subsonic inflow with Ma=0.875. The flow is then accelerated to supersonic speed over the
bump and then reverts to subsonic speed through a shock wave. The shock causes the
boundary layer behind the shock to separate, which in turn interacts with the shock by pushing
it forward. The ability to predict the shock location is therefore directly linked to a model’s
ability to predict boundary layer separation. As expected, again, the models group as GEKO-
1.75/SST and GEKO-1.00/RKE as seen from Figure 15. Both, the GEKO-1.75 and the SST
model can predict the shock location and the post-shock separation zone properly. The
GEKO-1.00/RKE models fail due to their lack of separation sensitivity.
Figure 14: Schematic of transonic axi-symmetric bump flow
Figure 15: Pressure coefficient, Cp, along wall of bump. Comparison of different GEKO
settings with RKE and SST model and experimental data [2].
3.2 The ‘Near Wall’ Parameter CNW
The coefficient CNW is introduced to allow a modification of the model characteristics in
the near wall region under non-equilibrium conditions. It has a strong effect on heat transfer
predictions in reattachment and stagnation regions.
The first task is to show that variations in CNW (like CSEP) do not affect flat plate boundary
layer behavior. This can be seen from Figure 16 where both, the wall shear stress coefficient,
Cf, and the wall heat transfer coefficient St are unaffected by variations in CNW. In addition,

17
the velocity profile in log-scale is maintained as shown in Figure 17. Many more variations
of parameters CSEP and CNW have been tested and the agreement is like that shown in Figure
17.
Figure 16: Flat plate boundary layer under variation of CNW (CSEP=1.75). Left : Wall-shear
stress coefficient, Cf, Right: Wall heat transfer coefficient, St.
Figure 17: Velocity profiles in logarithmic coordinates - variation of CNW (CSEP=1.75)
The effect of changing CNW for the axisymmetric diffuser test case CS0 [10] is shown in
Figure 18. The coefficient CNW is designed to have an influence mostly near the wall.
Therefore, the wall shear-stress distribution shows a much larger sensitivity to this variation
(Figure 18 Left) than the Cp-distribution (Figure 18 Right). The velocity profiles shown in
Figure 19 illustrate the effect more clearly. Contrary to changes of CSEP, where the entire
boundary layer is affected, variations in CNW change only the inner part of the velocity
profiles.

18
Figure 18: Impact of variation in CNW on CS0 diffuser flow [10]. Left: Wall shear-stress
coefficient, Cf. Right: Wall pressure coefficient Cp (CSEP=1.0, CMIX=0.0, CJET=0.9)
Figure 19: Impact of variation in CNW on velocity profiles for CS0 diffuser flow [10]
For non-equilibrium flows, the wall shear stress and more importantly, the heat transfer to
a wall, depend mostly on the model details close to the wall. The coefficient CNW can be tuned
to allow fine-tuning for such flows. An example is backward-facing step with Cf and heat
transfer measurements, St, downstream of the step [31]. The effect is shown in Figure 20. It
is computed with both, CSEP=1.0 and CSEP=1.75, CMIX=CMixCor , CJET=0.9 and a variation in
CNW. The heat transfer is strongly affected (and can therefore be optimized) by changes in
CNW. In the current application, the optimal value is CNW=0.5 for both values of CSEP.
CNW=0.5 is also the default setting. It is important to note that CNW is a minor parameter and
will likely not have to be tuned for most flows. Wider validation studies indicate that the
default value is suitable for most applications.

19
CSEP=1
CSEP=1.75
Figure 20: Backward-facing step with heat transfer under variation of CNW (Top: CSEP=1.00,
Bottom: CSEP=1.75, Both: CJET=0.9, CMIX=CMixCor). Left: Wall shear stress coefficient, Cf, Right:
Heat transfer Stanton number
3.3 The ‘Mixing’ Parameter CMIX
The parameter CMIX affects only free shear flows. It has no impact on boundary layers due
to the blending function FBlend. Increasing CMIX leads to larger eddy-viscosity (higher
turbulence levels) in free shear flows. This is illustrated in Figure 21 which shows results for
a mixing layer simulation compared with experimental data [3]. As expected, increasing CMIX
leads to larger spreading rates of the velocity profile, associated with higher levels of
turbulence kinetic energy. In most applications, it is desirable to calibrate the coefficient such
that a good agreement with mixing layer flows is achieved (in the current example with
CSEP=2 this means CMIX=0.35). However, there can be cases, where stronger mixing is desired
and where the calibration for a classical mixing layer is not sufficient. Examples are flows
with strong mixing characteristics, like flows past bluff bodies etc. It should be emphasized
that the physical reason for increased mixing in such cases is often a result of flow
unsteadiness (e.g. vortex shedding) augmenting the conventional turbulence mixing. In such
cases it will not be possible to obtain a perfect agreement against data, as such unsteady effects
are typically stronger than that which a turbulence model can provide. Still, increasing CMIX
can at least compensate for some of the missing effects, in case that unsteady (scale resolving)
simulations are not feasible.

20
Figure 21: Impact of variation in CMIX on mixing layer when using the CSEP=2 (CJET=0.9,
CNW=0.5). Left: Velocity profile. Right: Turbulence kinetic energy profiles
As already mentioned in the section on CSEP (section 3.1), there is a subtle interaction of
CMIX and CSEP which users have to understand. Variations in CSEP also affect free shear
flows and increases in CSEP result in lower spreading rates. This can be seen in Figure 22
which shows the results of a CSEP variation for the mixing layer [3] (CMIX = 0, CJET = 0.9,
CNW = 0.5). Here the solution with CSEP = 1 is closest to the data whereas the solution with
CSEP=2 predicts far too low spreading rates and turbulence levels. The effect on the eddy-
viscosity is even stronger than for the boundary layer resulting in a reduction of more than a
factor 3 with increasing CSEP (not shown).
Figure 22: Impact of variation in CSEP on mixing layer (CMIX=0, CJET=0.9, CNW=0.5). Left:
Velocity profile. Right: Turbulence kinetic energy profiles
In order to compensate the effect of CSEP on free shear flows, the coefficient CMIX has to
be increased with increasing CSEP. This is achieved by the correlation CMixCor given in
Equation (2.11) which is the model default. The correlation is provided so that users know
which value is optimal for a given CSEP setting. Increasing CMIX above this value will lead to
higher and decreasing it to lower turbulence levels and spreading rates for free shear flows.
The results for mixing layer simulations with CMIX= CMixCor are shown in Figure 23. For all
selected values of CSEP, the mixing layer is maintained, and correct spreading rates are
achieved.

21
Figure 23: Impact of variation in CSEP on mixing layer when using the CMIX=CMixCcor
correlation (CJET=0.9, CNW=0.5). Left: Velocity profile. Right: Turbulence kinetic energy
profiles
3.4 The ‘Jet’ Parameter CJET
The impact of the CJET parameter is subtle and in most applications it can be maintained at
its default value. It is important in cases where jet flows need to be computed with high
accuracy. Remember that conventional models like k- or SST will over-predict spreading
rates of round jets substantially while giving reasonable results for plane jets. For this so-
called round-jet plane-jet ‘anomaly’ see e.g. [19,33].
The GEKO model is designed to provide parameter settings which allow an accurate
representation of jet flow. This is achieved through the parameter CJET. The way this is
achieved is by reducing the influence of CMIX (which increases mixing layer spreading rates)
on jet flows (especially round jets). It should also be noted that the coefficient CJET is a sub-
function of the coefficient CMIX. In case CMIX=0, the coefficient CJET has no impact.
Simulations are again based on self-similar jet-flow equations as given by Wilcox [33].
The two test cases are Wygnanski and Fielder [36] for the plane jet and Bradbury [4] for the
round jet. Figure 24 shows simulations with CSEP=2, CMIX=0.35 (Correlation) and CNW=0.5
(default). It is clearly seen that the model overpredicts the spreading rates especially for the
round jet with CJET=0. The effect of CJET is to reduce the spreading rate of both jet flows, with
CJET=0.9 being close to both experimental data-sets. With CSEP=2 and CJET=0.9, the model
avoids the round jet/plane jet anomaly and predicts lower spreading rates for the round than
for the plane jet. Note again, that the changes of CJET discussed here do not affect the mixing
layer.
In contrast, Figure 25 shows a comparison between GEKO-1 (CSEP=1.0) and GEKO-2
(CSEP=1.0) with CJET=0.9. As GEKO-1 is a close cousin of the standard k- model it behaves
just like that model. It gives a correct spreading rate for the plane jet but over-predicts the
round jet. Note again, that changes to CJET in GEKO-1 would have no effect, as for that model
CMIX=0 (so that the sub-model CJET is de-activated).

22
Figure 24: Effect of CJET for plane (left) and round (right) jet flow (CSEP=2.0, CMIX=0.35,
CNW=0.5)
Figure 25: Comparison of GEKO-1 and GEKO-2 model (with variation of CJET=0.9)
In summary, in order to achieve optimal performance for round jets, one needs to set CSEP
to values CSEP~1.75-2.00 and CJET=0.9 (default). With reduction in CSEP and the
corresponding reduction in CMIX, the effect of CJET vanishes.
There is another parameter CJET_AUX which also has an influence on the jet flow. It
defines the limit between mixing layers and jet flows. The larger the value, the sharper the
‘demarcation’ and stronger the effect of CJET. The default value is CJET_AUX =2.0. It is
suitable for jet flow simulations to set the value to CJET_AUX =4.0. This is not done by
default, as it can lead to oscillations on poor meshes.
Users who do not have a need for accurate predictions of jets can use the default settings
for CJET.
3.5 The ‘Corner’ Parameter CCORNER
It is well known that for rectangular turbulent channel flows, secondary flows develop in
the plane normal to the mean flow. Such secondary flow is not present in laminar flows and
can also not be represented at all by eddy-viscosity models. The situation is depicted in Figure
26 for a square channel. The main flow direction is normal to the plotting plane. The velocity

23
contour colors on the left picture show the main flow as computed by a linear eddy-viscosity
model. There are no streamlines when projected into this plane.
The practical effect of this effect is that the secondary flow transports flow (and thereby
momentum) into the corner. If the corner flow experiences an adverse pressure gradient, this
additional momentum can help the flow to avoid/delay separation. When computing such
flows with an eddy-viscosity model, such separations can occur earlier than in the
experiments, which in turn can have a substantial effect on the overall performance. The right
picture shows the results from a Direct Numerical Simulation (DNS, e.g. [19]) of this flow.
There are clearly recognizable secondary streamlines pushing flow into the corners. The
center picture shows the GEKO model in combination with an existing non-linear algebraic
stress-strain model (Wallin-Johansson Explicit Reynolds Stress Models WJ-EARSM), which
can mimic the effect. The WJ-EARSM is fairly complex and the GEKO model was used as a
reference point for calibration of the much simpler quadratic stress-strain relationship which
can also account for this effect (Equation (2.7)). This term has a free parameter, CCORNER,
which can be tuned by the users.
Figure 26: Comparison of streamline velocity contours and secondary motion predicted by
linear (Left) and non-linear (Center) GEKO-1.00 model with the DNS (Right) data in the fully
developed square duct flow [19]
Figure 27 shows a comparison for the rectangular channel for GEKO-175 (CSEP=1.75 all
else default). The left picture shows the combination of GEKO with the WJ-EARSM, the
middle picture the combination with the quadratic term and CCORNER=0.9 and the left for
CCORNER=0.0. The simple quadratic model gives a good approximation of the flow, similar to
the WJ-EARSM.
Figure 27: Comparison of turbulence models for flow in square channel. Left: GEKO with
WJ-EARSM. Middle, GEKO with CCORNER=0.9. Right GEKO linear (CCORNER=0.0).

24
Figure 28 shows a comparison of velocity profiles for different turbulence models for the
square channel. The right part of the picture shows the secondary flow into the corner along
a diagonal of the channel cross-section. Most obviously, the linear model (GEKO-1.75) gives
zero velocity along the diagonal. The other models provide fairly similar strength and
distributions of the same order as the reference DNS data, but clearly also not in perfect
agreement, especially very close to the wall. Note that further increases in CCORNER for this
flow would break the symmetry of the crossflow pattern. The left part of the figure shows the
mean flow profile also along the diagonal. The most important effect is the higher velocity
close to the wall (‘fuller profile’) which allows the flow to overcome a stronger pressure
gradient before separating.
Figure 28: Velocity profiles plotted along diagonal of channel for different turbulence models
against DNS data. Right: Main Flow, Left Secondary Flow.
A more challenging example is the flow in a 3D diffuser [5] shown in Figure 29. The
diffuser has two opening angles, a large one on the upper wall and a small one at the side
walls. In the experiments, the flow separates from one of the corners and then attaches to the
lower wall. In the simulations, the flow topology depends strongly on the model and the corner
flow representation.
Figure 29: Geometry of 3D diffuser flow [4]
Figure 30 shows the mean velocity contours at the end of the expansion section of the
diffuser. Clearly the flow topology depends strongly on the selected values of the corner flow
correction term.
The influence of the model changes on the pressure coefficient, Cp, can be seen in Figure
31. Note that the current flow is very sensitive and hard to compute, but it does demonstrate
the importance of corner flow separation for technical flows.

25
Figure 30: Flow topology for 3D diffuser flow shown through streamwise velocity contour
at downstream end of diffuser opening section for GEKO-1.00 with different CCORNER
values.
Figure 31: Wall pressure coefficient, Cp, for 3D diffuser for GEKO-1.00 with different
CCORNER values.
3.6 The ‘Curvature’ Parameter CCURV
The curvature correction (CC) is an already existing model, which is accessible to all eddy-
viscosity models in Fluent. The only change when integrating it with GEKO was that the
coefficient CCURV is now also accessible through a User Defined Function (UDF) and can thus
be optimized zonally, or even locally.
No detailed description of the CC formulation is given, as it is described elsewhere [22].
The effect of the CC can be shown for a hydro-cyclone (see Figure 32) The flow (typically
with particles) enters the domain tangentially through the feed. A strong swirl is generated
pushing the particles to the wall and out through the underflow, whereas the cleaned fluid
leaves the domain through the overflow. The effect of swirl and rotation cannot be handled
by eddy-viscosity models without corrections. The current CC serves this purpose, as can be

26
seen by a comparison of the circumferential velocity profiles for the SST model, the SST-CC
and a full Reynolds Stress model (RSM-SSG) in Figure 32. While the model without CC
produces mostly a solid-body rotation, the SST-CC model gives results much closer to the
experiments and similar to a full Reynolds Stress model (note that at the time of writing, the
GEKO model has not been run for this test case. However, the effect of the CC is mostly
independent of the underlying model formulation).
Figure 32: Hydrocyclone typical flow structure. Reproduced from Cullivan et al [9].
feed
overflow
underflow
heavier
particles
dragged
outwards
inner upward
and outer
downward
spirals
feed
overflow
underflow
heavier
particles
dragged
outwards
inner upward
and outer
downward
spirals
x [m]
Ta
ng
en
tio
na
lV
elo
city
[m/s
]
-0.02 -0.01 0 0.01 0.02-6
-4
-2
0
2
4
6
Exp 1
Exp 2
SST
SST-CC
RSM-SSG
Line 1, Z = - 20 mm 03 Jul 2007
x [m]
Ta
ng
en
tio
na
lV
elo
city
[m/s
]
-0.02 -0.01 0 0.01 0.02-6
-4
-2
0
2
4
6
Exp 1
Exp 2
SST
SST-CC
RSM-SSG
Line 2, Z = - 32 mm 03 Jul 2007

27
Figure 33: Time-averaged profiles of the tangentional velocity in the hydrocyclone.
Comparison with the experiments of Hartley [13].
3.7 The Blending Function
The blending function activates the coefficients CMIX/CJET. In order to avoid any impact
on boundary layers, the blending function is designed such that these parameters have only a
minor effect there. In most cases the users will not have to change the function FGEKO (in
Fluent it is called ‘Blending Function for GEKO’). However, there are several ways to modify
the function in case it is needed.
The easiest way is to adjust the coefficients exposed in the GUI. For fully turbulent flows
(no transition model) there is only one coefficient called CBF_TURB (GEKO). Increasing it
will increase the thickness of the near wall ‘shielding’ and decreasing it will decrease the
‘shielding’ from CMIX/CJET inside the boundary layer. This effect can be seen in Figure 34 for
the flow around a NACA 4412 airfoil. The lefts side of the figure shows the default setting
(CBF_TURB=2) and the right side the function for CBF_TURB=4. The thickness of the
boundary layer ‘shielding’ is clearly increased on the right part of the figure.
x [m]
Ta
ng
en
tio
na
lV
elo
city
[m/s
]
-0.01 0 0.01-6
-4
-2
0
2
4
6
Exp 1
Exp 2
SST
SST-CC
RSM-SSG
Line 3, Z = - 53 mm 03 Jul 2007
x [m]
Ta
ng
en
tio
na
lV
elo
city
[m/s
]
-0.01 -0.005 0 0.005 0.01-6
-4
-2
0
2
4
6
Exp 1
Exp 2
SST
SST-CC
RSM-SSG
Line 4, Z = - 73 mm 03 Jul 2007
x [m]
Ta
ng
en
tio
na
lV
elo
city
[m/s
]
-0.005 0 0.005-6
-4
-2
0
2
4
6
Exp 1
Exp 2
SST
SST-CC
RSM-SSG
Line 5, Z = - 117 mm 03 Jul 2007

28
There is a second coefficient for this function, which is a bit more involved. It is introduced
to allow protection of the laminar boundary layer from the CMIX/CJET term. This is desirable
in case of transition predictions [16], where otherwise the CMIX/CJET term can affect the
transition location. For this purpose, a second coefficient, CBF_LAM (GEKO) is used in case
a transition model is selected. The effect is shown in Figure 35. The left figure shows the
turbulent default (CBF_TURB=2.0, CBF_LAM=1.0 same as Figure 34 Left) and the right
part shows the increase to its default for transitional simulations (CBF_TURB=2.0
CBF_LAM=25.0). As can be seen from the right part of Figure 34, the coefficient CBF_LAM
provides increased shielding, especially in the leading edge region. In case of fully turbulent
settings (no transition model), users can only access CBF_TURB (CBF_LAM=1.0 is fixed
by default). The parameter CBF_LAM becomes available once a transition model is selected.
The coefficient CBF_LAM needs to always satisfy 𝐶𝐵𝐹_𝐿𝐴𝑀 ≥ 1.
Figure 34: Effect of CBF_TURB on FGEKO for flow around airfoil. Left CBF_TURB=2.0.
Right: CBF_TURB=4.0.
Figure 35: Effect of CBF_LAM on FGEKO for flow around airfoil. Left CBF_LAM=1.0
(default for turbulent simulations). Right: CBF_LAM=25 (default for transitional
simulations).
Finally, the function FGEKO can be adjusted through a User Defined Function (UDF). Users
can either over-write the function in the entire domain, or only in certain parts, as the original
function is accessible in the UDF. This could make sense in areas where free shear flows and
boundary layers cannot be easily discerned by the function itself, especially when CMIX is
increased to obtain more mixing in the free shear flow region.
An example of such a flow is shown in Figure 36 for a multi-element airfoil. Assume, the
wake of the slat (upstream airfoil) over the main airfoil is of interest. Assume that the default
settings provide not enough mixing in this region, hence an increased mixing through
increases in CMIX is desired. This works for moderate increases in CMIX, but large increases
(like CMIX=3) lead to decreasing efficiency of the CMIX term. The reason is that through
increases in the eddy-viscosity, the blending function becomes activated also in the wake, due
to the proximity of the main airfoil wall. This is shown in the middle part of Figure 36, where
one can clearly see the activation of the blending function in the wake of the slat. To counter
such an effect, one can over-write the blending function. In the current case, a function based

29
on wall-distance was used as shown in the right part of Figure 36. Note that this is just a
generic example to demonstrate the issues and no effort was made to optimize the bending
function. The effect of the change in the function FGEKO is seen in Figure 37 which shows the
ratio of turbulence to molecular viscosity for the blending functions and settings shown in
Figure 36. Clearly, the ratio increase from the left (default settings) to the middle picture.
However, the increase is moderate. When restricting the function FGEKO to the immediate
boundary layer around the main wing, the effect of increasing CMIX becomes much stronger,
resulting in a substantial increase in the viscosity ratio (Figure 37 – right).
It needs to be stressed again, that such modifications of FGEKO are typically not required
and the flexibility of provided by simply changing coefficients is sufficient in most cases.
However, the discussion shows the versatility of the current GEKO models implementation.
.
Figure 36: Blending function FGEKO for multi-element airfoil. Left: Default CSEP=1.75,
CMIX=CMixCor=0.303. Middle: CMIX=3. Right: FGEKO through UDF
Figure 37: Ratio of turbulence to molecular viscosity for multi-element airfoil. Left: Default
CSEP=1.75, CMIX=CMixCor=0.303. Middle: CMIX=3. Right: FGEKO through UDF
A more dramatic example of how the change in blending function can affect results is
given by the flow around a triangular cylinder. The set-up is shown in Figure 38.

30
Figure 38: Flow around triangular cylinder [37]
The cylinder has an edge length of 𝐿 = 0.04𝑚, the height of the channel is 𝐻 = 0.12𝑚.
The inlet velocity is 𝑈~16 𝑚/𝑠. The simulation is carried out in steady state mode – and
converges to a steady state solution (which is not always possible with bluff body flows). The
real flow is of course unsteady with strong vortex shedding in addition to turbulence created
unsteadiness. The vector field depicted shows a very large separation zone downstream of the
cylinder, as expected. The simulation was carried out with GEKO-1.75 (default) under steady-
state conditions.
In order to test by how much, the re-circulation zone can be reduced, the CMIX coefficient
was increased. The results are shown in Figure 39 when using the built-in version of the FGEKO
function. The recirculation (line in middle figure) decreases with increasing CMIX. However,
eventually, the entire separation zone lies within the FGEKO=1 region and no further effect can
be achieved by increasing CMIX.
Figure 39: GEKO-1.75 solution under variation of CMIX. Left: Velocity U. Middle: Eddy-
viscosity ratio. Right: FGEKO using built-in function [28]

31
The same tests are shown in Figure 40 but with the help of a UDF-based FGEKO function.
As shown in the right part of the figure, FGEKO is defined only within a given wall distance as
FGEKO=1 and is switched to free shear flow status outside. This avoids the restriction of the
impact of increasing CMIX and allows a further reduction in the re-circulation zone due to
increased mixing.
Figure 40: GEKO-1.75 solution under variation of CMIX. Left: Velocity U Middle: Eddy-
viscosity ratio. Right: FGEKO using UDF-based function [28]
The comparison with experimental data along the center-line downstream of the cylinder
is shown for both FGEKO variants in Figure 41. The left part of the figure shows the solution
using the built-in function for FGEKO and the right part shows the solution using a wall-
distance-based UDF variant (as shown in right part of Figure 40). Clearly, the UDF based
variant allows a much stronger reduction in separation size. It should be noted that none of
the simulations is able to produce the fairly strong backflow velocity in the re-circulation
zone. This should not come as a surprise, as it is mostly a result of very strong backflow events
in the unsteady vortex shedding cycle of the experiment, which cannot be captured by a steady
state solution. Nevertheless, it is important to observe the much better agreement in flow
recovery downstream of the recirculation zone. In case of more complex arrangements, any
additional parts of the geometry downstream of the triangular cylinder would see a much more
realistic approaching flow field than with the default settings.

32
Figure 41: Center line velocity for triangular cylinder. Left: GEKO-1.75 with built-in FGEKO
function. Right: GEKO-1.75 with UDF-based FGEKO function [28]
3.8 Other Special Coefficients
The realizability coefficient is set to its standard value of CREAL=0.577. The value should
typically not be changed but is accessible for special situations. However, it was found that
limiters can have a strong effect for flows which are severely under-resolved. An example
would be an inlet condition for the velocity field, where the velocity in the lower half of the
inlet has one value and in the upper half another. At the jump between these two values, the
flow is under-resolved and the coefficient CREAL could potentially delay the growth of the
mixing layer. Note that for such flows, the production limiter could have a similar effect. If
this is the case, it would be an option to set both limiters to very large values and instead
activate the Kato-Launder limiter.
The coefficient CNW_SUB allows for slight re-tuning of the log-layer shift which will
also affect the wall shear stress distribution for boundary layers. Increasing its value from
CNW_SUB=1.7 will shift the log-layer more into the laminar direction (up) and decrease the
wall shear stress.
4 Strategies for Model Optimization Most users are intimidated/scared of the prospect to modify turbulence model coefficients.
Part of the reason for this lies in the interconnectedness of coefficients in conventional
turbulence models, where any change to any coefficient can have detrimental effects even on
the simplest flows, like flat plate boundary layers (which users typically do not want to
modify). Still, a conservative attitude is also commendable for the GEKO model, even though
the effects of coefficient changes are much more predictable. The model should therefore only
be adjusted if other sources of error have been minimized (it is not always the turbulence
model’s fault if things do not match). In addition, modifications should be guided by
experimental data as far as possible.
4.1 GEKO Defaults
The defaults for the GEKO model have been selected to match the SST models
performance as closely as possible for the building block flows. Especially for boundary

33
layers, the defaults predict very close results to those of the SST model. The SST model is
used in many industrial CFD simulations already, so the default selected for the GEKO model
provides a fairly save conversion from SST to GEKO.
There is another ‘fix point’ in coefficient settings. With the combination CSEP=1.0,
CNW=1.0, which automatically sets CMIX=0.0 from the correlation CMixCor (note again that
CMIX=0.0 renders CJET passive, as it is a sub-model to CMIX). This setting is an exact
transformation of the standard k- model (except for the wall treatment and the realizability
limiter). Users who have used the k- model successfully in the past, are therefore advised to
use these settings.
Figure 42 shows a comparison of GEKO model settings for the NACA 4412 airfoil [32]
against their ‘reference’ model. Two model pairs are clearly visible (GEKO-1, RKE) and
(GEKO-175, SST) – each pair giving almost identical results.
Figure 42: Comparison of velocity profiles for flow around the NACA-4412 airfoil [32]
4.2 Optimizing Coefficients
CSEP
The most important coefficients for most applications is CSEP. It controls the separation
points/lines from smooth body-separation. In case the flow is dominated by boundary layers,
users should only modify this coefficient and explore if values within the range given by
Equation (2.10) are sufficient for obtaining improved results. Again, increasing CSEP will lead
to stronger/earlier separation. When changing CSEP one should in a first step keep all other
coefficients at their default values.
CNW
The coefficient CNW should only be changed if detailed near wall or surface information
needs to be matched and if this cannot be achieved by optimizing CSEP alone. The most
prominent example would be optimizations with respect to heat transfer coefficients or oil-
flow pictures from experiments. Increasing CNW will increase heat transfer and wall shear
stress levels in non-equilibrium regions.

34
CMIX
In some cases, standard settings (or models) under-estimate the turbulent mixing in free
shear flows. The coefficients CMIX will allow an adjustment under such scenarios. Increasing
CMIX will increase eddy-viscosity levels in such zones. It should be noted that this is only
possible within physical limits. E.g. in some cases, strong mixing is observed behind bluff
bodies. Such effects often result from vortex shedding and cannot be covered fully by a steady
state turbulence model run. However, increasing CMIX, can improve such situations relative
to default settings (see Figure 40). In case changes to CMIX do not show the desired influence,
it is advisable to check the blending function FGEKO. It should be recalled that CMIX is only
effective in regions where 𝐹𝐺𝐸𝐾𝑂 ≠ 1. In case, CMIX is de-activated by FGEKO in the region of
interest, modifications to the FGEKO function might be required.
CJET
The coefficient CJET is subtle. As the name implies it should only be considered when jets
are present in the domain. Regions with round jets should best be computed with 𝐶𝑆𝐸𝑃 =1.75 − 2.00 as otherwise the effect of CJET is not strong enough to achieve the desired effect.
In case these settings for CJET are not suitable in the entire domain, one can set these values
also locally through UDF access. For highly accurate jet simulations also set CJET_AUX
=4.0 (it activates the CJET function more aggressively).
In summary – for the free shear flows, the GEKO-1 model behaves like the underlying k-
model, with good spreading rates for the mixing layer and plane jet but an over-prediction
of spreading for the round jet. When increasing CSEP one also needs to adjust CMIX to maintain
proper spreading for the mixing layer. This is automatically achieved through a correlation
relating these two coefficients (CMIX=CMixCor). To avoid over-prediction of spreading rates for
jets, with increasing CMIX, the coefficient CJET is introduced. A value of CSEP=2 and CJET=0.9
provides correct asymptotic spreading for both, the round and the plane jet. In case stronger
mixing is required, the coefficient CMIX can be increased relative to its correlation value. In
some cases, it might even be desirable to modify the blending function FGEKO to obtain an
even stronger effect for mixing layers near walls (see 3.7).
CCORNER, CCURV
The coefficients CCORNER and CCURV are also available for other k- models. They can be
activated in combination with GEKO as required by the simulation.
Wall Distance Free
The GEKO model can also be run without a need for computing the wall distance. This is
desirable for cases with moving grids/geometries. If the ‘wall-distance-free’ option is selected
the coefficients CMIX/CJET are de-activated. In order to still achieve proper mixing layer
growth, set CSEP=1.
5 Summary A new RANS concept has been introduced. The new model is termed Generalize k-
model (GEKO). It is based on a k- model platform and is designed to consolidate RANS
turbulence models in ANSYS CFD. Instead of offering a wide range of different models, it is
the goal to provide a single model, with the flexibility to adjust it to a wide range of generic
flow conditions and applications.

35
Flexibility within GEKO is achieved by augmenting the model with free coefficients,
which can be adjusted by the user without the danger of violating the basic model calibration
for conventional free shear flows and boundary layers. This allows the user to tune the model
in a safe parameter space without the need for expert knowledge in turbulence modeling. In
other words, instead of switching between a large number of existing turbulence model to
find the optimal one for a given application, the user can now stay within one model
framework and simple adjust the free coefficients. The model is designed such that the
modification of the coefficients allows coverage of a wide solution space (actually a wider
space than by switching between existing models).
In addition to being able to adjust the model coefficients, GEKO offers the advantage that
the variation of coefficients is much more transparent than the change between different
models. By changing from one model to another (say from SST to k-) one does not only
switch the model but also numerous other settings (e.g. different limiters, different wall
treatment, …). Such changes might have an additional large effect on the solution without
being transparent to the user. Finally, not all options/extensions are compatible with all
turbulence models. Case in point is that models for laminar-turbulent transition are not
compatible with existing k- models. A k- model user who wants to add transition physics,
will therefore need to first switch to a k- model and then activate the transition model. It will
then be difficult to attribute solutions changes to any one of the two changes made in the
settings. Within GEKO, the user can make changes step by step and observe their impact on
the solution separately, as all options are (or will be made) available within this model
framework.
It is to be emphasized that users do not have to adjust coefficients. There are strong default
settings (similar to the SST model) and there are further recommendations for settings to
mimic other existing models like k-. It is however assumed that many simulation results can
significantly be improved by very few changes to the GEKO coefficients. For simple
geometries, a global optimization of the coefficients is typically sufficient. For more complex
application, where several different turbulence-related phenomena are included in one set-up,
the coefficients can be set via UDFs zonally. In the longer run, it can also be anticipated that
the free coefficients can be used for automatic optimization and Machine Learning.
6 Example UDFs This UDF overwrites the blending function FGEKO in regions where 𝑥 ≤ 2:
#include "udf.h"
DEFINE_KW_GEKO_BF(user_geko_bf, c, t)
{
real bf_value;
real xc[ND_ND];
C_CENTROID(xc,c,t);
if (xc[0] > 2.0)
bf_value = Get_Geko_Blending_Function (c, t,
C_R(c,t), C_MU_L(c,t), C_WALL_DIST(c,t),
C_K(c,t), C_O(c,t));
else
bf_value = 1.0;

36
return bf_value;
}
7 References
1. Albertson, M.L., Dai Y.B., Iensen, R.A. and Rouse H. (1948): "Diffusion of submerged jets", Proc. of
ASME, v.74.
2. Bachalo, W. D. and Johnson, D. A., (1986): "Transonic, Turbulent Boundary-Layer Separation Generated
on an Axisymmetric Flow Model," AIAA Journal, Vol. 24, No. 3, , pp. 437-443.
3. Bell, J. H. and Mehta, R. D., (1990): "Development of a two-stream mixing layer from tripped and untripped
boundary layers", AIAA J., vol. 28, no.12, pp. 2034-2042.
4. Bradbury, L.J.S., (1965): “The Structure of a Self-Preserving Plane Jet”, Journal of Fluid Mechanics Vol.
23, pp.31-64.
5. Buice, C.U. and Eaton, J.K., (2000): "Experimental Investigation of Flow Through an Asymmetric Plane
Diffuser", Journal of Fluids Engineering, Vol. 122, pp. 433-435. 96.
6. Cebeci, T. and Bradshaw, P., (1988): “Physical and Computational Aspects of Convective Heat Transfer”,
1st ed. 1984/2nd ed. 1988, Springer-Verlag.
7. Coles, D.E., and Hirst, E.A., Eds, (1969): "Computation of turbulent boundary layers- 1968 AFOSR-IFP-
Stanford Conference". Vol. 2, Stanford University, CA.
8. Cook, P.H., M.A. McDonald and M.C.P. Firmin, (1979): "Aerofoil RAE 2822 - Pressure Distributions, and
Boundary Layer and Wake Measurements," Experimental Data Base for Computer Program Assessment,
AGARD Report AR 138,
9. Cullivan, J.C. Williams. R.A., Dyakowski T. and Cross C.R., (2004): “New understanding of a
hydrocyclone flow field and separation mechanism from computational fluid dynamics”. Minerals
Engineering, Vol.17 No.5, 2004.
10. Driver, D.M., (1991): "Reynolds Shear Stress Measurements in a Separated Boundary Layer Flow", AIAA
22nd Fluid Dynamics, Plasma Dynamics and Laser Conference, AIAA-91-1787.
11. Durbin, P.A. and Reif, B.A., (2001): “Statistical Theory and Modeling for Turbulent Flows,” John Wiley
& Sons.
12. Durbin, P.A. (1991): "Near-wall turbulence closure modeling without ‘damping functions’". Theor.
Comput. Fluid Dyn. 3(1).
13. Hartley, C.D., (1994): “Measurement of flow velocities within a hydrocyclone using laser doppler
anemometry”, Technical Report FTN/X/82, AEA, Power Fluidics, BNFL
14. Jones W. P. and Launder B. E. (1972): “The Prediction of Laminarization with a Two-Equation Model of
Turbulence. Int. J. Heat Mass Transfer., 15:301–314.

37
15. Kato, M., and Launder, B.E., (1993): "The modelling of turbulent flow around stationary and vibrating
square cylinders". In Proc. Ninth Symposium on Turbulent Shear Flows, volume 9, page 10.4.1, Kyoto,
Japan.
16. Langtry, R.B. and Menter, F.R. (2009): “Correlation-Based Transition Modeling for Unstructured
Parallelized Computational Fluid Dynamics Codes”. AIAA J. 47(12), 2984-2906.
17. Mani, M., Babcock, D. A., Winkler, C. M., and Spalart, P. R., (2014): "Predictions of a Supersonic
Turbulent Flow in a Square Duct," AIAA Paper 2013-0860, January 2013.
18. Menter, F.R. (1994): "Two-equation eddy-viscosity turbulence models for engineering applications", AIAA
Journal, Vol. 32, No. 8, pp. 1598-1605.
19. Pope, S.B. (1978): "An explanation of the turbulent round-jet/plane-jet anomaly", AIAA Journal, Vol. 16,
No. 3, pp. 279-281.
20. Raiesi, H., Piomelli and U., Pollard, A. (2011): “Evaluation of Turbulence Models Using Direct Numerical
and Large-Eddy Simulation Data”. Journal of Fluids Engineering, v.133, No.2, 021203 (10 pp.).
21. Skare, P. E., and Krogstad, P., (1994): “A Turbulent Equilibrium Boundary Layer Near Separation," J. Fluid
Mech., 272, pp. 319–348.
22. Smirnov P. E. and Menter F. R., (2008): "Sensitization of the SST Turbulence Model to Rotation and
Curvature by Applying the Spalart-Shur Correction Term". ASME Paper GT 2008-50480. Berlin, Germany.
23. Somers, D. M. (1997): “Design and Experimental Results for the S805 airfoil”, NREL/SR-440-6917
24. Somers, D. M. (2005): “Design and Experimental Results for the S825 Airfoil”, NREL/SR-500-36346
25. Somers, D. M. (1997): “Design and Experimental Results for the S809 Airfoil”, NRELSR-440-6918.
26. Somers, D. M. (1997): “Design and Experirltental Results for the S814 airfoil”, NREL/SR-440-6919.
27. Spalart P. R. and Shur M. L, (1997): "On the Sensitization of Turbulence Models to Rotation and
Curvature". Aerospace Sci. Tech. 1(5). 297–302.
28. Sjunnesson, A. Nelsons C. and Max E., (1991): “LDA measurement of velocities and turbulence in a bluff
body stabilized flame”. Volvo Flygmotor AB, Trollhattan
29. Timmer W. A. and van Rooij R. P. J. O. M. (2003): “Summary of the Delft University Wind Turbine
Dedicated Airfoils”, AIAA Paper, 2003-0352
30. Van der Hegge Zijnen B.G., (1959): "Measurement of turbulence in a plane jet of air by the diffusion method
and by hot-wire method". Appl. Sci. Res., S.A., vol.7, No. 4.
31. Vogel, J.C. and Eaton, J.K., (1985): "Combined Heat Transfer and Fluid Dynamic Measurements
Downstream of a Backward-Facing Step", Vol. 107, Journal of Heat Transfer, pp. 922 – 929.
32. Wadcock, A. J. (1987): “Investigation of Low-Speed Turbulent Separated Flow Around Airfoils”, NASA
Contractor Report 177450
33. Wilcox, D.C. (2006): Turbulence Modeling for CFD, DCW Industries Inc., 3rd. Edition.
34. Wilcox, D.C, (2007): "Formulation of the k- Turbulence Model Revisited", AIAA Paper 2007-1408.
35. Wolfshtein. M. (1969): "The Velocity and Temperature Distribution of One-Dimensional Flow with
Turbulence Augmentation and Pressure Gradient". Int. J. Heat Mass Transfer. 12. 301–318.

38
36. Wygnanski, I. and Fiedler, H.E., (1968): “Some Measurements in the Self-Preserving Jet”, Boeing Scientific
Research Labs, Document D1-82-0712.