best practices for school improvement planning - … the following report, hanover research outlines...
TRANSCRIPT

In the following report, Hanover Research outlines best practices for school and continuous
improvement planning, focusing on organizational components and methods for
assessment and measurement. In addition, Hanover identifies and describes four effective
models for school improvement.
Best Practices for School Improvement Planning
October 2014

Hanover Research | October 2014
© 2014 Hanover Research | District Administration Practice 2
TABLE OF CONTENTS
Executive Summary and Key Findings ................................................................................ 3
KEY FINDINGS ............................................................................................................................. 3
Section I: Essential Components of a School Improvement Plan ......................................... 5
SCHOOL IMPROVEMENT FUNDAMENTALS ......................................................................................... 5
THE SCOPE OF SCHOOL IMPROVEMENT PLANNING ............................................................................. 6
Comprehensive Needs Assessment ................................................................................... 7
Prioritization Of Needs .................................................................................................... 10
SETTING GOALS – SELECTING TARGETS, INDICATORS, AND MILESTONES ............................................... 11
Goal Composition ............................................................................................................ 11
Goal Timelines ................................................................................................................. 12
EFFECTIVE ORGANIZATIONAL PRACTICES ........................................................................................ 12
School Principals .............................................................................................................. 12
School Improvement Groups ........................................................................................... 13
District Taskforces ............................................................................................................ 13
Section II: Implementation, Measurement, and Assessment ............................................ 15
DATA COLLECTION – HOW IS SCHOOL IMPROVEMENT MEASURED? ..................................................... 15
Student Learning .............................................................................................................. 16
Demographics .................................................................................................................. 19
School Environment ......................................................................................................... 20
Implementation ............................................................................................................... 21
ONGOING ASSESSMENT AND DATA‐DRIVEN DECISION‐MAKING ......................................................... 21
COMMUNICATION WITH STAKEHOLDERS ........................................................................................ 23
Section III: Review of Improvement Models ..................................................................... 24
DAGGETT SYSTEM FOR EFFECTIVE INSTRUCTION ............................................................................... 24
RESULTS‐ORIENTED CYCLE OF INQUIRY .......................................................................................... 26
BALANCED SCORECARD MODEL ................................................................................................... 27
MASSACHUSETTS DEPARTMENT OF EDUCATION THEORY OF ACTION MODEL ......................................... 28
Appendix A: Comprehensive Needs Assessment Rubric ................................................... 29

Hanover Research | October 2014
© 2014 Hanover Research | District Administration Practice 3
EXECUTIVE SUMMARY AND KEY FINDINGS In the following report, Hanover Research examines school improvement and continuous improvement planning processes in K‐12 education, identifying the most essential components according to best practices research and well‐tested models. For example, these essential components include an initial needs assessment, data‐driven decision‐making, and feasible goals and benchmarks, among other elements. Hanover also examines effective methods for structuring school and district leadership during school improvement initiatives, as well as instruments for monitoring improvement according to academic achievement, behavior, and social‐emotional learning (SEL) indicators. Lastly, Hanover identifies and describes effective improvement models. This report comprises the following sections:
Section I: This section outlines essential components of school improvement and continuous improvement plans, as identified across various best practices reports and improvement models
Section II: This section examines best practices for implementing, measuring, and assessing school improvement across a variety of metrics
Section III: This section reviews exemplary improvement models, as identified by school improvement experts and best practices research
In addition to synthesizing various secondary sources, Hanover Research conducted interviews with two school improvement experts:
Catherine Barbour, Principal Turnaround Consultant, Education Program, American Institutes for Research1
Nicole Norton, Director, Funded Programs and School Improvement, Minneapolis Public Schools2
KEY FINDINGS
Effective school improvement planning models emphasize comprehensive needs assessments, strategic prioritization of needs, and data‐driven decision‐making. Experts and scholarly research identify the following evidence‐based models:
o Daggett System for Effective Instruction
o Results‐Oriented Cycle of Inquiry
o Balanced Scorecard Model
1 Telephone interview with Catherine Barbour, Principal Turnaround Consultant, Education Program, American
Institutes for Research, July 11, 2014. 2 Telephone interview with Nicole Norton, Director, Funded Programs and School Improvement, Minneapolis Public
Schools, July 17, 2014.

Hanover Research | October 2014
© 2014 Hanover Research | District Administration Practice 4
o Massachusetts Department of Education Theory of Action Model
Districts should initiate school improvement planning with a comprehensive needs assessment in order to systematically determine high‐need areas. The needs assessment should incorporate both quantitative and qualitative data, include analyses of both internal and external variables, and explicitly link results with student learning. Additionally, some experts suggest using a third‐party to conduct the assessment in order to ensure objectivity.
Districts should organize school‐level and district‐level taskforces to design, implement, and track improvement efforts. These groups should comprise representatives from all groups affected by the improvement efforts, including administrators, teachers, and curriculum directors. Teams should be no larger than 12‐15 people. At the district level, experts emphasize that the primary focus of leadership teams should be supporting schools in these efforts, rather than compliance.
Following a comprehensive needs assessment, district leaders must establish rigorous yet attainable goals. Setting exceptionally lofty goals may ultimately demoralize key actors and stakeholders. As such, experts recommend “starting slow” and leaving room for goals to be adjusted upward later. Experts also suggest that goals be aligned with the district’s calendar year and divided into small increments, enabling implementers to effectively track progress.
Districts should use four primary types of data to evaluate school improvement: student learning, demographics, school environment, and implementation fidelity. To assess student learning, districts should examine data on standardized tests, curriculum delivery, social and emotional learning, attendance, and other variables. Additionally, demographic data allow decision‐makers to form a thorough understanding of school subpopulations, including special education students. Districts typically monitor school environment by using student, teacher, and parent climate surveys. Lastly, tracking the fidelity of implementation enables districts to determine if planned processes and goals actualize.
Throughout the school improvement process, district leaders should communicate objectives, progress, and results with all relevant stakeholders. Experts note that districts can build momentum by announcing “quick wins” when data indicate early success. However, stakeholders should expect initial improvement slumps, and should be cautious when adjusting original objectives and strategies.

Hanover Research | October 2014
© 2014 Hanover Research | District Administration Practice 5
SECTION I: ESSENTIAL COMPONENTS OF A
SCHOOL IMPROVEMENT PLAN In the following section, Hanover Research outlines essential components of school improvement and continuous improvement planning gleaned from best practices research, improvement models, and expert interviews.
SCHOOL IMPROVEMENT FUNDAMENTALS
Before exploring general best practices, Hanover first defines the primary goals behind school improvement planning and the major components that it comprises. This definition is used to anchor findings and recommendations presented throughout the report. Research and expert interviews define school improvement and continuous improvement planning as a systematic way of planning school improvement and tracking it over time.3 According to one definition, a school improvement plan is a “road map that sets out the changes a school needs to make to improve the level of student achievement, and shows how and when these changes will be made.”4 A different explanation adds that school improvement involves “quality improvement,” which it defines as “the disciplined use of evidence‐based quantitative and qualitative methods to improve the effectiveness, efficiency, equity, timeliness, or safety of service delivery processes and systems.”5 As districts engage in school improvement and continuous improvement planning processes, they must embed this concept of quality improvement into the daily activities and tasks of its various actors. According to the definitions outlined above, school improvement and continuous improvement are distinct from processes such as institutional research and audits, as they aim to reduce the gap between a school’s current level of performance and its actual potential.6 However, research suggests that school districts often fall short of this active improvement process when designing and implementing their own plans. For instance, many districts publish annual strategic plans that are defined as “improvement plans” but are inconsistent with the actual definition of school and continuous improvement. That is,
3 [1] Telephone interview with Catherine Barbour, Op. cit. [2] “School Improvement Planning: A Handbook,” Education Improvement Commission – Ontario Ministry of
Education, 2000, p. 6. http://www.edu.gov.on.ca/eng/document/reports/sihande.pdf [3] Park, S., et al., “Continuous Improvement in Education,” Carnegie Foundation for the Advancement of Teaching,
2013, p. 6. http://www.carnegiefoundation.org/sites/default/files/carnegie‐foundation_continuous‐improvement_2013.05.pdf
[4] “North Carolina School Improvement Planning Implementation Guide,” North Carolina Department of Public Instruction, September, 2013, p. 18. http://www.ncpublicschools.org/docs/councils/lea/previous/templates/sip‐guide.pdf
4 “School Improvement Planning: A Handbook,” Op. cit., p. 6. 5 Park, S., et al., Op. cit., p. 4. 6 Ibid.

Hanover Research | October 2014
© 2014 Hanover Research | District Administration Practice 6
many districts draft plans that focus heavily on measuring outcomes but ignore actual processes for improvement, the means for measuring system outcomes, and how all of these processes may actually function across a district.7 To counteract this potential pitfall, experts advise school districts to draft highly specific plans that focus on what tasks will be accomplished and who will accomplish them.8 Therefore, school improvement involves integrating quality improvement into the daily work of individuals within a school district system.9 That is, districts should avoid speaking in vague terms, such as “[w]e will roll out professional learning communities by subject area,” and opt for more defined action items.10 At the same time, however, some experts fear that district improvement plans have become increasingly complicated. They argue that this shift has demoralized district employees and other stakeholders in ways that have ultimately stifled academic achievement and growth.11 The debate regarding the sophistication and specificity required for effective school improvement, coupled with the potential to overwhelm implementers and muddle results, indicates that particular attention should be paid to scope when districts are designing school improvement models.
THE SCOPE OF SCHOOL IMPROVEMENT PLANNING
Districts should determine the scope of school improvement initiatives during the initial phases of the planning process, before tasks are delegated to key implementers. This process is two‐fold: identifying areas for improvement and prioritizing these issue areas.12 The former component is a relatively straightforward process in which a district identifies all of its problem areas. However, the latter component, prioritizing these issue areas, requires a strategic mindset among district decision‐makers. For this process, the value of focus is well‐established, and research suggests that including extensive lists of priority areas within a school improvement plan can weaken the energy of the school. Consequently, experts recommend that districts target two to five priorities within a school improvement plan.13 Ms. Catherine Barbour, a Principal Turnaround Consultant at the American Institutes for Research, stresses a “less is best” policy:
7 Ibid, p. 6. 8 [1] Telephone interview with Catherine Barbour, Op. cit. [2] “School Improvement Planning: A Handbook,” Op. cit., p. 6. 9 Park, S., et al., Op. cit., p. 5. 10 Ibid, p. 6. 11 Schmoker, M., “Why Make Reform So Complicated?” Education Week, January 15, 2014.
http://www.edweek.org/ew/articles/2014/01/15/17schmoker_ep.h33.html?qs=school+improvement+planning 12 [1] “North Carolina School Improvement Planning Implementation Guide,” Op. cit., p. 18. [2] Telephone interview with Catherine Barbour, Op. cit. [3] “School Improvement Planning: A Handbook,” Op. cit., p. 20. 13 [1] Ibid. [2] Telephone interview with Catherine Barbour, Op. cit. [3] “High School Improvement Process,” National High School Center at the American Institutes for Research.
http://www.betterhighschools.org/eight/process.asp#sip3

Hanover Research | October 2014
© 2014 Hanover Research | District Administration Practice 7
Part of the initial process is prioritizing the many identified needs and findings into two or three high‐need, high‐impact areas and then ensuring that the district stays focused on those identified areas. Districts are tempted to add on additional objectives, but they should avoid doing so. You’re not going to be able to address every area that has been identified; it is impossible to track and monitor that.14
Ignoring certain issue areas for the sake of remaining focused may prove difficult for districts. However, research suggests that the continuous improvement process ultimately allows districts to address all issue areas over time. That is, as objectives are met each year, districts can revise annual plans and introduce new targets into their improvement efforts.15 Ms. Barbour adds that districts should view these improvement components as phases, in which new issue areas are addressed each year. Under this repeated system, demonstrated success in initial objectives can catalyze gains in other improvement areas.16
COMPREHENSIVE NEEDS ASSESSMENT
As stated above, the school improvement planning process involves defining a school’s performance problems. Some researchers and theorists suggest that this task is best accomplished organically. Meaning, decision‐makers should rely on implicit beliefs and interpretations of strategies and outcomes that influence behavior.17 However, Ms. Barbour and others argue that a comprehensive needs assessment must precede any school improvement planning process.18 According to the U.S. Department of Education, a comprehensive needs assessment is a systematic method for determining needs and examining their nature and causes.19 Several popular school improvement models contain a comprehensive needs assessment, including the Breaking Ranks Comprehensive Framework for School Improvement and the Massachusetts Department of Education Office of District and School Turnaround model. As such, this component is an essential element of the planning process.20
14 Telephone interview with Catherine Barbour, Op. cit. 15 “North Carolina School Improvement Planning Implementation Guide,” Op. cit., p. 18. 16 Telephone interview with Catherine Barbour, Op. cit. 17 [1] O'Day, J.A., “Standards‐based reform and low‐performing schools: A case of reciprocal Accountability,” 2005, in
F.M. Hess (Ed.), Urban school reform: Lessons from San Diego, pp. 115‐137, found in: Le Floch, K.C., et al., “Case Studies of Schools Receiving School Improvement Grants: Findings After the First Year of Implementation,” U.S. Department of Education, May 2014, p. 44. http://ies.ed.gov/ncee/pubs/20144015/pdf/20144015.pdf
[2] Zuckerman, M., “Attribution of success and failure revisited, or: The motivational bias is alive and well in attribution theory,” Journal of Personality, 2006, pp. 245‐287. http://onlinelibrary.wiley.com/doi/10.1111/j.1467‐6494.1979.tb00202.x/abstract
18 [1] Telephone interview with Catherine Barbour, Op. cit. [2] “North Carolina School Improvement Planning Implementation Guide,” Op. cit., p. 17. [3] Le Floch, K.C., et al., Op. cit., p. 44. 19 “Comprehensive Needs Assessment,” U.S. Department of Education, 2001.
http://www2.ed.gov/admins/lead/account/compneedsassessment.pdf 20 [1] “A Continuous Cycle of Improvement,” Massachusetts Office of District and School Turnaround: Theory of
Action. http://www.doe.mass.edu/apa/sss/turnaround/ODST‐theory.pdf [2] “School Improvement,” Breaking Ranks, National Association of Secondary School Principals.
http://www.nassp.org/School‐Improvement

Hanover Research | October 2014
© 2014 Hanover Research | District Administration Practice 8
Ms. Barbour specifies that a comprehensive needs assessment is the foundation of any strong improvement plan.21 The North Carolina Department of Public Instruction (NCDPI) agrees, arguing that a “thorough, unrelenting” assessment of a school allows for a necessary baseline for reform.22 Comprehensive needs assessments should accomplish or adhere to the following:
Focus on student learning: all aspects of the review should ultimately relate back to student learning and the impact of instruction, rather than the mechanics of teachers’ practices and actions.23
Hire/recruit third‐party organizations: Ms. Barbour argues that, when schools conduct their own needs assessments, they are not as objective as they should be. As a solution, she recommends recruiting the state education agency or a third‐party vendor to conduct the assessment. If this external assessment is cost‐prohibitive, districts should take care to remain as objective as possible during the assessment process.24
Include an internal review: the internal component of the assessment should include school data analysis, an instructional review, and a school processes/procedures review. In addition, districts should assess their own capacity to support a school improvement initiative implementation.25
Include an external review: districts should assess external factors, such as pressing topics in the education community, new educational technologies, recent education legislation, union presence, and labor supply.26
Incorporate both quantitative and qualitative data: by examining multiple types of data, districts can triangulate their analyses to ensure accuracy.27
While each needs assessment’s components and structure will vary by district, several models for this procedure currently exist that offer basic frameworks for districts to adapt. Noteworthy examples of comprehensive needs assessment frameworks are outlined below.28
21 Telephone interview with Catherine Barbour, Op. cit. 22 “North Carolina School Improvement Planning Implementation Guide,” Op. cit., p. 17. 23 Ibid. 24 Telephone interview with Catherine Barbour, Op. cit. 25 [1] “North Carolina School Improvement Planning Implementation Guide,” Op. cit., p. 17. [2] Le Floch, K.C., et al., Op. cit., p. 104 26 [1] Ibid. [2] “North Carolina School Improvement Planning Implementation Guide,” Op. cit., p. 17. 27 Ibid. 28 Needs assessment frameworks selected based on recommendation from: Telephone interview with Catherine
Barbour, Op. cit.

Hanover Research | October 2014
© 2014 Hanover Research | District Administration Practice 9
Cambridge Education – Comprehensive Needs Assessment Model
The Cambridge Education comprehensive needs assessment model, used by Charlotte‐Mecklenburg Schools, among other districts, comprises five overarching categories, called “dimensions.” In total, these dimensions include fourteen separate components of school performance.29 Figure 1.1 below outlines these aspects of the Cambridge Education needs assessment model, while Appendix A includes an example of one portion of a completed assessment.
Figure 1.1: Cambridge Education Comprehensive Needs Assessment Model
DIMENSION SUB‐DIMENSION
Instructional Excellence and Alignment
(Part I: Teaching and Learning)
1. High Expectations Communicated to All Teachers and Students 2. Curriculum and Instructional Alignment
Instructional Excellence and Alignment
(Part II: Support for Student Achievement)
3. Data Analysis and Instructional Planning 4. Student Support Services
Leadership Capacity 5. Strategic Planning, Mission, and Vision 6. Distributed Leadership and Collaboration 7. Monitoring Instruction in School
Professional Capacity 8. Teacher Quality and Experience 9. Quality of Professional Development 10. Talent Recruitment and Retention
Planning and Operational Effectiveness
11. Resource Allocation 12. Facilities and Technology
Families and Communities 13. Family Engagement 14. Community Engagement
Source: NCDPI30
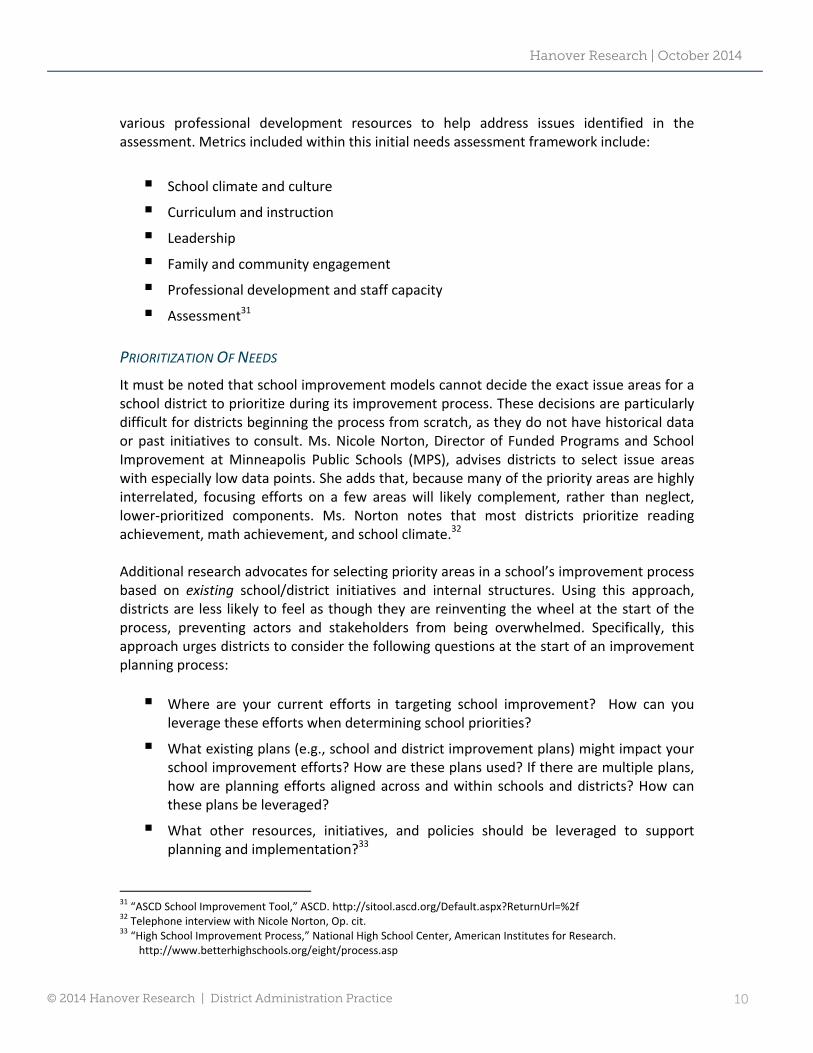
Association for Supervision and Curriculum Development – Needs Assessment Tool The Association for Supervision and Curriculum Development (ASCD) provides a free, online school improvement tool that allows schools and school systems to conduct a comprehensive needs assessment. The tool also allows district leaders to compare schools within their school systems. Based on individual results, districts are then referred to
29 [1] “School Quality Review – Notes of Guidance for Schools and Reviewers,” Charlotte‐Mecklenburg Schools,
August, 2009. http://www.cms.k12.nc.us/cmsdepartments/accountability/cfsi/Documents/SQR%20Notes%20of%20Guidance.pdf
[2] “North Carolina School Improvement Planning Implementation Guide,” Op. cit., p. 54. 30 Ibid., p. 53.
Hanover Research | October 2014
© 2014 Hanover Research | District Administration Practice 10
various professional development resources to help address issues identified in the assessment. Metrics included within this initial needs assessment framework include:
School climate and culture
Curriculum and instruction
Leadership
Family and community engagement
Professional development and staff capacity
Assessment31
PRIORITIZATION OF NEEDS
It must be noted that school improvement models cannot decide the exact issue areas for a school district to prioritize during its improvement process. These decisions are particularly difficult for districts beginning the process from scratch, as they do not have historical data or past initiatives to consult. Ms. Nicole Norton, Director of Funded Programs and School Improvement at Minneapolis Public Schools (MPS), advises districts to select issue areas with especially low data points. She adds that, because many of the priority areas are highly interrelated, focusing efforts on a few areas will likely complement, rather than neglect, lower‐prioritized components. Ms. Norton notes that most districts prioritize reading achievement, math achievement, and school climate.32 Additional research advocates for selecting priority areas in a school’s improvement process based on existing school/district initiatives and internal structures. Using this approach, districts are less likely to feel as though they are reinventing the wheel at the start of the process, preventing actors and stakeholders from being overwhelmed. Specifically, this approach urges districts to consider the following questions at the start of an improvement planning process:
Where are your current efforts in targeting school improvement? How can you leverage these efforts when determining school priorities?
What existing plans (e.g., school and district improvement plans) might impact your school improvement efforts? How are these plans used? If there are multiple plans, how are planning efforts aligned across and within schools and districts? How can these plans be leveraged?
What other resources, initiatives, and policies should be leveraged to support planning and implementation?33
31 “ASCD School Improvement Tool,” ASCD. http://sitool.ascd.org/Default.aspx?ReturnUrl=%2f 32 Telephone interview with Nicole Norton, Op. cit. 33 “High School Improvement Process,” National High School Center, American Institutes for Research.
http://www.betterhighschools.org/eight/process.asp

Hanover Research | October 2014
© 2014 Hanover Research | District Administration Practice 11
Lastly, when setting priorities for school improvement, Ms. Norton indicates that many schools may need to accommodate state, federal, and district requirements. For example, MPS must adhere to Title I requirements within its continuous improvement plan. As districts carry out their improvement planning processes, they should consider such external factors if applicable.34
SETTING GOALS – SELECTING TARGETS, INDICATORS, AND MILESTONES
As a corollary to the identification of its most pressing needs, a district must set clear goals to address these issue areas throughout the improvement planning process. Before outlining the specific components recommended for inclusion within a district’s improvement planning, Hanover presents recommendations for developing clear, appropriate goals. This process often proves challenging for many districts because goals must walk the line between unattainable and undemanding. Under the former conditions, schools may demonstrate too little improvement, leaving actors and stakeholders demoralized. Conversely, easy‐to‐reach goals may undermine a district’s improvement efforts by not fully motivating teachers, students, and staff.35 Inevitably, a district engaged in the improvement planning process must set goals for each of its priority areas. At this point, decision‐makers should consider the content of goals, as well as the timeline to completion.36
GOAL COMPOSITION
Across the board, experts and secondary research suggest that improvement goals should be rigorous yet attainable. If goals are set too high, districts may find that improvement does not materialize and that stakeholders perceive efforts to be failures. Conversely, goals set too low typically fail to catalyze adequate improvement. 37 Targets should present a challenge, but those challenges should be reasonable. As districts navigate these decisions, research suggests that goals should ultimately err on the side of not being challenging enough: “it is better to start slow. If the strategies implemented to achieve a goal work well and the target begins to appear too low, it can always be adjusted upward later.” 38 Ms. Barbour defends this policy, stressing that low morale among key actors can have a negative impact on a school’s improvement.39
34 Telephone interview with Nicole Norton, Op. cit. 35 Kutash, J., et al., “The School Turnaround Field Guide,” FSG Social Impact Advisors and The Wallace Foundation,
September 2010, p. 16. http://wallacefoundation.org/knowledge‐center/school‐leadership/district‐policy‐and‐practice/Documents/The‐School‐Turnaround‐Field‐Guide.pdf
36 [1] Telephone interview with Catherine Barbour, Op. cit. [2] “School Improvement Planning: A Handbook,” Op. cit., p. 42. 37 Kutash, J., et al., Op. cit., p. 16. 38 “School Improvement Planning: A Handbook,” Op. cit., p. 42. 39 Telephone interview with Catherine Barbour, Op. cit.

Hanover Research | October 2014
© 2014 Hanover Research | District Administration Practice 12
GOAL TIMELINES
For all types of improvement goals, the NCDPI advises districts to structure long‐term goals to contain short‐term interim goals. In addition, it suggests that these goals be aligned with district calendars and that an entire school year be devoted to the planning process.40 Ms. Barbour agrees, arguing that goals should first be set for a school year’s end but divided and back‐mapped by school quarter, month, and even week, if possible. She adds that this type of planning makes goals much more actionable, allowing schools to better identify reasonable steps needed to hit end‐of‐the‐year targets.41 Research shows that schools can be “turned around” within two to four years, with improvement in school environment and culture occurring within two years and improvement in student performance occurring by year two or three.42 As districts map out their improvement goals, considering these schedule‐related suggestions and findings may lead to more realistic, impactful targets.
EFFECTIVE ORGANIZATIONAL PRACTICES
By one account, the education sector has been slower to adopt continuous improvement than other types of organizations because “districts are not organized in ways that promote continuous learning.” Some argue that because districts are structured more like learning “silos” rather than integrated systems, it is more challenging for improvement initiatives to affect each school.43 Here, Hanover Research presents effective ways to organize site‐based and central office teams to lead school improvement efforts.
SCHOOL PRINCIPALS
Perhaps one of the most visible positions during the improvement process, a school principal plays multiple roles within a school’s organization. A principal is tasked with engaging and managing staff, leading and monitoring curriculum delivery, effectively allocating resources, and responding to the demands of external stakeholders. Because a principal’s influence extends throughout many school functions, this role has proven to be especially important during the improvement process. Consequently, districts should pay close attention to the quality of principals during the early stages of continuous improvement and beyond.44 Best practices research identifies the following leadership qualities as essential for principals to effectively execute the improvement process:
Transformational: an ability to motivate and engage staff behind a strong organizational vision
40 “North Carolina School Improvement Planning Implementation Guide,” op. cit., p. 17. 41 Telephone interview with Catherine Barbour, Op. cit. 42 Kutash, J., et al., Op. cit., p. 17. 43 Park, S., et al., Op. cit., p. 7. 44 Le Floch, et al., Op. cit., p. 51.

Hanover Research | October 2014
© 2014 Hanover Research | District Administration Practice 13
Instructional: knowledgeable about instructional issues and able to align school activity to improve instruction
Strategic: able to formulate strategy and translate that into concrete priorities45
In general, research shows that principals that exude one of the qualities outlined above are more likely to rate high among the other two traits as well. Not indicative of a principal’s ranking on these scales, however, is his or her experience. That is, new principals are just as likely to possess these three traits and effectively execute continuous improvement as more tenured principals.46 At the same time, case study research within the U.S. Department of Education’s School Improvement Grant comprehensive report suggests that replacing a school’s principal at the start of a continuous improvement initiative signals a symbolic change in a school’s status quo that often helps catalyze positive results. 47 Though controversial, this practice may offer districts a means of ensuring that effective leadership is in place for continuous improvement.
SCHOOL IMPROVEMENT GROUPS
While principals represent one major component of school improvement leadership, experts suggest that distributing leadership across a school also helps to facilitate implementation. This practice ensures a collaborative culture and can ultimately increase buy‐in among key actors and stakeholders. Under this system, “school improvement groups” collaborate to better understand school problems and assess needs, set priorities for improvement, and select opportunities for making change. This practice also ensures that diverse perspectives and experiences are incorporated into improvement strategy.48 This common practice of distributing improvement leadership involves building task forces that include key stakeholders from various internal departments. Ms. Barbour suggests that leadership groups be representative of who is going to be part of implementing a plan in order to ensure commitment, buy‐in, and investment. Ms. Norton agrees, noting that each of MPS’s schools has an instructional leadership team comprising the principal, assistant principal, and teacher leaders that share responsibility for the school improvement monitoring and implementation process. Research confirms this theory, stating that teachers, parents, and community members should be included in the planning and implementation phases.49
DISTRICT TASKFORCES
Principles for organizing at the school level also apply to the district level, as experts and research suggest setting up improvement taskforces at this higher level. Just as with schools, these taskforces should be composed of various stakeholders within the district
45 Ibid. 46 Ibid., p. 52. 47 Ibid. 48 “North Carolina School Improvement Planning Implementation Guide,” Op. cit., p. 18. 49 “School Improvement Planning: A Handbook,” Op. cit.

Hanover Research | October 2014
© 2014 Hanover Research | District Administration Practice 14
rather than just the superintendent and his/her cabinet. Ms. Barbour explains this practice further:
We encourage our districts to set up monitoring or steering committees at the district level. These groups contain principals, Title I directors, curriculum council members, special education directors, and key teacher leaders. This group should meet on a fairly periodic basis to make course corrections and data‐based decisions and then actively communicate those changes back out to schools.50
Ms. Norton’s advice echoes Ms. Barbour, and she further stresses that these leadership teams should be representative of a district and responsible for communicating changes to schools.51 Experts also advise that district taskforces take on a role of support throughout the planning and implementation phases. Ms. Norton likens this approach to a caseload management model in which schools receive ongoing support from the leadership body, often in the form of site visits and training sessions. Ms. Barbour further explains that, for this culture of support to take shape, district leadership teams need to undergo a paradigm shift in which they view their function as support rather than compliance. “This is easier said than done,” she adds, “as the central leadership team will feel the pressure of needing to reach certain goals on time.”52 Ms. Barbour suggests that district leadership teams comprise 8 to 12 individuals. This is consistent with recommendations from Learning Point Associates, which states that “teams of 15 or fewer people are most effective.”53 In addition, some models recommend the use of external change management organizations (CMOs) for additional support, though no consensus exists regarding their effectiveness in facilitating the improvement process.54
50 Telephone interview with Catherine Barbour, Op. cit. 51 Telephone interview with Nicole Norton, Op. cit. 52 [1] Ibid. [2] Telephone interview with Catherine Barbour, Op. cit. 53 [1] Ibid. [2] “Guide to Using Data in School Improvement Efforts,” Learning Points Associates, December, 2004, p. 7.
http://www.learningpt.org/pdfs/datause/guidebook.pdf 54 Le Floch, et al., Op. cit., p. 104.

Hanover Research | October 2014
© 2014 Hanover Research | District Administration Practice 15
SECTION II: IMPLEMENTATION, MEASUREMENT, AND ASSESSMENT While continuous improvement is deeply embedded in for‐profit organizations across the manufacturing, business, and healthcare sectors, the field of education has been slower to adopt formal methodologies. Research cites infrequent and ineffective use of data when explaining districts’ struggle to successfully execute and sustain improvement and continuous improvement models.55 In fact, the very act of measuring and monitoring improvement efforts causes stakeholders and actors to feel more invested in the initiative, even if explicit compensation incentives are not tied to reaching targets.56 In this section, Hanover outlines best practices for implementing, measuring, and assessing school improvement across a variety of metrics. Hanover first details the criteria commonly used for tracking school improvement and then provides well‐tested tools for measuring growth along these categories throughout a plan’s rollout and beyond.
DATA COLLECTION – HOW IS SCHOOL IMPROVEMENT MEASURED?
As expected, the specific types of data collected and emphasized during the school improvement process largely depend on districts’ comprehensive needs assessments and top identified priorities. Ms. Norton recommends using an online data collection tool such as MPS’s internally developed program. These tools allow schools to customize their collection of data points as well as to adhere to district‐level mandates.57 While many models and districts regard student achievement as the primary indicator of success, district leaders should use several additional metrics to form a comprehensive perspective.58 As Figure 2.1 below indicates, common criteria for school improvement fall under four categories: student learning, implementation, demographics, and school environment. These categories should be viewed as fluid, given that each school improvement model uses specific criteria slightly differently or uses them to track more than one outcome. For example, demographic data used with absenteeism can help measure school environment and student learning.59 Nevertheless, this classification system does provide a logical framework for understanding how districts and school improvement models measure improvement. The following pages explain each of these metrics and their related subcomponents, as well as best practices for tracking them during a school improvement process.
55 Park, S., et al., Op. cit., p. 7. 56 Kaplan, R. and Miyake, D., “The Balanced Scorecard,” The School Administrator, Vol. 67, No. 2, February ,2010, pp.
10 – 15. http://www.aasa.org/SchoolAdministratorArticle.aspx?id=11784 57 Telephone interview with Nicole Norton, Op. cit. 58 [1] Telephone interview with Catherine Barbour, Op. cit. [2] “Guide to Using Data in School Improvement Efforts,” Learning Points Associates, December, 2004, p. 4.
http://www.learningpt.org/pdfs/datause/guidebook.pdf [3] Kutash, J., et al., Op. cit., p. 15. 59 Ibid., p. 16.

Hanover Research | October 2014
© 2014 Hanover Research | District Administration Practice 16
Figure 2.1: Common Metrics Used for School Improvement Initiatives
Source: Secondary and primary sources60
STUDENT LEARNING
Student Achievement Student achievement represents one of the most, if not the most, highly and frequently prioritized tenet of school improvement across districts.61 Research shows that standardized test scores are not the only way that successful school improvement plans track this key component. Specifically, when measuring student achievement, school improvement plans typically focus on the following indicators:62
Rates of students performing at grade‐level by subject area
Rates of proficiency on state assessments
Graduation and attendance rates
Rates of earning credits and grade‐level advancement
Absenteeism and dropout rates
Because most school districts collect and have access to ample student achievement data, this component of school improvement typically represents a large piece of the continuous
60 [1] Kutash, J., Op. cit., p. 16. [2] Telephone interview with Nicole Norton, Op. cit. [3] Telephone interview with Catherine Barbour, Op. cit. [4] “Guide to Using Data in School Improvement Efforts,” Op. cit., p. 4. [5] “Eight Elements of High School Improvement,” National High School Center at the American Institutes for
Research, January 2011, p. 4. http://betterhighschools.org/pubs/documents/EightElementsMappingFramework.pdf
[6] “School Improvement Planning: A Handbook,” Op. cit., p. 10. 61 [1] Telephone interview with Nicole Norton, Op. cit. [2] “Guide to Using Data in School Improvement Efforts,” Op. cit., p.4 62 Kutash, J., Op. cit., p. 16.
STUDENT LEARNING
•Standardized tests
•Curriculum delivery
•Authentic assessments
•Social and emotional learning (SEL)
•Attendance
•Drop‐out rates
DEMOGRAPHICS
•Enrollment
•Race
•Gender
SCHOOLENVIRONMENT
•School connectivity
•School climate/culture
•Parent, student, and teacher perceptions of school climate
IMPLEMENTATION
•Depth of implementation achieved
•Evaluation of implementation process

Hanover Research | October 2014
© 2014 Hanover Research | District Administration Practice 17
improvement process. Consequently, research suggests that these data be handled strategically and appropriately. In order to maximize the value of this information and its ability to indicate a school’s level of improvement, some suggest structuring it into a three‐tiered system.63 With this approach, student achievement data are divided into annual, large‐scale assessment data, periodic assessment data, and ongoing classroom assessment data. Each category of student achievement data is unique in its purpose, rate of collection, and type of information that it provides, allowing for a holistic approach to improving student achievement.
Figure 2.2 below further outlines the three‐tiered approach. These three interrelated tiers allow districts to divide larger goals for the year into smaller, more tangible benchmarks. Under Tier III, large‐scale data, such as state standardized tests, provide broad indicators of a school’s effectiveness. These data are made available once per year and are often used to communicate higher‐level trends to external stakeholders or to comply with state or federal directives.64 However, once‐per‐year student achievement data tremendously limit the feedback loop necessary to spur improvement throughout a school year.65 As such, it is recommended that more granular student achievement data be tracked within a school improvement model. This practice allows districts to track gains made within a specific student population over the course of a school year, in addition year‐over‐year gains.66 Periodic assessment data can assist in tracking students’ progress in particular content areas over the course of a year. Finally, ongoing classroom assessment data involve teachers continuously assessing students in real time and adjusting lesson plans accordingly. With this practice, each lesson and unit plan created should be based on, or at least cognizant of, past assessment data.67
Figure 2.2: Structuring and Understanding Student Achievement Data
TIER ASSESSMENT
PURPOSE RATE OF FEEDBACK
TYPE OF FEEDBACK PRIMARY TARGET OF FEEDBACK
Tier III Annual large‐scale Infrequent General, broad General accountability audience:
policymakers, community, administrators
Tier II Periodic grade level and subject
area Administrators, teachers
Tier I Ongoing classroom
Frequent Specific, narrow Teachers, students
Source: Learning Points Associates68
63 [1] “Guide to Using Data in School Improvement Efforts,” Op. cit., p. 9. [2] Telephone interview with Nicole Norton, Op. cit. 64 “Guide to Using Data in School Improvement Efforts,” Op. cit., p. 9. 65 Telephone interview with Catherine Barbour, Op. cit. 66 Kutash, J., et al., Op. cit., p. 15. 67 “Guide to Using Data in School Improvement Efforts,” Op. cit., p. 9. 68 Ibid., p. 4.

Hanover Research | October 2014
© 2014 Hanover Research | District Administration Practice 18
Curriculum Delivery In addition to student achievement data, districts typically track curriculum delivery. Ms. Barbour notes that this component of school improvement is best assessed through consistent, frequent classroom observations. When measuring this qualitative criterion, districts may use the following standards:
Curriculum and instruction are aligned to district, state, and national standards that include college‐ and career‐readiness.
Curriculum and core content courses are aligned vertically to ensure that students possess necessary prerequisite content knowledge for higher‐level coursework
Curriculum and core content courses are aligned horizontally to ensure similar courses include common standards
Curriculum and instruction are adapted to school organizational structures to address the needs of all students69
As a tool for tracking curriculum delivery, Ms. Norton recommends using a rubric similar to the Responsive Classroom model, an evidence‐based method of teaching designed to improve both academic and social skills. The rubric identifies ten different practices for teachers in the classroom, including positive language, establishing logical consequences, and providing academic choice. 70 According to Ms. Norton, this rubric and others like it ensure that classroom observations are aligned with improving student learning and ultimately with the success of a school improvement plan.71
Social‐Emotional Learning (SEL) Research demonstrates that SEL skills have a strong influence on student test scores and overall academic experience, making them a logical component for school improvement plans.72 While experts acknowledge the importance of SEL in advancing student learning and school improvement, they also point out the difficulty that many districts have when attempting to measure and quantify this criterion.73 This issue often causes SEL to lose priority against other items in school improvement plans, if it is included at all.74 However,
69 “Eight Elements of High School Improvement,” National High School Center at the American Institutes for Research,
January 2011, p. 4. http://betterhighschools.org/pubs/documents/EightElementsMappingFramework.pdf 70 [1] Telephone interview with Nicole Norton, Op. cit. [2] “Responsive Classroom – Fact Sheet,” Northeast Foundation for Children.
http://www.responsiveclassroom.org/sites/default/files/pdf_files/rc_fact_sheet.pdf 71 Telephone interview with Nicole Norton, Op. cit. 72 Haggerty, K., et al., “Social‐Emotional Learning Assessment Measures for Middle‐School Youth,” Social
Development Research Group, University of Washington, July 30, 2010. http://www.schoolclimate.org/climate/documents/RaikesReportFinalOct.pdf
73 [1] Telephone interview with Nicole Norton, Op. cit. [2] Telephone interview with Catherine Barbour, Op. cit. 74 Ibid.

Hanover Research | October 2014
© 2014 Hanover Research | District Administration Practice 19
research on this metric identifies 72 different instruments and tools used to measure the social and emotional well‐being of students. Of these 72 instruments, only nine are identified as having sound psychometric properties, as being readily available for schools to access and obtain information on, and being general enough to apply to all types of districts and schools. These tools include:
Behavioral and Emotional Rating Scale: Second Edition (BERS‐2)
ASEBA: Child Behavior Checklist (CBCL), Teacher Report Form (TRF), and Youth Self‐Report (YSR)
Communities That Care (CTC) Survey
The Comprehensive School Climate Inventory (CSCI)
Developmental Assets Profile (DAP)
Devereux Student Strengths Assessment (DESSA)
School Social Behaviors Scale, Second Edition (SSBS‐2)
Social Skills Improvement System Rating Scales (SSIS‐Rating Scale)
Washington State Healthy Youth Survey75
The frequency at which SEL data are collected and analyzed varies depending on the tool used and the age group identified. Nevertheless, these tools provide a strong foundation for districts hoping to include this metric within their improvement initiatives.
DEMOGRAPHICS
Perhaps the most straightforward component of school improvement measurement, demographic data allow districts to discern meaningful trends related to student achievement and school climate. Experts suggest that districts should aim to “thoroughly know the school population in order to clarify problems and needs.” While the types of demographic data collected vary by district, driving questions to inform a district’s decision about information to collect may include:
Who are our students?
What trends do we see in our student body
What factors outside the school may help us understand our students?76
Demographic data collection enables districts to identify longitudinal trends, which offer invaluable insight for targeting problem areas and making data‐driven decisions.77 As the
75 Haggerty, K., et al., “Social‐Emotional Learning Assessment Measures for Middle‐School Youth,” Social
Development Research Group, University of Washington, July 30, 2010. http://www.schoolclimate.org/climate/documents/RaikesReportFinalOct.pdf
76 Verbatim from: “Guide to Using Data in School Improvement Efforts,” Op. cit., p. 11. 77 Ibid.

Hanover Research | October 2014
© 2014 Hanover Research | District Administration Practice 20
continuous improvement process progresses from year to year, districts should track these trends afforded by the collection of demographic data paired with other achievement and climate information. Districts should aim to collect the following information:
Demographic information on the students that enroll in schools and their parents
Mobility patterns in and out of grades and schools
Student transportation needs
Rate of enrollments in special programs, such as English as a second language (ESL), special education, or after‐school programs
Neighborhood characteristics
Parent involvement
Behavior and social problems of students78
Discussing the value of demographic information in MPS’s continuous improvement process, Ms. Norton states that the district records trends in special education student achievement by disaggregating demographic data. She notes, “With these data, we’re able to closely track trends specific to special education students and make adjustments accordingly.”79 As this example shows, districts should consider the types of demographic data they collect when attempting to target specific student populations.
SCHOOL ENVIRONMENT
According to the National School Climate Center (NSCC), schools with positive school climates offer “a safe and supportive school environment, in which students have positive social relationships and are respected, engaged in their work and feel competent.” Moreover, NSCC notes that this component of a school heavily influences student learning, making it a high priority for many school improvement initiatives.80 School climate and culture comprise myriad variables related to safety, teaching and learning, interpersonal relationships and the institutional environment.81 While its ambiguity may prevent districts from accurately and consistently tracking school climate and culture, Hanover has identified several concrete variables that allow districts to include this element in their continuous improvement plans:
Student/teacher surveys of school environment
Student attendance rates
Rates of serious misconduct and violence
78 Verbatim from: Ibid. 79 Telephone interview with Nicole Norton, Op. cit. 80 “The School Climate Challenge,” National School Climate Center, pp. 4‐5.
http://www.ecs.org/html/projectspartners/nclc/docs/school‐climate‐challenge‐web.pdf 81 “FAQs about School Climate,” National School Climate Center. http://www.schoolclimate.org/climate/faq.php

Hanover Research | October 2014
© 2014 Hanover Research | District Administration Practice 21
Infrastructure improvement (e.g., dollars invested and response time to maintenance problems)
Parent engagement and satisfaction metrics (e.g., participation in meetings)
Teacher and staff member attendance and retention rates82
IMPLEMENTATION
Also integral to the school improvement process is the continuous assessment of the implementation itself. While districts track gains and losses in student achievement and school environment, they should also evaluate how effectively they are adhering to processes mapped out in their continuous improvement plans.83 As NCDPI notes, doing so enables a district to make mid‐course adjustments to procedures as needed, increasing the chances for gains in other criteria. This task is typically executed by the same individuals that are responsible for the plan’s implementation. Ms. Norton notes that MPS utilizes quarterly teacher, parent, and student survey data to inform its analysis of its own implementation process. She elaborates on this assessment component and argues that it is perhaps one of MPS’s most critical components for school improvement:
We have a rigorous quarterly review process of our implementation. It’s a very structured evaluation during which our instructional leadership team reviews our strategy and action plan, the level of implementation achieved at that point, and any noticeable impact on other factors such as student achievement and school climate. This regular feedback ultimately helps with our goal‐setting. 84
To Ms. Norton’s point, the implementation evaluation process not only ensures efficiency, it also keeps goals realistic and tangible. As previously indicated, improbable or unchallenging goals may undermine the continuous improvement process altogether. Therefore, while the measuring of evaluation may seem only peripherally related to school improvement, a solid, well‐scrutinized plan directly impacts other high‐stakes measures.85 ONGOING ASSESSMENT AND DATA‐DRIVEN DECISION‐MAKING
As both Ms. Barbour and Ms. Norton stress, a district’s school improvement planning is only worthwhile if collected data and resulting conclusions are repeatedly acted upon.86 Follow‐up on conclusions drawn from data ensures that progress is made toward specific targets within the plan. In fact, improvement models indicate that all decisions made regarding
82 [1] Kutash, J., Op. cit., p. 16. [2] “FAQs about School Climate,” National School Climate Center. http://www.schoolclimate.org/climate/faq.php [3] Telephone interview with Nicole Norton, Op. cit. 83 [1] “North Carolina School Improvement Planning Implementation Guide,” Op. cit., p. 20. [2] Telephone interview with Nicole Norton, Op. cit. 84 Ibid. 85 Ibid. 86 [1] Ibid. [2] Telephone interview with Catherine Barbour, Op. cit.

Hanover Research | October 2014
© 2014 Hanover Research | District Administration Practice 22
school improvement measures should be based on data, whether the data come from initial needs assessments or from reviews later during the process. Ultimately, this information should consistently be used when deciding whether to stay the course or change strategy. With each change, districts should use data to determine its effectiveness compared to past strategies.87 Figure 2.3 below delineates data‐driven decision‐making from a more traditional approach. Data‐driven decision‐making entails intentional, fact‐based actions, while traditional decision‐making relies on the status quo or biased interests/ideas. For example, data‐based decision‐making requires staff assignments based on demonstrated skill rather than staff member interest.88 Ultimately, school improvement models calling for this type of decision‐making will require a complete paradigm shift in a district.
Figure 2.3: Comparison of Traditional and Data‐Driven Decision‐Making
DECISION‐MAKING BASED ON INTUITION, TRADITION, OR CONVENIENCE DATA‐DRIVEN DECISION‐MAKING
Scattered staff development programs Focused staff development programs as an
improvement strategy to address documented problems/needs
Budgetary decisions based on prior practice, priority programs
Budget allocations to programs based on data‐informed needs
Staff assignments based on interest and availability Staff assignments based on skills needed as indicated by
the data
Reports to the community about school events Organized factual reports to the community about the
learning progress of students
Goal setting by board members, administrators, or teachers based on votes, favorite initiatives, or fads
Goal‐setting based on data about problems and possible explanations
Staff meetings that focus on operations and the dissemination of information
Staff meetings that focus on strategies and issues raised by the local school’s data
Parent communication via twice‐a‐year conferences at elementary “open houses” and newsletters
Regular parent communication regarding the progress of their children
Grading systems based on each teacher’s criteria of completed work and participation
Grading systems based on common student‐performance criteria that report progress on the standards as well as work skills
Periodic administrative team meetings focused solely on operations
Administrative team meetings that focus on measured progress toward data‐based improvement goals
Source: Learning Point Associates89
87 “North Carolina School Improvement Planning Implementation Guide,” Op. cit., p. 26. 88 “Guide to Using Data in School Improvement Efforts,” Op. cit., p. 4. 89 Verbatim from: Ibid.

Hanover Research | October 2014
© 2014 Hanover Research | District Administration Practice 23
COMMUNICATION WITH STAKEHOLDERS
As districts continue to use data, track progress, and adjust initiatives, they should also consider communication practices. In particular, districts should be sure to communicate “quick wins” when data indicate results early on. By signaling change, districts can build momentum in the improvement process and boost stakeholder morale. 90 Contrarily, research suggests that districts should prepare themselves for potential drops in measured school improvement early during the implementation process. These “implementation dips,” or brief periods when conditions worsen before a data‐backed solution takes hold and catalyzes results, are natural to the improvement process. Rather than immediately communicating failure or changing course, districts should allow time for change to take place.91
90 Kutash, et al., Op. cit., p. 6. 91 “North Carolina School Improvement Planning Implementation Guide,” North Carolina Department of Public
Instruction, September, 2013 p. 26. http://www.ncpublicschools.org/docs/councils/lea/previous/templates/sip‐guide.pdf

Hanover Research | October 2014
© 2014 Hanover Research | District Administration Practice 24
SECTION III: REVIEW OF IMPROVEMENT
MODELS In this section, Hanover presents a review of school improvement models, as identified by best practices literature and expert interviews.
DAGGETT SYSTEM FOR EFFECTIVE INSTRUCTION
The Daggett System for Effective Instruction is an approach to improving instruction and instructional capacity. The model is informed by best practices research and meta‐analyses on effective instruction and heavily focuses on supporting teachers. The following five themes are the main drivers of the Daggett System:
Leadership: A clear sense of purpose that empowers staff toward a common vision
High expectations: For academic performance as well as college/career readiness
Relationships: Valuing relationships as part of a successful learning environment
Student opportunities: Both academic “stretch“ and personal skill development opportunities
Professional culture: Teachers, administration, and staff collaborate toward goals92
What follows in Figures 3.1, 3.2, and 3.3 are the Daggett System’s major implications for teachers, instructional leaders, and organizational leadership.
Figure 3.1: The Daggett System for Teachers versus Traditional Models
TRADITIONAL WHAT IS NEEDED
“Deliver” instruction “Facilitate” learning
Student Learner
Test scores (easy to measure) Holistic assessment of learner (difficult to measure)
Proficiency Growth
Standardized approach Personalized, differentiated for each learner
Content‐focused and narrow Application focused
Probing questions, scaffolding
Instruction in classroom only, bell schedule‐ limited Learning anyplace/anytime, 24x7, technology
Teacher‐centered Learner‐centered
Passive learning Active learning
Learn to do Do to learn
Assessment has single purpose (proficiency) Smarter, balanced assessments with multiple purposes (assess for proficiency, growth, formative, predictive)
92 Daggett, W. R., “The Daggett System for Effective Instruction – Where Research and Best Practices Meet,”
International Center for Leadership in Education, p. 3. http://teacher.scholastic.com/products/scholastic‐achievement‐partners/downloads/Daggett_System_For_Effective_Instruction.pdf

Hanover Research | October 2014
© 2014 Hanover Research | District Administration Practice 25
TRADITIONAL WHAT IS NEEDED
Teacher as “sage on the stage” Teacher as facilitator of learning
Define learning in terms of required content to teach Define learning in terms of skills and knowledge as results
Define learning from specific skills up to total student Define learning from whole student down to specific skills
Cover as many topics as possible Help students learn priority skills deeply
Break apart curriculum Integrate curriculum
Entire curriculum mandatory Curriculum includes some student choice
Teach skills in isolation Teach skills in context
Focus on deficiencies Focus on proficiencies
Look for evidence of good teaching Look for evidence of good learning
Standardized procedures Shared best practices
Give separate assessments Give embedded assessments
Isolate instruction from community Connect instruction to community
Source: Daggett, W.R.93
Figure 3.2: The Daggett System for Instructional Leaders versus Traditional Models
TRADITIONAL WHAT IS NEEDED
Manage in the current system Change the system
Use past experience to solve problems Learn new ways to adapt and change
Promote standard procedures Adapt to unique situations
Replicate practices with fidelity Create new practices to meet student needs
Look to supervisors for answers Look to staff to take actions
Rely on individual expertise Share each other’s expertise
Authority Collaboration
Source: Daggett, W.R.94
Figure 3.3: The Daggett System for Organizational Leadership versus Traditional Models
TRADITIONAL WHAT IS NEEDED
Set vision by top leadership Set vision with wide contributions
Define vision in few academic measures Define vision in term of whole student needs (LC)
Place priority on short term results Place priority on long‐term improvement
Limit goals to best students Expand goals to all students
See vision as top leaders’ initiative Embrace vision universally
Instill fear with goals Inspire passion with goals
Rigid structures to support adult needs Flexible structure to support student needs
Top down change for ease of administration / compliance – teachers as objects of change
Top down support for bottom‐up reform – teachers as agents of change
Source: Daggett, W.R.95
93 Ibid., p. 10. 94 Ibid. 95 Ibid., p. 11.

Hanover Research | October 2014
© 2014 Hanover Research | District Administration Practice 26
RESULTS‐ORIENTED CYCLE OF INQUIRY
Recommended by Ms. Barbour, the Results‐Oriented Cycle of Inquiry (ROCI) is a simple improvement framework that largely adheres to the best practices for establishing priorities and making data‐based decisions outlined in Sections I and II. This framework, presented in Figure 3.4, comprises five steps designed to promote focus on continuous improvement within any type of organization, including schools. 96
Figure 3.4: Results‐Oriented Cycle of Inquiry
Source: Partners in School Innovation97
ROCI involves the following phases of implementation:
Partner: Create an authentic partnership in which each person is able to bring their unique knowledge, skills, and beliefs to the table in order to pursue a common vision.
Set goals: Understand gap between the school’s vision and their current reality and collaboratively define goals which will focus everyone’s attention on the most important levers and indicators of progress
Plan: Create actionable plans that break down year‐long goals into achievable quarterly, weekly, and even daily objectives, allocating time, resources, and actions to achieve those goals.
96 “Results‐Oriented Cycle of Inquiry,” Partners in School Innovation. http://www.partnersinschools.org/services/how‐we‐work/mindsets‐ways‐of‐working/our‐approach‐results‐oriented‐cycle‐of‐inquiry/ 97 Adapted from: Ibid.
Set Goals
Plan
ActAssess
Reflect and
Adjust

Hanover Research | October 2014
© 2014 Hanover Research | District Administration Practice 27
Act: Provide coaching, modeling, thought‐partnership and collaboration in order to build the capacity of teachers and leaders to implement their plans effectively.
Assess, reflect, adjust: Support school leaders and teachers to establish a regular habit of using data to understand results, learn from what’s working and adjusting practice to ensure that goals will be met.
Close or renew: Create a space for reflection on the progress made; unpacking successes in order to create momentum for the year ahead.98
BALANCED SCORECARD MODEL
Identified by both the Wallace Foundation and Ms. Barbour as a highly effective school improvement model, the Balanced Scorecard Model is a data‐driven model that has had proven success in facilitating school improvement in the Atlanta Public Schools system. The model operates under two simple principles:
If you cannot measure it, you cannot manage and improve it
Measurement motivates99
Using these principles, the model relies on the idea that measuring progress can influence key actors more than other incentives, such as pay increases. The model also includes the following strategic components:
Mobilize change through executive leadership
Translate strategy into operational terms
Align the organization to the strategy
Make strategy everyone’s job
Make strategy a continual process100
98 Verbatim from: Ibid. 99 Kaplan, R. and Miyake, D., “The Balanced Scorecard,” The School Administrator, Vol. 67, No. 2, February ,2010, pp.
10‐15. http://www.aasa.org/SchoolAdministratorArticle.aspx?id=11784 100 Ibid.

Hanover Research | October 2014
© 2014 Hanover Research | District Administration Practice 28
MASSACHUSETTS DEPARTMENT OF EDUCATION THEORY OF ACTION MODEL
Lastly, the Massachusetts Department of Education’s Office of District and School Turnaround has been recognized for its “Theory of Action” model that has been used to effectively facilitate school improvement efforts.101 As Figure 3.5 below shows, the model involves the setting off strategic priorities, data‐based decision‐making, and the monitoring of the implementation process itself.
Figure 3.5: Massachusetts Department of Education – Office of District and School Turnaround, “Theory of Action” Model
Source: Massachusetts Department of Education102
101 Telephone interview with Ms. Barbour, Op. cit. 102 “Office of District and School Turnaround: Theory of Action,” Massachusetts Department of Education.
http://www.doe.mass.edu/apa/sss/turnaround/ODST‐theory.pdf
Hanover Research | October 2014
© 2014 Hanover Research | District Administration Practice 29
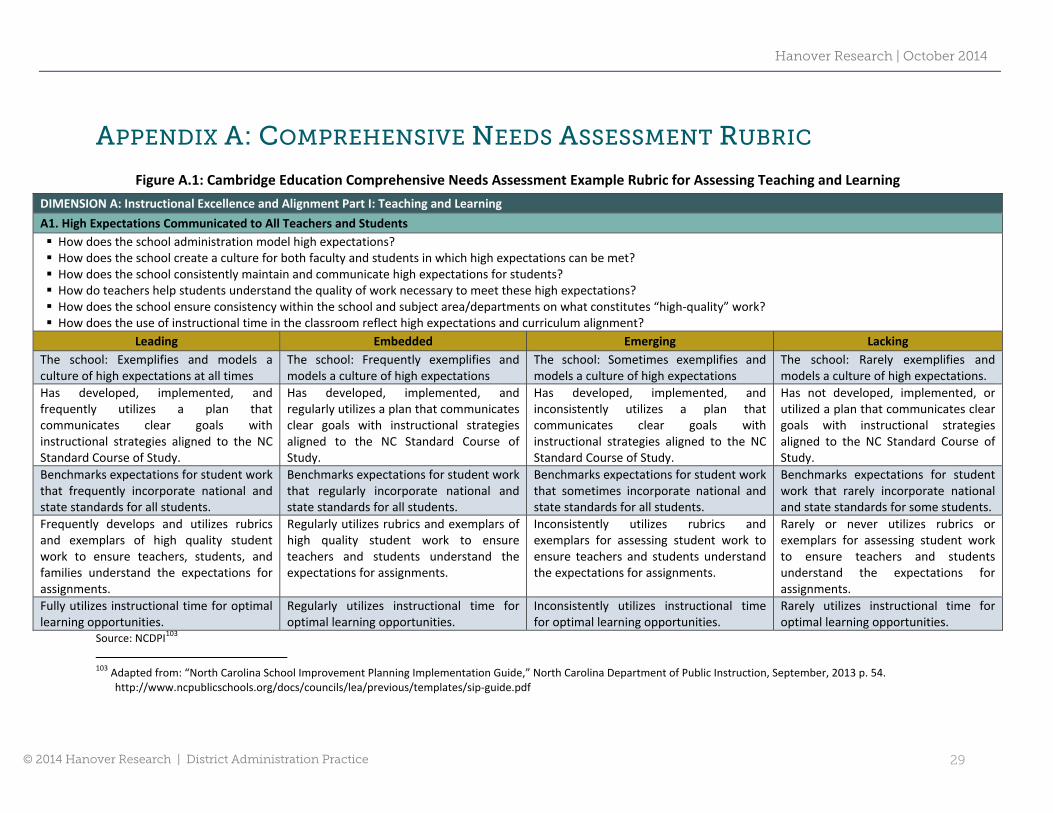
APPENDIX A: COMPREHENSIVE NEEDS ASSESSMENT RUBRIC
Figure A.1: Cambridge Education Comprehensive Needs Assessment Example Rubric for Assessing Teaching and Learning
DIMENSION A: Instructional Excellence and Alignment Part I: Teaching and Learning
A1. High Expectations Communicated to All Teachers and Students
How does the school administration model high expectations? How does the school create a culture for both faculty and students in which high expectations can be met? How does the school consistently maintain and communicate high expectations for students? How do teachers help students understand the quality of work necessary to meet these high expectations? How does the school ensure consistency within the school and subject area/departments on what constitutes “high‐quality” work? How does the use of instructional time in the classroom reflect high expectations and curriculum alignment?
Leading Embedded Emerging Lacking
The school: Exemplifies and models a culture of high expectations at all times
The school: Frequently exemplifies and models a culture of high expectations
The school: Sometimes exemplifies and models a culture of high expectations
The school: Rarely exemplifies and models a culture of high expectations.
Has developed, implemented, and frequently utilizes a plan that communicates clear goals with instructional strategies aligned to the NC Standard Course of Study.
Has developed, implemented, and regularly utilizes a plan that communicates clear goals with instructional strategies aligned to the NC Standard Course of Study.
Has developed, implemented, and inconsistently utilizes a plan that communicates clear goals with instructional strategies aligned to the NC Standard Course of Study.
Has not developed, implemented, or utilized a plan that communicates clear goals with instructional strategies aligned to the NC Standard Course of Study.
Benchmarks expectations for student work that frequently incorporate national and state standards for all students.
Benchmarks expectations for student work that regularly incorporate national and state standards for all students.
Benchmarks expectations for student work that sometimes incorporate national and state standards for all students.
Benchmarks expectations for student work that rarely incorporate national and state standards for some students.
Frequently develops and utilizes rubrics and exemplars of high quality student work to ensure teachers, students, and families understand the expectations for assignments.
Regularly utilizes rubrics and exemplars of high quality student work to ensure teachers and students understand the expectations for assignments.
Inconsistently utilizes rubrics and exemplars for assessing student work to ensure teachers and students understand the expectations for assignments.
Rarely or never utilizes rubrics or exemplars for assessing student work to ensure teachers and students understand the expectations for assignments.
Fully utilizes instructional time for optimal learning opportunities.
Regularly utilizes instructional time for optimal learning opportunities.
Inconsistently utilizes instructional time for optimal learning opportunities.
Rarely utilizes instructional time for optimal learning opportunities.
Source: NCDPI103
103 Adapted from: “North Carolina School Improvement Planning Implementation Guide,” North Carolina Department of Public Instruction, September, 2013 p. 54.
http://www.ncpublicschools.org/docs/councils/lea/previous/templates/sip‐guide.pdf

Hanover Research | October 2014
© 2014 Hanover Research | District Administration Practice 30
PROJECT EVALUATION FORM Hanover Research is committed to providing a work product that meets or exceeds partner expectations. In keeping with that goal, we would like to hear your opinions regarding our reports. Feedback is critically important and serves as the strongest mechanism by which we tailor our research to your organization. When you have had a chance to evaluate this report, please take a moment to fill out the following questionnaire. http://www.hanoverresearch.com/evaluation/index.php
CAVEAT The publisher and authors have used their best efforts in preparing this brief. The publisher and authors make no representations or warranties with respect to the accuracy or completeness of the contents of this brief and specifically disclaim any implied warranties of fitness for a particular purpose. There are no warranties which extend beyond the descriptions contained in this paragraph. No warranty may be created or extended by representatives of Hanover Research or its marketing materials. The accuracy and completeness of the information provided herein and the opinions stated herein are not guaranteed or warranted to produce any particular results, and the advice and strategies contained herein may not be suitable for every partner. Neither the publisher nor the authors shall be liable for any loss of profit or any other commercial damages, including but not limited to special, incidental, consequential, or other damages. Moreover, Hanover Research is not engaged in rendering legal, accounting, or other professional services. Partners requiring such services are advised to consult an appropriate professional.

Hanover Research | October 2014
© 2014 Hanover Research | District Administration Practice 31
1700 K Street, NW, 8th Floor
Washington, DC 20006
P 202.559.0500 F 866.808.6585
www.hanoverresearch.com