best practices from 20 years of leadership education ... · best practices from 20 years of...
TRANSCRIPT

Best Practices from 20 Years of Leadership Education Assessment:
Helping Graduates Lead Purposeful Lives

IntroductionJon Barch - Assistant Director of the Center for Student Enrichment/Student Leader Fellowship Program Coordinator
Rachel Harris - Associate Director of the Center for Student Enrichment/Superior Edge Coordinator
Dave Bonsall - Director of the Center for Student Enrichment

Overview of Today’s Session• Abbreviated history of the Student Leader Fellowship Program (SLFP)
• Program description• Review the assessment tools• Share the assessment results• Addressing the “so what?” – five best practices we have discovered through leadership program assessment
• Please ask questions throughout!

In the beginning…a brief history of the Student Leader Fellowship Program
• Frustrations that led to its development Constantly working
with new and varied groups
Difficult to take students from “A” to “Z”
Lack of dedicated staff time

In the beginning…a brief history of the Student Leader Fellowship Program
• The SLFP would be built upon answers to the question, “What would be the ideal leadership development program for students at NMU?”
• What staffing would be needed?

Student Leader Fellowship Program“Developing Competent, Ethical, and Community-Centered Leaders”
• Servant Leadership Model• Social Change Model (before it existed)

“The Community as a Classroom”
“The Community as a Part of Every SLFP Participants’
Present and Future”

Evaluation and Assessment: With the Student Leader Fellowship
Program from the Outset
• A Kellogg Grant-Funded Program Outside Evaluation Required
• Key Job Description Component• Personal Interest of Staff

At the end of this school year, there
will be 771 graduates.
Components of the SLFP and its
overall impact have always been
evaluated and assessed.

Student Leader Fellowship Program Evaluation: Both Formative and Summative Purposes
Continuous Quality Improvement Goals
• On-going evaluation of process
• What aspects of program need adjusting?
• Meeting students’ needs (staying relevant)
• University requirements (AQIP)
Program Purpose Achievement Goals
• Program outcomes• What are students
learning?• How much are students
growing?• Is the program successful?

Student Leader Fellowship Program
• Two-year nationally recognized program• Accepts 50+ students each year• Students apply and get interviewed: students with leadership
potential commitment to community
service ability to follow through
and complete the program

Student Leader Fellowship Program
• Each group identifies themselves with a block color (red, blue, green, purple, aqua, yellow, burgundy, navy, orange, lime, sky, jade, mango, crimson, fuchsia, mint, cerulean, kiwi, teal, and gold).
• In order to complete the SLFP, students must complete all program components (fall retreat, UN 250 class, mentor relationship, Skill Builder! workshops, and a one-year community service internship).
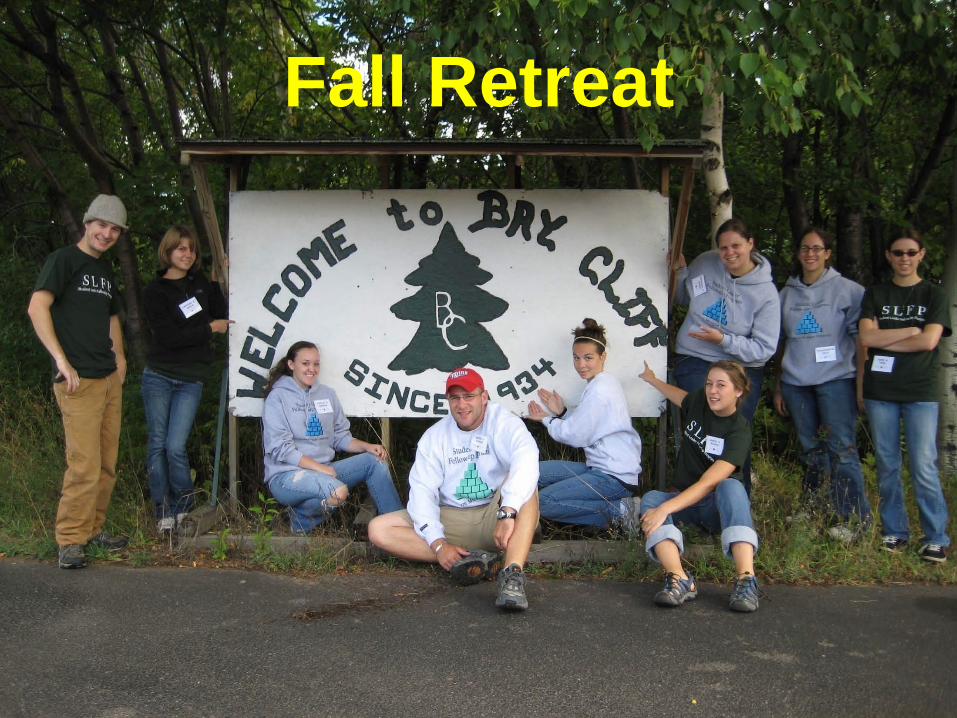
Fall Retreat


Fall Retreat
• Every September Student Fellows attend an overnight retreat away from campus.
• Student Fellows get to know each other, participate in teambuilders, and learn more about the program.
• Have a ton of fun!


What have we learned?• Successful fellowship development• Added more interactive teambuilders• Good understanding of program and expectations• Shortened the retreat by a few hours• Received conflicting data…

Mentors


Mentors• Find 50+ community leaders to serve as Mentors• Over 600 different Mentors have served• Every Student Fellow
is matched with a Mentor for the first year, and they meet bi-weekly.
• Mentors are positive role models who use their experience to teach, guide, and advise theStudent Fellows in leadership development.


What have we learned?• Added mentorshops each semester• Increased social activities for Mentors/Student Fellows• Increased communication with Mentors

Leadership Theory and Practice Course
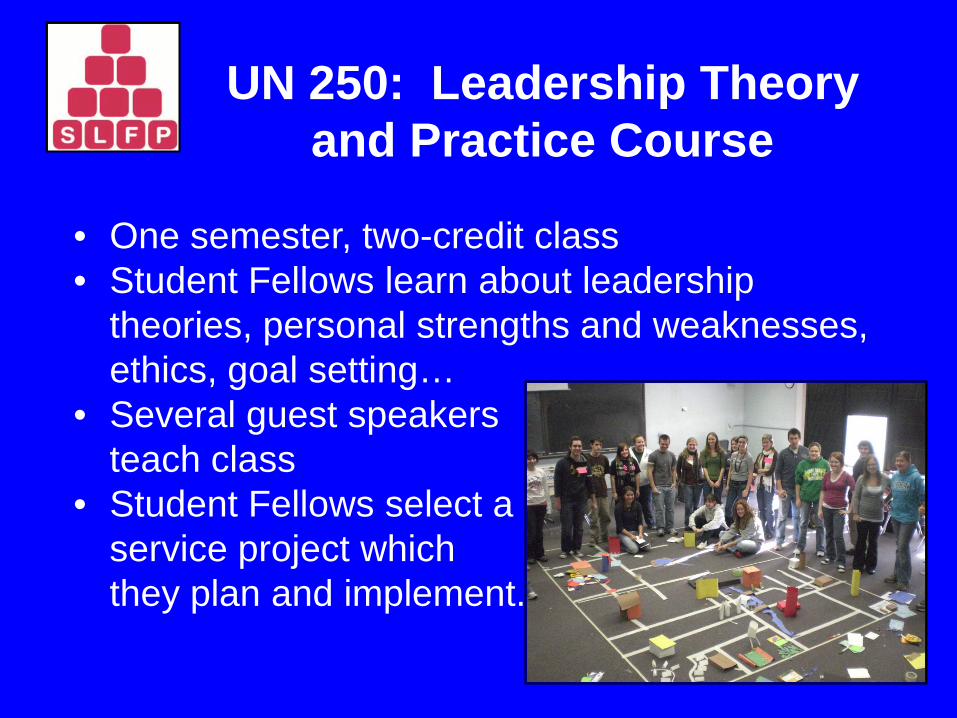
UN 250: Leadership Theory and Practice Course
• One semester, two-credit class• Student Fellows learn about leadership
theories, personal strengths and weaknesses, ethics, goal setting…
• Several guest speakers teach class
• Student Fellows select a service project which they plan and implement.


What have we learned?• Student Fellows enjoy the guest speakers, interactive
activities, and journals.• Student Fellows didn’t like many of the textbooks that
we’ve used over the years.• Moved from a campus issue to an academic service
learning project.

Skill Builders! Leadership Workshops


Skill Builder! Workshops• Every semester we offer 25-35 leadership
workshops.• Student Fellows must attend a total of 15 Skill
Builder! workshops during their two years in the SLFP.
• Skill Builder! workshops are open to everyone and most are free.
• Topics include publicspeaking, assertiveness, servant leadership, ethics, and communication.


What have we learned?• We’ve learned what workshops to repeat/discontinue.• Presenters can improve their workshops based on the
feedback.• We’ve learned the most popular workshops are
interactive or action-based.

Community Service Internships


Community Service Internships
• Student Fellows select, design, and implement a year-long, 100-hour community service internship.
• They design their own or choose from existing sites.
• Examples include tutoring, coaching, mentoring, coordinating after-school programs, advising youth councils, or working with the elderly.

Community Service Internships
• Over 85,000 hours of service and leadership• Over 350 different internship sites


What have we learned?• Increase communication with site advisers• Student Fellows need to select their own internships.• Flexibility is necessary.• If Student Fellows are meeting the goals of their internship

Summative Assessment
What are the outcomes of the program?
Is it accomplishing what we want it to accomplish?
Is it worth the cost (dollars and staff time)?

• Both quantitative and qualitative research are important and useful.
• We use the pragmatic approach, which focuses on the value of each method as determined by the practical consequences of using it.
• Different situations and different research questions make it more appropriate to focus on quantitative or qualitative but almost always insights from both procedures lead to the best assessment product.
• Strengths and weaknesses of each approach should guide methodological decisions.
– See Johnson & Onwegbuzie, 2004, for a full summary of the many strengths and weaknesses of each approach
Why we use a Mixed Methods Approach for SLFP Assessment

Why we use a Mixed Methods Approach for SLFP Assessment
• Pragmatic Value of Quantitative Methods – Can test hypotheses about program outcomes– Can compare findings with other samples or
populations– Relatively quick data collection– Less time consuming to analyze – More removed from researcher biases– More credible to important stakeholders (upper
administrators, grant funders, etc.)– Better for large samples (20 years of data)

Why we use a Mixed Methods Approach for SLFP Assessment
• Pragmatic Value of Qualitative Methods – Based on participant’s own experiences– Provides rich detail for deeper understanding in context– Useful for the inductive process of generating
explanations– Gives “why it’s happening” information as opposed to the
“what is happening” from quantitative data – Important cases can be used to demonstrate vividly a
phenomenon to readers of a report

Our Mixed Method Tools forSLFP Summative Assessment
• Quantitative – Pre- and Post-Program Inventory– 1, 3, and 5-year follow-up surveys– Categorical analysis of Reflection Paper statements
• Qualitative– Final Reflection Paper– Open ended questions in pre- and post-inventory as
well as 1, 3, and 5-year follow-up surveys
• Added Note:– Mixed methods in formative evaluation
too

Pre- and Post-Program Inventory• Leadership Abilities items
• Leadership Knowledge items
• Leadership Attitudes items
• Applicable National Survey of Student Engagement (NSSE) items
• Applicable Student Perception Survey (SPS) items
• Social Change Model related items

Pre- and Post-Program Inventory
• Leadership Abilities:– Organize others– Empower others– Communication skills– Facilitate group to take action– Reflective analysis– Persuasion abilities– Community needs awareness

Pre- and Post-Program Inventory
• Leadership Knowledge:– Diversity of leadership roles and styles– Situational assessment knowledge– Individual and group assessment knowledge– Self understanding– Diversity of leadership theories– Relationship between the situation and
leadership style

Pre- and Post-Program Inventory
• Leadership Attitudes:– Public speaking efficacy– Empathy– Social responsibility– Commitment to volunteerism– Flexibility – Role modeling efficacy

Pre- and Post-Program Inventory• Applicable NSSE Questions
– Quality of relationships with • Other students• Faculty• Administrative personnel and offices
– Hours per week of • Class prep• Co-curricular engagement • Relaxing/socializing
– Institution helped me• Acquire job-related knowledge/skills• Speaking clearly and effectively• Working with others• Learning on own• Understanding self• Solving complex, real-world problems• Develop personal values and ethics• Contribute to welfare of community
– How was the entire educational experience at institution?– If you could start over, would you go to the same institution?– We do not include the items about academic service learning
and community service as those are requirements of this program, and thus, we know 100% of them are doing it.

Pre- and Post-Program Inventory• Applicable SPS questions (3 items)
– Feel connected with university– Sufficiently involved in campus activities– Well informed about campus activities
• Social Change Model (7 Cs) related questions (7 items)– Consciousness of self– Congruence of actions and values/beliefs– Commitment to act on values/beliefs– Collaboration with others– Common purpose as focus– Controversy with civility– Citizenship or social responsibility

Pre-Score & Post-Score Averages for Ability, Knowledge, & Attitude Variables Across All
Years of Measurement
0
0.5
1
1.5
2
2.5
3
3.5
4
4.5
5
Pre Mean
Post Mean

So What?
How big is the effect in statistical terms?

Effect Size - Cohen’s d• Effect sizes are often said to
be: – “small, d = .2,”– “medium, d = .5,” – “large, d = .8”
• Effect sizes can also understood in terms of average percentile standing of the average treated (or experimental) participant relative to the average untreated (or control) participant.
Cohen's Standard
Effect Size
Percentile Standing
2.0 97.71.5 93.31.0 84
LARGE 0.8 790.7 760.6 73
MEDIUM 0.5 690.4 660.3 62
SMALL 0.2 580.1 540.0 50

Program Effect Size Averages of All Years of Measurement
1.67
1.30
1.77 1.77
1.20
1.41 1.42
1.76
1.35 1.411.52
1.73 1.761.87
1.571.68 1.69
1.99
1.31
2.14
0.00
0.50
1.00
1.50
2.00
2.50
Effe
ct S
ize
Scor
e

Longitudinal ResultsLeadership Abilities – Communication Skills
1.94
2.17
1.78
1.55
2.44
0.87
1.5
1.17
1.561.62
1.82
2.41
1.98 1.97
0
0.5
1
1.5
2
2.5
3
1997 1998 1999 2000 2001 2002 2003 2004 2005 2006 2007 2008 2009 2010
EFFE
CT
SIZE

Longitudinal Results Leadership Knowledge – Diversity of Leadership Theories
2.11
1.74 1.71
1.48
1.62
1.38
1.56
2
1.841.91
1.72
1.57
2.18
1.77
0
0.5
1
1.5
2
2.5
1997 1998 1999 2000 2001 2002 2003 2004 2005 2006 2007 2008 2009 2010
EFFE
CT
SIZE

Longitudinal Results Leadership Attitudes – Commitment to Service
2.05 2.08
2.32
2.13
0.94
1.24
2.47
1.82 1.821.91
1.83
3.23
1.87
2.14
0
0.5
1
1.5
2
2.5
3
3.5
1997 1998 1999 2000 2001 2002 2003 2004 2005 2006 2007 2008 2009 2010
EFFE
CT
SIZE

Longitudinal Results Leadership Attitudes – Commitment to Service
3.57
3.88
3.52
3.8 3.81
3.573.75 3.67 3.62
3.76 3.713.9
3.62 3.58
1
1.5
2
2.5
3
3.5
4
4.5
5
1997 1998 1999 2000 2001 2002 2003 2004 2005 2006 2007 2008 2009 2010
Pre-
Prog
ram
Mea
n Sc
ore
(5-P
oint
Sca
le)

Longitudinal Results Leadership Attitudes – Commitment to Service
4.72 4.76 4.74 4.73
4.5 4.48
4.84.67 4.65 4.72 4.67
4.94.76 4.71
1
1.5
2
2.5
3
3.5
4
4.5
5
1997 1998 1999 2000 2001 2002 2003 2004 2005 2006 2007 2008 2009 2010
Post
-Pro
gram
Mea
n Sc
ore
(5-p
oint
sca
le)

National Survey of Student Engagement Item 2010 Comparisons

Student Perception Survey (SPS) ItemsSLFP & NMU Residence Hall Group Comparisons

Social Change Model 7 C’s ItemsCross-Sectional Comparison of 2010 Pre & Post-Data
0.190.23
0.35
0.30
0.51
0.150.11
0.00
0.10
0.20
0.30
0.40
0.50
0.60
0.70
0.80
Effe
ct S
ize

Final Reflection Papers
• 2-4 page free response reflections on: – what you most enjoyed – what you least enjoyed – what you learned– your favorite component– the most memorable part for you

Final Reflection Papers
• Program administrators read through and look for insights, recommendations, and themes.
• Provides deeper understanding of the participant’s experience
• Gives new ideas for program and validates current components
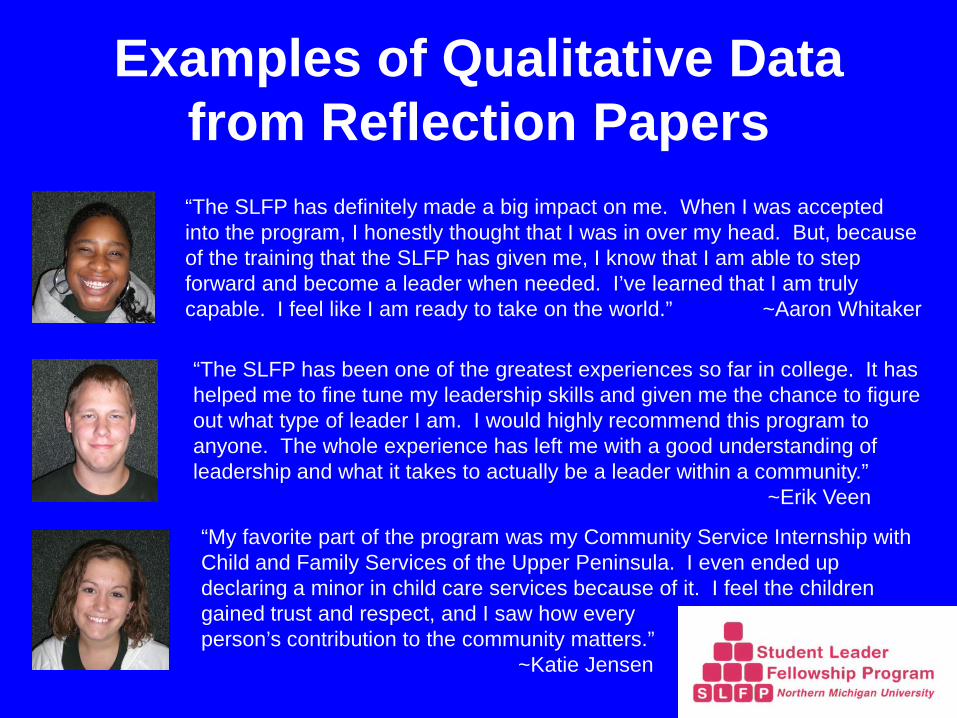
Examples of Qualitative Data from Reflection Papers“The SLFP has definitely made a big impact on me. When I was accepted into the program, I honestly thought that I was in over my head. But, because of the training that the SLFP has given me, I know that I am able to step forward and become a leader when needed. I’ve learned that I am truly capable. I feel like I am ready to take on the world.” ~Aaron Whitaker
“The SLFP has been one of the greatest experiences so far in college. It has helped me to fine tune my leadership skills and given me the chance to figure out what type of leader I am. I would highly recommend this program to anyone. The whole experience has left me with a good understanding of leadership and what it takes to actually be a leader within a community.”
~Erik Veen
“My favorite part of the program was my Community Service Internship with Child and Family Services of the Upper Peninsula. I even ended up declaring a minor in child care services because of it. I feel the children gained trust and respect, and I saw how every person’s contribution to the community matters.”
~Katie Jensen
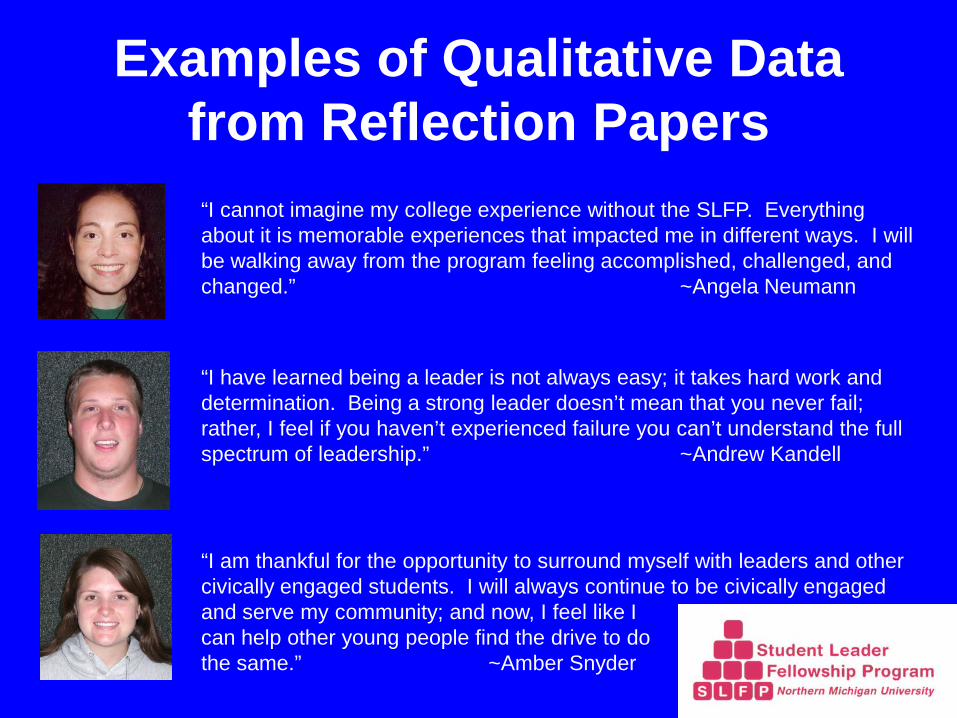
Examples of Qualitative Data from Reflection Papers
“I cannot imagine my college experience without the SLFP. Everything about it is memorable experiences that impacted me in different ways. I will be walking away from the program feeling accomplished, challenged, and changed.” ~Angela Neumann
“I have learned being a leader is not always easy; it takes hard work and determination. Being a strong leader doesn’t mean that you never fail; rather, I feel if you haven’t experienced failure you can’t understand the full spectrum of leadership.” ~Andrew Kandell
“I am thankful for the opportunity to surround myself with leaders and other civically engaged students. I will always continue to be civically engaged and serve my community; and now, I feel like Ican help other young people find the drive to dothe same.” ~Amber Snyder

Final Reflection Papers• Assessment has grown as a university priority• Financial resources are on the decline• We continue to improve our methods
• One improvement was to develop a rubric of categories for coding responses, which allows quantitative analysis of reflection outcomes.

Process of Developing Categories• Two administrators and three research assistants each read
the same 10 Reflection Papers randomly selected from across the years. Highlighted perceived outcomes statements from each
paper Compiled list of statements from everyone Individually sorted outcomes into categories Compared categories and discussed Developed into first draft of rubric Same team used the rubric to score 6 new papers Compared scores for inter-rater reliability and discussed
clarifications for new rubric draft Repeated again
• Two administrators used the final draft to score all of the 2010 Reflection Papers. – Inter-rater reliability was good (alpha = .82)

Response Categories

Quantified Results from 2010 Reflection Papers
22.5 22.5
0.0
15.0
7.5
0.0
20.0
30.0
5.07.5
10.0
40.0
32.5
72.5
5.0
15.0
10.0
5.0 5.0
10.012.5
5.0
37.5
12.5 12.5
0.00.0
10.0
20.0
30.0
40.0
50.0
60.0
70.0
80.0
% o
f R
espo
nden
ts w
ho m
ade
stat
emen
t

1, 3, & 5-Year Follow-up Surveys
• All include the same set of questions
• Results are quite positive overall
• Response rates are a challenge
• Therefore, response bias is a concernExample from 1999 graduates: – 40 grads all filled out post-program inventory – 8 grads respond to 1-year follow-up– 11 grads respond to 3-year follow-up– 5 grads respond to 5-year follow-up

AS A RESULT OF BEING IN THE SLFP, I HAVE… great extent
moderate extent
slight extent
Not certain
Not at all
1. gained confidence in my ability to lead and get things done. 73.0% 27.0% 0.0% 0.0% 0.0%
2. used my experience or skills in a work situation this year. 67.6% 29.7% 2.7% 0.0% 0.0%
3. used my experience or skills in a community situation this year.
35.1%35.1% 24.3% 2.7% 2.7%
4. changed or altered my plans for work or career. 17.6% 24.3% 23.0% 4.1% 31.1%
5. taken a leadership role during the past year. 68.9% 21.6% 8.1% 0.0% 1.4%
6. used SLFP materials from the course or workshops in other settings.
31.1%31.1% 20.3% 8.1% 9.5%
7. described SLFP experience to others (resume, reports, interviews, & conversations).
67.6%21.6% 8.1% 0.0% 2.7%
8. recommended NMU’s SLFP to others. 64.9% 23.0% 5.4% 2.7% 4.1%
OVERALL IMPACT Great impact
Moderate impact
Slight impact
Not certain
Not at all
9. As you look back on the SLFP now, please rank its overall impact on you.
75.0% 25.0% 0.0% 0.0% 0.0%
1-Year Follow-up (N=71)

YES or NO Yes No
Is there and experience or opportunity you have had this year as a direct result of being in the SLFP while at NMU?
54.9% 45.1%
Did your acceptance into the SLFP change your university experience? 98.6% 1.4%
Were there learning experiences in the SLFP that you think all or many NMU students should have?
95.9% 4.1%
Did your participation in the SLFP while at NMU change your view of leadership in the community?
84.7% 15.3%
As a result of the SLFP, have you made any changes in your work or career plans?
41.7% 58.3%
Is there a part of the SLFP experience that you now think will make a long-term impact on your life?
100.0% 0.0%
NMU RECRUITMENT More Likely
No Difference
Less Likely
Does the existence of the SLFP affect your recommendation of NMU to other students?
73.6% 26.4% 0.0%
1-Year Follow-up (N=71)

3-Year Follow-up (N=49)AS A RESULT OF BEING IN THE SLFP, I HAVE… great
extentmoderate
extentslight extent
Not certain
Not at all
1. gained confidence in my ability to lead and get things done. 61.5% 38.5% 0.0% 0.0% 0.0%
2. used my experience or skills in a work situation this year. 56.4% 35.9% 7.7% 0.0% 0.0%
3. used my experience or skills in a community situation this year.
30.8%35.9% 17.9% 2.6% 12.8%
4. changed or altered my plans for work or career. 20.5% 28.2% 17.9% 7.7% 25.6%
5. taken a leadership role during the past year. 51.3% 38.5% 10.3% 0.0% 0.0%
6. used SLFP materials from the course or workshops in other settings.
23.1%33.3% 12.8% 2.6% 28.2%
7. described SLFP experience to others (resume, reports, interviews, & conversations).
53.8%35.9% 5.1% 2.6% 2.6%
8. recommended NMU’s SLFP to others. 53.8% 10.3% 23.1% 5.1% 7.7%
OVERALL IMPACT Great impact
Moderate impact
Slight impact
Not certain
Not at all
9. As you look back on the SLFP now, please rank its overall impact on you.
76.9% 23.1% 0.0% 0.0% 0.0%
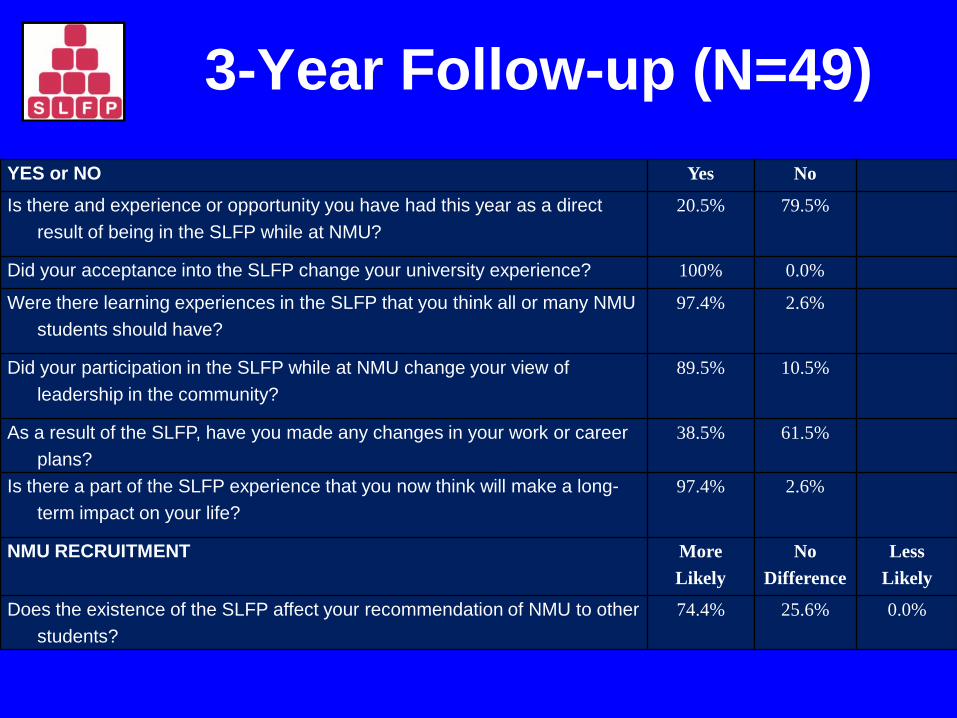
3-Year Follow-up (N=49)YES or NO Yes No
Is there and experience or opportunity you have had this year as a direct result of being in the SLFP while at NMU?
20.5% 79.5%
Did your acceptance into the SLFP change your university experience? 100% 0.0%
Were there learning experiences in the SLFP that you think all or many NMU students should have?
97.4% 2.6%
Did your participation in the SLFP while at NMU change your view of leadership in the community?
89.5% 10.5%
As a result of the SLFP, have you made any changes in your work or career plans?
38.5% 61.5%
Is there a part of the SLFP experience that you now think will make a long-term impact on your life?
97.4% 2.6%
NMU RECRUITMENT More Likely
No Difference
Less Likely
Does the existence of the SLFP affect your recommendation of NMU to other students?
74.4% 25.6% 0.0%

5-Year Follow-up (N=25)AS A RESULT OF BEING IN THE SLFP, I HAVE… great
extentmoderate
extentslight extent
Not certain
Not at all
1. gained confidence in my ability to lead and get things done. 47.8% 47.8% 4.3% 0.0% 0.0%
2. used my experience or skills in a work situation this year. 65.2% 30.4% 0.0% 4.3% 0.0%
3. used my experience or skills in a community situation this year.
26.1%34.8% 8.7% 21.7% 8.7%
4. changed or altered my plans for work or career. 21.7% 8.7% 34.8% 8.7% 26.1%
5. taken a leadership role during the past year. 56.5% 34.8% 4.3% 4.3% 0.0%
6. used SLFP materials from the course or workshops in other settings.
26.1%13.0% 17.4% 8.7% 34.8%
7. described SLFP experience to others (resume, reports, interviews, & conversations).
30.4%34.8% 26.1% 0.0% 8.7%
8. recommended NMU’s SLFP to others. 50.0% 22.7% 9.1% 4.5% 13.6%
OVERALL IMPACT Great impact
Moderate impact
Slight impact
Not certain
Not at all
9. As you look back on the SLFP now, please rank its overall impact on you.
56.5% 34.8% 8.7% 0.0% 0.0%

YES or NO Yes No
Is there and experience or opportunity you have had this year as a direct result of being in the SLFP while at NMU?
31.8% 68.2%
Did your acceptance into the SLFP change your university experience? 100.0% 0.0%
Were there learning experiences in the SLFP that you think all or many NMU students should have?
100.0% 0.0%
Did your participation in the SLFP while at NMU change your view of leadership in the community?
81.8% 18.2%
As a result of the SLFP, have you made any changes in your work or career plans?
45.5% 54.5%
Is there a part of the SLFP experience that you now think will make a long-term impact on your life?
97.6% 2.2%
NMU RECRUITMENT More Likely
No Difference
Less Likely
Does the existence of the SLFP affect your recommendation of NMU to other students?
77.3% 22.7% 0.0%
5-Year Follow-up (N=25)

What are your thoughts?• Circle into small discussion groups of 5 or so with those around you.
• Did anything we presented spur thoughts about what you are doing at your institution? (successfully or not)
• How about things you would like to be doing but have not begun yet?
• Please let the interests, needs, and expertise of your small group guide your discussion of leadership education and/or assessment.
• After a few minutes we will bring some key discussion items back for large group discussion.

Future Directions• Drop 1-year survey and use incentives and other ideas to increase
response rates of later surveys
• Use 20-year reunion celebration to collect new qualitative data on long-term impact perceptions
• Collaborating with our Institutional Research office to study retention, academic performance, matriculation, and job placement rates using matched sample comparison groups
• Do regression or structural equations analyses to explore relationships among predictor & outcome variables for theory development/testing.
• Collaborating with the NMU Foundation to study correlation with annual giving

“The Five Big Things” that Assessment has taught us about Leadership Education

Let’s Discuss
More Questions
Please