best practices in analytics and visualization: a case study
DESCRIPTION
Visualization and self-service analytics is changing how business users gather, process and consume data. In this session, see how organizations like yours are getting powerful results, and learn how to: · Create visualizations that drive discovery · Use visualizations to make your point and tell your story · Use underlying analytics to fuel your visualizations Tableau Zen Master Joe Mako, Director of Visual Analytics at Rosenblatt Securities, will show how visual analytics is having a huge impact in his organization. Using Alteryx with Tableau has made their data preparation and visualizations richer and faster, enabling them to have a bigger impact and to take on more analytical questions. See how Joe creates analytics applications and visualizations that rock in Tableau. FEATURED SPEAKERS: Joe Mako Director of Visual Analytics Rosenblatt Securities Paul Lilford Channel Director, Technology Partners Tableau Software Brian Dirking Director of Product Marketing AlteryxTRANSCRIPT
1© 2013 Alteryx, Inc.
Best Practices in Analytics and Visualization – A Case Study
2© 2013 Alteryx, Inc.
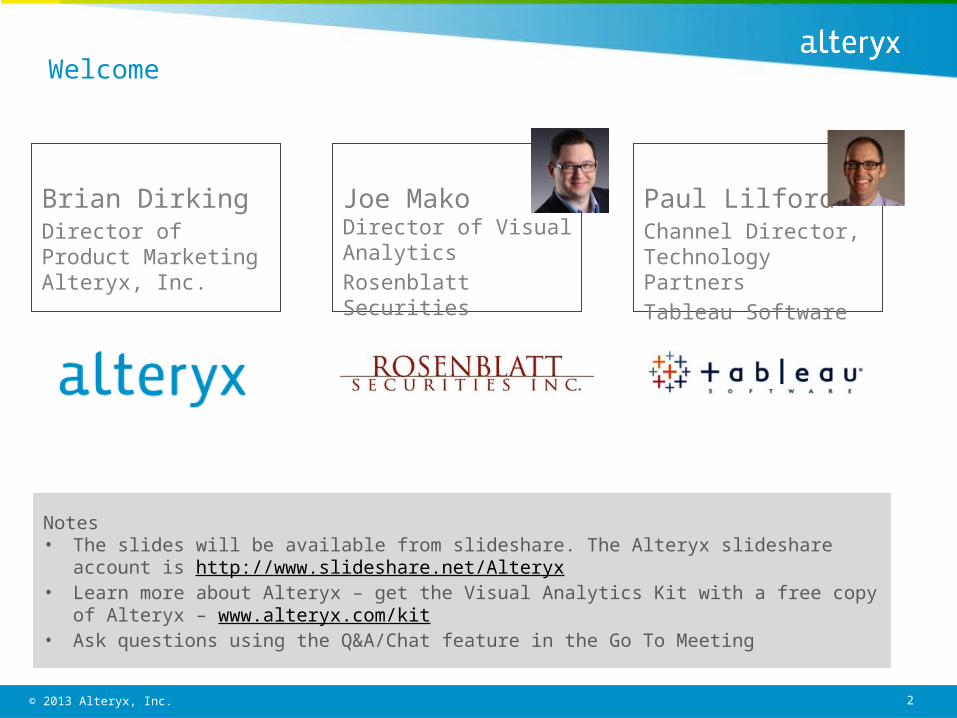
Welcome
Brian DirkingDirector of Product MarketingAlteryx, Inc.
Paul LilfordChannel Director, Technology PartnersTableau Software
Notes• The slides will be available from slideshare. The Alteryx slideshare account is http://
www.slideshare.net/Alteryx• Learn more about Alteryx – get the Visual Analytics Kit with a free copy of Alteryx –
www.alteryx.com/kit• Ask questions using the Q&A/Chat feature in the Go To Meeting
Joe MakoDirector of Visual AnalyticsRosenblatt Securities
3© 2013 Alteryx, Inc.
Join the Conversation!
Our partners at InterWorks are monitoring this hashtag during the webinar
#AlteryxLive
Tweet!

4© 2013 Alteryx, Inc.
Data Analysts Love Alteryx & Tableau Together

5© 2013 Alteryx, Inc.
The information contained in this communication is not intended as an offer or solicitation for the purchase or sale of any securities, futures, options, or any other investment product. This communication is not research, and does not contain enough information on which to make an investment decision. The information herein has been obtained from various sources. We do not guarantee its accuracy. Any opinion offered herein reflects Rosenblatt Securities Inc. current judgment and may change without notice.
Disclaimer

6© 2013 Alteryx, Inc.
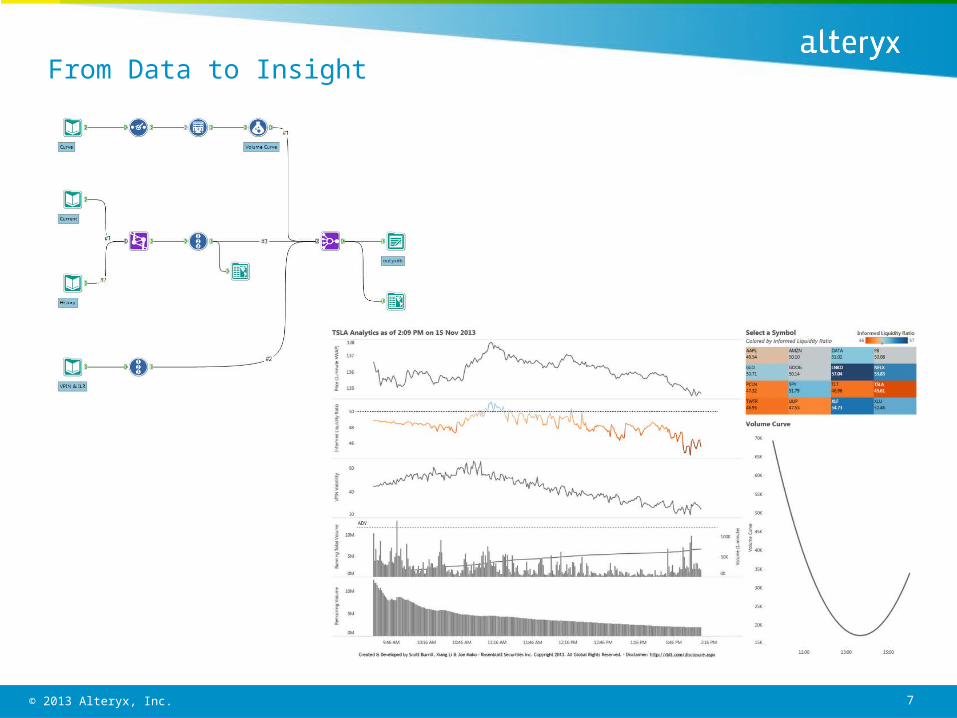
Visualization at Rosenblatt Securities
More at: https://twitter.com/RbltScott
7© 2013 Alteryx, Inc.
From Data to Insight

8© 2013 Alteryx, Inc.
Survey Results Before and After
Blog post: http://www.datarevelations.com/mostly-monthly-makeover-utah-state-university-survey-of-student-engagement.html

9© 2013 Alteryx, Inc.
Cycle of Visual Analysis
Source: http://www.tableausoftware.com/videos/zen

10© 2013 Alteryx, Inc.
Get your free Visual Analytics Kit (includes FREE Alteryx Project
Edition)www.alteryx.com/kit
Next Steps
Download Tableau Trial Editionwww.tableausoftware.com/trial

11© 2013 Alteryx, Inc.
• Visualization• Data blending• Data integration• Data analyst• Data enrichment• Business analyst• Data cleansing• Deep analytics• Strategic
analytics• Statistical
analytics• Predictive
analytics
Key Terms
• Rosenblatt Securities• Alteryx• Tableau Software• Tableau 8• Strategic Analytics• Big Data Analytics• Joe Mako•Paul Lilford•Brian Dirking