best progress monitoring method for infrastructure...
TRANSCRIPT
(Pipeline, Highway, Tunnel, Railway, and Bridge Projects)
Best Progress Monitoring Method for Infrastructure Projects
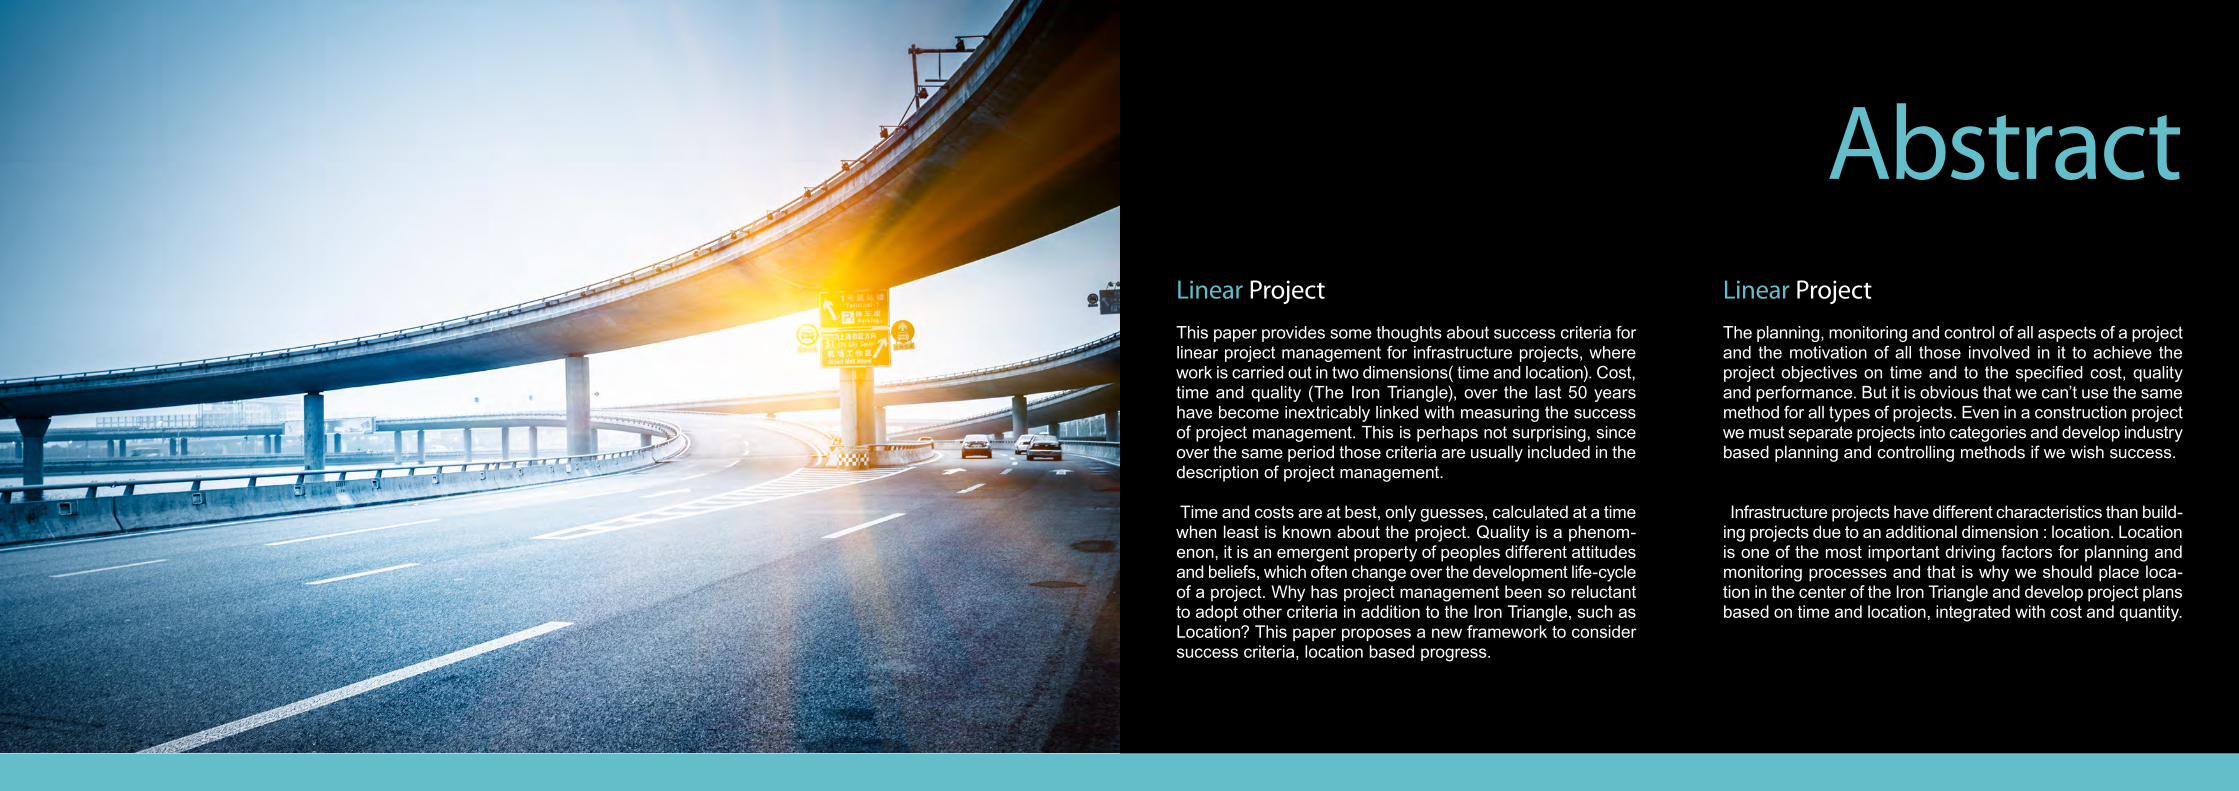
AbstractLinear ProjectThis paper provides some thoughts about success criteria for linear project management for infrastructure projects, where work is carried out in two dimensions( time and location). Cost, time and quality (The Iron Triangle), over the last 50 years have become inextricably linked with measuring the success of project management. This is perhaps not surprising, since over the same period those criteria are usually included in the description of project management.
Time and costs are at best, only guesses, calculated at a time when least is known about the project. Quality is a phenom-enon, it is an emergent property of peoples different attitudes and beliefs, which often change over the development life-cycle of a project. Why has project management been so reluctant to adopt other criteria in addition to the Iron Triangle, such as Location? This paper proposes a new framework to consider success criteria, location based progress.
Linear ProjectThe planning, monitoring and control of all aspects of a project and the motivation of all those involved in it to achieve the project objectives on time and to the specified cost, quality and performance. But it is obvious that we can’t use the same method for all types of projects. Even in a construction project we must separate projects into categories and develop industry based planning and controlling methods if we wish success.
Infrastructure projects have different characteristics than build-ing projects due to an additional dimension : location. Location is one of the most important driving factors for planning and monitoring processes and that is why we should place loca-tion in the center of the Iron Triangle and develop project plans based on time and location, integrated with cost and quantity.
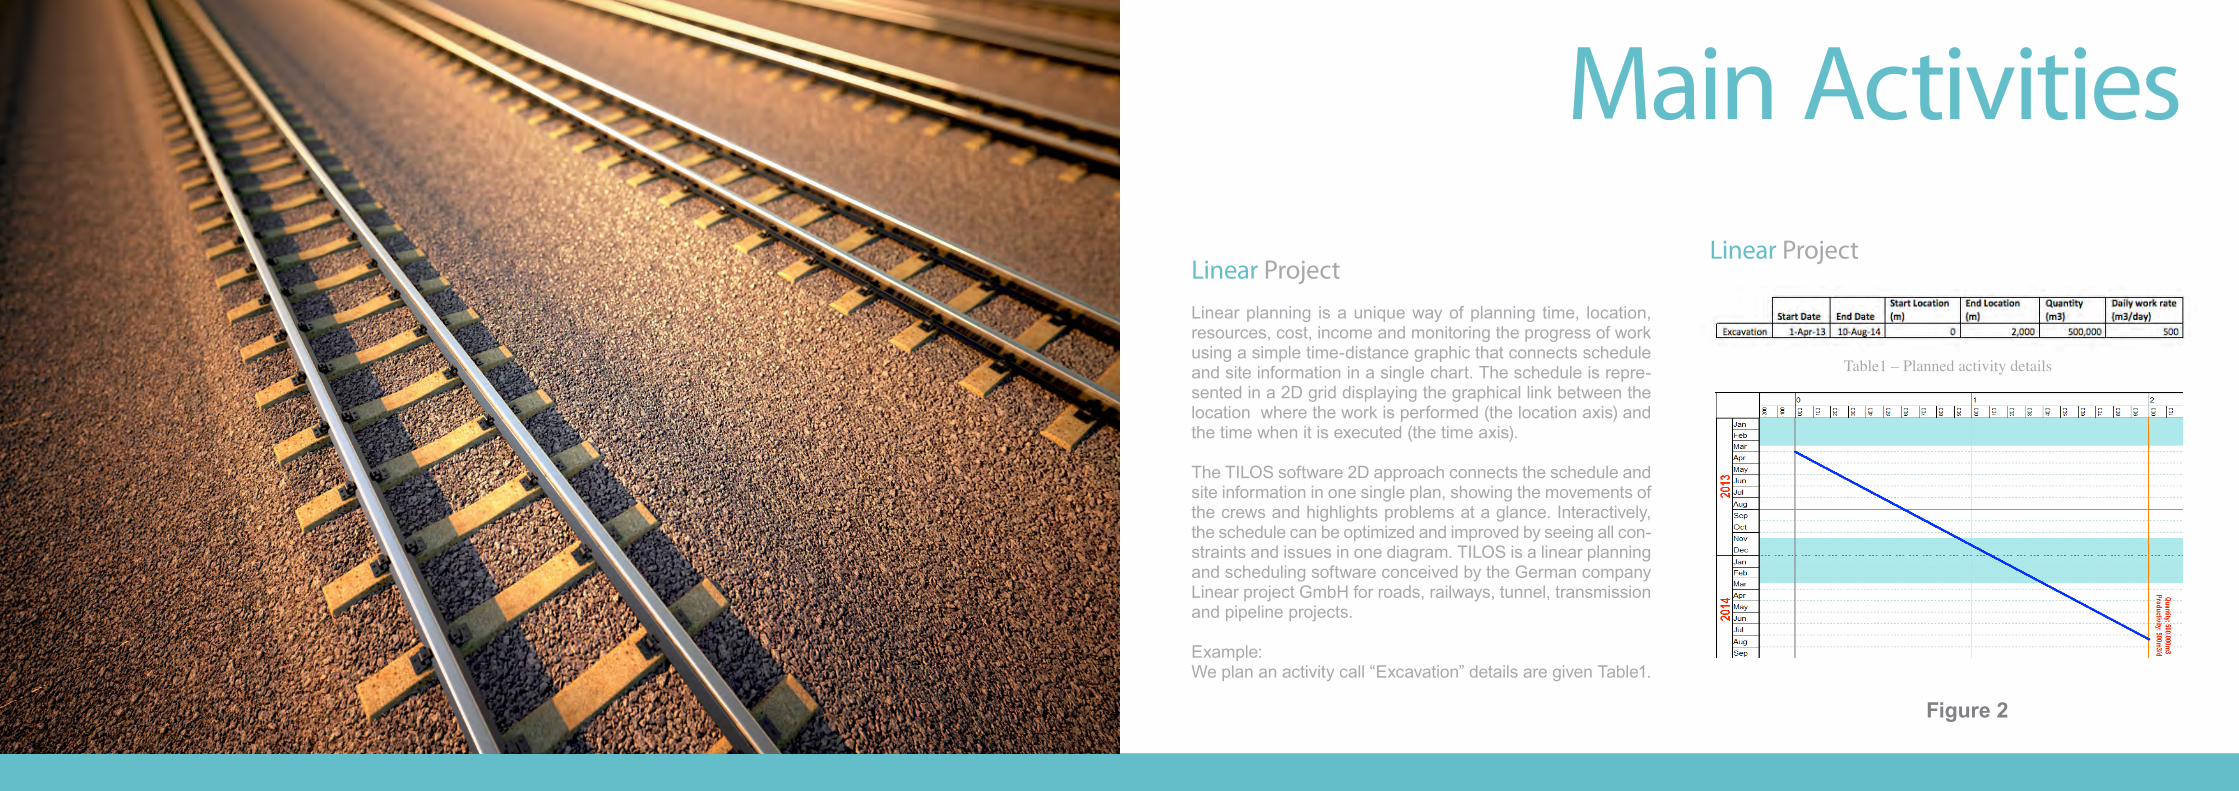
Main ActivitiesLinear ProjectLinear planning is a unique way of planning time, location, resources, cost, income and monitoring the progress of work using a simple time-distance graphic that connects schedule and site information in a single chart. The schedule is repre-sented in a 2D grid displaying the graphical link between the location where the work is performed (the location axis) and the time when it is executed (the time axis).
The TILOS software 2D approach connects the schedule and site information in one single plan, showing the movements of the crews and highlights problems at a glance. Interactively, the schedule can be optimized and improved by seeing all con-straints and issues in one diagram. TILOS is a linear planning and scheduling software conceived by the German company Linear project GmbH for roads, railways, tunnel, transmission and pipeline projects.
Example: We plan an activity call “Excavation” details are given Table1.
Linear Project
Table1 – Planned activity details
Figure 2
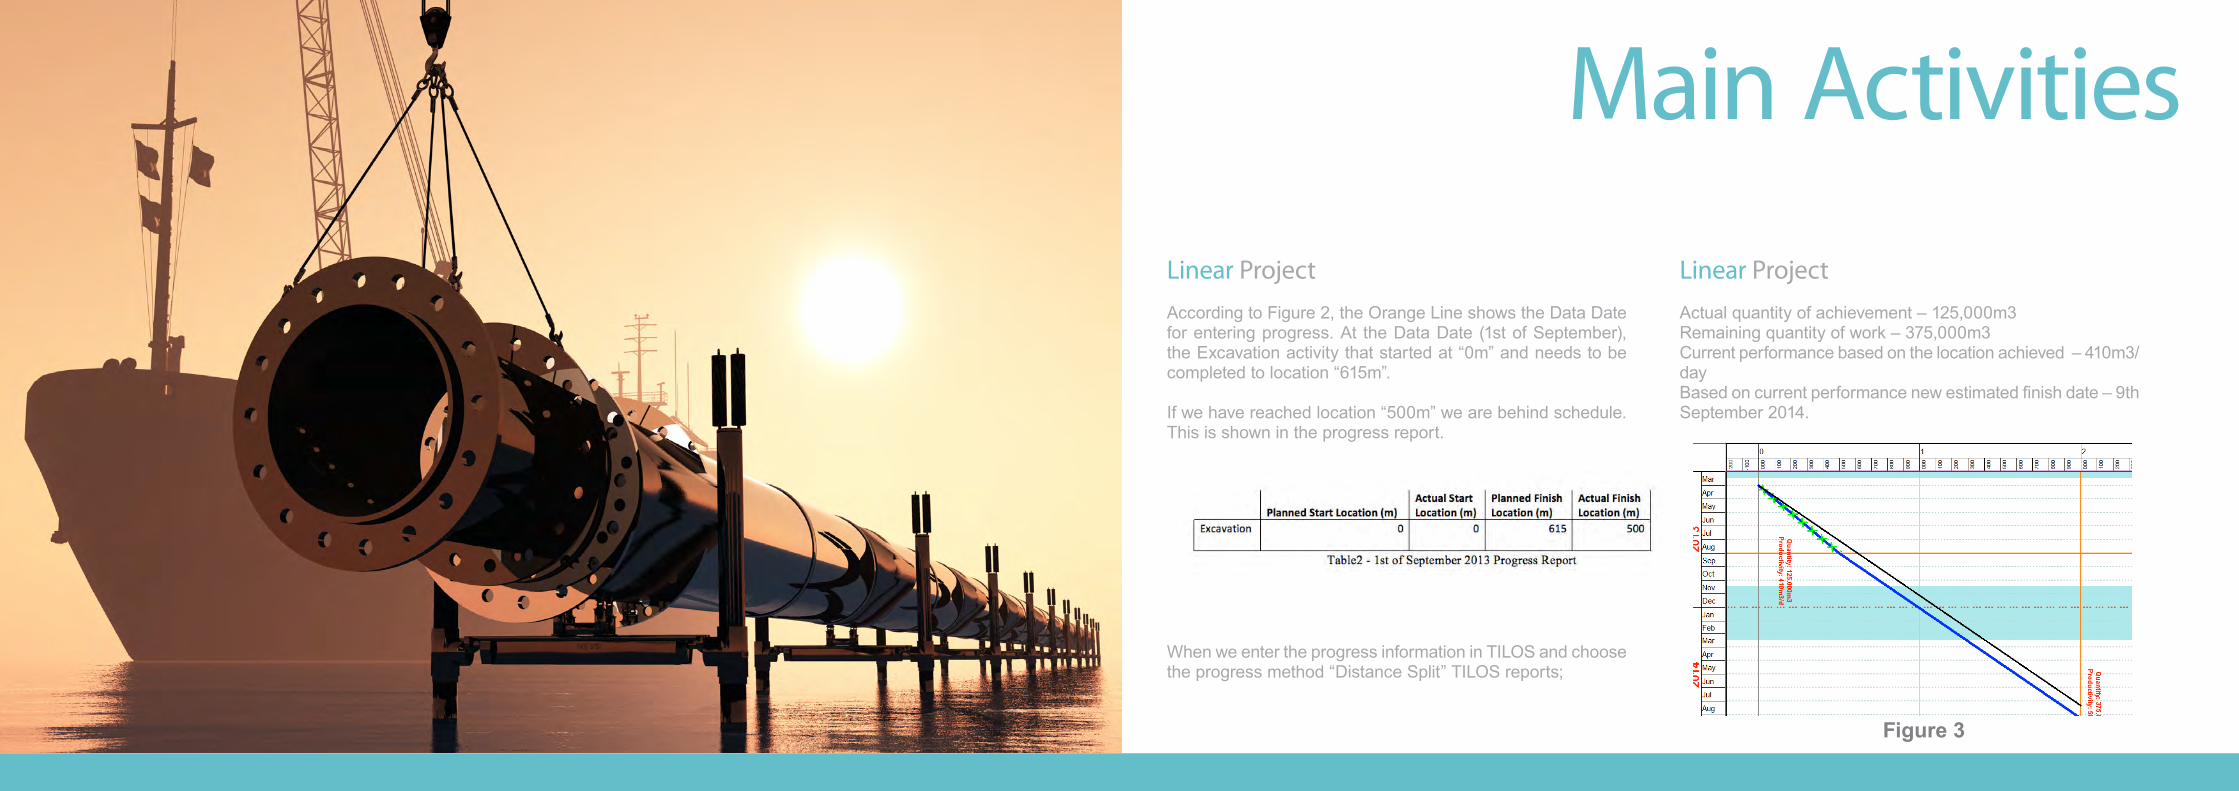
Main Activities Linear ProjectAccording to Figure 2, the Orange Line shows the Data Date for entering progress. At the Data Date (1st of September), the Excavation activity that started at “0m” and needs to be completed to location “615m”.
If we have reached location “500m” we are behind schedule. This is shown in the progress report.
When we enter the progress information in TILOS and choose the progress method “Distance Split” TILOS reports;
Linear ProjectActual quantity of achievement – 125,000m3Remaining quantity of work – 375,000m3Current performance based on the location achieved – 410m3/dayBased on current performance new estimated finish date – 9th September 2014.
Figure 3
Main Activities Linear ProjectFigure 3 – Current performance vs. Baseline. (Black Line is Baseline). The line adourned with green crosses shows com-pleted part of project.
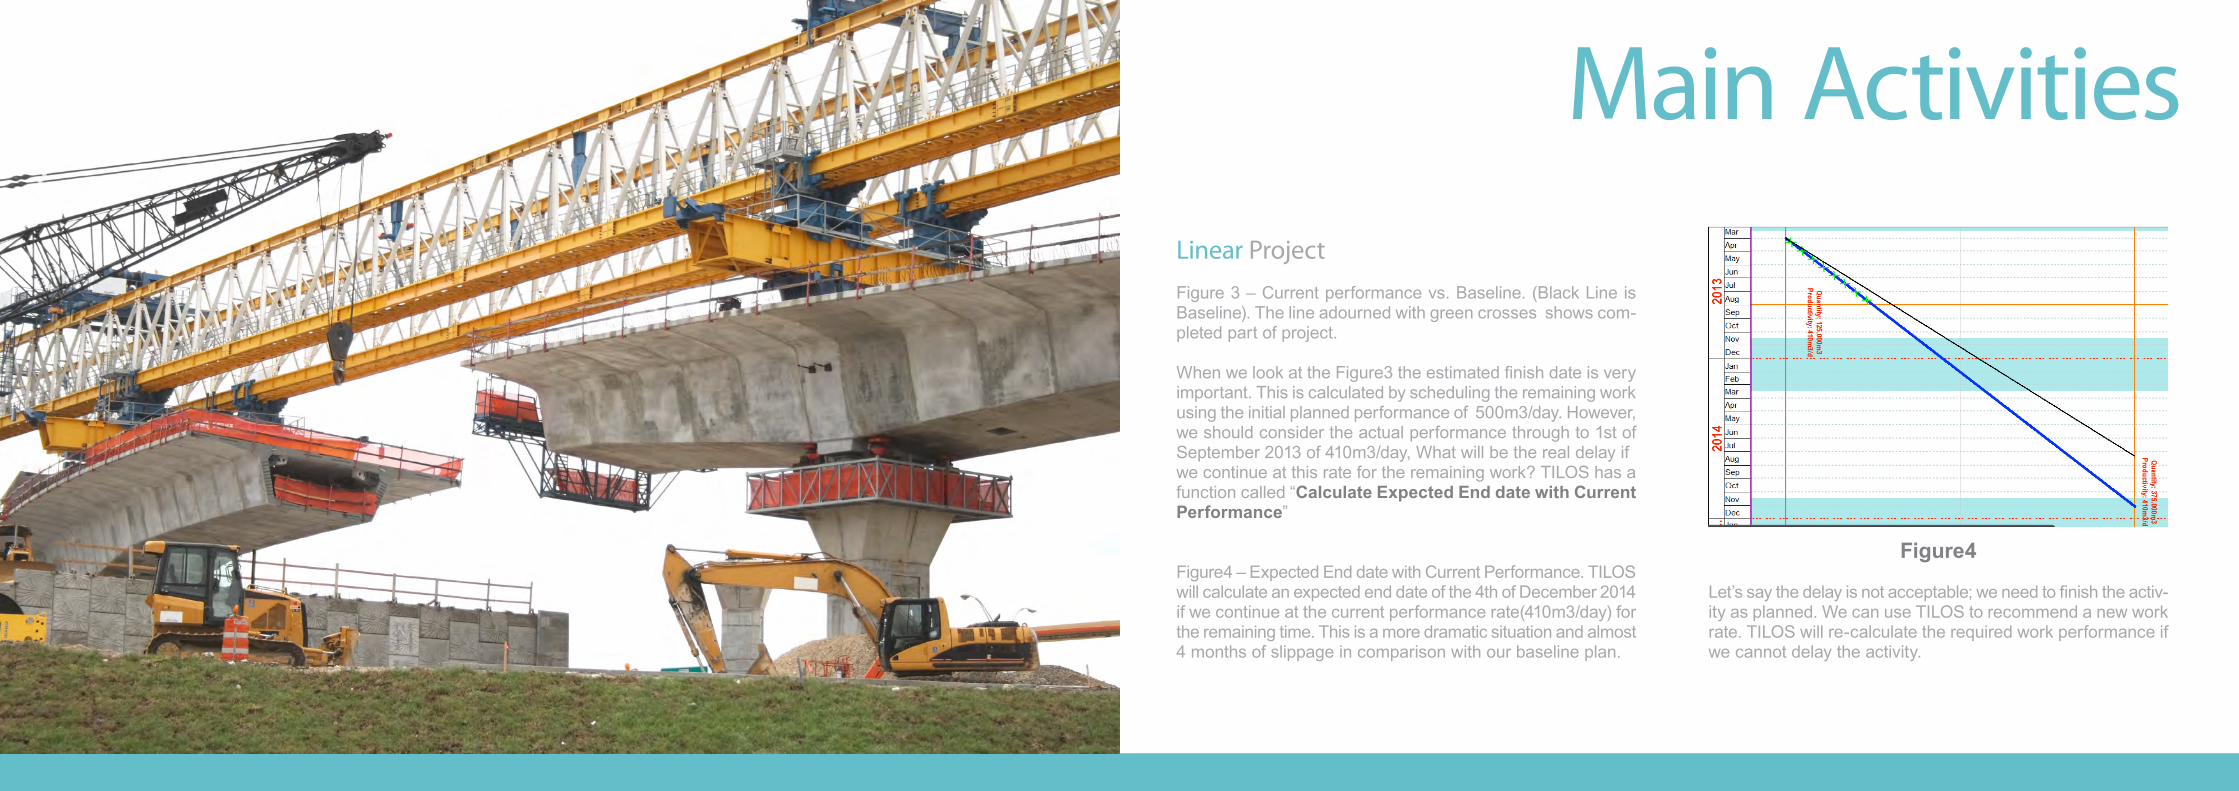
When we look at the Figure3 the estimated finish date is very important. This is calculated by scheduling the remaining work using the initial planned performance of 500m3/day. However, we should consider the actual performance through to 1st of September 2013 of 410m3/day, What will be the real delay ifwe continue at this rate for the remaining work? TILOS has a function called “Calculate Expected End date with Current Performance”
Figure4 – Expected End date with Current Performance. TILOS will calculate an expected end date of the 4th of December 2014 if we continue at the current performance rate(410m3/day) for the remaining time. This is a more dramatic situation and almost 4 months of slippage in comparison with our baseline plan.
Figure4
Let’s say the delay is not acceptable; we need to finish the activ-ity as planned. We can use TILOS to recommend a new work rate. TILOS will re-calculate the required work performance if we cannot delay the activity.
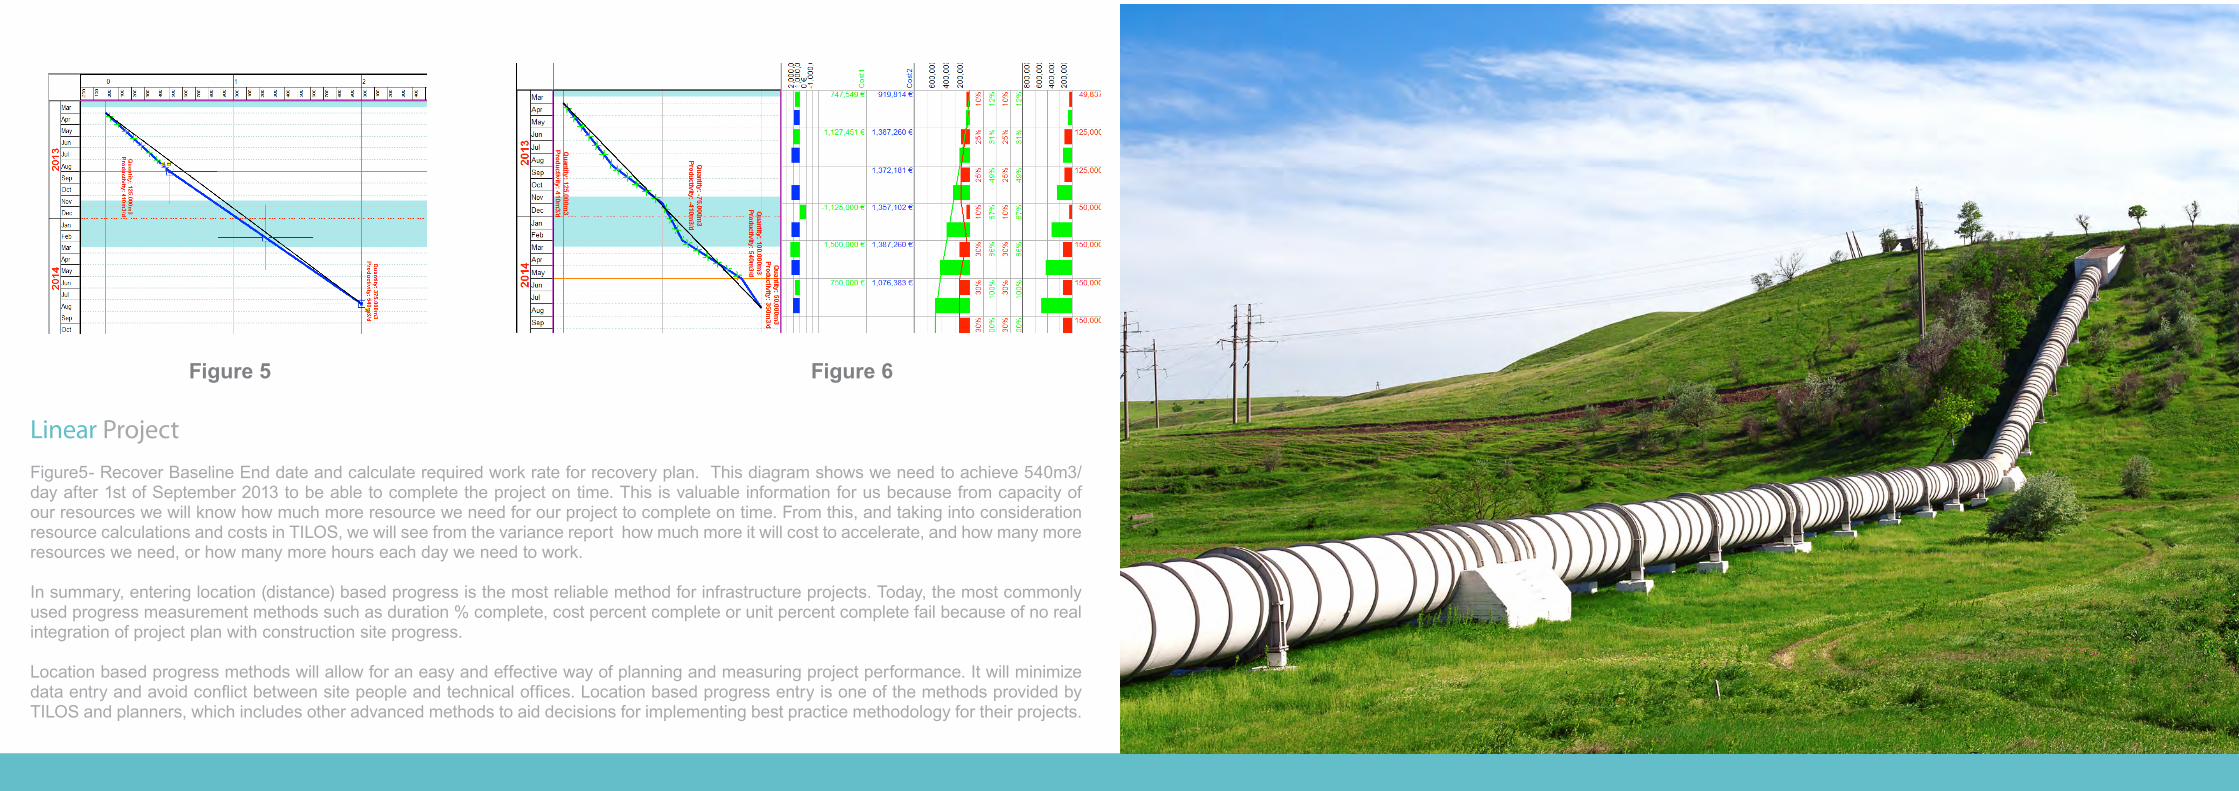
Linear ProjectFigure5- Recover Baseline End date and calculate required work rate for recovery plan. This diagram shows we need to achieve 540m3/day after 1st of September 2013 to be able to complete the project on time. This is valuable information for us because from capacity of our resources we will know how much more resource we need for our project to complete on time. From this, and taking into consideration resource calculations and costs in TILOS, we will see from the variance report how much more it will cost to accelerate, and how many more resources we need, or how many more hours each day we need to work.
In summary, entering location (distance) based progress is the most reliable method for infrastructure projects. Today, the most commonly used progress measurement methods such as duration % complete, cost percent complete or unit percent complete fail because of no real integration of project plan with construction site progress.
Location based progress methods will allow for an easy and effective way of planning and measuring project performance. It will minimize data entry and avoid conflict between site people and technical offices. Location based progress entry is one of the methods provided by TILOS and planners, which includes other advanced methods to aid decisions for implementing best practice methodology for their projects.
Figure 5 Figure 6

”Tekin is a Project Management Consultant with a 15-year service record, who has provided project management consulting services for more than 280 organizations in different sectors including Highway, Metro, Pipeline, Railway, Transmission, Bridge & Tunnel project more 40 different Countries.
Tekin is the CEO and Founder of FND Future Network Development (International Global Solution Provider of TILOS).
TEKİN GÜVERCİNCEO and Founder of FND Future Network Development
TVASTARENGINEERING SOLUTIONSF1/32, DLF Phase -1 Gurgaon - 122002 [email protected]
Phone:- +91 - 124 - 4011987Email:[email protected]:-www.tvastar.in