best wa ter managem ent and cl eaner pr odu … · phma pakistan hosiery manufacturing association...
TRANSCRIPT

C L
CIT
W
B E
L E A N
TYWIDE
WATER ST
S T W A
E R P R
I N D U
E PARTNE
TEWARD
A T E R
R O D U
S T R I
ERSHIPE
DSHIP IN
M A N
U C T I O
E S I N
DRAFT
JUNE 201
E FOR SU
N SMEs I
A G E M
N P R
N P A K
13
USTAINA
N LAHOR
M E N T
A C T I C
K I S T A
ABLE WA
RE, PAKI
A N D
C E S F
A N
ATER USE
ISTAN -
F O R
E AND
WSP

Citywide Partnership for Sustainable Water Use and Water Stewardship in SMEs in Lahore, Pakistan – WSP
Better Water Management & Cleaner Production Practices in Major Industrial Sector of Pakistan
2
TABLE OF CONTENTS
TABLE OF CONTENTS ..................................................................................................................................... 2
LIST OF TABLES .............................................................................................................................................. 6
LIST OF FIGURES ............................................................................................................................................ 7
LIST OF ABBREVIATIONS AND ACRONYMS ................................................................................................... 8
INTRODUCTION ............................................................................................................................. 10
1.1 BACKGROUND ............................................................................................................................. 10
1.2 THE PROJECT ............................................................................................................................... 11
1.3 OBJECTIVES ................................................................................................................................. 11
1.3.1 Overall objective ...................................................................................................................... 11
1.3.2 Specific objectives ................................................................................................................... 11
1.4 STRUCTURE OF THE STUDY ......................................................................................................... 12
INDUSTRIAL WATER CONSUMPTION AND EXPECTED WATER RISKS ... 13
2.1 WATER USE IN INDUSTRIAL SECTOR ........................................................................................... 13
2.2 WATER USE EFFICIENCY .............................................................................................................. 14
2.3 WASTEWATER DISCHARGES ....................................................................................................... 14
2.4 EXPECTED WATER RISKS TO INDUSTRIAL SECTOR ...................................................................... 15
LEATHER SECTOR ........................................................................................................................ 17
3.1 GEOGRAPHICAL LOCATION ......................................................................................................... 17
3.2 LEATHER SECTOR PRODUCTION ................................................................................................. 18
3.3 WATER CONSUMPTION .............................................................................................................. 19
3.4 WASTEWATER POLLUTION ......................................................................................................... 20
3.4.1 Wastewater characteristics ..................................................................................................... 20
3.4.2 Wastewater quantities ............................................................................................................ 20
3.5 BEST AVAILABLE RESOURCE CONSERVATION TECHNIQUES....................................................... 20
3.5.1 Efficient use of water .............................................................................................................. 21
3.5.2 Use drums instead of pits and puddles ................................................................................... 21
3.5.3 Batch washing in drums .......................................................................................................... 22
3.5.4 Modifying existing equipments for short floats – short float technique ................................ 22
3.5.5 Modern equipment for short floats ........................................................................................ 22
3.5.6 Maintenance of equipments ................................................................................................... 22
3.5.7 Reuse of wastewater for less critical processes ...................................................................... 22
3.5.8 Partial salt elimination ............................................................................................................. 23
3.5.9 Hair saving unhairing‐liming methods .................................................................................... 23
3.5.10 Direct recycling of lime liquors ................................................................................................ 23
3.5.11 CO2 de‐liming ........................................................................................................................... 23
3.5.12 Recycling of pickling liquor ...................................................................................................... 24

Citywide Partnership for Sustainable Water Use and Water Stewardship in SMEs in Lahore, Pakistan – WSP
Better Water Management & Cleaner Production Practices in Major Industrial Sector of Pakistan
3
3.5.13 Recycling of chrome tanning floats ......................................................................................... 24
3.5.14 Chrome recovery through precipitation and separation ........................................................ 25
3.6 FEASIBLE TECHNIQUES FOR LOCAL INDUSTRIES ........................................................................ 25
PULP AND PAPER SECTOR...................................................................................................... 27
4.1 GEOGRAPHICAL LOCATION ......................................................................................................... 27
4.2 PRODUCTION PROCESS .............................................................................................................. 27
4.3 PAPER SECTOR PRODUCTION ..................................................................................................... 28
4.4 WASTEWATER POLLUTION ......................................................................................................... 29
4.4.1 Sources .................................................................................................................................... 29
4.4.2 Wastewater characteristics ..................................................................................................... 30
4.5 BEST AVAILABLE RESOURCE CONSERVATION TECHNIQUES....................................................... 30
4.5.1 Good housekeeping measures (GHM) .................................................................................... 30
4.5.2 Use of better pulp washing technology .................................................................................. 31
4.5.3 Carbon‐dioxide brown stock washing ..................................................................................... 32
4.5.4 Alternative bleaching techniques ............................................................................................ 32
4.5.5 Optimum use of cooling wastewater ...................................................................................... 33
4.5.6 Recovery and re‐cycling of clean water from vacuum pumps ................................................ 33
4.5.7 Replacement of water seals in process pumps ....................................................................... 34
4.5.8 Installation of water efficient showers at paper machines ..................................................... 34
4.5.9 Use of efficient decker thickener/vacuum drums showers .................................................... 34
4.5.10 Use of high pressure low volume showers .............................................................................. 35
4.5.11 Use of self‐cleaning showers in paper machine section ......................................................... 35
4.5.12 Improving white water quality ................................................................................................ 35
4.5.13 Installation of medium consistency pulp screening equipment ............................................. 36
4.5.14 Recycling of chlorine wash backwater completely into the system ....................................... 36
4.5.15 Dry‐cleaning of wheat straw ................................................................................................... 36
4.5.16 Reuse of wet‐cleaning wastewater ......................................................................................... 37
4.5.17 Dry and wet cleaning of straw ................................................................................................. 37
4.5.18 Disc cutter for removal of non‐cellulosic material from straws .............................................. 37
4.5.19 Fiber recovery by dissolved air floatation ............................................................................... 37
4.5.20 Extraction of black liquor using screw press ........................................................................... 38
4.5.21 Oxygen delignification for agro‐based pulp ............................................................................ 38
4.5.22 De‐fiberisation of agro‐based pulp as alkaline hot stock refining........................................... 38
4.6 FEASIBLE TECHNIQUES FOR LOCAL INDUSTRIES ........................................................................ 38
TEXTILE PROCESSING SECTOR ......................................................................................... 40
5.1 GEOGRAPHICAL LOCATION ......................................................................................................... 40
5.2 TEXTILE PROCESSING SECTOR PRODUCTION ............................................................................. 42
5.3 WATER CONSUMPTION .............................................................................................................. 42

Citywide Partnership for Sustainable Water Use and Water Stewardship in SMEs in Lahore, Pakistan – WSP
Better Water Management & Cleaner Production Practices in Major Industrial Sector of Pakistan
4
5.4 WASTEWATER POLLUTION ......................................................................................................... 43
5.4.1 Wastewater pollution characteristics at unit level ................................................................. 43
5.4.2 Wastewater quantities ............................................................................................................ 44
5.5 BEST AVAILABLE RESOURCE CONSERVATION TECHNIQUES....................................................... 44
5.5.1 Good housekeeping and management measures ................................................................... 45
5.5.2 Counter‐current washing/rinsing ............................................................................................ 45
5.5.3 Reuse of process water ........................................................................................................... 45
5.5.4 Reuse of non‐contact cooling water ....................................................................................... 45
5.5.5 Reuse of condensate water ..................................................................................................... 46
5.5.6 Process modifications .............................................................................................................. 46
5.5.7 Automatic control systems ...................................................................................................... 46
5.5.8 Raw materials control ............................................................................................................. 47
5.5.9 Chemical optimization and substitution ................................................................................. 47
5.5.10 Dye fixation improvement ....................................................................................................... 48
5.5.11 Printing process modification .................................................................................................. 48
5.5.12 Reuse‐recycle‐recovery ........................................................................................................... 48
5.5.13 Reuse of hot wastewater ........................................................................................................ 48
5.6 FEASIBLE TECHNIQUES FOR LOCAL INDUSTRIES ........................................................................ 48
SUGAR SECTOR ............................................................................................................................... 51
6.1 GEOGRAPHICAL LOCATION ......................................................................................................... 51
6.2 SUGAR SECTOR PRODUCTION .................................................................................................... 53
6.3 WATER CONSUMPTION .............................................................................................................. 53
6.4 WASTEWATER POLLUTION ......................................................................................................... 54
6.4.1 Wastewater characteristics ..................................................................................................... 54
6.4.2 Wastewater quantities ............................................................................................................ 54
6.5 BEST AVAILABLE RESOURCE CONSERVATION TECHNIQUES....................................................... 55
6.5.1 Floor washing and cleaning with low quality water ................................................................ 55
6.5.2 Reduce water consumption for cooling of evaporators ......................................................... 55
6.5.3 Reduce water consumption at spray ponds ............................................................................ 56
6.5.4 Closed water circuit system .................................................................................................... 56
6.5.5 General housekeeping and CP measures ................................................................................ 57
6.5.6 Proper monitoring and timely maintenance ........................................................................... 57
6.5.7 Operational optimization and water reuse ............................................................................. 57
6.5.8 Condensation process innovation ........................................................................................... 58
6.5.9 Substitution of lead acetate .................................................................................................... 58
6.5.10 Discharge reduction and recovery of NaOH during washing & cleaning ................................ 58
6.5.11 Controlled Blowdowns ............................................................................................................ 59
6.6 FEASIBLE TECHNIQUES FOR LOCAL INDUSTRIES ........................................................................ 59

Citywide Partnership for Sustainable Water Use and Water Stewardship in SMEs in Lahore, Pakistan – WSP
Better Water Management & Cleaner Production Practices in Major Industrial Sector of Pakistan
5
REFERENCES ................................................................................................................................................ 61

Citywide Partnership for Sustainable Water Use and Water Stewardship in SMEs in Lahore, Pakistan – WSP
Better Water Management & Cleaner Production Practices in Major Industrial Sector of Pakistan
6
LIST OF TABLES
TABLE 2.1: ESTIMATED INDUSTRIAL WASTEWATER POLLUTION LOADS IN PAKISTAN 15
TABLE 2.2: EXPECTED WATER RISKS 15
TABLE 2.3: INDUSTRY AND BASIN RELATED RISKS 16
TABLE 3.1: PRODUCTION LEVELS OF LEATHER INDUSTRY 18
TABLE 3.2: LEATHER SECTOR PRODUCTION 18
TABLE 3.3: LEATHER SECTOR PRODUCTION 19
TABLE 3.4: PROCESS WISE WATER CONSUMPTION CONTRIBUTION 19
TABLE 3.5: POLLUTION CHARACTERISTICS OF TANNERY EFFLUENT 20
TABLE 4.1: PAKISTAN PAPER AND PAPERBOARD PRODUCTION 29
TABLE 4.2: PAPER AND PAPERBOARD PRODUCTION 29
TABLE 4.3: WASTEWATER CHARACTERISTIC 30
TABLE 4.4: WASTEWATER GENERATION RATE 30
TABLE 5.1: INTRA CITY DISTRIBUTION OF TEXTILE PROCESSING UNITS 42
TABLE 5.2: WATER CONSUMPTION IN TEXTILE INDUSTRIES 43
TABLE 5.3: CHARACTERISTICS OF WOVEN TEXTILE PROCESSING WASTEWATER 43
TABLE 5.4: CHARACTERISTICS OF KNITWEAR PROCESSING WASTEWATER 44
TABLE 5.5: UNIT WASTEWATER GENERATION 44
TABLE 5.6: REDUCING BOD AT SOURCE BY POSSIBLE CHEMICAL SUBSTITUTIONS 47
TABLE 6.1: SUGAR MILLS IN PAKISTAN 51
TABLE 6.2: PAKISTAN SUGAR INDUSTRY SIZE 53
TABLE 6.3: SUGARCANE CRUSHED AND SUGAR RECOVERY IN PAKISTAN 53
TABLE 6.4: PROVINCE WISE PRODUCTION OF SUGAR IN PAKISTAN 53
TABLE 6.5: WASTEWATER SOURCES IN SUGAR MILLS 54
TABLE 6.6: WASTEWATER CHARACTERISTICS 54

Citywide Partnership for Sustainable Water Use and Water Stewardship in SMEs in Lahore, Pakistan – WSP
Better Water Management & Cleaner Production Practices in Major Industrial Sector of Pakistan
7
LIST OF FIGURES
FIGURE 3.1: LOCATION OF LEATHER UNITS 17
FIGURE 3.2: DISTRICT WISE DISTRIBUTION OF UNITS IN PUNJAB 18
FIGURE 4.1: LOCATION OF PULP & PAPER MILLS IN PUNJAB 28
FIGURE 4.2: DISTRICT WISE DISTRIBUTION OF 14 UNITS IN PUNJAB 28
FIGURE 5.1: PRESENCE OF TEXTILE PROCESSING INDUSTRIES IN PUNJAB 41
FIGURE 5.2: LOCATION OF TEXTILE PROCESSING INDUSTRIES IN PUNJAB 41
FIGURE 6.1: LOCATION OF SUGAR MILLS IN PUNJAB 52
FIGURE 6.2: DISTRICT WISE LOCATION OF SUGAR INDUSTRIES 52

Citywide Partnership for Sustainable Water Use and Water Stewardship in SMEs in Lahore, Pakistan – WSP
Better Water Management & Cleaner Production Practices in Major Industrial Sector of Pakistan
8
LIST OF ABBREVIATIONS AND ACRONYMS
°C Degree Celsius
AOX Adsorbable Organohalogens
APTPMA Textile Processing Mills Association
BCM Billion Cubic Meter
BLC British Leather Center
BOD Biochemical Oxygen Demand
CO2 Carbon dioxide
COD Chemical Oxygen Demand
CPI and Cleaner Production Institute
CTP-KT Cleaner Technology Project for Korangi Tanneries
DAF Dissolved Air Floatation
ECF Elemental Chlorine Free
ETPI Environmental Technology Programme for Industries
g/l Gram per Liter
GDP Gross Domestic Products
H2SO4 Sulfuric Acid
HMC Heavy Mechanical Complex
ICPT Implementation of Cleaner Production Technologies in the Textile Sector of Pakistan
ICTP Introduction of Cleaner Technologies in the Tanneries Clusters of Punjab
IFC International Finance Corporation
LCCI Lahore Chamber of Commerce and Industry
m3 Meter Cube
m3/ton Cubic Meter per Ton
MAF Million Acre Feet
mg/l Milligram per Liter
MIGA Multilateral Investment Guarantee Agency
Mm3/d Million Meter Cube per Day
Mm3/y Million Meter Cube per Year
MNCs Multinational Companies
MT/y Million Ton per Year
MT/y Million Ton per Day
NaOH Sodium Hydroxide
NEQS National Environmental Quality Standards
NSSC Neutral Sodium Sulfite Ccooking
PEPA 1997 Pakistan Environmental Act 1997
PHMA Pakistan Hosiery Manufacturing Association
PISD Programme for Industrial Sustainable Development
PPPBMA Pakistan Pulp, Paper and Board Mills Association
PSMA Pakistan Sugar Mills Association
PSST Pakistan Society of Sugar Technologist
RSI Responsible Sourcing Initiative
SCP Sustainable Consumption and Production
SMEDA Small and Medium Enterprise Development Authority
SMEs Small and Medium Enterprises
TCF Total Chlorine Free

Citywide Partnership for Sustainable Water Use and Water Stewardship in SMEs in Lahore, Pakistan – WSP
Better Water Management & Cleaner Production Practices in Major Industrial Sector of Pakistan
9
TCMTB Thiocyanomethylthio Benzothiazole
TDS Total Dissolved Solids
TSS Total Suspended Solids
U.A.E. United Arab Emirates
UK United Kingdom.
UN United Nations
UNIDO United Nations Industrial Development Organization
USA United States of America
WSP City wide Partnership for Sustainable Water Use and Water Stewardship in SMEs in Lahore, Pakistan (WSP)
WWF-P World Wide Fund for Nature-Pakistan
WWF-UK World Wide Fund for Nature-UK

Citywide Partnership for Sustainable Water Use and Water Stewardship in SMEs in Lahore, Pakistan – WSP
Better Water Management & Cleaner Production Practices in Major Industrial Sector of Pakistan
10
1 INTRODUCTION
City Wide Partnership for Sustainable Water Use and Water Stewardship in SMEs in Lahore, Pakistan (WSP) is a three year (2013 to 2015) capacity building project under SWITCH-Asia program. WSP is directed to ensure the sustainable use of natural resources especially water, toxic materials and emission reduction of waste and pollutants over the life cycle of the Pakistani SMEs of textile, leather, pulp & paper and sugar sectors located in Punjab, to meet the of needs of future generations. This report is on national and international literature review of best water management & cleaner production practices for water consumption and wastewater pollution reduction, and is anticipated as the guidelines for designing the feasible water conservation and pollution load reduction techniques for SMEs of Lahore, Punjab.
1.1 BACKGROUND Water is one of the most valuable resources and the lifeblood for sustained economic development of any country. Pakistan, sixth largest country in the world with a population of 2.48%1 of the world's total population, is developing with high and medium growth rate of population and industrial activity respectively. United Nations (UN) reported that by the year 2050, Pakistan population will increase from 143 million in 2000 to 349 millions in 2050 as the fourth order of the world. For economic development, industrial Gross Domestic Products (GDP) at constant 1990 prices is gradually developing with 7.7 % growth rate in the past 10 years2. Industrial sector is playing important role in economy with ratio of 18.5% of GDP. Large scale and small scale manufacturing account for 12.2% and 4.9% of the total GDP of the country.3 Hasty urbanization and growing industrial units are showing increasing trend in water demands. The ground water table is going down due to unsustainable utilization of water resources. It is reported that 96% of available water is being used for agriculture, 2% for industrial and the remaining 2% is used by the domestic sector4. It is reported that industrial water demand in Pakistan will increase two times from 1.44 Billion Cubic Meter (BCM) in year 2002 to 2.88 BCM by the year 2025. Ministry of Water and Power (2004) reports that industrial water demand will increase by 1.6 times from 2.7 BCM in year 2000 to 4.3 BCM in year 2025. In the global context, Pakistan was already declared as “water scarce country” by Falkenmark index in 1992. By 2003, Pakistan’s per capita availability of water declined to the extent that it was categorized as a water-stress country by the World Bank, surpassing Ethiopia and on par with African countries such as
1 Rainwater Harvesting Potential ‐ A Contribution To Sustainable Water Management Strategy, Pakistan Water Operator Partnership, The Urban Unit Punjab, Pakistan’s Water Operators Partnership, 2013 2 Industrial and household water demand management, A Case Study of Pakistan, Kochi University of Technology, Kochi, Japan. 3 Finance Division E.A. Wing Government of Pakistan, “Pakistan Economic Survey 2009‐10”, Printing Cooperation Pakistan Press, 2010 4 Ibid 1

Citywide Partnership for Sustainable Water Use and Water Stewardship in SMEs in Lahore, Pakistan – WSP
Better Water Management & Cleaner Production Practices in Major Industrial Sector of Pakistan
11
Libya and Algeria. United Nations Development Programme estimates Pakistan’s current water availability as 1,090 m3 per capita per year. On the other hand, water scarcity is estimated to be 850 cubic meters in 2013 and will go on declining to 659 cubic meters per annum in 2025. Critical factors such as rapid population growth, climate change, reduction in the ice and snow areas of the Himalayas, urbanization, industrial growth, poverty, distribution inequalities, unsustainable water consumption practices, loss of ecosystems, more rapid runoff and bad management of water resources by the government have caused degradation of the resource base and laid huge stress on the quantity and quality of water resources. The gap between water supply and demand is sharply increasing and creating water shortages in almost all sectors of the economy5. There is now a strong and growing need to manage this precious resource more carefully and efficiently to ensure water for all on a sustainable basis. In order to boost the economy and to meet the future industrial water demand, Pakistan must take concrete steps towards water conservation measures along with efficient water management systems in line with resources available.
1.2 THE PROJECT City wide Partnership for Sustainable Water Use and Water Stewardship in SMEs in Lahore, Pakistan (WSP) is a three year capacity building project under SWITCH-ASIA. Its duration is from year 2013 to 2015. SWITCH-ASIA is the new regional environmental program in line with the EC (European Commission) Regional Paper for Assistance to Asia (2007-2013). The aim of this program is to promote the adoption of Sustainable Consumption and Production (SCP) among small and medium sized enterprises (SMEs) and consumer groups in Asia. WSP is funded by the European Union. It is being executed by the consortium of three organizations i.e. World Wide Fund for Nature-Pakistan (WWF-P), World Wide Fund for Nature-UK (WWF-UK) and Cleaner Production Institute (CPI). Lahore Chamber of Commerce and Industry (LCCI) is the associate of the project. The project is directed to the Pakistani SMEs of textile, leather, pulp & paper and sugar sectors located in Punjab and seeks to ensure minimal use of natural resources, toxic materials and emission reduction of waste and pollutants over the life cycle so that the needs of the future generations are not compromised.
1.3 OBJECTIVES
1.3.1 Overall objective By 2025 water efficient production and consumption predominates as best practice in Pakistan’s major industrial cities as part of a broad engagement of business in water management, contributing to improved environmental sustainability and poverty reduction within the context of sustainable development.
1.3.2 Specific objectives The specific objectives of the project are to:
5 Impact of water scarcity on food security at micro level in Pakistan, Fahim, Muhammad Amir January 2012, MPRA

Citywide Partnership for Sustainable Water Use and Water Stewardship in SMEs in Lahore, Pakistan – WSP
Better Water Management & Cleaner Production Practices in Major Industrial Sector of Pakistan
12
Reduce the water consumption by at least 15% and pollution load by 15% in 25 water intensive SMEs in Lahore by 2015
Increase the capacity of 75 cross sectoral water intensive SMEs to adopt or support more sustainable water management practices by 2015.
Enhance understanding and knowledge of further 300 SMEs regarding impacts of unsustainable water use and wider community level benefits of better water stewardship
Develop a multi-stake holder city wide partnership, comprising SMEs, public authorities, Ravi Commission, supporting institutions and Multinational Companies (MNCs) by 2015
Share the lessons learned with policy makers and regionally through SWICTH-Asia network by 2015
1.4 STRUCTURE OF THE STUDY Chapter-1: This provides introduction to the project, its background and objectives. Chapter-2: Presents “Water Consumption and Expected Water Risks” presents the industrial water consumption, water efficiency and expected water risks to the industrial sector. Chapter-3 to 6: A detailed review of industrial sectors, worldwide best available water conservation and pollution reduction techniques and feasible techniques and locally implemented technology options for leather, pulp & paper, textile and sugar sector.

Citywide Partnership for Sustainable Water Use and Water Stewardship in SMEs in Lahore, Pakistan – WSP
Better Water Management & Cleaner Production Practices in Major Industrial Sector of Pakistan
13
2 INDUSTRIAL WATER CONSUMPTION AND
EXPECTED WATER RISKS
Industrial sector is of great importance for economic development around the world. It is historical fact that countries with strong industrial sectors have shown more economic growth and development as compared to others. Pakistan industrial sector is the second largest sector of the economy accounting for 25%6 of the GDP and 13%7 of total employment in Pakistan. This industrial sector is comprised of large, medium and small-scale units. Pakistan ranks forty-first in the world in factory output8. There are approximately 6,634 registered industries in Pakistan. The majority of these industries are located in Karachi and Central Punjab, with a cluster of large industries. Sugar mills are scattered in the sugarcane growing areas throughout Punjab and Sindh. The major industrial cities of Pakistan are: Karachi, Lahore, Faisalabad, Hyderabad, Multan, Gujranwalla, Sheikhupura, Sialkot, Kasur, Rawalpindi, and Peshawar. In Punjab, major industrial cities are Lahore, Faisalabad, Kasur and Sheikhupura. Industries located in Punjab mostly use ground water whereas in Sindh, industries located in Karachi and Hyderabad mostly use surface water.
2.1 WATER USE IN INDUSTRIAL SECTOR Pakistan’s industrial base is small and has yet to experience industrialization. Owing to its small industrial base, only 2% of the total water available including surface, groundwater and rain water after losses is consumed by industrial sector.9 Based on industrial data contained in Pakistan Statistical Yearbook 2001, water consumed in the process by major products is estimated as 1.18 MAF (1.452 BCM) per year. The industrial demand is expected to increase to 1.47 MAF (1.815 BCM) by 2011 and to 1.84 MAF (2.268 BCM) by 2025. Most of the industrial establishments use ground water and abstract it at their own expense. It is estimated that currently about 23,500 AF (29 MCM) of water is provided to industries through municipal water supplies.10 This implies that industrial water consumption has the potential to cause local level impacts on the groundwater resources by direct pumping of groundwater. The United Nations has placed Pakistan among the “water hotspots” of Asia-Pacific Region due to high water utilization which is deteriorating the water quality.
6 Pakistan Industrial Growth, The Rawalpindi Chamber of Commerce & Industry 7 Finance Division E.A. Wing Government of Pakistan, “Pakistan Economic Survey 2009‐10”, Printing Cooperation Pakistan Press, 2010 8 Pakistan Industrial Growth, The Rawalpindi Chamber Of Commerce & Industry 9 Government of Pakistan, “Economic Survey of Pakistan 2009‐10” 10 Pakistan Water Sector Strategy; Vol:5; October 2002; Ministry of Water and Power of the Chief Engineering Advisor/Chairman Federal Flood Commission

Citywide Partnership for Sustainable Water Use and Water Stewardship in SMEs in Lahore, Pakistan – WSP
Better Water Management & Cleaner Production Practices in Major Industrial Sector of Pakistan
14
Industrial sector, although consumes a small portion of water, is a contributor to water table draw-down in the industrial cities of Pakistan. Serious efforts are needed for water resources management otherwise absolute scarcity will disturb the water usage patterns leading to water risks to the industrial sector.
2.2 WATER USE EFFICIENCY Generally industries of Pakistan waste about 30-40% of consumed water due to poor practices during the production process.11 Karachi receives a share of water from the allocation for the Province of Sindh under the Water Accord 1991. In Karachi water scarcity is experienced by all. Municipal supplies are limited and not reliable. Industries in Karachi buy water from tankers to cover the shortfall caused by limited municipal supplies. Tanker water is many times more expensive than the municipal water. Owing to high price of water, industries in Karachi are about 30-40% more efficient in terms of unit water consumption as compared to those industries using groundwater elsewhere in the country. For example, tanneries in Karachi use 35-50 liters of water per kilogram of leather, whereas tanneries in Punjab use 70-100 liters of water per kilogram of leather. In the last ten years, most of the progressive industries in Pakistan have adopted water conservation practices and techniques.12 The main drivers for increasing the water efficiency for industry are; increasing energy costs of groundwater pumping, and reduced wastewater discharges owing to water conservation at industrial process level that leads to smaller treatment plants and consequently lower capital costs requirements.
2.3 WASTEWATER DISCHARGES In Pakistan, resource intensive industries use large amounts of water due to outdated and resource intensive production technologies consequently, contribute significantly to overall pollution levels with associated human impacts.
It is estimated that industry sector of Pakistan has discharged about 2,280 million m3 per annum in 2010 which will increase to 4,560 million m3 in 2025. Punjab represents about 63% of the total inland water discharges13.
Out of 6,634 registered industries about 1,228 (about 19% of the registered industrial units) are considered to be highly polluting. The major industries which discharge highly polluted water are textiles, chemicals, fertilizer, pulp & paper, pesticides, petroleum refining, paints, steel, and leather tanning.14 Less than 1% of wastewater is treated in urban areas, while the remainder is discharged directly into drains, streams, and rivers with sever impacts on downstream users.15 In most surface waters concentrations of Biochemical Oxygen Demand (BOD), Total Suspended Solids (TSS) and heavy metals in industrial wastewaters are higher than the National Environmental Quality Standards (NEQS) established under Pakistan Environmental Act 1997 (PEPA 1997).
11 Cleaner Production Institute database 12 Cleaner Production Institute database shows that about 120 textile‐processing mills, 80 sugar mills, 200 tanneries, and five pulp and paper mills have reduced water consumption in the range of 30‐50%. 13 Khan A. U., “Evaluation of Industrial Environmental Management of Pakistan”, The World Bank 2010 14 Ministry of Environment, “Pakistan Environmental Protection Act 1997”, Schedule 1: Category A Industries 15 Planning Commission‐Government of Pakistan, “Vision 2030”, 2007

Citywide Partnership for Sustainable Water Use and Water Stewardship in SMEs in Lahore, Pakistan – WSP
Better Water Management & Cleaner Production Practices in Major Industrial Sector of Pakistan
15
Indiscriminate discharges of wastewater to freshwater bodies and the sea have caused serious impacts to the environmental health of rivers and sea shores in Pakistan. WHO estimates that eight liters of freshwater is required to dilute every liter of grey (polluted) water in order to prevent harmful contamination.16 Table 2.1 presents the pollutant loads for the principal water quality parameters affected by the industrial sector of Pakistan. There are two ways to reduce the pollution load, one is end of the pipe treatment and second is cleaner production techniques. First one provides a practical and cost effective way of moving towards sustainability. Cleaner production techniques allows the producers to produce more with less-less raw material, less energy, less waste and thus, less environmental impact and greater sustainability. Table 2.1: Estimated Industrial Wastewater Pollution Loads in Pakistan
Year Wastewater Total BOD5 COD TDS
Mm3/y Mm3/d mg/l MT/y T/d mg/l MT/y T/d mg/l MT/y MT/d
2010 2,280 6.2 530
1.2 3,286 1,050
2.4 6,510 500
1.1 3,100
2025 4,560 12.5 2.4 6,625 4.8 13,125 2.3 6,250
Ref: Evaluation of Industrial Environmental Management of Pakistan, The World Bank 2010
It is estimated by the World Bank that industries represent about 51% of the total pollution load of Pakistan.
2.4 EXPECTED WATER RISKS TO INDUSTRIAL SECTOR Industrial sector needs water that is reachable, reliable and of acceptable quality for its operations. Water shortage and deteriorating quality will pose significant risks to the industrial sectors. These risks might be in the form of physical, regulatory and reputational. Table 2.2 shows the details of the risks: Table 2.2: Expected Water Risks
Type of Risk Detail
Physical risks Physical risks tend to be those that industries face as a result of their direct operations and use of water in their manufacturing or processing. Reduced quantity and quality of water can result in operational issues, low productivity, and increased cost of operations. These risks can also arise from disruptions in availability and the price of water-intensive raw materials in the supply chain. These risks can be aggravated by weak water governance and institutional architecture that exist in the country.
Regulatory risks
Regulatory risks refer to government action (policies, laws, regulation) that address issues related to sitting of industries, water use and effluent discharge. These can potentially affect pricing, supply, rights, standards and license to operate, both at the individual plant level or at the sector level.
Reputational risks
Reputational risks tend to damage brand equity and reputation of a company, when the actions of a company are poorly executed, understood or communicated with local stakeholders or when perceptions around water use, pollution and behavior suffer. These can result in stakeholder unrests, conflicts, lawsuits, media scrutiny or stringent regulatory action. This also affects future business development as well as shareholder value.
Ref: Water Stewardship for Industries, The Need For A Paradigm Shift In India, WWF Report 2013 The availability of water and management of water related impacts are local and appear at watershed, basin, sub–basin and basin-levels. It also leads to company-related risks which are location and sector-specific. There are likely to be considerable asymmetries in exposure and vulnerability between various stakeholders when it comes to water as a resource. Hence, there is a need to understand physical,
16 Orr Stuart, Cartwright Anton & Tickner Dave, “ Understanding Water Risks: A Primer on the Consequences of Water Scarcity for Government and Business”, WWF Water Security Series 4, March 2009

Citywide Partnership for Sustainable Water Use and Water Stewardship in SMEs in Lahore, Pakistan – WSP
Better Water Management & Cleaner Production Practices in Major Industrial Sector of Pakistan
16
regulatory and reputational risks in the context of their shared risk across a basin. Table 2.3 details out basin and company-related risks. Table 2.3: Industry and Basin Related Risks
Type of Risk Physical Risk Regulatory Risk Reputational risks
Basin Related Risks (Linked to the location of the industry)
Water quantity (scarcity, flooding, droughts) and quality (pollution) within the river basin and the impacts this might have been on society and the environment
Strength and enforcement of water regulations and the consequences of restrictions by public Institutions. Either felt through direct regulatory action or from neglect, blockage or failure
Perceptions around water use, pollution and behavior that may have negative impacts in the company brand and influence purchasing decisions. Public perceptions can emerge rapidly when local aquatic systems and community access to water are affected
Company related Risks (Linked to the behavior of the industry)
Water quantity and quality issue related to the performance of the company and its supply chain
The potential for changes in pricing, supply, rights, standards and license to operate for a particular company or sector
When the actions of the company are poorly executed, understood or communicated with local stakeholders and where perceptions and brand suffer as a consequence
Ref: Water Stewardship for Industries, The Need For A Paradigm Shift In India, WWF Report 2013. There would be high risk to the industrial sector due to the limited availability of freshwater in future; however, the implementation of water management strategies at the right time will give the industry an opportunity to contribute towards sustainability.

Citywide Partnership for Sustainable Water Use and Water Stewardship in SMEs in Lahore, Pakistan – WSP
Better Water Management & Cleaner Production Practices in Major Industrial Sector of Pakistan
17
3 LEATHER SECTOR
Pakistan’s leather industry is the second largest foreign exchange earner amongst the manufacturing sector. At present about 90 % of the leather is exported in finished form. This sector contributes 5% of GDP and 4.41% to the overall export earnings of the country. The major export items in the leather sector are tanned leather, leather garments, sports goods, leather gloves, footwear and other leather manufacturing goods. The main buyers of Pakistani leather products are Italy, China, Germany Turkey, U.A.E., Germany, USA, Spain, UK and France.
3.1 GEOGRAPHICAL LOCATION There are 79 registered leather units in Punjab17. These units are categorized as small, medium, and large units depending upon the number of processing drums. Tanneries having 1-2 drums are categorized as small tanneries whereas the tanneries with 3-5 drums and more than 5 drums are medium and large category respectively18. Figure3.1 shows the location of leather units while figure 3.2 shows the district wise distribution of units in Punjab. Figure 3.1: Location of Leather Units
17 Pakistan Tanners Association, North Zone, 2012‐13 18 CPI Database

City
Figure 3
3.2 Table 3. Table 3.
Tanned
Leather
Leather
Leather
Ref: Imp
Table 3.of room During tand skin Table 3.
Species
HIDES (
Cattle
Buffalo
Camel
Total
SKIN (00
Sheep S
Goat Sk
Total
0
5
10
15
20
25
30
35
Num
ber o
f Uni
ts
ywide Partner
Better W
3.2: District W
LEATHER
1 indicates th
.1: Productio
Production Ite
Leather
Garments/ App
Gloves
Footwear
plementable Re
1 clearly indito substantia
he period ofns processed
.2: Leather Ss
000 No’s)
00 No’s)
Skin
in
30
0
5
0
5
0
5
0
5
Lahore
rship for Susta
Water Managem
Wise Distrib
R SECTO
he current ca
on Levels of
ems
parels
commendation
icates that thally increase
f 2011-12, le. Table 3.2 p
Sector Produ2007-08 2
6,032
6,070
96
12,198
10,251
21,860
32,111
19
Sialkot
inable Water U
ment & Cleaner P
bution of Un
R PRODU
apacity and p
f Leather Ind
Units
million ft2
million pieces
million pairs
million pairs
s for Cleaner P
he capacity o the productio
ather sector provides the l
uction 2008-09 200
6,260 6
6,255 6
97
12,612 13
10,371 10
22,452 23
32,823 33
17
Kasur Mu
Use and Water
Production Pra
nits in Punja
UCTION
production lev
dustry C
Annual
s
Production Prog
of leather secon and expor
production wleather secto
9-10 2010-11
,496 6,741
,445 6,640
99 100
,040 13,481
,495 10,620
,061 23,685
,556 34,305
43
ultan Sahiw
r Stewardship
ctices in Major
b
vels of leathe
Current l Production
60
05
05
100
rams in Pakista
ctor remains rts of leather
was reportedor production
1 2011-12
1 6,995
0 6,942
0 101
1 14,038
0 10,745
5 24,237
5 34,982
4
wal Sheikhupur
in SMEs in La
Industrial Sect
er industry in
Capacityof Industr
90
07
10
200
an, WB, May 20
highly under- products.
d to be 63,53 of last five y
2
ra Gujranwala
ahore, Pakistan
tor of Pakistan
Pakistan.
y ry
011
-utilized and
30,000 numbyears.
n – WSP
18
there is a lot
bers of hides
8
t
s

Citywide Partnership for Sustainable Water Use and Water Stewardship in SMEs in Lahore, Pakistan – WSP
Better Water Management & Cleaner Production Practices in Major Industrial Sector of Pakistan
19
Fancy Skin (000 No’s)
Lamb Skin 3,045 3,081 3,117 3,154 3,192
Kin Skin 10,170 10,445 10,728 11,019 11,318
Total 13,215 13,526 13,845 14,173 14,510
Ref: PTA Annual Report, 2011-12
According to ICTP project, Table 3.3 represents the average production of tanneries of small, medium and large sizes. Table 3.3: Leather Sector Production
Category Processing of Hides and/or Skins
(avg. kg/d) Small 216,370 Medium 150,918 Large 185,000 Ref: ICTP Database
3.3 WATER CONSUMPTION Water consumption in leather sector consists of process water, energy generation, sanitary purposes etc. The latter is estimated to account for about a fifth of total water consumption. Process water consumption varies greatly between tanneries, depending on the processes involved, the raw material used and the manufactured products. The water consumption of tanneries manufacturing finished leather from intermediate products is low compared with that of integrated tanneries or those generating intermediate products. This difference is also partly due to more or less stringent water saving measures, e.g. in rinsing steps. For a traditional tannery, average water consumption lies in the range of 25 to 80 m³/t of processed hide19. The environmental audits conducted under ICTP and CTP-KT projects show that about 50 -150 liter of water is used for the conversion of one kg of raw hide/skin into finished leather. Average daily water consumption in medium and large tannery is in the range of 350-1,000 m3. Table 3.4 provides detail of process wise water consumption contribution in the tannery process. Table 3.4: Process Wise Water Consumption Contribution
Tanning Process Water Consumption (%)
BLC Local
Soaking 15-25 15-20
Liming/Rinsing 23-27 25-35
De-liming/Bating/Rinsing 10-15 8-12
Beam House (Total) 48-67 48-67
Pickling / Tanning / Rinsing / Neutralization / Rinsing 10 7-15
Retanning / Dyeing / Fat Liquoring / Rinsing 30 8-14
Post Tanning (Total) 40 15-29
Finishing 10
Ref: BLC-British Leather Technology Centre-UK, Local-Pakistani Tanneries
19 Integrated Pollution Prevention and Control (IPPC), Draft Reference Document on Best Available Techniques, for the Tanning of Hides and Skins, February 2009, European Commission.

Citywide Partnership for Sustainable Water Use and Water Stewardship in SMEs in Lahore, Pakistan – WSP
Better Water Management & Cleaner Production Practices in Major Industrial Sector of Pakistan
20
3.4 WASTEWATER POLLUTION Wet processes of the tannery are the main sources of wastewater generation. Some mechanical operations also contribute small quantities of wastewater.
3.4.1 Wastewater characteristics Tannery wastewater is highly polluted in terms of biochemical oxygen demand (BOD), chemical oxygen demand (COD), total suspended solids (TSS), Total Kjeldhal Nitrogen, conductivity, sulphate, sulphide and chromium. The values of these parameters are very high as compared to the values mentioned in the National Environmental Quality Standards (NEQS). Typical wastewater characteristics of the tannery effluent are presented in Table 3.5. Table 3.5: Pollution Characteristics of Tannery Effluent
Parameters (mg/l except pH)
Raw Sheep & Goat Skins to Finished Leather
Raw Calf Hides to Finished Leather
NEQS (Into Inland Waters)
pH 8 – 9 6 – 8 6 - 9
BOD5 600 – 1200 1,500 – 3,500 80
COD 2,000 – 3,300 2,600 – 5,000 150
TSS 450 – 1,650 800 – 1,500 200
TDS 3,800 – 7,000 4,000 – 15,000 3,500
Sulphate 900 – 2,000 900 -2,000 600
Chromium 10 – 90 50 – 150 1
O &G (Oil & Grease) 150 – 200 20 – 100 10
Ref: ICTP database
3.4.2 Wastewater quantities In the tannery processes, water is used as a chemical carrier to render the cleaning of raw hides and skins as well as to penetrate the chemicals facilitating reaction of chemical with collagen fibre of the skins. The processed water after the completion of the process is drained out as wastewater. Quantity of wastewater generation varies from tannery to tannery. It depends upon many variables along with the quantity of raw material processing. Average daily wastewater discharge from medium to large tannery ranges from 280 to 800 m3.
3.5 BEST AVAILABLE RESOURCE CONSERVATION TECHNIQUES This section describes the commercially available techniques having potential to achieve the considerable level of environmental protection and resources conservation in leather industry. For tanneries, the focal points are water consumption, efficient use of process chemicals and waste reduction within the process in conjunction with recycling and re-use options.
The resource management of a tannery depends primarily on the type of leather production carried out, and secondarily on the local conditions, i.e. the availability, quality and cost of fresh water, as well as the costs and legal requirements for wastewater treatment and discharge. Efficient wastewater treatment involves the optimization of water consumption and lowering the consumption of chemicals used in the process and wastewater treatment.

City
3.5.1 Due to pprocessecontinuo Internatiexcessiv a. Rep
mainprev
b. Inst
avoi c. Auto
prev d. Inst
conssectthe condThismete
e. Trai
senioperreduload
f. Env
and cons
3.5.2 The usebecausetake advbe done
20 Final rcontrol b21 Integrathe Pulp 22 Water,23 Integrathe Tann
ywide Partner
Better W
Efficient upoor water mes while the
ously running
onal literaturve water cons
pair and repntenance of ventive maint
allation of pd water wast
o close valvvent water los
allation of sumption ations should
rapid ideditions so thas measure reers20.
nings of woor and junrators can ucing the wad.
vironmental includes gosumption can
Use drum of drums is
e not all typevantage of th in paddles23
report on devboard Delhi. ated Pollutionand Paper Ind, Facts and Treated Pollutioning of Hides a
rship for Susta
Water Managem
use of watemanagement other half is
g pipes, and o
re suggests tsumption and
placement s water pumtenance sche
press type tatage through
ve for hosepss due to neg
flow meteand losses
be reported.entification at prompt acequires the i
orkers: Perionior managebe a cost
ater consump
managemenoals and mn be reduced
s instead o generally favs of leather pis option to r
3.
velopment of
n Prevention adustry, Decemends, World bn Prevention aand Skins, Feb
inable Water U
ment & Cleaner P
er in the tanne lost due to eover-frequen
the following d pollution lo
ystem: Thisps, seals, fledule should
aps: Press h open taps d
pipe: Press tgligence.
ers: Daily from indiv
. This would of non ro
ction can be tnstallation o
odic training ement staffeffective w
ption and po
nt system (Eeasures, pro
d by over 90%
of pits andvorable to paproduced careduce their w
guidelines fo
and Control (mber 2001, Eubusiness Counand Control (IPbruary 2009, E
Use and Water
Production Pra
ries, only 50extensive ruts washing o
general watoad in the effl
s system redlanges can be develope
type taps shdue to neglige
type clutches
water vidual allow outine taken.
of flow
of all f and ay of llution
EMS): EMS oocess and j% by improvin
d puddles addles or pitsn be processwater consum
or water cons
IPPC), Draft Rropean Commncil for sustainPPC), Draft ReEuropean Com
r Stewardship
ctices in Major
0 % of the wanning water
of floors and d
er managemuent;
duces the wasubstantially
ed and implem
hould be instence of a wo
s in the hose
optimizes thejob instructiong the house
s, which use sed in drumsmption e.g. th
servation in p
Reference Docmission nable Developeference Docummission
in SMEs in La
Industrial Sect
ater consumelosses, overfdrums.
ment techniqu
ater losses fy reduce themented.
alled insteadrker.
epipes should
e managemeons etc21. Itekeeping22.
about 300 – s, certain tanhe processing
pulp and Pape
cument on Be
pment ument on Best
ahore, Pakistan
tor of Pakistan
ed is actuallyrflowing vess
ues in order t
from valves e water con
d of open tap
d be installed
ent, increaset is reported
1000 % floanneries will ng of long-woo
er sector, cen
est Available T
t Available Te
n – WSP
21
y used in theels, leakage
to reduce the
leaks. Goodnsumption. A
ps in order to
d. This would
s awarenessd that water
ats. Howeverot be able tool skins must
ntral pollution
Techniques in
chniques, for
1
e ,
e
d A
o
d
s r
, o t
n
n

Citywide Partnership for Sustainable Water Use and Water Stewardship in SMEs in Lahore, Pakistan – WSP
Better Water Management & Cleaner Production Practices in Major Industrial Sector of Pakistan
22
3.5.3 Batch washing in drums The consumption of water for rinsing processes varies considerably between tanneries. Running water washes, goods are run in a drum with a lattice door and continually rinsed, is one of the major sources of water wastage. Batch washes save over 50 % of total water used in the process24. Moreover, a great uniformity of the end product is attained. Multilateral Investment Guarantee Agency (MIGA), a member of the World Bank Group, also promotes the batch washing practice in drums instead of continues washing in its environmental guidelines for “Tanning and Leather Finishing”. IFC Environmental, Health, and Safety Guidelines for Tanning and Leather recommend the same practice of batch washing instead of continues washing.
3.5.4 Modifying existing equipments for short floats – short float technique The short-float technique yields a reduction in water consumption and processing time, savings in chemical input because of a higher effective concentration and increased mechanical action. As per literature, utilization of short floats 40 – 80 % floats instead of 100 – 250 % is achieved for certain process steps by modifying the equipment. With a combination of batch washing and short floats, savings up to 70 % can be achieved, compared with a conventional process.
3.5.5 Modern equipment for short floats The installation of modern tannery machines can reduce water consumption by 50 % compared with a conventional process in addition to chemical savings25. Keeping in view the sustainable production, the high cost of the machines can be justified by the water saving, chemical conservation and less energy input. Only minimal re-modeling is required to allow recycling systems.
3.5.6 Maintenance of equipments Leaks in pipes and process vessels can account for considerable losses of water. Preventative maintenance programmes should be carried out to minimize the water losses. Apart from the deposition of solids, raw unsettled tannery wastewater can cause many problems in a sewer. Calcium carbonates cause encrustation, high sulphide contents lead to corrosion and sulphates cause deterioration of concrete. It is important to use sewer material suitable for tannery wastewater.
3.5.7 Reuse of wastewater for less critical processes Reuse of wastewater of soaking process has been investigated by number of researchers. All the techniques have been studied thoroughly and references of only published documents are given. Soaking processing in tanneries is carried out in two steps: dirt soak and main soak and the Rinsing. Main soak and rinse liquor is collected and reused in the next soaking operations for dirt soak and main soak respectively, the dirt soak liquor is discarded and fresh water is used for the rinsing operation.26
The IPPC document on “Best Available Techniques for the Tanning of Hides and Skins” states that rinsing water from de-liming can be recycled back to soaking. Lime washes together with recycle from pickle/chrome tan and some other washes can be recycled to soak. Water consumption can be reduced considerably through this technique.
24 United Nations Industrial Development Organization (UNIDO), Eleventh Session of the Leather and, Leather Products Industry Panel, Nairobi, Kenya, 29 November‐ 3 December 1993, Introduction of cleaner leather production methods‐prospects and constraints 25 Integrated Pollution Prevention and Control (IPPC), Draft Reference Document on Best Available Techniques, for the Tanning of Hides and Skins, February 2009, European Commission 26 Recycling In The Tanning Industry, N. P. Slabbert, Leather Industries Research Institute, Grahamstown, South Africa, Journal of the Society of Leather Technologists and Chemists, Vol. 64, p. 89

Citywide Partnership for Sustainable Water Use and Water Stewardship in SMEs in Lahore, Pakistan – WSP
Better Water Management & Cleaner Production Practices in Major Industrial Sector of Pakistan
23
3.5.8 Partial salt elimination During curing process, salts are added to prevent the degradation of skins and hides. Salt represents about 20% of the raw material weight. It is possible to recover partially the preserving salt by shaking the hides either manually or mechanical by using perforated and inclined rotating drums. The recovered salt, heated over 400 centigrade to eliminate the organic material can be reused for hide preservation27. This technique of partial salt recovery will help in improving the effluent quality besides saving the chemical and energy input at subsequent steps.
3.5.9 Hair saving unhairingliming methods “Liming is a process in which lime Ca(OH)2, sodium sulphide and ammonium salts are conventionally employed for hair removal, interfibrillary components and epidermis and to open up the fibre structure”. This process accounts more than 60% of the biochemical oxygen demand (BOD), chemical oxygen demand (COD) and total solid (TS) in the wastewater28. Recovery of hair before dissolution, can lead to a COD reduction of 15- 20% for the mixed tannery effluent, and a total nitrogen decrease of 25-30%. It is an advantage to filter off the loosened hair as soon as possible and higher COD and nitrogen reduction can be obtained. This process can be considered as a cleaner technology if the hair is utilized, even as a nitrogen source29. UNIDO document on “Introduction of cleaner leather production methods-prospects and constraints” also proposes the same %age reduction values of COD and nitrogen by hair saving method.
3.5.10 Direct recycling of lime liquors Direct recycling is carried out for maximum recovery of the residual float. The chemical content of the float is restored to its initial composition before being reused in another unhairing-liming operation. This technology holds much interest and is being used for over 12 years in tanneries. It can save 35 to 40% of the involved sodium sulfide, and almost 45 to 50% of the conventional lime consumption. On the whole, 30 to 40% of the COD and 35% of the nitrogen may be eliminated from the mixed effluents. Savings in chemicals generally lead to a 3 to 4 years investment return rate even if the pollution control value is not considered in the balance30.
3.5.11 CO2 deliming De-liming is done by traditionally with ammonium salts. It is considered that up to 40% of ammonical nitrogen is produced by the use of ammonium salts during the de-liming process. The use of carbon dioxide provides quite a few advantages as far as pollution is concerned. In practice, the only difficulties are related to the required distribution equipment from CO2 storage.
This technology is very much favorable for light pelts (thickness lower than 3 mm). The CO2 is injected directly in the axe of the drum. The application rate is 1 to 1.5% of the weight of pelts. For thicker hides, 27,United Nations Industrial Development Organization (UNIDO), Eleventh Session of the Leather and, Leather Products Industry Panel, Nairobi, Kenya, 29 November‐ 3 December 1993, Introduction of cleaner leather production methods‐prospects and constraints 28 An Environment‐friendly Lime‐Free Liming Process based on sodium silicate, Yuansen Liu, Haojun Fan*, Xiuli Zhang, Biyu Peng, Bi Shi, National Engineering Laboratory for Clean Technology of Leather Manufacture, Sichuan, University, Chengdu, P.R.China, 610065 29 Recent Development In Cleaner Production and Environment Protection In World Leather Sector, International union of environment (IUE) commission of international union of leather technologists and chemists societies (IULTCS), 2008) 30 United Nations Industrial Development Organization (UNIDO), Eleventh Session of the Leather and, Leather Products Industry Panel, Nairobi, Kenya, 29 November‐ 3 December 1993, Introduction of cleaner leather production methods‐prospects and constraints

City
diffusiontemperaauxiliariehydroge
3.5.12 Tannerieother chskin32. Pickle liqeffluent needs tothe pickrecycledcarried ocontent substantTCMTB)adequatscreen storage recyclingcontrol b Salt sav10-25%,acids co
3.5.13 Chromiutanning is obsercollectioprevious
Dependia conve20% of t
31 UnitedProductsproductio32www.c33 Integrathe Tann34 Recentunion of(IULTCS35 This fig
ywide Partner
Better W
n remains ratature (up to es. A large an peroxide. M
Recycling es use large emicals for r
quor recyclindischarged to be dedicatekle liquors. d, several chout. It is neceand the aci
tive fungicid), extra funge mould profor filtering and re-use
g cycles. Thby skilled per
ing up to 80%, although m
onsumption.
Recycling um tanning safloats is an erved that 25n and suffici
s cycle replac
ing on the tantional bovinthe chromium
d Nations Inds Industry Paon methods‐ppi.org.pk ated Pollutioning of Hides at Developmen
f environmentS), 2008) gure is taken f
rship for Susta
Water Managem
her slow and35 centigrad
amount of HMore than 10
of picklin quantity of sreducing the
ng reduces thto sewer. A sed to the colBefore the ecks and adessary to cheid content pde has begicide has totection. Alsosolids from
e can enhahe process rrsonnel.
% are reportore formic ac
of chromealts are usedeasiest meth5-30%35 appiently fine scced by new c
nning technone tanning prm used in the
dustrial Develanel, Nairobi, prospects and
n Prevention aand Skins, Febnt In Cleaner t (IUE) comm
from www.cp
inable Water U
ment & Cleaner P
d requires mudes) and/or
H2S appears 00 European
g liquor salt in the pic pH of the pic
he amount osuitable tankllection and spickle liquo
djustments neck and adjuprior to recyceen used o be added o, a grease tm the liquorance the nrequires stric
ed through tcid than sulp
e tanning fd today in 85od to apply,
plied chromecreening, thechromium sal
ology in use, rocess, it is e
e conventiona
opment OrgaKenya, 29 constraints
and Control (IPbruary 2009, E
Production amission of in
i.org.pk
Use and Water
Production Pra
uch greater Cprocess duat the begin and America
kling processckle. The sa
of salt and k/container storage of
or can be eed to be
ust the salt cling. If a (such as to ensure rap and a r prior to umber of ct analytic
his techniquephuric acid is
floats % of tanning recover ande remains u floats are clts.
the degree oestimated thaal process.
anization (UNNovember‐ 3
PPC), Draft ReEuropean Comand Environmnternational un
r Stewardship
ctices in Major
CO2 amountsration, and/o
nning of the an firms are u
s, wherein thlt used is in t
es. The redu saved33. UN
g processes a reuse chrom
unconsumed ontrolled and
of exhaustionat the direct
IDO), Elevent3 December
eference Docummission
ent Protectionnion of leath
in SMEs in La
Industrial Sect
s, and it is neor to add smreaction requsing this tec
he salt is dissthe range of
uction of acidNIDO reports
around the wmium salts fr and drained the chromi
n reached fo recycling tec
th Session of1993, Introd
ument on Best
n In World Leher technologi
ahore, Pakistan
tor of Pakistan
ecessary to imall amount
quiring pre-trechnology31.
solved in wat 7 – 10% of t
consumptios the reductio
world34. Direcrom tanning oed out as eium amounts
r each cycle chnology can
f the Leather duction of cle
t Available Te
eather Sector,ists and chem
n – WSP
24
ncrease floatt of delimingeatment with
er along withthe weight of
n is betweenon of 20-25%
ct recycling ofoperations. Itffluent. Afters used in the
may vary. Inn save about
and, Leathereaner leather
chniques, for
, Internationalmists societies
4
t g h
h f
n %
f t r e
n t
r r
l s

City
On the omakes itnot reac
This recoccurrenchromiuadapted
3.5.14 precipChrome (tanningtanning chromiuconcentr The chrocollectioprecipitaprecipitasupernadissolveCr2O3 arequiredsoon as fresh ch
3.6 CPI is wexchangbest ma CPI has ProgramCPI hasframewo Lime Chro
36 UnitedProductsproductio37 Integrathe Tan
ywide Partner
Better W
other hand, t possible to
ch high exhau
cycling methonce of qualitym concentra to small firm
Chrome reitation an can be reco liquors) froprocess; ch
m salts is ration.
omium-contan tank, aft
ated by aated chromitant, after wd in concentas precipita). The super possible, asromium. Ch
FEASIBL
working with ge earning senagement pr
worked in ta
mme for Indus implementeork with direc
e Recycling ome Recove
d Nations Inds Industry Paon methods‐pated Pollutionnning of Hide
rship for Susta
Water Managem
for the treat reuse almosustion rates.
od may be y problems wation), a meams and is wid
ecovery thd separati
overed from tom the conhromium fromnot recycled
aining liquorster which tddition of um is sep
which the chrated sulphu
ate about 1rnatant is gen it gets less srome precipit
LE TECHN
leather sectector to compractices for c
annery sector
ustrial Sustaed the follow
ct and indirec
ry and Recyc
dustrial Develanel, Nairobi, prospects andn Prevention as and Skins, F
inable Water U
ment & Cleaner P
ment of woost 50% of the
repeated sevwith delicate asurement wely used thro
hrough ion the exhaust lnventional cm high-exhad due to th
s are collectethe chromiu
an alkali. parated fromhromium sludric acid (for 1
1.9 kg H2Snerally dischasoluble with ttation can re
NIQUES FO
or since 200ply with natioleaner produ
r under the fo
ainable Devewing cleanerct financial pa
cling
opment OrgaKenya, 29 constraints and Control (Iebruary 2009
Use and Water
Production Pra
olly sheep ske chromium
veral times hides, and b
which takes oughout Euro
liquors hrome
austing he low
ed in a um is The
m the dge is 1 kg of
SO4 is arged to the time. Chromimove around
OR LOCA
07 with the onal and inter
uction and en
ollowing prog
elopment -1r technologieaybacks.
anization (UNNovember‐ 3
PPC), Draft Re, European Co
r Stewardship
ctices in Major
kins (especiaintroduced in
on the sameby the need around 30 m
ope36.
effluent. Theium recovered 99.9 % of t
AL INDUS
objective to ernational envnergy efficien
gram:
(July, 2007es in a logic
IDO), Elevent3 December
eference Docuommission
in SMEs in La
Industrial Sect
ally double fan the process
e float. How to control reminutes. This
e precipitate sed in this wayhe chrome37
TRIES
enable the Pironmental recy practices.
- June, 201cal sequenc
th Session of1993, Introd
ument on Bes
ahore, Pakistan
tor of Pakistan
ace), this dirs, since tann
wever, it is limesidual floatss technology
should be re-y resembles .
Pakistan’s seequirements .
0) ce under a c
f the Leather duction of cle
st Available Te
n – WSP
25
rect recyclingning floats do
mited by thes (acidity andy is specially
-dissolved asthe quality of
econd foreign and to adopt
cost-effective
and, Leathereaner leather
echniques, for
5
g o
e d y
s f
n t
e
r r
r

Citywide Partnership for Sustainable Water Use and Water Stewardship in SMEs in Lahore, Pakistan – WSP
Better Water Management & Cleaner Production Practices in Major Industrial Sector of Pakistan
26
Carbon Di Oxide De-liming Salt De-dusting Reduction at Source Techniques Process Change Establishment of process control laboratory Batch washing instead of continuous washing Determination of pH with electronic pH meter Optimized raw trimming by skilled labor Control of water hardness Installation of flow meters Mechanical salt de-dusting machine Input Material Change Use of enzymatic products instead of sulphides Use of biodegradable surfactants Avoid penta chloro phenol Use of weak organic acids instead of ammonium sulphate Use water finishers instead of halogen hydrocarbons. Good Housekeeping Use of wooden pallets for raw hide/skin or wet blue Use of wipers for extra floor washing Use low-pressure pipes or install nozzles on high-pressure pipes for floor washing Provide washbasins for workers Provide proper light and ventilation in processing hall and stores Control water leakages Construct separate drains for liming and tanning operations Construct covered and sufficiently sloped drains Raw skins/hides and wet blue stack on wooden pellets Well-maintained floors with proper slope Sufficient provision of light and ventilation

Citywide Partnership for Sustainable Water Use and Water Stewardship in SMEs in Lahore, Pakistan – WSP
Better Water Management & Cleaner Production Practices in Major Industrial Sector of Pakistan
27
4 PULP AND PAPER SECTOR
In 1947, Pakistan got independence having no paper and board mill in the country and had to rely on imported paper. At present, there are 134 reported establishments related to paper and paper products including, 45 pulp, paper and paperboard processing, 73 makers of containers of paper and paperboard and 16 makers of other articles of paper and paperboard38. Moreover, there are unaccounted number of small manufacturing units producing low grade paper or board to meet the market demands. Production of 45 pulp, paper and paperboard plants caters about 80% of the nationwide paper requirement of 850,000 tons of paper per annum. Approximately 100,000 people are employed in this industrial sector.
4.1 GEOGRAPHICAL LOCATION Pulp, paper and paperboard industry is mostly located in the province of Punjab and Sindh. Out of 45, 29 paper and paper board processing units are located in Punjab. A small percentage of total production is produced in the KPK. District wise distribution of 29 processing units located in Punjab is not available from the association (Pakistan Pulp, Paper and Board Mills Association-PPPBMA) and any other source. Therefore, CPI used his own database developed for PISD project. Under this project, 15 paper industries were selected out of 29 for the implementation of cleaner production and energy efficiency initiatives during 2007-2011. All industries were selected from Punjab province except one which was located in Karachi (Sindh). Figure 4.1 shows the location of pulp & paper mills while Figure 4.2 shows the district wise distribution of mills.
4.2 PRODUCTION PROCESS The main processes involved in pulp and paper industries are following: Chemical pulping involves Kraft (sulphate) pulping process and Sulphite pulping process Mechanical and chemi-mechanical pulping Recovered paper processing with and without de-inking Papermaking and related processes39 Pakistan is one of the few countries in the world where agricultural waste and Neutral Sodium Sulfite cooking process is used to produce paper and paperboard grades.
38 Census of Manufacturing Industries 2005‐06 Weights
39 Integrated Pollution Prevention and Control (IPPC), Draft Reference Document on Best Available Techniques in the Pulp and Paper Industry, December 2001, European Commission

City
Figure 4
Figure 4
4.3 During tincludingsubstitut
0
1
2
3
4
5
6
7
8
9
ywide Partner
Better W
4.1: Location
DeraGhaziKhan
RahimYar
Khan
Rajanpur
4.2: District W
PAPER S
the period ofg all paper tion by saving
1
Lahore
rship for Susta
Water Managem
n of pulp & p
Lodhhran
Mianwali
Layyah
Khan
Khu
Bhakkar
Jh
MuzaffargarhMultan
Bahawalpur
Wise Distrib
SECTOR P
f 2010-11, p and paperg millions of
2
Multa
inable Water U
ment & Cleaner P
paper mills
Attock
Rawalpindi
JChakwal
Chiniot
Vehari
Bahawalnagar
newal
ushab
Sargodha
Faisalabadang
TobaTek
Singh
Sahiwal
Pakp
bution of 14
PRODUCT
paper and paboard produdollars by pr
an
Use and Water
Production Pra
in Punjab
Jhelum
Gujrat
Hafizabad
MandiBahauddin
Sialkot
Gujranwala
Shekhupura
LahoreNankana
Sahib
Kasur
Okara
attan
Units in Pu
TION
aperboard seucts. Moreovroducing high
3
Kasur
r Stewardship
ctices in Major
t
Narowal
njab
ector producver, the se
h and low qua
8
Sheikhupuira
in SMEs in La
Industrial Sect
tion was repctor is contality paper an
a
ahore, Pakistan
tor of Pakistan
ported to be tributing townd paper boa
n – WSP
28
434,800 tonwards importard.
8
n t

Citywide Partnership for Sustainable Water Use and Water Stewardship in SMEs in Lahore, Pakistan – WSP
Better Water Management & Cleaner Production Practices in Major Industrial Sector of Pakistan
29
Total installed capacity of members units of PPPBMA is reported to be 436,500 ton per year i.e. 62% of the total production for the year 2008-09. However, these units are operating at about 80% efficiency and producing around 350,000 ton per year (50%) of paper and paper board. Majority of the mills are below 100 ton per day capacity and many have designed capacity of not more than 50 ton per day. All large paper mills are located in Punjab due to the availability of basic raw material i.e. wheat straw. Table 4.1 provides the paper and paperboard production of last five years. Table 4.1: Pakistan Paper and Paperboard Production
Year Paperboard (000’ Ton)
Paper (All other types) (000’ Ton)
Total (000’ Ton)
2006-07 280.4 161.7 442.1
2007-08 227.6 192.0 419.6
2008-09 168.8 252.5 421.3
2009-10 178.2 249.1 427.3
2010-11 206.1 228.7 434.8
Ref: Economic Survey of Pakistan 2011-12 Table 4.2 represents the average annual production for the mills studied under PISD project. Table 4.2: Paper and Paperboard Production
Category Annual Production (Ton)
Integrated Pulp and Paper Mill 229,929 Wastepaper Mill 99,220 Ref: PISD Database
4.4 WASTEWATER POLLUTION
Pulp and paper industry is highly polluted industry of the Pakistan with reference to wastewater discharges. Water being the only pulp carrying medium in this industry is used extensively throughout the paper and board production process.
4.4.1 Sources The major sources of wastewater in pulp and paper mill are the pulping, bleaching and finally the papermaking sections. The wastewater generated from pulping process (commonly known as NSSC) in which raw material breaks down to liberate cellulose from lignin is the main pollution point. The wastewater generated at this stage through cooking and washing of pulp is termed as black liquor. Most of the wastewater is drained but little quantity of this wastewater is recycled in few of progressive unit of Pakistan pulp and paper sector. The second main source of wastewater is the bleaching section. The washed pulp is then bleached with bleaching chemicals to get rid of the remaining lignin contents and mainly to achieve the required brightness of the pulp. The wastewater of this stage is highly toxic due to the presence of chlorinated compounds. The effluent from Paper Machine mainly comprises of fibers and fillers which is relatively less harmful as compared to pulp mill effluent. Most of the wastewater generated from this section is recycled in pulp mill.

Citywide Partnership for Sustainable Water Use and Water Stewardship in SMEs in Lahore, Pakistan – WSP
Better Water Management & Cleaner Production Practices in Major Industrial Sector of Pakistan
30
4.4.2 Wastewater characteristics Table 4.3 shows the range of characteristics of the wastewater generated by pulp and paper mills. The comparison of characteristics with NEQS confirms that the paper industry is one of the most polluted industries of Pakistan. All the results in Table 4.3 are based on the data collected during the integrated audits of pulp and paper mills under PISD and ETPI projects. Table 4.3: Wastewater Characteristic
Parameter Units
Effluent Characteristic Ranges
ETPI PISD NEQS
Pulp Mill Paper Mill Pulp and Paper Mill
pH - 6.5 – 7 6.7 – 7.9 5.19 – 11.72 6 – 9
BOD mg/l 4,000 – 8,000 100 – 500 219 – 3,292 80
COD mg/l 6,000 – 14,000 200 – 1,000 892 – 3,460 150
TSS mg/l 1,000 – 4,000 300 – 500 358 – 4,232 200
TDS mg/l - - 1,164 – 5,824 3,500
Temp ˚C 34 – 36 35 - 40
Ref: PISD Database
Table 4.4 shows the average wastewater generation rates for the mills studied under PISD project.
Table 4.4: Wastewater Generation Rate
Category Wastewater Generation (avg. m3/y)
Unit Wastewater Generation (avg. m3/ton)
Integrated Pulp and Paper Mill 5,491,999 202
Wastepaper Mill 1,817,082 96
Ref: PISD Database
4.5 BEST AVAILABLE RESOURCE CONSERVATION TECHNIQUES Pulp and paper manufacturing requires large amount of water, steam and electricity. As a result, the main environmental stress associated with pulp and paper industries is water and energy consumption and emissions to the water. A long list of best available techniques is available to reduce the environmental pollution in pulp and paper sector. These techniques are developed keeping in view different raw materials and processes involved in the mills. As, agricultural based sulphite pulping process is commonly in practice in Pakistani Industries therefore, worldwide best available techniques for NSSC process are explained here:
4.5.1 Good housekeeping measures (GHM) “GHM are the low-cost or no-cost practical measures that allow water consumption and pollutant discharges to be minimized”40. GHM to reduce the water consumption and pollution load for Pulp & Paper sector are following: a. Repair and replacement system: This system reduces the water losses from valves leaks. Good
maintenance of water pumps, seals and flanges can substantially reduce the water consumption. A preventive maintenance schedule should be developed and implemented.
40 Best practice guide no. BPGCS001, Good Housekeeping Measures For Solvents, Enterprise Ireland

City
b. Insttapsordedue
c. AutoImplautocarror pa
d. Instconsshouideninsta
e. Trai
junioeffecpollu
f. Env
optimincluinstrcan hous
4.5.2 Conventthe contindustry,recyclingallows thconsumpprocesse a. Hyd
mini b. Vac
havi 41 Final rcontrol b42 Integrathe Pulp 43 Water,44 (EnviroNewyork
ywide Partner
Better W
allation of s should be ier to avoid w to negligenc omatic slementation a
omatic shut ied out for thaper machin allation of sumption anduld be repor
ntification of nallation of flow
nings of woor managemctive way ution load.
vironmental mizes the mudes goals ructions etc42
be reducesekeeping43.
Use of bettional potchetinuous coun, usually twog of effluent he recycling ption of freses are given:
draulic drummum operati
uum drum wng partial va report on devboard Delhi ated Pollutionand Paper Ind, Facts and Treonmental prok.
rship for Susta
Water Managem
press type nstalled inst
water wastagece of a worke
shut dowand monitori down prohe water ture sections ar
f flow med losses fromrted. This wonon routine cw meters41.
orkers: Perioment staff an
of reducing
managememanagement, and mea2. It is repored by over
tter pulp wer washing isntercurrent po to three w in the first of spent liqsh water bu:
m washing:ing cost.
washing: Iacuum applie velopment of
n Prevention adustry, Decemends, World botection strat
inable Water U
ment & Cleaner P
taps: Presead of open e through oper.
wn procing and followcedure sho
rbines when re out of prod
ters: Daily m individual sould allow thconditions so
odic training ond operators g water co
ent system, increases asures, procrted that watr 90% by
washing tec a batch prorocesses wh
washes are stage/stages
quor leading ut also redu
Hydraulic
n vacuum dred to its inte guidelines fo
and Control (mber 2001, Eubusiness Countegies for sus
Use and Water
Production Pra
ss type taps in
pen taps
cedure: w up of
ould be pulping
duction.
water sections he rapid o that promp
of all senior can be a cnsumption
m (EMS): Eawareness cess and ter consump
improving
chnology cess which c
hich consumeapplied. Uses not only reto the savin
uces the po
drum washe
rum washingrior. The dru
or water cons
IPPC), Draft Rropean Commncil for sustainstainable dev
r Stewardship
ctices in Major
pt action can
and cost and
EMS and job tion the
consumes hues less watee of fresh weduces the cng of chemicllution load
er works on
g, each stagum sits in a
servation in p
Reference Docmission nable Developelopment, Sp
in SMEs in La
Industrial Sect
be taken. Th
uge quantity er. Dependinwater in the consumptioncals. This sy
in the efflu
n hydraulic
e consists otank where p
pulp and Pape
cument on Be
pment pringer Dordr
ahore, Pakistan
tor of Pakistan
his measure
of water as ng upon the
last washinn of fresh waystem not onuent44. Some
principle th
of a rotating pulp is dilute
er sector, cen
est Available T
rechet Heidel
n – WSP
31
requires the
compared toprocess andg stage andater but also
nly saves thee continuous
erefore, has
screen drumed with wash
ntral pollution
Techniques in
berg London
1
e
o d d o e s
s
m h
n
n
,

Citywide Partnership for Sustainable Water Use and Water Stewardship in SMEs in Lahore, Pakistan – WSP
Better Water Management & Cleaner Production Practices in Major Industrial Sector of Pakistan
32
water. The vacuum draws a pulp mat against the surface and washes water through the mat. The drum rotation advances the washed pulp mat to the next dilution tank. Wash water discharged from this wash stage is sent to the previous washing stage.
c. Pressure washing: Pressure washing is similar to vacuum drum, but differs by spraying water under
pressure through the pulp mat as the drum rotates. d. Diffusion washing: Diffusion washing is a counter flow process that takes place in one or more
stages. Pulp flow is upward and is carried on a perforated plate. Water flows downward through a series of baffles.
e. Chemi or Belt washing: A Chemi or belt washer is a simplest washing system in terms of design. It
offers excellent washing with reduced water usage. Belt washing is a counter flow process where pulp enters the washer area on a wire belt. Washing takes place under a series of showers. Clean water enters on the opposite end from the pulp and is sprayed vertically through the pulp. The used wash water is then collected and reapplied to the dirtier pulp by the next washing head. This process is continued through all the stages until the wash water is saturated with liquor after washing immediately coming pulp. The wash water is then sent to the recovery process. Belt washing can reduce the amount of water used per ton of pulp in brownstock washing by 50%.
f. Twin roll press washer: Twin wire roll press washer works on the general principle of dewatering,
displacement and pressing. It consists of a twin-wire dewatering unit which allows controlled washing of the pulp. The two-sided dewatering and strong turbulence of the washer facilitate two to three time higher capacities per unit of width than conventional washer technologies. An additional main feature of this technology is that the ash and fines removal can be controlled depending on the targeted levels. This technology can be used for high consistency pulp washing and resulting in reduced water consumption45.
4.5.3 Carbondioxide brown stock washing The injection of CO2 into the wash water of brownstock washers reportedly improves pulp drainage, which can enhance washing efficiency and lead to improved throughput and reduced water usage. One published estimate suggests that CO2 injection in brownstock washing could lead to a 10% reduction in wash water use46.
4.5.4 Alternative bleaching techniques Chemical pulp bleaching is carried out to remove and /or brighten the residual colored lignin that remains in the pulp after the cook and to achieve this without undue loss in pulp strength or yield. In conventional bleaching, chlorine, hypochlorite or chlorine dioxide is used as bleaching agent and discharged in the effluent as dissolved chlorinated material. In early 80s, there has been strong focus on the environmental impacts of conventional bleaching effluent. As a result, new technologies including ECF and TCF were introduced. These bleaching techniques reduce
45Development of Guidelines for Water conservation in pulp and Paper sector, Central Pollution Control Board, Delhi 46 Energy Efficiency Improvement and Cost Saving Opportunities for Pulp and Paper Industries, Klaas Jan Kramer, Eric Masanet, Tengfang Xu, and Ernst Worrell, Environmental Energy Technologies Division, U.S. Environmental Protection Agency, October 2009

Citywide Partnership for Sustainable Water Use and Water Stewardship in SMEs in Lahore, Pakistan – WSP
Better Water Management & Cleaner Production Practices in Major Industrial Sector of Pakistan
33
the amount of chlorinated and colored material in the effluent. Moreover, effluent volume and environmental load can also be reduced by using these modern bleaching techniques47. Elemental Chlorine Free Bleaching (ECF) replaces chlorine with chlorine dioxide as a bleaching agent. The use of ECF bleaching results in reduced levels of chlorinated pollutants in the wastewater stream. Totally Chlorine Free (TCF) bleaching uses no chlorinated bleaching agents to bleach the pulp. Instead, bleaching agents such as oxygen and peroxide are used. TCF bleaching eliminates chlorinated pollutants in the wastewater stream48-49.
4.5.5 Optimum use of cooling wastewater Cooling with water is required at various sites like pump gland cooling/sealing, steam turbine cooling, compressor cooling, refiner gland cooling, rewinder brake cooling, etc. Fresh water is mostly used for pump jacket cooling on once through basis. There are different techniques by which this water use can be optimized as described below: a. Collection of once-through cooling water and reuse it in different process operation: Collection
involves installation of several small sumps or tanks from which water is subsequently pumped to process water tanks. It is also possible to directly use the water for specific applications like shower systems. The higher temperature of cooling wastewater is advantageous to the shower system as it increases the water drainage property of the web.
b. Converting once-through system into a closed–loop system: This requires installation of cooling
tower, a temperature controller and a cartridge filter to remove any suspended particles present in the waste cooling water. Further, periodic injection of fresh water is required as a make up for the evaporation loss.
4.5.6 Recovery and recycling of clean water from vacuum pumps Fresh water is used for sealing/cooling in vacuum pumps of paper machine section. Vacuum pumps are used to supply vacuum to vacuum drum pulp washers, wire section and press section of the paper machine. Vacuum pumps are typically liquid ring pumps which use water for sealing and cooling. Water usage is continuous and highly depending upon the size of the pump. The wastewater is mostly non-contaminated and can be used in the pulp mill for pulp dilution, decker thickener showers, brown stock washing after recycling. Recycling of sealing water requires the installation of vacuum flume tank. Sealing wastewater from all the vacuum pumps in paper machine section is collected in a tank and by the action of centrifugal action, suspended particles are separated from it. About 50% of the clear filtrate goes back to vacuum pump as sealing water and rest is collected in water conservation tank. In the water conservation tank, fresh water is added as make up and is recycled back to the plant for different uses.
47UNEP, Environmental management in the pulp and paper industry, Technical report, UN Environmental programee for industry and environmemnt 48 Technical EIA Guidelines Manual for Pulp and Paper Industries, Ministry of Environment and Forest, Government of India 49 Clean Technologies in US industries: Focus on Pulp & Paper, Pollution Prevention Assistance division, United States‐Asia Environmental Partnership, September 1997

City
4.5.7 Seal watSeal watWater lu An Interwith medamageseals. Uequivale Water lutransmitsa self luamalgamconsumpgenerati
4.5.8 Paper mwater. Fthe wire paper bshower c These cefficient machinethe rangfresh weffluent5
4.5.9 Decker showersnozzle densures corrosioshowersthe wash
50 DeveloDelhi
51 EnergyEric MProtec
52 DeveloDelhi
53 FederaReduct
ywide Partner
Better W
Replacemter used in vter flows are
ubricated pum
national Papchanical sea, reduced wa
UK tissue ment to 1,320 g
ubricated pums power fromubricating comated with ption but alson52.
Installatiomachine showFresh water s part of pape
based industconsumes th
conventional showers wites. Water effge of 5-7 m3
water which 53.
Use of effithickeners a
s consume ladesign (e.g. n optimum wan. Functionin
s. Oscillating hing efficienc
opment of Gu
y Efficiency Imasanet, Tengftion Agency, Oopment of Gu
ation of Indiation in Freshw
rship for Susta
Water Managem
ment of watvarious pump typically not
mps can be re
per (formerly als with a 95ater contaminill reduced w
gallons per to
mps can alsom the motor tompound arearagraphe f
so reduces th
on of watewers are one showers wither machine. try indicates
he water at th
showers cath fan jet andficient showe3/h. This sch in turn re
icient deckand vacuum arge amount needle jet typater consumng of shower showers at cy and reduc
uidelines for W
mprovement afang Xu, and October 2009uidelines for W
an Chambers water Consum
inable Water U
ment & Cleaner P
ter seals inps can be elimt very high, beplaced with
Union Camp5% success nation, and rwater consu
on of product
o be replaceto the pump we also availafibers. Replahe occurrenc
r efficient of the larges holes are inFICCI case
s that each he rate of 10
an be replad wide angleers consumeheme saves educes the
ker thicken drums for of fresh watepe, flat type, ption. Also wrs should bebleaching ane quantity of
Water conser
and Cost SaviErnst Worrell9 Water conser
of Commerception and Tre
Use and Water
Production Pra
n process pminated by rebut are contin seal less pu
p) mill in Savrate, and cla
reduced mainumption by 6t by using sea
d with diastowith a magne
able. These acement of ce of equipm
showers ast users of frenstalled to clestudy on wa
hole of wam3/h.
ced with wae spray in pae fresh wateconsumptiongeneration
ner/vacuupulp washiner. These sh etc) with mawith the passe regularly mnd high presf water requir
rvation in pulp
ng Opportuni, Environmen
rvation in pulp
e and Industreatment of Co
r Stewardship
ctices in Major
pumps eplacing withnuous and caumps50.
vannah, Geoaimed reducntenance tim66,000 galloal less pump
olic tube pumetic pump. Plubricants hwater lubric
ment damage
at paper mesh ean aste ater
ater aper r in n of of
um drums ng contain showers can baintenance osage of timeonitored to m
ssure nozzlesred for washi
p and Paper
ities for Pulp ntal Energy Te
p and Paper
ry (FCCI) Inteolored Effluen
in SMEs in La
Industrial Sect
h mechanicalan add up to
orgia, replaceced water use after the in
ons per day,ps51.
mp where maPumps with b
ave a colloidcated seals e, maintenan
machines
showers showering sybe replaced wof appropriatee, nozzle diamaintain the s at pulp andng.
sector, Centra
and Paper Indechnologies D
sector, Centra
rventions in nt, A case Stud
ahore, Pakistan
tor of Pakistan
l face seals a large volume
ed water lubsage, reducentroduction o, which was
agnetically coraided packidal mixture not only re
nce time and
ystem. Drillewith nozzles.e pressure inmeter gets w required pred paper sect
al Pollution C
dustries, Klaaivision, U.S. E
al Pollution C
Pulp and Papdy.
n – WSP
34
and lip sealses over time
ricated sealsed equipmentof mechanicas an amount
oupled pumpng seals andof lubricantsduces water
d wastewater
ed perforated An optimum
n the pipelinewiden due toessure in theions improve
Control Board
s Jan KramerEnvironmenta
Control Board
per Sector for
4
.
.
s t l t
p d s r r
d m e o e e
,
, l
,
r

Citywide Partnership for Sustainable Water Use and Water Stewardship in SMEs in Lahore, Pakistan – WSP
Better Water Management & Cleaner Production Practices in Major Industrial Sector of Pakistan
35
4.5.10 Use of high pressure low volume showers Installation of high pressure low volume showers consume lesser quantity of water and therefore reduce the consumption of fresh water.
4.5.11 Use of selfcleaning showers in paper machine section Installation of self cleaning low pressure showers in paper machine section consumes 55 to 60% less fresh water.
4.5.12 Improving white water quality The clarification of white water leads to significant benefits, including the recovery of fiber for reuse, reduced suspended solids loads, and reuse in other facility applications to reduce mill freshwater demand. There are different technologies to clarify paper machine white water which are described here: a. Poly disc filtration system: Poly disc filtration system uses a number of hollow discs to achieve a
high surface area of filtration. Two different qualities of filtrate is produced from this technique. The filtrate initially produced has relatively high-suspended solids content called cloudy filtrate. The next stage filtrate is produced once a mat of fibers has been built up on the disc surface which acts as a filter medium. The suspended solid concentrations in this filtrate is much less and can be easily used for variety of applications like paper machine showers, pump gland cooling/sealing, vacuum pump sealing, etc. Cloudy filtrate is suitable for use in pulp dilution whereas clear filtrate can be used in self-cleaning showers. The saving of fresh water consumption by this system is in the range of 13.3m3 to 26.6 m3/ton of pulp.
b. Krofta /Gravity sedimentation type saveall: Krofta saveall is based on dissolved air floatation
principle whereas other works on sedimentation. This technique is effectively used in wastewater treatment system and found very effective in fibre separation from the paper machine wastewater. Flocculating agents are used in both the system.
c. Drum filters: Drum filters use a rotating cylinder covered with a mesh that acts as the filtration
medium. The filtrate produced contains suspended solids concentrations of 120-150 mg/l. These types of filters are frequently used in broke pulp thickening, decker thickeners, etc.
d. Inclined /Hill Screens: Inclined/Hill screens provide a simple separation system for the recovery of
fiber and clarification of paper machine wastewater. However, they are less frequently used due to lower quality of filtrate produced.
e. The various application of clarified paper machine wastewater is decker thickener showers, vacuum
washers, pulp dilutions before bleaching stage and johnson screen showers54.
f. Hydrodynamic Separator for Raw Material Recovery from white water: This technology is applied in the papermaking section to recover raw material and reduce pollution loads. The hydrodynamic separator is installed above the pulper on the paper making machines, which replaces the conventional white water tanks. White water is pumped directly from the paper machine wire pit and press section to the hydrodynamic separator.
g. The white water enters the separator at an angle designed to induce a cyclonic flow, which holds the
solids in suspension towards the inner shell of the vessel. Clear water separates and flows inwards
54 Development of Guidelines for Water conservation in pulp and Paper sector, Central Pollution Control Board, Delhi

City
beloconchydrcuttitech
h. Rec
activactivof frmea
4.5.13 Low Coamount of wastefiber lotechnolocomparefresh wconsump FICCI capulp sc1,000 Kconsumiwater technolo
4.5.14 After padrum thcompoubut also by 1.4 m
4.5.15 Dry and de-dustiwastewa
55 Cleane(UNEP
56 EnviroNewyo
57 FederaReduct
58 DeveloDelhi
ywide Partner
Better W
ow the annulacentrated at trodynamic seng maintena
hnique is bein
cycling of trvities like gavities thereforesh water. Rasure56.
Installatioonsistency of fresh wat
ewater is gensses. Medi
ogy requiresed to low cowater consption to pum
ase study indcreening tecKL/day of freing additionawith low
ogy57.
Recycling assing the unickener cumnds. Recyclin reduces AO
m3/ton of prod
Dryclean wet cleaningng of straw ater. Dry clea
er Production ), Asian Instituonmental proork. ation of Indiation in Freshwopment of Gu
rship for Susta
Water Managem
ar baffle, ovethe bottom oeparator is sance requiremng used in Ar
reated effluardening, plare treated wa
Researchers
on of medipulp screener for dilutio
nerated with um consistes less amoonsistency scsumption. Mp the extra w
dicated that mchnology (2.sh water whal input of 1consistency
of chlorinnbleached pu
m washer. Tng of this filtrX containing
duct58.
ning of wheg techniques not only saaning also red
in Pulp and Paute of Technotection strate
an Chambers water Consumuidelines for W
inable Water U
ment & Cleaner P
erflowing the f the separat
shaped to relments. Solidrjo Wiggins F
ent for nonantation and astewater ca report that 5
ium consisn consumesn and large more percenency pulp ount of wacreening andMoreover,
water is also s
medium cons.5%) saved hich was pre1,000 KL/da (1%) sc
ne wash baulp through he filtrate grate completeg wastewater
eat straw s are used toaves the coduces the am
aper Industryology (AIT). egies for sus
of Commerception and TreWater conser
Use and Water
Production Pra
central circutor, ready forease solids, removal eff
Fine Papers L
n process utoilet flushin
an be used in50-100 m3 fre
stency pulps huge volume
ntage of screen
ater as d saves
energy saved.
sistency about
eviously y fresh reening
ackwater ca chlorinatioenerated froely back to th generation.
o clean the ransumption o
mount of silic
, Technology
tainable deve
e and Industreatment of Corvation in pulp
r Stewardship
ctices in Major
ular weir wher the next pul reducing theficiency of HLimited Stow
use: Fresh wng. As qualitn these activitesh water ca
p screenin
completelyon tower, it iom this washe system noThis techniq
aw material of freshwatea in the straw
Fact Sheets, U
elopment, Sp
ry (FCCI) Inteolored Effluenp and Paper
in SMEs in La
Industrial Sect
en the separaper rechargee number of ydrodynamic
wford Mill,Unit
water is usey of water isties. This wilan be saved
ng equipm
y into the ss washed inher contains
ot only saves ue can save
in agro residr but also aw.
United Nation
pringer Dordr
rventions in nt, A case Studsector, Centra
ahore, Pakistan
tor of Pakistan
ator is full. Te. The conica blockages ac Separator ted Kingdom
ed in some s not essentl reduce the per day by a
ent
system n a conventios mainly org fresh water fresh water
due based inavoids the g
ns Environmen
rechet Heidel
Pulp and Papdy. al Pollution C
n – WSP
36
he solids areal base of theand thereforeis 97%. This55.
non processtial for theseconsumptionadopting this
onal vacuumgano-chlorineconsumptionconsumption
dustries. Drygeneration of
nt Programme
berg London
per Sector for
Control Board
6
e e e s
s e n s
m e n n
y f
e
,
r
,

Citywide Partnership for Sustainable Water Use and Water Stewardship in SMEs in Lahore, Pakistan – WSP
Better Water Management & Cleaner Production Practices in Major Industrial Sector of Pakistan
37
This system is fairly simple; it has low specific power consumption and its investment costs are rather low. Reductions in the silicon content of 20 to 50 % in straw have been reported59.
4.5.16 Reuse of wetcleaning wastewater Wet cleaning is carried out in agro-based pulp and paper industries to clean the raw materials. Effluent generated from wet washing can be passed from sedimentation effluent. Solid will be settled down and supernatant can be reused in other processes60.
4.5.17 Dry and wet cleaning of straw This technology is applicable in the agro residue based industries to reduce the pollution load of the effluent. Washers are used to wash the straw and dreg remover is used to remove unwanted part of the straw. This kind of dry-wet straw material preparation can remove mud, sand, grains, leaves and nodes, which cannot turn into fibers but consume chemicals in the course of digesting and bleaching. This process improves pulp quality and reduces the quantity of pollutants generated in black liquor. Mud, sand and grains removal up to 0.3 to 0.7%, leaves and nodes removal up to 5 to 6% are achievable with this technology. In addition, silica content of black liquor is reduced from 4.14 g/l to 3.59 g/l, which is favorable for alkali recovery. For implementation of this technology, the feeding mouth of the four roller feeder needs to be reduced and the hoppers also need to be modified. An additional screw conveyor to transfer the raw material is required and the dreg remover needs to be replaced by dehydroextractor. This technique is widely used in China.
4.5.18 Disc cutter for removal of noncellulosic material from straws For removal of non-cellulosic material like leaf, fines and dust from straws having moisture less than 15%, disc cutter along with air blower and cyclone can be employed in the raw material preparation stage. This process also reduces the silica content in the black liquor thereby enabling the chemical recovery. Removed material can be used as fuel after briquetting or mixing with concentrated black liquor. In addition to reduction in consumption of chemicals, energy, silica content and pollution load can be reduced up to 20 to 25%. This process is highly suitable for small scale pulp mills and is being successfully used in India.
4.5.19 Fiber recovery by dissolved air floatation In pulp and paper units, lot of short fibers and fillers escape with water through the paper machine wire, thickeners etc. This loss can be up to 7-8% of net production. Dissolved Air Floatation (DAF) technique is used to capture the fibers to reduce the pollution load and recycle the water for process. Floating sludge separated in the DAF units is with high solid consistency (2.3%) and can be directly recycled. High molecular weight polyelectrolytes ensure flocculation of smallest colloid and also help as retention aid on machine wire. The implementation of this technology requires installation of surge tanks, scraping devices for floating matter and pumps for feed water and recovered fiber. DAF technology is being successfully used in Star Paper Mills Ltd. Saharanpur Uttar Pradesh, India.
59Paavilainen, L.: Modern non‐wood pulp mill – process concepts and economic aspects, TAPPI Proc. North American Nonwood Fiber Symposium, Atlanta, GA, p.227 (1998). b) Preparation of Biosilica‐enriched Filler and an Example of its Use in a Nano‐Particle Retention System, Jan Pekarovic, Alexandra Pekarovicova and Paul D. Fleming III, Department of Paper Engineering, Chemical Engineering, and Imaging, Western Michigan University, A‐23, Parkview, Kalamazoo MI 49008.
60UNEP, Environmental management in the pulp and paper industry, Technical report, UN Environmental programme for industry and environment.

Citywide Partnership for Sustainable Water Use and Water Stewardship in SMEs in Lahore, Pakistan – WSP
Better Water Management & Cleaner Production Practices in Major Industrial Sector of Pakistan
38
4.5.20 Extraction of black liquor using screw press For agro-residue based mills, having no chemical recovery system in place, extraction of black liquor using screw press before pulp washing reduces the water and time requirement for lignin removal. The extracted black liquor, having high solid content, can be reused as secondary fuel after solar evaporation and mixing with agro washes viz. straw screenings etc. In addition to this, part of the recovered black liquor can be reused for impregnation to utilize residual cooking chemical and heat. For black liquor extraction, one of the low cost options is the installation of screw press in between blow tank and pulp washer. Part of black liquor is used for pulp dilution and part for treatment and disposal. This system reduces the water requirement up to 50%.
4.5.21 Oxygen delignification for agrobased pulp Bleaching of pulp in the paper mill is carried out in multi-stages using various bleaching chemicals such as chlorine, hypochlorite and chlorine dioxide to achieve brightness of pulp. Chlorine compounds in bleaching generate toxic effluents having poor degradability. Chlorinated compounds can be replaced by oxygen, ozone or hydrogen peroxide bleaching mainly for wood pulp bleaching. As per experience from wood pulp, pre-bleaching with oxygen reduces the lignin content by almost 50%. Oxygen delignification at alkali extraction stage reduces the AOX (toxicity) level considerably and increases the delignification degree. Oxygen can be applied on pre-bleaching stage to reduce kappa number. This is a well applied technology for wood based mills. This technique reduces the BOD and COD values by 60 % and reduction in color by 80 %.
4.5.22 Defiberisation of agrobased pulp as alkaline hot stock refining Refining requirements vary according to raw material used and final product quality. For agro-based pulp, the process is actually defibrisation rather than refining. Conventionally, refining is done after pulp washing i.e. in cold and neutral pH. Due to morphology of agro based pulp having short fibre length (like straws), during refining, there is more possibility of breaking fibres into smaller fibres (fragments), which generate higher pollution load. Hot stock refining before washing pulp in alkaline medium avoids over refining due to its slippery action and energy requirements are also reduced considerably. Hot stock refining is adopted successfully in few mills using straw as raw material. One example is Ashoka Pulp and Paper Mills, India. This technology considerably reduces the water pollution load61.
4.6 FEASIBLE TECHNIQUES FOR LOCAL INDUSTRIES
CPI had been working with pulp and paper sector of Pakistan during the year 2007-2010 with the objective to enable this sector to comply with national and international environmental requirements and to adopt best energy efficiency practices. The geographical location of this sector is Punjab, Sindh and few in Khyber Pakhtunkhwa. Programme for Industrial Sustainable Development – I (July, 2007- June, 2010) The Programme for Industrial Sustainable Development (PISD), a three year project (2007-2010) was launched by the embassy of the Kingdom of the Netherlands (EKN) in collaboration with the Cleaner Production Institute (CPI) for cleaner production and energy efficient technologies implementation in five major industrial sectors of Pakistan. The program was started with the aim of providing technical assistance for safe environmental and cost effective production in 15 pulp and paper mills of Pakistan.
61 Cleaner Production in Pulp and Paper Industry, Technology Fact Sheets, United Nations Environment Programme (UNEP), Asian Institute of Technology (AIT).

Citywide Partnership for Sustainable Water Use and Water Stewardship in SMEs in Lahore, Pakistan – WSP
Better Water Management & Cleaner Production Practices in Major Industrial Sector of Pakistan
39
Under this programme, CPI had implemented the following cleaner technologies and energy efficient technologies under a cost-effective framework with direct and indirect financial paybacks. Control of water leakage Dry cleaning system improvement SO2 water drainage control system Installation of thickener Process modification by adding Johnson screens and three stage centri cleaner Installation of high pressure screens Installation of centri-cleaner battery Installation of high density cleaner Control of compressed air leakage Improvement in lighting of MCC Installation of electronic relays Installation of inverters Installation of paper machine hood Installation of steam flow meter Installation of steam pressure indicator Installation of steam traps Insulation of bare steam lines Power factor improvement and improvement of lighting system Replacement of motors Replacement of piston compressor with screw Steam leakage control Various water conservation options

Citywide Partnership for Sustainable Water Use and Water Stewardship in SMEs in Lahore, Pakistan – WSP
Better Water Management & Cleaner Production Practices in Major Industrial Sector of Pakistan
40
5 TEXTILE PROCESSING SECTOR
Textile is the largest industrial sector of Pakistan with respect to production, export and labor force employment. Pakistan is the 8th largest exporter of textile products among Asian countries and 12th globally. The textile sector has existing established capacities of 1,550 million kg of yarn spinning, 4,368 million square meters of fabric weaving and 4,000 million square meters of fabric finishing. It contributes 8.5% of the country’s GDP and 52% in the export. This sector employs 38% of the manpower in the manufacturing sector and accounts for 31% of the total investment in the country.
Major textile export products include cotton fabrics, knitwear (hosiery), cotton yarn, bed wares, readymade garments, towels, synthetic textile and raw cotton.
5.1 GEOGRAPHICAL LOCATION Textile processing is one of the most value added sub sector in the textile. In Punjab and Sindh, the number of textile processing units is estimated to be around 1,545. Out of these units, about 841 are the woven processing units and the rest are knitwear processing (hosiery) units. These units carry out various textile processes, including pretreatment, dyeing, printing and finishing. The number of textile processing units in Punjab is estimated to be around 1,395. Out of 1,395 units, about 691 are the woven textile processing units and the rest are knitwear processing (hosiery) units. Estimated total production of textile processing sector in Punjab is 9,500 million meters/year for woven textiles and 2,200 million kg/year for knitwear textiles. Figure 5.1 shows the location of textile processing industries in Punjab while Figure 5.2 shows the intra city distribution of textile processing units62.
62 Pakistan EPA, “Draft Textile Sector Report”, prepared by Activity Based Capacity Development Project

City
Figure 5
Figure 5
0
50
100
150
200
250
300
350
400
ywide Partner
Better W
5.1: Presenc
RahYa
Kh
Raj
5.2: Location
0
0
0
0
0
0
0
0
0
Faisalabad
283 2
rship for Susta
Water Managem
ce of Textile
DeraGhaziKhan
La
B
himar
han
Muzaffargar
anpur
n of Textile P
d Lahore
2702782
inable Water U
ment & Cleaner P
Processing
Lodhhran
A
Mianwali
ayyah
Khanewa
Khusha
hakkar
Jhang
rh
Bahawalpur
Multan
Processing
Gujranwala
68
245
1
Woven
Use and Water
Production Pra
g Industries
Attock
Rawalpi
Chakwal
Chiniot
Vehari
Bahawaln
al
b
Sargodha
Faisala
TobaTek
Singh
Sahiwal
Industries i
a Sialkot
179
Knitwear
r Stewardship
ctices in Major
in Punjab
indi
Jhelum
Gujra
Hafizabad
agar
MandiBahauddin
Gujr
Sh
NankanaSahibabad
Okara
Pakpattan
n Punjab
Multan
351
in SMEs in La
Industrial Sect
at
Sialkot
Narowalranwala
ekhupura
Lahore
Kasur
Others
35
ahore, Pakistan
tor of Pakistan
n – WSP
41
1

Citywide Partnership for Sustainable Water Use and Water Stewardship in SMEs in Lahore, Pakistan – WSP
Better Water Management & Cleaner Production Practices in Major Industrial Sector of Pakistan
42
Table 5.1: Intra City Distribution of Textile Processing Units Type Faisalabad Lahore Gujranwala Sialkot Multan Others Total
Woven Textile Processing
Large 50 30 5 - 4 8 97
Medium 135 135 30 - 23 20 343
Small 98 105 33 - 8 7 251
Sub Total 283 270 68 - 35 35 691
Knitwear Processing
Large 55 35 - 25 - - 115
Medium 113 120 1 98 1 - 333
Small 110 90 - 56 - - 256
Sub Total 278 245 1 179 1 - 704
Total 561 515 69 179 36 35 1,395
The city wise distribution of textile mills has been established on the basis of information available from CTP-Textile project (Cleaner Technology Program for Textile Industry), All Pakistan Textile Processing Mills Association (APTPMA) and Pakistan Hosiery Manufacturing Association (PHMA). Categorization of industries in terms of small, medium, and large units has been done on the basis of the annual production of fabric in million meters. The small units process below 10 million meters of fabric annually, medium units annually process between 10 and 20 million meters of fabric while large units process in excess of 20 million meters of fabric annually.
5.2 TEXTILE PROCESSING SECTOR PRODUCTION Estimated total production of textile processing sector in Punjab is 9,500 million meters/year for woven textiles and 2,200 million kg/year for knitwear textiles63.
5.3 WATER CONSUMPTION Water consumption in medium industry is comparatively higher than large and small industries. Large industries have latest high tech machinery with proper process control instrumentation to produce very good quality of the fabric. All the processes are conducted at controlled process conditions with optimized water consumption. Secondly, due to economies of scale, unit water consumption in large industry is less than the medium industry. On the other hand, medium industry processes medium to very high finished quality (export quality) fabric with the old conventional machinery. Due to lack of process control instrumentation, proper process control conditions are not maintained. Chemicals added in the process do not work efficiently, if proper operating conditions are not maintained in process baths. Therefore, excessive fabric washes are carried out, to achieve the desired quality of the fabric hence increases water consumption. Generally, low to medium quality fabric is processed in small industry. Small industry has limited number of machinery and conduct only selected unit processes. Some of these processes do not involve extensive
63 Data given by Cleaner Technology Program for Textile Industry (CTP)

Citywide Partnership for Sustainable Water Use and Water Stewardship in SMEs in Lahore, Pakistan – WSP
Better Water Management & Cleaner Production Practices in Major Industrial Sector of Pakistan
43
water consumption. This is one of the reasons of lower water consumption in small industry than medium and large industry. Based on the findings of environmental audits conducted under PISD, typical utility consumption for each kg of fabric is given in Table 5.2. Table 5.2: Water Consumption in Textile Industries
Utilities Unit Water Consumption (l/kg fabric processed)
Punjab Sindh
Water (liters) 70 - 400 25-140 Ref: CTPT database
5.4 WASTEWATER POLLUTION Following processes are the main sources of wastewater generation; a) Desizing b) Bleaching / scouring c) Mercerization d) Dyeing e) Printing f) Boiler g) Cooling water wastage h) Laboratory
5.4.1 Wastewater pollution characteristics at unit level Characteristics of process wastewater vary from industry to industry depending on the technology in use and in-house operational practices. A significant part of the process wastewater results from periodic discharges from various types of batch or continuous processes, with varying discharge intervals. This factor, in addition to the variation in flows, also, results in relatively higher short-term fluctuations in the characteristics of the wastewater. The variation in characteristics is also a function of the time schedule of discharges. Relatively high pollutant concentrations may be encountered for short periods, in case of simultaneous discharges from different batch processes. Table 5.3 and 5.4, presents the characteristics of composite woven textile processing wastewater and composite knitwear processing wastewater respectively.
Table 5.3: Characteristics of Woven Textile Processing Wastewater
Parameter[1] Type of Industry NEQS
(Into Inland Waters) Dyeing Dyeing-Printing
pH 8.3 – 11.7 6.3 – 12.0 6 – 9
Biochemical Oxygen Demand (BOD) 200 – 570 300 – 480 80
Chemical Oxygen Demand (COD) 640 – 1,200 880 – 1,130 150
Total Suspended Solids (TSS) 320 – 940 200 – 440 200
Oil and Grease (O&G) 17 – 32 11 – 40 10
Total Dissolved Solids-Incremental (TDS-I) 1,280 – 1,540 1,000 – 1,900 3,500
Chloride-Incremental (Cl-I) 400 – 750 90 – 1,100 1,000
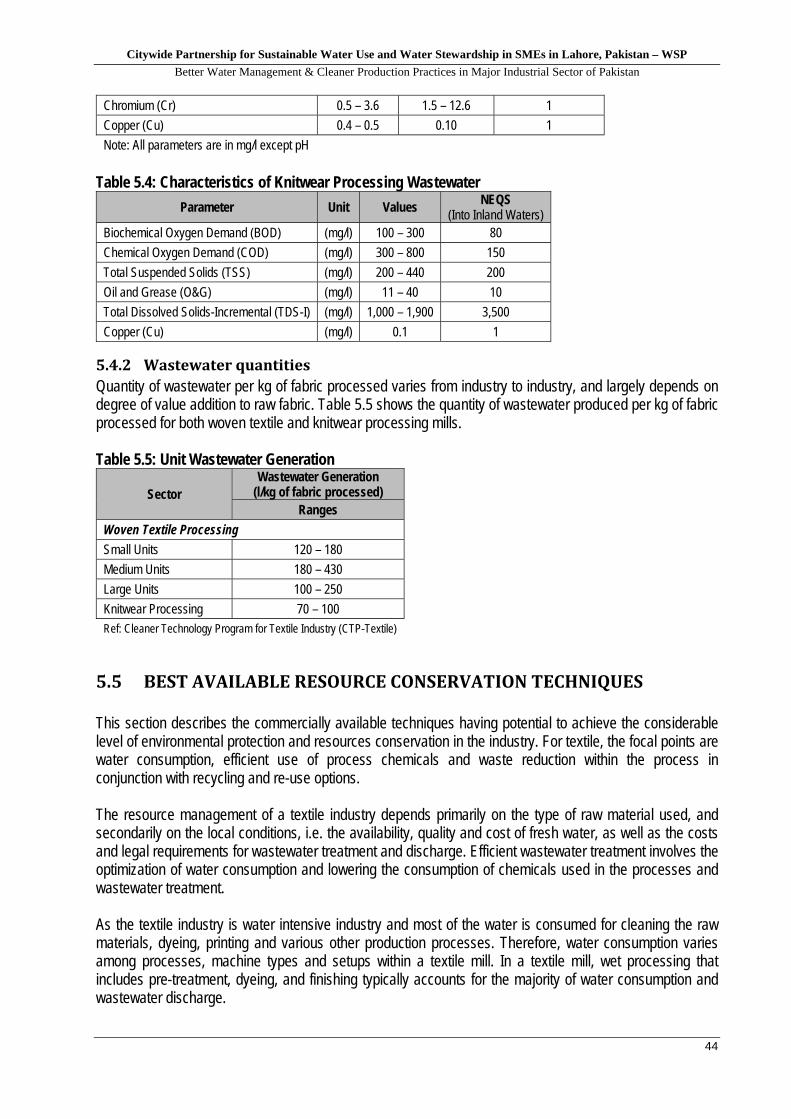
Citywide Partnership for Sustainable Water Use and Water Stewardship in SMEs in Lahore, Pakistan – WSP
Better Water Management & Cleaner Production Practices in Major Industrial Sector of Pakistan
44
Chromium (Cr) 0.5 – 3.6 1.5 – 12.6 1
Copper (Cu) 0.4 – 0.5 0.10 1
Note: All parameters are in mg/l except pH Table 5.4: Characteristics of Knitwear Processing Wastewater
Parameter Unit Values NEQS (Into Inland Waters)
Biochemical Oxygen Demand (BOD) (mg/l) 100 – 300 80
Chemical Oxygen Demand (COD) (mg/l) 300 – 800 150
Total Suspended Solids (TSS) (mg/l) 200 – 440 200
Oil and Grease (O&G) (mg/l) 11 – 40 10
Total Dissolved Solids-Incremental (TDS-I) (mg/l) 1,000 – 1,900 3,500
Copper (Cu) (mg/l) 0.1 1
5.4.2 Wastewater quantities Quantity of wastewater per kg of fabric processed varies from industry to industry, and largely depends on degree of value addition to raw fabric. Table 5.5 shows the quantity of wastewater produced per kg of fabric processed for both woven textile and knitwear processing mills. Table 5.5: Unit Wastewater Generation
Sector Wastewater Generation
(l/kg of fabric processed) Ranges
Woven Textile Processing
Small Units 120 – 180
Medium Units 180 – 430
Large Units 100 – 250
Knitwear Processing 70 – 100
Ref: Cleaner Technology Program for Textile Industry (CTP-Textile)
5.5 BEST AVAILABLE RESOURCE CONSERVATION TECHNIQUES This section describes the commercially available techniques having potential to achieve the considerable level of environmental protection and resources conservation in the industry. For textile, the focal points are water consumption, efficient use of process chemicals and waste reduction within the process in conjunction with recycling and re-use options. The resource management of a textile industry depends primarily on the type of raw material used, and secondarily on the local conditions, i.e. the availability, quality and cost of fresh water, as well as the costs and legal requirements for wastewater treatment and discharge. Efficient wastewater treatment involves the optimization of water consumption and lowering the consumption of chemicals used in the processes and wastewater treatment. As the textile industry is water intensive industry and most of the water is consumed for cleaning the raw materials, dyeing, printing and various other production processes. Therefore, water consumption varies among processes, machine types and setups within a textile mill. In a textile mill, wet processing that includes pre-treatment, dyeing, and finishing typically accounts for the majority of water consumption and wastewater discharge.

Citywide Partnership for Sustainable Water Use and Water Stewardship in SMEs in Lahore, Pakistan – WSP
Better Water Management & Cleaner Production Practices in Major Industrial Sector of Pakistan
45
Numerous techniques have been developed to conserve water in textile mills. Few of the best worldwide available techniques for water conservation in textile mills are given below:
5.5.1 Good housekeeping and management measures A reduction in water use of 10 to 30 percent can be accomplished by taking strict housekeeping measures. Good housekeeping measures often carried out without significant investments, but leading to substantial cost savings and the saving of water, chemicals and energy.64 Following are the good housekeeping measures that can contribute significantly in reduction of water consumption of a textile mill. Leaks and spills control. Monitoring & measurement of water carrying lines by installing water meters Workers training Identifying unnecessary washing of both fabric and equipment and simple turn off the water when
machines are not operating
5.5.2 Countercurrent washing/rinsing The water consumption of rinsing processes varies considerably between textile mills. The technique of counter-current washing can be applied on continuous preparation and dye ranges that conserves not only water but also contribute in energy savings. In counter current washing, the water flows in the direction opposite to the fabric. This technique is established common on all continuous ranges of washing and rinsing in textile industry. Additionally, counter-current washing can be applied at de-size washers, scour washers, mercerizing washers, bleach washers, dye ranges, and print house soaper ranges.
5.5.3 Reuse of process water The rinse water from the scouring operation is adequate for reuse in other processes such as de-sizing that do not require water of an extremely high quality. This reuse is particularly true with scouring wastes from synthetic or cotton/synthetic blend fabrics. Scouring rinses may, in certain cases, also be reused to wash floors and equipment. Further, mercerizing or bleaching rinse water can also be used in scouring and de-sizing operations as long as size recovery is not practiced. Generally, the caustic or bleach stream will degrade many size compounds to an extent that they cannot be recovered. Similarly, the rinse water of final dyeing batch operation can be used in previous rinsing or even subsequent dyeing batch. The colored wastewater from the soaping operation can also be reused at the back grey washer, which does not require water of a very high quality. Alternatively, the wastewater can be used for cleaning floors and equipment in the print and color shop65.
5.5.4 Reuse of noncontact cooling water Good quality and high temperature of non-contact cooling water can be reused at various processes such as in desizing, scouring, washing, or rinsing. Furthermore, at a discharge temperature of 45°C and considerable water volume, discharge of cooling water stresses the wastewater treatment system. It is thus highly beneficial to keep such large quantities of hot, clean water out of the treatment system. Responsible Sourcing Initiative (RSI) found that some mills were either not reusing this water at all or were using it in cold water processes that did not benefit from the heat. RSI identified three sources of non-contact cooling water that can be most beneficially recaptured and reused: water used in singeing, preshrink machines,
64 Pakistan Textile Journal, 2009 65 Integrated Pollution Prevention and Control (IPPC) Reference Document on Best Available Techniques for the Textiles Industry, July 2003, European Commission.

City
and in awell, suc
5.5.5 A large processiconvertecourse otemperaefficientlthe boilethis condfor washand hea
5.5.6 a. Was
batcprocobtawasas w
b. DyeInveTechtechto rereacnot o
c. Princleacleaotheclea
5.5.7 The auconservasystemsof waterand havdisplace
66 NRDC’ssourcing.67 Pakista
ywide Partner
Better W
air compressoch as from ba
Reuse of c amount of ing for dyeined into condof its use. A
ature water,y into the bo
er for steam densate wathing or desizt.
Process mshing Procech washed bycess optimizaained by a 3 hing optimiza
well as polluti
eing Processerse Dyeing hnique, dispe
hnique, the fiemove dyes ctive dyes anonly reduces
nting Procesaning of screaning of blanker parts, the aning equipm
Automaticutomated coation of wa
s and poor wr. Manual wave a potentiaement spillag
s Ten best pra. an Textile Jour
rship for Susta
Water Managem
or systems. atch jet dyein
condensatesaturated s
ng purposesdense water As the conde therefore
oiler by restor generation. er can be sezing, thereby
modificatioess Optimizay a 10 minuteation, a seriminute hot ration, a largeon loads.
s: The chang Technique erse and fibeber is dyed w and acetic a
nd then acidics the water an
ss: The conveens, blankeket consideramethod of sent contribut
c control sontrol systeter in any
working practater control vl of overfilling
ge during im
actices for tex
rnal, 2009.
inable Water U
ment & Cleaner P
Other sourceng machines.
e water steam is use. Some of t (condensatensate is pu
this can ring and retu Additionallyerved as a wy recovering
ons ation: In texte hot runningies of full-scrunning rinsee quantity of
ge of the dyeis being us
er reactive dwith disperseacid. On thec disperse dynd energy de
ventional texet and otherably reducespraying watetes in major w
systems ems are vetextile mill. tices can leavalves cannog during fillinmersion of t
xtile mills to sa
Use and Water
Production Pra
es of cooling.66
ed in textile hose steam te) over the re and high be reused
urn it back to , in few mill
water supply both water
tile mills, theg rinse followecale experime followed byf water can b
eing techniqused by manyes are used
e dyeing at ee other handye bath is usemands but a
xtile printing r parts. The the water co
er by the cyliwater savings
ery importaThe absenc
ad to significaot be operateng and rinsinthe fiber in t
ave money an
r Stewardship
ctices in Major
g water may
e caustic scoed by a 10 m
ments revealey a 3 minute be saved tha
ue saves a lony progressd for dyeing elevated temp, in Rapid Ined to wash talso minimize
process con new technionsumption. ndrical shaps.
ant for the ce of these ant wastage ed efficiently ng. Similarly, the machine
nd reduce poll
in SMEs in La
Industrial Sect
be available
ured cotton yminute cold rued that the cold running
at ultimately r
ot of water in ive textile mpurposes. Wperature andnverse Dyeinhe fiber reace the duration
nsumes higheque of usin Similarly, for
pe broom and
ution. A pract
ahore, Pakistan
tor of Pakistan
e elsewhere i
yarn packagunning rinse. same fabric rinse67. By reduces the
textile sectomills. In Ra
Whereas, in nd then washeng, the fiber ctive dyes. Thn of the dying
er quantitiesg vacuum er cleaning of d usage of h
tical guide for
n – WSP
46
in the mill as
es are being For washing
c quality wasadopting thisconsumption
or. The Rapidpid Reversenormal or olded with wateris dyed with
his techniqueg process.
of water forextraction for screens and
high pressure
r responsible
6
s
g g s s n
d e d r h e
r r d e

Citywide Partnership for Sustainable Water Use and Water Stewardship in SMEs in Lahore, Pakistan – WSP
Better Water Management & Cleaner Production Practices in Major Industrial Sector of Pakistan
47
may account for up to 20 % of total operating volume over the course of a dyeing cycle68. This may also lead to losses of dyes and hazardous chemicals if these are introduced before the displacement takes place. Therefore, all machines but in particular the dyeing machine should be fitted with modern control equipments to control both the fill volume and the liquor temperature.
5.5.8 Raw materials control Raw materials of different types are used in textile industry like processing water, dyes, process chemicals and substrate (yarn, fabric, etc.). In most of the mills, chemicals are used and applied in excessive and unnecessary amounts. This chemical consumption can often be reduced without any significant effects on the quality of the product. Chemicals that are often overused include cleaning agents, surfactants, defoamers, lubricants, carriers and other chemical specialties. Sometimes, chemicals are also even added to counteract the negative effects of other chemicals. Therefore, control of high & overdose of raw materials in dyeing and printing processes can lead to minimize the undesirable wastes in wastewater streams.
5.5.9 Chemical optimization and substitution Most of the chemicals used in the textile processing industry are not retained in the fiber but washed away that result in higher pollution loads and therefore higher treatment costs. The pollution loads can be reduced by adopting the optimization of chemical consumptions and by substituting the more polluting chemicals with less polluting chemicals. However, these options vary from process to process and industry by industry. The following Table 5.6 shows a few of the chemical substitutions made by textile mills to reduce BOD and improve effluent quality.
Table 5.6: Reducing BOD at Source by Possible Chemical Substitutions
Application Current Material Substitute Material
Sizing Starch PVA/acrylates
Acid de-sizing Enzymatic Mineral acids
Washing Soaps (140% BOD) Synthetic detergents (0 - 2.2% BOD)
Neutralizing scoured goods Soda ash Sodium acetate (converts mineral acidity into organic acidity)
pH adjustment in disperse dyeing and pigment printing
Acetic acid
Ammonium sulphate (although salt concentration increases, the ammonium serves as a nutrient in the biological treatment process)
Textile printing Gum-thickening Emulsion thickening (full or partial)
Oxidation of vat dyestuffs Acetic acid Sodium bicarbonate in conjunction with peroxide or perborate
Finishing Temporary starch-based finishes Durable resin finishes
Dyeing of blended varieties in pale shades
Two-stage dyeing using two different classes (eg polyester using disperse, and celluloses using vat, reactives)
Single class dyestuffs like Indigosol, pigments
Polyester dyeing Other carriers Monochlorobenzine
Dye bath acid Acetic acid (0.64 kg BOD/kg), Carding oils and anti-static lubricants
Formic acid (0.12 kg BOD/kg) Non-ionic emulsifiers
Ref: Water and chemical use in the textile dyeing and finishing industry. A practice guide by the Environmental Technology Best Practice Programme.
68 Integrated Pollution Prevention and Control (IPPC) Reference Document on Best Available Techniques for the Textiles Industry, July 2003, European Commission.

Citywide Partnership for Sustainable Water Use and Water Stewardship in SMEs in Lahore, Pakistan – WSP
Better Water Management & Cleaner Production Practices in Major Industrial Sector of Pakistan
48
5.5.10 Dye fixation improvement Better fixation of dyes on fiber or cotton yard contributes to lower chemical use and lower effluent contamination. Usage of higher fixation dyes like bi-reactive dyes that have a higher affinity for fabric than average require less salt usage and rinsing and therefore less dye must be then treated in the wastewater treatment plant. High fixation reactive dyes can be applied in all types of dyeing machines, but offer particular advantage on the most modern low liquor ratio dyeing machines fitted with multi-task controllers69.
5.5.11 Printing process modification The use of digital printing is gaining an importance in textile industry as an alternative to conventional analogue printing. In digital printing the selected dyes are dosed on-demand with computed requirements. Therefore, it reduces the wastage of printing paste residues at the end of each printing cycle. Further, this printing modification also contributes a lot in the minimization of pollution loads generated by textile industry.
5.5.12 Reuserecyclerecovery The water discharged from various machines or sections of textile mill like bleaching and mercerizing machines can be collected and reused for other processes, instead of discharging it directly to wastewater treatment. Similarly, the colored wastewater from the soaping operation can be reused at the back grey washer which does not require water of a very high quality. Alternatively, the wastewater can be used for cleaning floors and equipment in the print and color shop.
5.5.13 Reuse of hot wastewater Reuse of hot wastewater can be considered as one of the main heat recovery and pollution load reduction options in textile industry along with other savings of water and chemicals. Therefore, dyeing and finishing specialists claim that wastewater from light shade operations can be re-utilized up to 20 times. In addition, washing, mercerizing and bleaching machines often operate continuously for long hours requiring hot water intakes and simultaneously produces a large volume of hot wastewater. Therefore, the heat from hot wastewater leaving the machines can be recovered by heat exchangers and then reused for the purpose of heating up the intake cold water stream to minimize the load of heating equipments.
On the other hand, if there is no reuse and heat recovery option available at departmental level then the feasibility of installing a centralized heat recovery system should be investigated. In centralized heat recovery option, the hot wastewater is stored in a large tank from where a hot stream is pumped to heat exchanger in order to warm up the process water. The results of various experiments showed that the payback period centralized recovery option is invariably more than 12 months and a payback of 18 to 36 months is common70. However, in some cases this payback period can extend to more than 10 years in spite of the availability of a large volume of wastewater at high temperatures71.
5.6 FEASIBLE TECHNIQUES FOR LOCAL INDUSTRIES It was greatly felt during 1996-1999 under ETPI project to start environmental improvement activities in the textile sector of Pakistan. Therefore, considering the demand of environmental improvement work in progressive textile mills, one project ICPT in 2001-02 was launched with the vision to extend it for 3-6 years in future.
69 UBA, (2001). "BAT Reference Document – Germany. 70 EEO (1992a). Decentralisation of steam supply in small industrial site, CS 134, Energy Efficiency Office, UK 1992. 71 Woodall L. and Godshall E., (1976). Energy economy in a dyehouse, Textile Industry, October 1976, p105

Citywide Partnership for Sustainable Water Use and Water Stewardship in SMEs in Lahore, Pakistan – WSP
Better Water Management & Cleaner Production Practices in Major Industrial Sector of Pakistan
49
Implementation of Cleaner Production Technologies in the Textile Sector of Pakistan (2004-2007) After the completion of ICPT (also known as CTP-Textile), CPI started to work with textile sector of Pakistan in 2004 under the 2nd phase (2004-2007) of the above mentioned project. The objective of the CPI work was to enable the progressive textile mills of the textile processing sector to comply with national and international environmental requirements and standards by adopting best cleaner and energy efficient practices. The geographical location of this sector was mainly Punjab and Sindh. Programme for Industrial Sustainable Development – I (July, 2007- June, 2010) The Programme for Industrial Sustainable Development (PISD), a three year project (2007-2010) was launched by the embassy of the Kingdom of the Netherlands (EKN) in collaboration of Cleaner Production Institute (CPI) for cleaner production and energy efficient technologies implementation in five major industrial sectors of Pakistan. The program was started with the aim of providing technical assistance for save environmental and cost effective production in 125 textile processing and spinning mills of Pakistan. Programme for Industrial Sustainable Development – II (July, 2010- June, 2013) Under the 2nd phase of PISD, the technical assistance was continued to the textile processing sectors of Pakistan along with other major industrial sectors. The overall objective of the programme was that the major industrial sectors of Pakistan adopt best environmental and energy efficiency practices. Under the above mentioned projects and other various textile sector studies, CPI has implemented the following cleaner technologies and energy efficient technologies under a cost-effective framework with direct and indirect financial paybacks. Reuse, Recycling and Recovery (RRR) Options Reuse of cooling water from singeing, oil heater and compressors Reuse of mercerization wash water for post desizing washing Reuse of RO rejected water Reuse of soaper wastewater for blanket and screen washing Reuse of spent water of washing pits in the next washing (bleaching) Reuse of acid spent bath Reuse of chiller cooling water of chiller, jet and compressor Installation of system piping for cooling water return from singeing machine to raw water tank Reuse of flash steam Reuse of steam condensate Installation of caustic recovery plant at mercerization wastewater Installation of heat exchanger at soaper, bleaching, compressor and on continuous blow down of boiler Installation of heat exchanger like economizer and other heat recovery system Reuse of steam condensate Installation of bleaching plant heat exchanger Installation of caustic recovery plant Heat recovery from gas generator through water heating Better Practices and Proper Maintenance Installation of appropriate capacity boilers Installation of softener at boiler feed water Installation of water shutof valves Insulation of bare hot surfaces (Steam pipe lines, condensate lines, condensate storage tank, jets and
jet heaters) Up keep of steam traps

Citywide Partnership for Sustainable Water Use and Water Stewardship in SMEs in Lahore, Pakistan – WSP
Better Water Management & Cleaner Production Practices in Major Industrial Sector of Pakistan
50
Water, air and steam leakages control Air emission monitoring of boiler and generators Ambient air improvement/ventilation improvement Calibration and installation of temperature gauges Compressed air consumption and leakage monitoring Construction of primary settling tank for processing effluent treatment Energy efficient lighting system Installation of water trigger nozzle on water hoses Proper chemical storage and handling Replacement of magnetic ballasts with electronic ballasts Resource conservation in washing and rinsing Safe chemical handling and storage Use of process control instruments
Automatic Control Systems Blow down on the basis of TDS Installation of steam & gas flow meters Installation of temperature gauges and optimization of process temperatures Installation of water flow meters Installation of inverter at hydro extractor, compressor, stenter fan, water turbine Installation of online oxygen trimming system on boiler Installation of RO plant for boiler feed water and generator cooling water Installation of silencer on boiler fan Installation of temperature gauges on jiggers and process control Installation of temperature controller at soaper Replacement of electrical condensate pump with Ogden pump
Process Modification and Improvement Options Countercurrent washing at mercerizer and soaper Water consumption optimization at bleaching machine and by placing water flow meters New process initiative in (Cold Pad Batch) Process modification in the dyeing neutralization Substitution of chemicals

Citywide Partnership for Sustainable Water Use and Water Stewardship in SMEs in Lahore, Pakistan – WSP
Better Water Management & Cleaner Production Practices in Major Industrial Sector of Pakistan
51
6 SUGAR SECTOR
Pakistan is one of the largest sugarcane producers in the world. It is 5th largest in terms of area under sugarcane cultivation, 11th by production and 60th by the crop yield. Sugarcane is one of the major crops in Pakistan which is cultivated over an area of around one million hectares. Sugar industry plays an important role in the economy of Pakistan. Average annual production of sugarcane is in the range of 45-50 million metric tons. There are about 83 sugar mills and 23 distilleries, located mostly in Punjab and Sindh, with few in Khyber Pakhtunkhwa (KPK), producing four million tons of sugar and about quarter of a million tons of ethanol respectively. An average of 41 million ton of sugarcane is crushed annually. Total contribution of sugarcane crop to Gross Domestic Product (GDP) is in the range of 7.5-9%.
After textile, sugar industry in Pakistan is the 2nd largest agro based industry. It plays major role in the economic development of the country and contributes more than Rs. 15-20 billion per annum in the form of General Sales Tax (GST), federal, provincial, local taxes etc. Share of sugar industry in the GDP is 1.9%. The annual per capita consumption of sugar in Pakistan is 26 kg which is highest among the developing countries. The direct employment in the sugar industry is about 120,000 of managerial, skilled and semi skilled staff and indirect employment is about 4 million people. Sugar sector supports industries like alcohol, paper, beverages, etc.
6.1 GEOGRAPHICAL LOCATION Sugar industry is mostly located in the rural areas of Punjab and Sindh. A small percentage of total production is produced in the KPK. Previously, Punjab was partly dependent on supply of sugar from Sindh, but lately the establishment of some large units in Punjab has made the province self-sufficient in the commodity. The province wise distribution of sugar mills is given in Table 6.1. Table 6.1: Sugar Mills in Pakistan
Province No. of Sugar Mills Percent (%)
Punjab 45 54.20
Sindh 30 36.10
KPK 08 09.60
Balochistan 00 00.00
Total 83 100.00
Ref: Pakistan Sugar Mills Association
Figure 6.1 shows the location of sugar mills in Punjab while the district wise distribution of mills in Punjab is illustrated below in Figure 6.2. This development of sugar sector is a great achievement. Major contributor to this achievement is the Government’s continuous incentives, establishment of local technology vendors like Heavy Mechanical Complex (HMC), and progressive role of Pakistan Sugar Mills Association (PSMA) and Pakistan Society of Sugar Technologist (PSST).

City
Figure 6
Figure 6
ywide Partner
Better W
6.1: Location
D eraG haziK han
R ahimY ar
K han
R ajanpur
6.2: District W
rship for Susta
Water Managem
n of Sugar M
M i
Layyah
B hakkar
M uzaffa rgarhM u lt
B
Wise Locati
inable Water U
ment & Cleaner P
Mills in Punja
Lodhhran
A ttock
anw ali
V ehar
K hanew al
K hushab
Jhang
tan
B ahaw a lpur
ion of Sugar
Use and Water
Production Pra
ab
R aw a lp ind i
C hakw a l
C hin io t
ri
B ahaw alnagar
S argodha
Fa isa labad
TobaTek
S ingh
S ahiw al
P ak
r Industries
r Stewardship
ctices in Major
Jhe lum
G ujra t
H a fizabad
M andiB ahauddin
G ujran
S hekh
N ankanaS ah ib
O kara
kpa ttan
in SMEs in La
Industrial Sect
S ia lkot
N arow alw ala
hupura
Lahore
K asur
ahore, Pakistan
tor of Pakistan
n – WSP
52
2

Citywide Partnership for Sustainable Water Use and Water Stewardship in SMEs in Lahore, Pakistan – WSP
Better Water Management & Cleaner Production Practices in Major Industrial Sector of Pakistan
53
6.2 SUGAR SECTOR PRODUCTION Sugar mills are categorized into small, medium and large industries on the basis of following crushing capacity. The detail of crushing capacity with respect to size of the mill operating in Pakistan is given in Table 6.2. Table 6.2: Pakistan Sugar Industry Size
Industry Size Crushing Capacity
(ton/d) Small < 4,000
Medium > 4,000 < 6,000
Large > 6,000
The total sugar produced during the year 2008-9 and 2010-11 was 3,189,508 and 4,150,240 ton respectively. The detail of crushing of sugar beet and sugar cane and their recoveries are given in Table 6.3. Table 6.3: Sugarcane Crushed and Sugar Recovery in Pakistan
Raw Material Crushed (Ton) Sugar Production (Ton) Sugar Recovery (%)
2008-09
Sugarcane 33,733,266 3,188,561 9.45
Sugar Beet 9,301 947 10.18
2010-11
Sugarcane 44,525,264 4,145,774 9.31
Sugar Beet 50,509 4,467 8.84
Ref: Final Report Synopsis of Technical Results Season 2008-2009, 2010-11 (PSST) Province wise production of sugar during last two seasons is summarized in the Table 6.4 Table 6.4: Province Wise Production of Sugar in Pakistan
6.3 WATER CONSUMPTION Water plays a role of important utility in sugar mills in different operations from juice extraction to the refined sugar. Major areas of water consumption of sugar mills are:
Province Crushing (Ton) Sugar (Ton) Sugar Recovery (%)
2008-09
KPK (Cane) 2,313,725.00 193,768.00 8.37
Punjab (Cane) 21,270,939.00 2,018,373.00 9.49
Sindh (Cane) 10,148,602.00 976,420.00 9.62
KPK (Sugar Beet) 9,301.00 947.00 10.18
2010-11
KPK (Cane) 3,035,460.00 262,120.00 8.63
Punjab (Cane) 27,889,004.00 2,584,759.00 9.27
Sindh (Cane) 13,600,800.00 1,298,895.00 9.55
KPK (Sugar Beet) 50,508.680 4,466.700 8.84
Ref: Final Report Synopsis of Technical Results Season 2008-2009, 2010-11 (PSST)

Citywide Partnership for Sustainable Water Use and Water Stewardship in SMEs in Lahore, Pakistan – WSP
Better Water Management & Cleaner Production Practices in Major Industrial Sector of Pakistan
54
- Cooling and washing of evaporators, vacuum pans and other equipment - Cooling of mill bearings, vacuum pumps and turbines - Injection water at condenser to produce vacuum at evaporators - Boiler feed water to fulfill the steam requirement - Water for general purposes i.e. floor washing, sanitation etc. Water consumption per ton of cane crushed varies from mill to mill. The data collected by PISD project during last four years (2007-11) from 22 sugar mills of Pakistan, shows a wide range of raw water consumption i.e., 0.35-1.6 m3/ton of cane crushed.
6.4 WASTEWATER POLLUTION Wastewater is generated from various sources in the sugar mills. List of the wastewater sources with possible activities are described in Table 6.6. Table 6.5: Wastewater Sources in Sugar Mills
Sources Activity Wastewater Quality
Mill House Floor washing, bearing cooling water and oily water from lubricating system
Turbine and bearing’s cooling water, floor washing, product leaks & spills and oil & grease
Process House
Chemical cleaning & washing of evaporators and heaters, floor washings
Floor washing, washings of juice heaters, evaporators, vacuum pans and other vessels, evaporator’s cooling water, sugar contents, equipment cleaning chemicals (e.g. caustic soda, soda ash, anti-scale and sometimes HCl), scale, etc.
Boiler House
Blow down water, fly ash (wet or dry) and clinker
Blow down wastewater containing high concentration of dissolved solids, fly ash disposed with wastewater (which increases TSS of effluent), wastewater from wet scrubber
Spray Pond Overflow of effluent due to addition of vapor condensates and fresh water in the spray pond
Wastewater from spray pond containing sugar traces and antifoaming chemicals (comparatively less contaminated than wastewater from houses)
Laboratory Laboratory testing (Pol. % etc.) Liquid waste containing chemical solutions and lead sub-acetate Sanitary Waste
Effluent from wash rooms and colony of sugar mills Sanitary waste containing fecal coliforms
6.4.1 Wastewater characteristics Wastewater quantities and characteristics vary from industry to industry depending upon the production processes and in-house operational practices. Typical wastewater pollution characteristics related with production of sugar is presented in Table 6.6. Table 6.6: Wastewater Characteristics
Wastewater Characteristics
pH BOD COD TSS
4.7 - 6.5 600 – 4,853 1,037 – 19,234 185 – 526 All the wastewater characteristics are in mg/l except pH Ref: Sugar Sector, Environmental Report, ETPI Project
6.4.2 Wastewater quantities In order to determine the wastewater quantities of sugar production, wastewater flow per ton of cane crushed has been estimated on the basis of data collected by PISD project from 22 sugar industries during

Citywide Partnership for Sustainable Water Use and Water Stewardship in SMEs in Lahore, Pakistan – WSP
Better Water Management & Cleaner Production Practices in Major Industrial Sector of Pakistan
55
the year 2007-11. Wastewater quantities generated per ton of cane crushed varies in the range of 0.5-6.9 m3/ton of cane crushed.
6.5 BEST AVAILABLE RESOURCE CONSERVATION TECHNIQUES The sugar cane consists of about 70-75% water and therefore sugar mill processes involve more water than sugar. Apart from water entering in the form of cane, some quantity of raw water is also added in the production process of the sugar mill. All the water entering in a sugar mill whether in the form of cane or fresh raw water must also leave the mill in one form or another. Based on these facts, the sugar industry is considered as a major water user and wastewater producer. In most of the sugar processing mills, the water management is the focal issue because of high water costs and government enforcement to reduce water consumption as well as pollution loads. The resource management of a sugar industry depends primarily on the quality and type of raw materials production carried out, and secondarily on the local conditions, i.e. the availability, quality and cost of fresh water, as well as the costs and legal requirements for waste water treatment and discharge. Efficient wastewater treatment involves the optimization of water consumption and lowering the consumption of chemicals used in the processes and wastewater treatment.
Generally in the sugar production process, following are the main points of water usage and from where the water conservation can be made possible through adopting various cleaner production options;
Cooling of mill bearing, vacuum pumps and turbines; Cooling and washing of evaporators and vacuum pans; Injection water at condenser; Boiler feed water; and General process water use
Numerous techniques have been developed to conserve water at these points in sugar mills. Few of the best worldwide available techniques for water conservation in sugar mills are given below:
6.5.1 Floor washing and cleaning with low quality water In most sugar mills the floor washings are normally carried out with fresh water. This type of floor washing not only increases the fresh water demands but also enhance the chances of wastewater pollution load in case of product leakages and spillage. By controlling the spillage and substituting the cleaning with fresh water to low quality water decreases the water requirement as well as lead to raw material savings.
6.5.2 Reduce water consumption for cooling of evaporators The cooling of evaporator is normally carried out by excessive continues stream of water for about 30 minutes before the manual cleaning operation of an evaporator. It was revealed in EP3 that the consumption of cooling water at a single evaporator is about 70-90 m3 for 30 minutes and the temperature of cooling water after washing is nearly equal to the water taken from tap. This fact depicts that excessive water is in general used for cooling purposes. Therefore, the cleaner production option of using air force flow in conjunction with a fine spray of cooling water to minimize the volume of water needed to cool the evaporator. Additionally, air flow from top to bottom with the help of a fan can also be helpful in removing the water mist and enhancing the hamper visibility inside the evaporator.72
72 Environmental Pollution Prevention Project (EP3), Pollution Prevention Diagnostic Cane Sugar Mill (1998), Hagler Bailly Consulting, Inc. 1530 Wilson Blvd., Suite 900 Arlington, Va 22209‐2406.

City
6.5.3 In sugargeneral,nearly cfrom bais addedperiodicamaintainacceptabof wateractual overflowreductioreductiospray po In order controls that the the spraaffect the
6.5.4 Normallymill and order toreduce Followinreducingsystem t
Creacoolconssouroverthe over
Boilebodi
Clasgene
Reccolle
73 EnvironBailly Con74 Manga
ywide Partner
Better W
Reduce war mills, the sp the wind d
compensatedrometric cond to the sprally, to reple
n the conceble level. Hor to spray porequirement
w of water frn in the sn in the voluond.
to reduce th the operatioaddition of wy pond. There temperatur
Closed way, excessive therefore st
o minimize tthe wastewg are the fe
g water consto close wate
ating sub-circing waters insidered in derce. Additionrflows with thoverflow of trhead tank foer feed wateies of the evassification, coeration. lamation of
ection system
nmental Pollunsulting, Inc. al Singh, 1994,
rship for Susta
Water Managem
ater consupray ponds adrift and evad by the incondensers. Thray pond eitenish excessntration of
owever, in moond is excess and evenrom spray pspray pond ume of well
he water conon of its well well water to trefore, the rere and perfor
ater circu volume of wtrives to usehe water co
water disposew measure
sumptions byer circulation
cuits for totaln a suitably sesigning of thnally, it also he provisionsthe overheador make-ups r requiremenaporators witollection and
all water in m for all hot c
ution Preventi1530 Wilson B, Water Balan
inable Water U
ment & Cleaner P
umption atare mainly usaporation losoming procesherefore, fresther continuosive drift loscontaminantost mills this sive as comntually resu
plant. Therefooverflow e
water adde
sumption at and plant puthe spray poneduction in wrmance of the
uit systemwater is use
e water moreosts and subsal and treaes that can y shifting from system.
l recirculationsized containhe container includes ths of pumpingd hot water twhen require
nts should beth arrangemed recycling o
the form ofcondensates
on Project (EPBlvd., Suite 90nce & Sources
Use and Water
Production Pra
t spray posed to cool dsses are ss water sh water ously or ses and s at an addition pared to ulted in ore, any quals a
ed to the
spry pond, iumps engagend plays only
water additione spray pond
m74 ed by a sugae efficiently ibsequently tatment costsbe helpful i
m open wate
n of cooling wner (steel tanas well as the arrangeme
g back when tank and its ed. e met by condents of surpluof condensat
f condensate other than t
P3), Pollution 00 Arlington, Vof Wastewat
r Stewardship
ctices in Major
nds down the wa
t is required ed in refillingy a minor rolen to the sprayd.73
ar in to s. in er
water by maknk). The coolhe receiving ent for colle required andbeing pumpe
densates fromus storage antes for vario
es and addithose for boil
Prevention DVa 22209‐240er In Sugar M
in SMEs in La
Industrial Sect
ter coming fr
to install a sg the pond. Ae in reducingy pond is not
king arrangeling effect of of make-up w
ection of boid collection oed for mace
m the pre-evnd pumping bus process
tionally thereler use in an
Diagnostic Can06. ill & Refinery.
ahore, Pakistan
tor of Pakistan
rom the proc
system that aAdditionally, the water tet expected to
ments for co collecting wwater from thler and feedof surplus horation and/or
aporator andback. requirements
e must be a overhead co
e Sugar Mill (
.
n – WSP
56
cess plant. In
automaticallyit is revealed
emperature ino significantly
ollection of alwater must be
he raw waterd water tankot water fromr back to the
d 1st and 2nd
s and steam
a centralizedollection tank
1998), Hagler
6
n
y d n y
l e r k
m e
d
m
d k
r

City
provpoin
A prautoproc
Arraboth
6.5.5 Small chwater cocontribut Eng
wate Rais
fauc Usa
floorwas
Reginstacont
The to co
6.5.6 Regular sugar mloads. Wwith the
6.5.7 Water cavoidancexcessivcapacitynormallycapacityoperatiohot watmaintainparticlesparticlesbeing memitting is often u
75 Study oTaiwan R
ywide Partner
Better W
viding for drants, e.g. lime rovision in th
omated workcess has or nangement to h the water a
General hhanges in suonsumption, te to the redu
age and keeer conservatise awarenescets and hosege of spray r conditions hing with waular monitorallation of gretrolling the w power plant ollect the oil a
Proper mo inspection aills. Further,
Whereas, the help of flow
Operationconservationce of overloave rates, or y and with my reduced asy and when hns (cleaning)ter reuse, tned at arounds in effluents in filter clomixed with o to remove reused for irrig
on Cleaner PrROC.
rship for Susta
Water Managem
aw down linslaking, cakehe central coing with tank
no provision tdivert the limnd residual li
ousekeepiugar producti wastewateruction of poll
ep remindingon and cleans among woes. guns on all wand promotter.
ring, inspectiease traps oater consum and boiler hand to preve
onitoring and timely rep the proper h monitoring ameters is the
nal optimiz and sugaading evapooperating at
minimum stops compared hot water pro). Therefore,the imbibitiod 25-30% ofts can be
oth washingsther effluentefuse, dirt, aation purpos
oduction Opp
inable Water U
ment & Cleaner P
es incorporae washing, ceollection tank level controthereof in casme house anime which he
ing and CPion and wastr volume anution loads g
g workers aner productioorkers by put
water hoses e floors clea
on and repaon all drains ption and poouse where nt it from get
and timelypair of equipmhandling andand measuree main initiati
zation andr recovery rators and v incorrect liq
ppages, the to crushing duction is su for maximum
ons water sf cane used. minimized b
s to settle ints and screeand remnantses if oil, susp
portunities for
Use and Water
Production Pra
ating prefereentrifugals ank of raw waol and resultse of new insnd grit washielps to make
P measurete handling pd pollutant
generated by
bout their imon. tting signboa
can play a vaning with d
air significantcarrying grea
ollution loads.oil drops gentting into the
y maintenaments and o storage of m
ement of incove towards r
d water reucan be im
vacuum pansquid levels. Araw water coat lower tha
uspended durm recovery oshould be r Similarly, dirby allowing n a holding tening wastews of the canepended partic
r the Sugar Ind
r Stewardship
ctices in Major
ential distribund magmas,
ater make-uptant removalstallations. ings into the up the conde
s75 processes caload: Follow the sugar m
mportant role
ards and pos
vital role in rdry cleaning
tly reduce thase and othe. nerally to the flour drains.
ance ther tools camolasses alsoming raw mresource and
use mproved by s, boiling at At optimum onsumption an optimum ring halts in
of sugar and reused and rt and large suspended
tank before water beforee. This at soucles and pH
dustry in Beliz
in SMEs in La
Industrial Sect
ution system pans and ma
p to meet de of parallel c
condenser enser water
an lead to cowing are a fmills.
e in achievin
ster of water
reducing watagents like
he spill and er lubricants
floor, it is su
n reduce theso minimizes
materials esped pollution red
e urce treated are settled fi
ze (2008), Nat
ahore, Pakistan
tor of Pakistan
to various aceration, et
eficiencies if cold water lin
water channpH.
onsiderable rfew techniqu
ng company
conservatio
er consumptbaggase etc
leak risks. H play an imp
uggested to u
e spillage and the wastewaecially of watduction.
or separatedrst before us
tional Central
n – WSP
57
consumptionc. any, and its
nes from the
nel to reclaim
reductions inues that can
goals about
n near water
tion. Improvec. instead of
However, theortant role in
use drip pans
d leakages inater pollutionter in the mil
d wastewaterse.76
University,
7
n
s e
m
n n
t
r
e f
e n
s
n n l
r
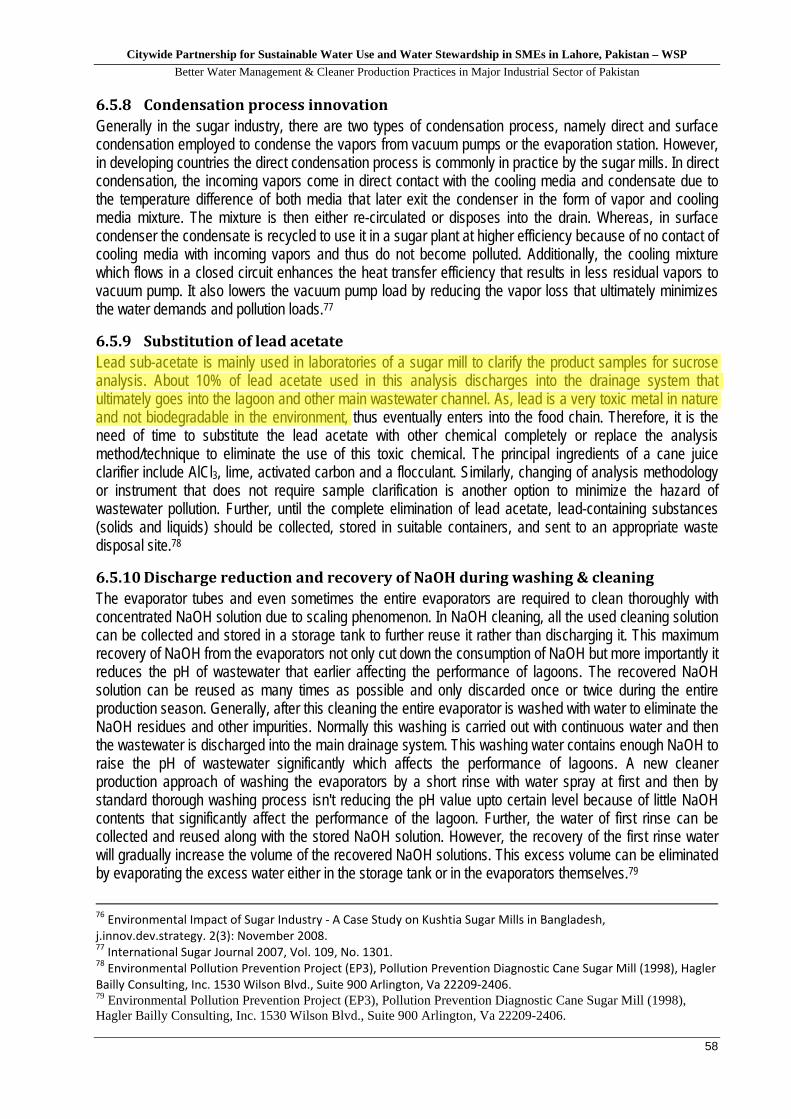
Citywide Partnership for Sustainable Water Use and Water Stewardship in SMEs in Lahore, Pakistan – WSP
Better Water Management & Cleaner Production Practices in Major Industrial Sector of Pakistan
58
6.5.8 Condensation process innovation Generally in the sugar industry, there are two types of condensation process, namely direct and surface condensation employed to condense the vapors from vacuum pumps or the evaporation station. However, in developing countries the direct condensation process is commonly in practice by the sugar mills. In direct condensation, the incoming vapors come in direct contact with the cooling media and condensate due to the temperature difference of both media that later exit the condenser in the form of vapor and cooling media mixture. The mixture is then either re-circulated or disposes into the drain. Whereas, in surface condenser the condensate is recycled to use it in a sugar plant at higher efficiency because of no contact of cooling media with incoming vapors and thus do not become polluted. Additionally, the cooling mixture which flows in a closed circuit enhances the heat transfer efficiency that results in less residual vapors to vacuum pump. It also lowers the vacuum pump load by reducing the vapor loss that ultimately minimizes the water demands and pollution loads.77
6.5.9 Substitution of lead acetate Lead sub-acetate is mainly used in laboratories of a sugar mill to clarify the product samples for sucrose analysis. About 10% of lead acetate used in this analysis discharges into the drainage system that ultimately goes into the lagoon and other main wastewater channel. As, lead is a very toxic metal in nature and not biodegradable in the environment, thus eventually enters into the food chain. Therefore, it is the need of time to substitute the lead acetate with other chemical completely or replace the analysis method/technique to eliminate the use of this toxic chemical. The principal ingredients of a cane juice clarifier include AlCl3, lime, activated carbon and a flocculant. Similarly, changing of analysis methodology or instrument that does not require sample clarification is another option to minimize the hazard of wastewater pollution. Further, until the complete elimination of lead acetate, lead-containing substances (solids and liquids) should be collected, stored in suitable containers, and sent to an appropriate waste disposal site.78
6.5.10 Discharge reduction and recovery of NaOH during washing & cleaning The evaporator tubes and even sometimes the entire evaporators are required to clean thoroughly with concentrated NaOH solution due to scaling phenomenon. In NaOH cleaning, all the used cleaning solution can be collected and stored in a storage tank to further reuse it rather than discharging it. This maximum recovery of NaOH from the evaporators not only cut down the consumption of NaOH but more importantly it reduces the pH of wastewater that earlier affecting the performance of lagoons. The recovered NaOH solution can be reused as many times as possible and only discarded once or twice during the entire production season. Generally, after this cleaning the entire evaporator is washed with water to eliminate the NaOH residues and other impurities. Normally this washing is carried out with continuous water and then the wastewater is discharged into the main drainage system. This washing water contains enough NaOH to raise the pH of wastewater significantly which affects the performance of lagoons. A new cleaner production approach of washing the evaporators by a short rinse with water spray at first and then by standard thorough washing process isn't reducing the pH value upto certain level because of little NaOH contents that significantly affect the performance of the lagoon. Further, the water of first rinse can be collected and reused along with the stored NaOH solution. However, the recovery of the first rinse water will gradually increase the volume of the recovered NaOH solutions. This excess volume can be eliminated by evaporating the excess water either in the storage tank or in the evaporators themselves.79
76 Environmental Impact of Sugar Industry ‐ A Case Study on Kushtia Sugar Mills in Bangladesh, j.innov.dev.strategy. 2(3): November 2008. 77 International Sugar Journal 2007, Vol. 109, No. 1301. 78 Environmental Pollution Prevention Project (EP3), Pollution Prevention Diagnostic Cane Sugar Mill (1998), Hagler Bailly Consulting, Inc. 1530 Wilson Blvd., Suite 900 Arlington, Va 22209‐2406. 79 Environmental Pollution Prevention Project (EP3), Pollution Prevention Diagnostic Cane Sugar Mill (1998), Hagler Bailly Consulting, Inc. 1530 Wilson Blvd., Suite 900 Arlington, Va 22209-2406.

Citywide Partnership for Sustainable Water Use and Water Stewardship in SMEs in Lahore, Pakistan – WSP
Better Water Management & Cleaner Production Practices in Major Industrial Sector of Pakistan
59
6.5.11 Controlled Blowdowns Uncontrolled blowdown from boilers and cooling towers in the sugar industry is another potential source of waste. The purpose of the blowdown is to control the water quality but all too often blowdown valves are normally left open at a fixed flow rate irrespective of changes in operating conditions. A simple monitor and automatic valve is a very cost effective way of controlling blowdown that reduces the pollution loads generated by huge boilers in sugar mills.
6.6 FEASIBLE TECHNIQUES FOR LOCAL INDUSTRIES CPI is working with sugar sector since 2007 with the objective to enable the pakistan’s second agro based sector to comply with national and international environmental requirements and to adopt best energy efficiency practices. The geographical location of this sector is Punjab, Sindh and few in Khyber Pakhtunkhwa. Programme for Industrial Sustainable Development –I (July, 2007- June, 2010) The Programme for Industrial Sustainable Development (PISD), a three year project (2007-2010) was launched by the Embassy of the Kingdom of the Netherlands (EKN) in collaboration with the Cleaner Production Institute (CPI) for cleaner production and energy efficient technologies implementation in five major industrial sectors of Pakistan. The program was started with the aim of providing technical assistance for save environmental and cost effective production in 45 sugar mills of Pakistan. Programme for Industrial Sustainable Development –II (July, 2010- June, 2013) Under the 2nd phase of PISD, the technical assistance was continued to the sugar sectors of Pakistan along with other major industrial sectors. The overall objective of the programme was that the major industrial sectors of Pakistan adopt best environmental and energy efficiency practices. Under the above mentioned projects and other various sugar sector studies, CPI has implemented the following cleaner technologies and energy efficient technologies under a cost-effective framework with direct and indirect financial paybacks. Reuse, Recovery and Recycling (RRR) Options Reuse of cooling water Reuse of spray pond overflow water Recovery of juice leakages Reuse of caustic soda Use of wastewater for ash disposal Condensate recycling Replacement of 4 bar steam with exhaust steam Replacement of 4 bar steam with 1st/2nd vapours Replacement of exhaust steam with vapours Good Housekeeping, Better Practices and Proper Maintenance Repair of boiler for fly ash reduction Oxidation pond for wastewater Juice leakages control by proper maintenance Dry collection of ash Installation/maintenance of cooling towers Chemical handling

Citywide Partnership for Sustainable Water Use and Water Stewardship in SMEs in Lahore, Pakistan – WSP
Better Water Management & Cleaner Production Practices in Major Industrial Sector of Pakistan
60
Modification of desuper heater Installation of cooling towers Exhaust fans installation Improvement in lighting Repair of de-aerator Repair of oxygen analyzer Automatic Control Systems Installation of water flow meter on imbibition water Installation of temperature and pressure gauges/recorder Installation of oil separator on compressor Installation of auto drains for compressed air Purchase of new polarimeters Entrainment catchers at evaporators Process Modification and Improvement Options Improvement in spray pond efficiency Installation of oil skimmer Installation of refrigerant dryer Installation of soft starter on ID fan Installation of high efficiency motors Replacement of oversize/undersize motors New electrical wiring to reduce losses Replacement of compressor filters Improvement in ventilation of compressor room Insulation of hot surfaces Installation of bagasse dryer Installation of economizer on boiler Installation of Variable Speed Drives Installation of capacitors Installation of juice heaters Air pre-heater tubes replacement Installation of vapour cell Replacement of compressor with energy efficient one

Citywide Partnership for Sustainable Water Use and Water Stewardship in SMEs in Lahore, Pakistan – WSP
Better Water Management & Cleaner Production Practices in Major Industrial Sector of Pakistan
61
REFERENCES American Non wood Fiber Symposium, Atlanta, GA, p.227 (1998). b) Preparation of Biosilica-enriched
Filler and an Example of its Use in a Nano-Particle Retention System, Jan Pekarovic, Alexandra Pekarovicova and Paul D. Fleming III, Department of Paper Engineering, Chemical Engineering, and Imaging, Western Michigan University, A-23, Parkview, Kalamazoo MI 49008.
An Environment-friendly Lime-Free Liming Process based on sodium silicate, Yuansen Liu, Haojun Fan*, Xiuli Zhang, Biyu Peng, Bi Shi, National Engineering Laboratory for Clean Technology of Leather Manufacture, Sichuan, University, Chengdu, P.R.China, 610065
Best Available Techniques in Textile Industry, Research Report 200 94 329, UBA-FB 000325/E, Federal Environmental Agency (Umweltbundesamt), Postfach 33 00 22, 14191 Berlin.
Best practice guide no. BPGCS001, Good Housekeeping Measures For Solvents, Enterprise Ireland Census of Manufacturing Industries 2005‐06 Weights. Clean Technologies in US industries: Focus on Pulp & Paper, Pollution Prevention Assistance division,
United States-Asia Environmental Partnership, September 1997 Cleaner Production in Pulp and Paper Industry, Technology Fact Sheets, United Nations Environment
Programme (UNEP), Asian Institute of Technology (AIT). Cleaner Production Institute database shows that about 120 textile-processing mills, 80 sugar mills,
200 tanneries, and five pulp and paper mills have reduced water consumption in the range of 30-50%. Development of Guidelines for Water conservation in pulp and Paper sector, Central Pollution Control
Board, Delhi. EEO (1992a). De-Centralisation of Steam Supply in Small Industrial Site, CS 134, Energy Efficiency
Office, UK 1992. Energy Efficiency Improvement and Cost Saving Opportunities for Pulp and Paper Industries, Klaas
Jan Kramer, Eric Masanet, Tengfang Xu, and Ernst Worrell, Environmental Energy Technologies Division, U.S. Environmental Protection Agency, October 2009
Environmental Impact of Sugar Industry - A Case Study On Kushtia Sugar Mills In Bangladesh. j.innov.dev.strategy. 2 (3): November 2008.
Environmental Pollution Prevention Project (EP3), Pollution Prevention Diagnostic Cane Sugar Mill (1998), Hagler Bailly Consulting, Inc. 1530 Wilson Blvd., Suite 900 Arlington, Va 22209-2406.
Environmental protection strategies for sustainable development, Springer Dordrechet Heidelberg London, Newyork.
Federation of Indian Chambers of Commerce and Industry (FCCI) Interventions in Pulp and Paper Sector for Reduction in Freshwater Consumption and Treatment of Colored Effluent, A case Study.
Final report on development of guidelines for water conservation in pulp and Paper sector, central pollution control board Delhi
Finance Division E.A. Wing Government of Pakistan, “Pakistan Economic Survey 2009-10”, Printing Cooperation Pakistan Press, 2010
Government of Pakistan, “Economic Survey of Pakistan 2009-10” Heat Recovery in the Textile Dyeing and Finishing Industry: Lessons from Developing Economies,
Faculty Of Engineering, University Of Mauritius. Impact of water scarcity on food security at micro level in Pakistan, Fahim, Muhammad Amir January
2012, MPRA. Industrial and household water demand management, A Case Study of Pakistan, Kochi University of
Technology, Kochi, Japan. Integrated Pollution Prevention And Control (IPPC), Reference Document on Best Available
Techniques for the Textiles Industry, July 2003, European Commission.

Citywide Partnership for Sustainable Water Use and Water Stewardship in SMEs in Lahore, Pakistan – WSP
Better Water Management & Cleaner Production Practices in Major Industrial Sector of Pakistan
62
International Sugar Journal 2007, Vol. 109, No. 1301. Khan A. U., “Evaluation of Industrial Environmental Management of Pakistan”, The World Bank 2010 Mangal Singh, 1994, Water Balance & Sources of Wastewater In Sugar Mill & Refinery. Ministry of Environment, “Pakistan Environmental Protection Act 1997”, Schedule 1: Category A
Industries NRDC’s Ten Best Practices for Textile Mills to Save Money and Reduce Pollution. A Practical Guide for
Responsible Sourcing. Orr Stuart, Cartwright Anton & Tickner Dave, “Understanding Water Risks: A Primer on the
Consequences of Water Scarcity for Government and Business”, WWF Water Security Series 4, March 2009.
Paavilainen, L.: Modern non-wood pulp mill – process concepts and economic aspects, TAPPI Proc. North
Pakistan Industrial Growth, The Rawalpindi Chamber Of Commerce & Industry Pakistan Tanners Association, North Zone, 2012-13. Pakistan Textile Journal, 2009. Pakistan Water Sector Strategy, National Water Sector Profile, Volume 5, October 2002, Ministry of
Water and Power Office of the Chief Engineering Advisor/Chairman Federal Flood Commission Planning Commission-Government of Pakistan, “Vision 2030”, 2007. Pollution Prevention Studies in the Textile Wet Processing Industry, Ilse Hendrickx and Gregory
Boardman, Department of Civil Engineering, VPI&SU Blacksburg, Virginia 24061. Rainwater Harvesting Potential - A Contribution To Sustainable Water Management Strategy, Pakistan
Water Operator Partnership, The Urban Unit Punjab, Pakistan’s Water Operators Partnership, 2013 Recent Development In Cleaner Production and Environment Protection In World Leather Sector,
International union of environment (IUE) commission of international union of leather technologists and chemists societies (IULTCS), 2008)
Recently The World Bank study “Evaluation of Industrial Environmental Management-Pakistan, 2010”. Recycling In The Tanning Industry, N. P. Slabbert, Leather Industries Research Institute,
Grahamstown, South Africa, Journal of the Society of Leather Technologists and Chemists, Vol. 64, p. 89
Study on Cleaner Production Opportunities for the Sugar Industry in Belize (2008), National Central University, Taiwan ROC.
Technical EIA Guidelines Manual for Pulp and Paper Industries, Ministry of Environment and Forest, Government of India
UNEP, Environmental management in the pulp and paper industry, Technical report, UN Environmental programme for industry and environment.
United Nations Industrial Development Organization (UNIDO), Eleventh Session of the Leather and, Leather Products Industry Panel, Nairobi, Kenya, 29 November- 3 December 1993, Introduction of cleaner leather production methods-prospects and constraints
Water and Chemical Use in the Textile Dyeing and Finishing Industry. A Practice Guide by the Environmental Technology Best Practice Programme.
Water, Facts and Trends, World business Council for sustainable Development Woodall L. and Godshall E., (1976). Energy Economy in A Dye-House, Textile Industry, October 1976,
P105. www.cpi.org.pk