better than average: the stock-picking system that helps
TRANSCRIPT
1
Foreword
By Jim Pearce, Baton Chief Investment Strategist
When Phil, Brad and I first sat down to discuss the investment approach we would use for Baton, we very quickly agreed that we would only consider strategies that had a proven record of outperforming the overall stock market by a substantial margin for at least the past ten years. What we didn’t know at the time is that by using that one simple criterion we would narrow the field down to a very small number of choices.
Our second criterion was that it be easy for people with varying levels of investment expertise to understand and implement this program. After all, what good is any strategy if it cannot be properly ex-ecuted? That narrowed down the field to just a handful.
Finally, we also agreed that the source of this investment strategy be based on a model that was not dependent on one person’s judgment or opinion; all too often a “hot” money manager eventually suc-cumbs to a lapse in judgment or fails to notice that the market has turned against them.
When we applied all three of those criteria we realized that there was one investment manager that stood out above the rest: John Reese. By the time you finish reading this special report I think you will agree that John’s approach is, by far, the most logical and opportunistic way to participate in the growth of the stock market.
Generally speaking the stock market is regarded as inherently risky, and to a certain extent it is – in the short run. To be clear, the purpose of Baton is to outperform the overall stock market in the long run and give you the best shot at achieving your financial goals. To do that you have to be invested in the stock market all of the time or risk missing out on big gains.
Our core portfolio – “Sprint” – is fully invested 100% of the time, and is based on John’s top per-forming portfolio that has beaten the S&P500 Index by more than a 3 to 1 margin since its inception in 2003.
However, we offer two other versions of the Sprint portfolio – “Relay” and “Marathon” - for in-vestors who are bit more risk averse, and are designed to soften the extreme highs and lows by reducing volatility. To do so we have added three ETFs that provide exposure to proven portfolio diversifiers in Gold, Real Estate, and Bonds as shown here.
The Relay portfolio is 80% stocks and 20% ETFs, while Marathon is 60% stocks and 40% ETFs. Although these two portfolios only launched in 2014, we have back-tested them to 2008 and provide that performance data here.
Better Than Average: The Stock-Picking System That Helps You Beat the Market By 300%
2
We feel very fortunate to have John Reese as a member of our executive team, and are proud to be able to provide investors with access to his revolutionary approach to beating the stock market. I encour-age you to read all the way through John’s story about the creation of what is now the Baton stock-picking system, as it is truly remarkable and quite possibly the last story you will ever need to read about success-ful investing.
wHY did i do it?
The list of books written about investing is long, but I’m pretty certain none of the investment books you’ve read has begun with the author admitting what I’m about to admit to you right now: When it comes to the stock market, my instincts are not good. In fact, they’re pretty bad. You could even say I’ve made just about every mistake possible, and have made them with my own money.
This admission, of course, leads to an obvious question: Why would someone who admittedly has poor investing instincts be wasting his time writing a book on investing? (And, just as importantly, why would you want to take the time to read it?)
My foray into investing began when I sold a business many years ago, and for enough money to live on for the rest of my life if I invested it wisely and earned a decent return. So, I began interviewing stockbrokers and financial advisors fully intending to turn my hard-earned money over to the first one that could articulate to me why their investment process was likely to succeed.
Instead, I became increasingly anxious as I realized none of them could provide an adequate explanation of exactly how they went about selecting individual stocks, other than vague references to Modern Portfolio Theory, Asset Allocation, and The Efficient Frontier.
Afraid of drowning my small fortune in a sea of Wall Street doublespeak, I decided to apply the skills I learned as an early contributor to the field of Artificial Intelligence while at M.I.T.. I believed that if I could identify investors who have consistently beaten the market and then converted their logic to a formula that would accurately mimic their thought process, that would work better than what I was hear-ing from the so-called professional investors.
Well, it turns out I was more correct than I could have ever hoped. Since launching my “Top 5 Masters” portfolio in 2003 it has outperformed the S&P500 Index by an astounding 3 to 1 ratio, putting to rest any arguments that it is impossible to beat the market over an extended period of time.
What I learned from this experience is that it is possible to significantly outperform the stock market - and the vast majority of people who want to charge you a fee to manage your money - by fol-lowing a strict set of rules based on some of the most successful investors who ever lived. In the pages that follow, I will explain exactly how that process works, and how it can work for you.
I’m passing the Baton on to you!
Research Director, Baton Investing
How did i do it?
Peter Lynch, Benjamin Graham, David Dreman, and others have all left roadmaps show-
3
ing just how the average investor can make a bundle in the stock market. Their formulas are relatively simple and don’t involve the kind of complex mathematics that only a rocket scientist could understand.
Just who are these investors, and how did they do it? Well, it’s easy to imagine them as some sort of Wall Street superheroes, people who, either through a gift of birth or years upon years of experience have the ability to enter the market at just the right time and then cash out just before things go south. After all, if most people fail to make money in stocks because they try unsuccessfully to time the market, wouldn’t it follow that those who have succeeded were simply on the other end of the market-timing success/failure spectrum?
That would make for a great story, the notion of these prescient, unbeatable investors. The problem is that it’s just not true. Sure, some people have been fortunate enough to make a lot of money with good (perhaps “lucky” is a better word) timing in the short term. But as I began researching how the best investors of all-time made their fortunes, I quickly found that the Peter Lynches and Warren Buffetts of the world succeeded over the long term not by playing the game better than the average investor, but by playing it differently.
Playing the game differently? What exactly does that mean? Well, essentially it is what Ben Graham, the man known as “The Father of Value Investing”, alluded to when he said, “The investor cannot enter the arena of the stock market with any real hope of success unless he is armed with mental weapons that distinguish him in kind—not in a fancied superior degree—from the trading public.”
In Graham’s time (his investment career began around 1914), just as today, millions of in-vestors around the world bought and sold stocks based on whether those stocks (or the market in general) were going up or down on a particular day. They were market-timers. Graham believed, however, that trying to be better than other investors at timing the market or speculating about the future of a stock was no way to succeed over the long term. Banking on the idea that you were the rare exception to the rule of market timing failure was simply too risky a gamble for the average investor. Instead, Graham believed that you needed to find a way to assess a stock’s long-term value other than by looking at recent shifts in its market price.
Looking for other ways to value stocks was, in fact, just what all of the gurus I follow did—and the way they did it was by focusing on the numbers. By “the numbers”, I’m not just talking about a stock’s per-share price (though price was certainly one of the things that they ex-amined when deciding whether to buy or sell); I mean a stock’s fundamentals—the measures of how its underlying business is performing. A stock’s price can shift from day to day or month to month because of a variety of factors that have nothing to do with the company’s quality. But its fundamentals, —earnings, sales, debt, cash flows, and the like, usually give you a true indication of how strong its business really is.
What the gurus understood was that companies that had strong fundamentals tended to continue to run successful businesses, and that their long-term business success correlated with long-term gains in their stock prices. They also knew that in the short term, a business’ funda-mentals don’t always match up with its market price—in particular, they knew that the investing world can sometimes undervalue a good company. These are the companies on whose stocks the gurus tended to pounce, believing that over time, other investors would realize the value in these stocks and drive their prices upward.
4
What’s interesting to note isn’t just the fact that these gurus were able to exploit ineffi-ciencies in the market, but that they did it in a wide variety of ways. Some, like Graham and his protégé, the great Warren Buffett, were very conservative, deep-value investors. They focused on companies that had long histories of steady earnings and low debt, trying to minimize risk as much as possible. Martin Zweig, meanwhile, focused primarily on growth, looking for stocks that were growing earnings with increasing speed and appeared poised to continue that growth. Still others used a blend of growth and value approaches, with the most obvious example being James O’Shaughnessy, who used two separate strategies: one value and one growth.
Even within the broad categories of strategies—growth, value, blended—there were significant differences in the specific variables each guru examined. While I had set out in search of the path to stock-picking success, I quickly found that there were actually numerous paths to choose from.
Despite the great successes that these diverse paths had led to, I also found that most investors were unaware of them. By using my background in computers, I realized, I could not only turn these strategies into easy-to-use models for my own benefit; I could also help others take advantage of these various paths to investment success.
In reality, there are other ways to beat the market besides the 10 strategies I show you in this book. Investors such as Bill Miller and George Soros have both also made huge sums of money in stocks over the years with their own approaches. Why, then, did I select only these 10 gurus? The reasons are pretty simple, actually.
Disclosed Strategy
First off, the guru’s strategy had to be disclosed. And in almost all of the cases you’ll soon read about, it was the gurus themselves who disclosed their methods. Eight did so in books they wrote. One, Joseph Piotroski, did so in a highly regarded academic paper. The lone example among my guru-based models not derived from the writings of the guru himself is my Buffett-based approach. That’s because Buffett, considered by many to be the greatest investor of all-time, hasn’t publicly disclosed his strategy. His former daughter-in-law, Mary Buffett—who worked closely with Warren—has written a book about Warren’s strategy in Buffettology. This is the best book thus far on Warren’s strategy and, for that reason, forms the basis for my Buffett-inspired model.
Verifiable Track Record
Another factor I required while developing my guru-based models was that the guru have not only an excellent long-term track record of beating the market, but that his track record be verifiable. In other words, it wasn’t enough to know that someone had made a lot of money in the stock market by using a particular strategy and was now worth $10 billion; I wanted to see year-by-year results of just how his strategy had fared over a long period of time.
While some gurus’ track records were verifiable because of real-world track records, oth-ers’ were verifiable through back-tested results. O’Shaughnessy and Piotroski, for example, both did extensive studies of historical stock market returns and developed quantitative formulas that, if they had been used during the periods involved in the studies, would have produced excellent
5
returns. They were able to determine this by using computer applications that back-tested the models they developed.
Quantifiable Criteria
Still, there are other well-known investors besides these ten who possess verifiable track records and have also published books that explain, to some degree, how they established those track records. Why didn’t I computerize their approaches? In most cases, it was because most criteria they used to pick stocks were not quantifiable. If a successful investor had simply said that one of his major criterion was that a company has “strong management,” but did not offer specific, unambiguous rules for how to determine what “strong management” entailed, that was no good to me.
Similarly, if a successful investor had simply said that “you should look for stocks with a low price-earnings (P/E) ratio”, that also was no good to me, because “low” is too vague a term to decipher what that guru really looked for when investing. Depending on your point of view, low P/E ratios could mean “5 or below”, “15 or below,” “anything less than the median P/E of the S&P 500 industrials,” “in the bottom 20 percent of the market,” “between 40 percent and 60 percent of the market P/E,” or “less than the annual earnings per share (EPS) growth rate of the company.” In fact, all of these precise definitions of “low P/E” have been used by the dif-ferent gurus in my system. Without that kind of specificity, you simply can’t come anywhere close to reliably duplicating the style of a guru. The guru’s criteria thus had to involve variables that could be obtained through a financial data-providing service, and they needed to be defini-tive enough that my models could use that data to decide whether or not a particular stock met a particular criterion.
In addition to helping me develop models that can perform multifaceted calculations, my knowledge and experience in artificial intelligence also enabled me to make many of my computerized guru methodologies come as close as possible to emulating real-life, human-type analysis. For a simple example, take a company’s EPS growth rate. Most computer screens use an EPS growth rate for a single period (some will measure only the rate EPS have grown over the past year, while others will measure only the rate EPS have grown over the past five years, for example). We’ve found that those numbers can, in many cases, be highly misleading.
A common problem in the way most screening sites measure EPS growth is that many stocks have an abnormally high or low growth rate in a given year because of a one-time event. This makes it appear that the company’s underlying business is growing much faster or slower than it really is. The strategies I run, however, look at a company’s EPS over several different periods and from a number of angles in much the same way that a human being would. They are smart enough to use a series of yearly averages to come up with a broader picture of how the firm has been growing earnings. Said another way, my models go through a series of intelligent steps to find a growth rate (using a myriad of yearly combinations) that accurately reflects the firm’s growth picture.
The gurus, however, all understood that short-term market fluctuations were simply part of life when you invested in stocks, and they didn’t let their emotions convince them otherwise. They took a long-term outlook, never wavering from their approaches—even when the market was down or their individual stocks were down in the short term. If they believed a stock was
6
still a good buy for the long haul, they stuck with it. Buffett, for example, so believed in his own method of valuing stocks that he once said, “As far as I am concerned, the stock market doesn’t exist. It is there only as a reference to see if anybody is offering to do anything foolish.”
Buffett, like the rest of the gurus, knew that no strategy could beat the market every quar-ter, or even every year. Indeed, all of the gurus whom we’ve studied have gone through down periods compared to the market, which, when you think about it, is inevitable. If there were a strategy that outperformed the market every quarter or every year, everyone would flock to it. That would then drive the prices of stocks favored by that strategy through the roof, which at some point would limit your gains and lead to the strategy’s failure.
In reality, what happens is that every strategy goes through a down period that can last a year or more—even those you’re about to read about. And when they do, many investors see the value of their portfolios declining and abandon the approach, letting their emotions get the best of them. Other investors won’t even consider starting to follow a strategy following a down period. They’ll scrap a proven strategy that’s having a down quarter or down year in favor of the latest “hot” strategy from the last year, which usually lacks a long-term track record and is more hype than substance. When that strategy fails, they’ll jump again, chasing “hot” strategies—and returns—all the way. Meanwhile, the disciplined investor who withstands the short-term dis-comfort and sticks to a proven long-term strategy ends up reaping the long-term gains.
And therein lays the gurus’ true greatness. It’s not that they’ve developed complicated theories that are unintelligible to laypeople, or that they have some sort of otherworldly ability to predict where the market will head. It’s that they possess the discipline to withstand the assault that the market makes on our emotions from day to day, and focus on what they knew was best for the long term. As Peter Lynch once said in a PBS interview, “Stomach is the key organ here. It’s not the brain.”
The Guru Summary
· The stock market is not totally efficient; that is, at any given time, certain stocks are overvalued and others are undervalued.
· Stocks with strong fundamentals (the measures of the strength of their underlying businesses, such as earnings, sales, debt, and cash flow) tend to perform best over the long term.
· By sticking to the numbers (the fundamentals), history’s greatest investors were able to develop systematic methods to identify undervalued stocks—and several have been kind enough to share their methods with the public.
· Every strategy—even the most successful in history—goes through down periods. If you abandon a proven strategy when times get tough, you’ll end up selling low—and you’ll miss out when the strategy bounces back.
· You don’t need to be a rocket scientist to beat the market. What you do need is dis-cipline and a willingness to stick with a proven strategy—despite what your emotions are telling you—during periodic down times.
7
wHo are they?
There are ten investing gurus that meet all of my criteria, around which I have built my market-beating system. They are, in no particular order, as follows.
Benjamin Graham
Benjamin Graham is generally regarded by stock market historians as the most accom-plished investor of all time, often referred to as “the father of value investing.” In short, he was Warren Buffett before Warren Buffett. His opinions were often quoted, his decisions made millions for those whose money he handled, and his reputation and fortune were built using a conservative, long-term philosophy—decades before Buffett would gain fame by embracing the same type of approach. And, like Buffett, Graham possessed a quick wit, straightforward style, and common sense approach that both professional and lay investors could understand and ben-efit from.
But Graham’s guru status goes far beyond simply having been Buffett’s teacher and men-tor. A native Briton who immigrated to the United States as a child, Graham first rose out of his family’s own financial struggles and then out of the Great Depression to establish a remarkable track record of his own. From 1936 to 1956, the Graham-Newman Corporation (which Graham ran along with Jerome Newman) averaged annual returns of about 20 percent, during which time the S&P 500 grew 12.2 percent. That’s a two-decade-long track record that few investors in his-tory can match.
To establish that track record, Graham used a conservative, risk-averse approach. Trendy, hot stocks didn’t garner his attention; he was concerned with companies’ balance sheets and their fundamentals. How much debt did they carry? How did their stock price compare to the amount of per-share earnings they were generating? Did the firm have strong sales figures?
Most of Graham’s strategy, however, seems aimed at the defensive investor. An important part of what makes Graham’s defensive investor approach “defensive” is what Graham called the “margin of safety”—that is, the difference between a stock’s price and the company’s under-lying value. Remember, while a variety of factors can send a stock’s price soaring or plummet-ing in the short term, over the long-term stock price is driven by what the real value of a com-pany is—based on its assets, its earnings, its debts, and so forth.
Graham recommended buying stocks with a high margin of safety, meaning that their prices were low relative to the real value of their businesses. Over the long run, such stocks should rise to reflect the company’s true value. But just as importantly, such undervalued stocks come with downside protection. They are already selling at a discount compared to their real value – that’s the margin of safety – so even if the company encounters problems and its earn-ings power declines a bit, the stock still might gain ground because it was so undervalued to begin with.
About the Benjamin Graham Strategy
8
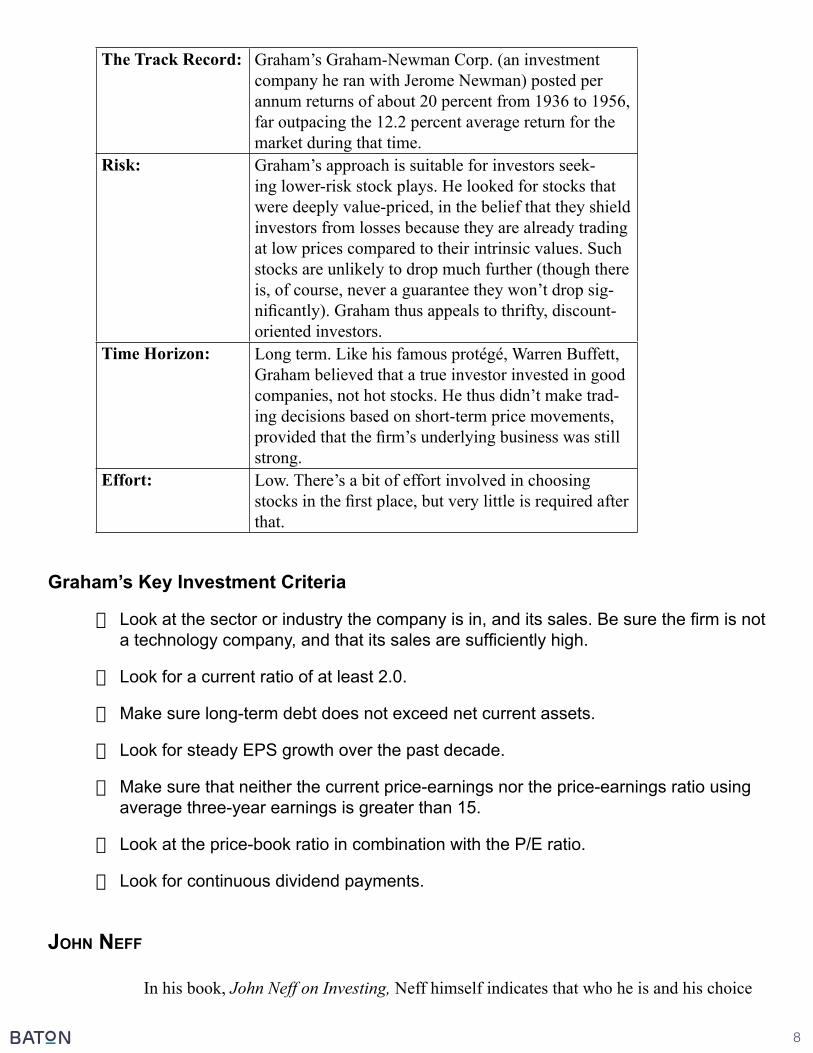
The Track Record: Graham’s Graham-Newman Corp. (an investment company he ran with Jerome Newman) posted per annum returns of about 20 percent from 1936 to 1956, far outpacing the 12.2 percent average return for the market during that time.
Risk: Graham’s approach is suitable for investors seek-ing lower-risk stock plays. He looked for stocks that were deeply value-priced, in the belief that they shield investors from losses because they are already trading at low prices compared to their intrinsic values. Such stocks are unlikely to drop much further (though there is, of course, never a guarantee they won’t drop sig-nificantly). Graham thus appeals to thrifty, discount-oriented investors.
Time Horizon: Long term. Like his famous protégé, Warren Buffett, Graham believed that a true investor invested in good companies, not hot stocks. He thus didn’t make trad-ing decisions based on short-term price movements, provided that the firm’s underlying business was still strong.
Effort: Low. There’s a bit of effort involved in choosing stocks in the first place, but very little is required after that.
Graham’s Key Investment Criteria
· Look at the sector or industry the company is in, and its sales. Be sure the firm is not a technology company, and that its sales are sufficiently high.
· Look for a current ratio of at least 2.0.
· Make sure long-term debt does not exceed net current assets.
· Look for steady EPS growth over the past decade.
· Make sure that neither the current price-earnings nor the price-earnings ratio using average three-year earnings is greater than 15.
· Look at the price-book ratio in combination with the P/E ratio.
· Look for continuous dividend payments.
john neff
In his book, John Neff on Investing, Neff himself indicates that who he is and his choice
9
of overlooked investments are, at least to some degree, intertwined. Born in 1931, Neff said his early years taught him that success is never automatic. His parents divorced when he was just four years old and it was only his grandfather’s tireless work ethic that kept Neff and his moth-er’s family from feeling the terrible effects of the Great Depression.
All of these experiences seem to have manifested later in Neff’s life in the way he ap-proached investing. For instance, bargain-hunting and sympathy for those who were struggling were apparent in his penchant for focusing on downtrodden, unloved stocks. Perseverance and intense work ethic, meanwhile, were part of the rigorous research and analysis he used to pick winners from this beaten-up group. So was the strength of conviction it took to stick with stocks that others shunned.
It’s important to note, however, that while Neff may have had a natural inclination to focus on these firms, there was also logic and good financial reasoning behind such an approach. “Woebegone regions have always lured me, for one very compelling reason,” he explained. “Swept up by flavors of the moment, prevailing wisdom frequently undervalues good compa-nies. Many—but not all—that languish out of favor deserve better treatment. Despite their solid earnings, they are rejected and ignored by investors caught in the clutch of groupthink.” Sound familiar? That concept is central to the value investing approach that Benjamin Graham is cred-ited with creating.
The first part of Neff’s approach—identifying the “woebegone”—is fairly easy. Check the financial section of the newspaper and you’ll find the companies whose stocks are near their 52-week lows, and those that are making headlines for negative reasons.
The challenge, of course, comes in the second part: separating the stocks that are unfairly being beaten down because of overreaction from those that deserve their low prices. To do this, Neff started with the P/E ratio. In fact, while others have categorized him as a “value investor” or a “contrarian,” Neff wrote that he prefers a different label: “‘Low price-earnings investor.’ It describes succinctly and accurately the investment style that guided Windsor while I was in charge.”
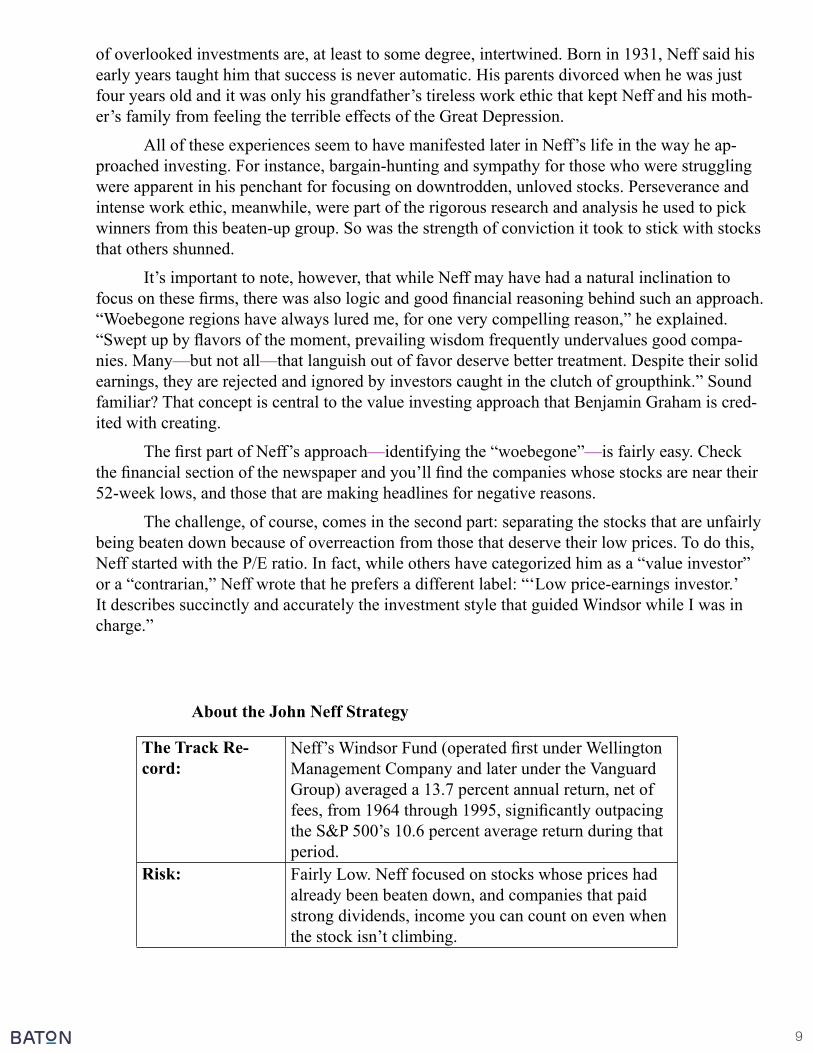
About the John Neff Strategy
The Track Re-cord:
Neff’s Windsor Fund (operated first under Wellington Management Company and later under the Vanguard Group) averaged a 13.7 percent annual return, net of fees, from 1964 through 1995, significantly outpacing the S&P 500’s 10.6 percent average return during that period.
Risk: Fairly Low. Neff focused on stocks whose prices had already been beaten down, and companies that paid strong dividends, income you can count on even when the stock isn’t climbing.
10
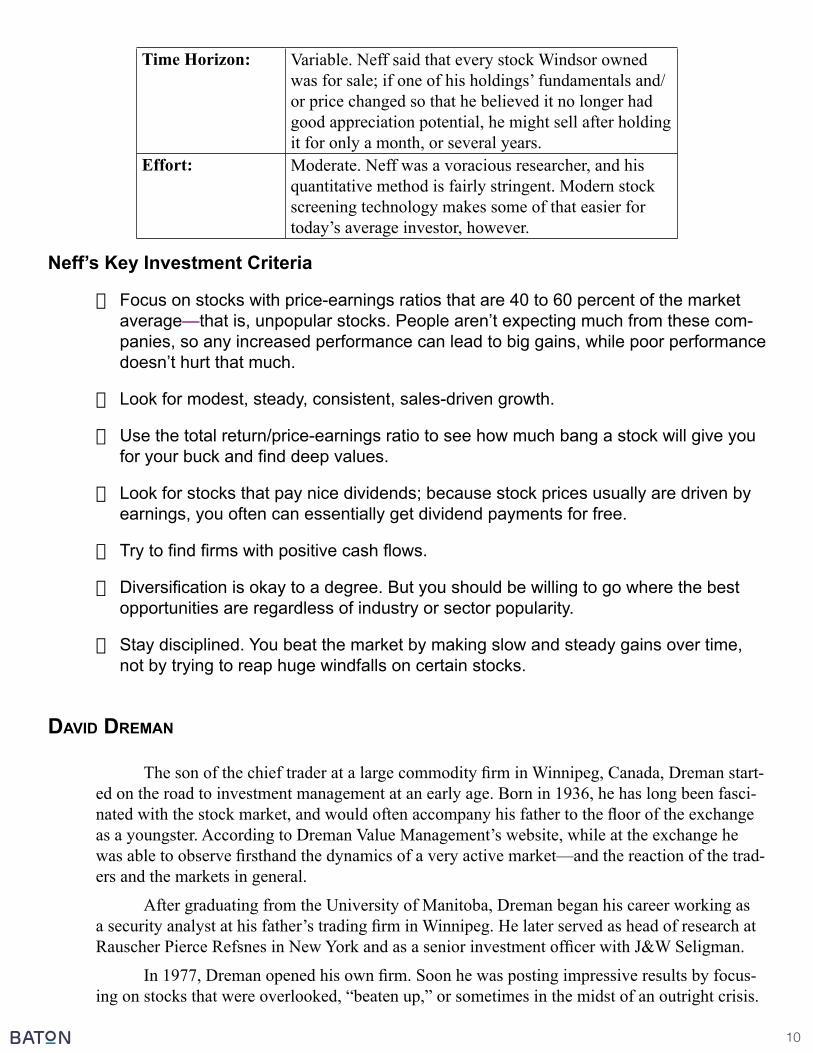
Time Horizon: Variable. Neff said that every stock Windsor owned was for sale; if one of his holdings’ fundamentals and/or price changed so that he believed it no longer had good appreciation potential, he might sell after holding it for only a month, or several years.
Effort: Moderate. Neff was a voracious researcher, and his quantitative method is fairly stringent. Modern stock screening technology makes some of that easier for today’s average investor, however.
Neff’s Key Investment Criteria
· Focus on stocks with price-earnings ratios that are 40 to 60 percent of the market average—that is, unpopular stocks. People aren’t expecting much from these com-panies, so any increased performance can lead to big gains, while poor performance doesn’t hurt that much.
· Look for modest, steady, consistent, sales-driven growth.
· Use the total return/price-earnings ratio to see how much bang a stock will give you for your buck and find deep values.
· Look for stocks that pay nice dividends; because stock prices usually are driven by earnings, you often can essentially get dividend payments for free.
· Try to find firms with positive cash flows.
· Diversification is okay to a degree. But you should be willing to go where the best opportunities are regardless of industry or sector popularity.
· Stay disciplined. You beat the market by making slow and steady gains over time, not by trying to reap huge windfalls on certain stocks.
DaviD Dreman
The son of the chief trader at a large commodity firm in Winnipeg, Canada, Dreman start-ed on the road to investment management at an early age. Born in 1936, he has long been fasci-nated with the stock market, and would often accompany his father to the floor of the exchange as a youngster. According to Dreman Value Management’s website, while at the exchange he was able to observe firsthand the dynamics of a very active market—and the reaction of the trad-ers and the markets in general.
After graduating from the University of Manitoba, Dreman began his career working as a security analyst at his father’s trading firm in Winnipeg. He later served as head of research at Rauscher Pierce Refsnes in New York and as a senior investment officer with J&W Seligman.
In 1977, Dreman opened his own firm. Soon he was posting impressive results by focus-ing on stocks that were overlooked, “beaten up,” or sometimes in the midst of an outright crisis.
11
He loaded up on these stocks, and unloaded them when the market valued them at about the same level it valued most stocks.
Dreman, whose company now manages more than $20 billion in assets, embraces his contrarian reputation. He uses the word “contrarian” in the title of several of his books on in-vesting, and the jacket of Contrarian Investment Strategies refers to his yacht, named The Con-trarian. While there may well be a naturally rebellious side to him, there are also some very concrete, intelligent, and observant reasons that Dreman adopted his swim-against-the-tide approach.
If all of this negativity is getting you down, don’t worry: There’s good news in all of this. Because so many investors have the same emotional and psychological responses to the market, Dreman believes that the wise investor can beat the market by going against the grain and focus-ing on stocks that are priced lowest in relation to certain fundamentals. History backs this idea up, he notes, saying:
The findings show that companies the market expects the best futures for, as mea-sured by the price/earnings, price-to-cash flow, price-to-book value, and price-to-dividend ratios, have consistently done the worst, while the stocks believed to have the most dismal futures have always done the best. (Dreman’s emphasis).
Dreman goes further than just identifying unloved stocks with these four measures. He also wants to make sure that a firm is financially strong; he’s interested in companies whose stocks are selling on the cheap because of overreaction and fear—not because there are real problems with the firm. He thus looks at a variety of other fundamental factors—return on eq-uity, profit margins, debt-equity ratio, and yield—to make sure a company is standing on solid financial footing.
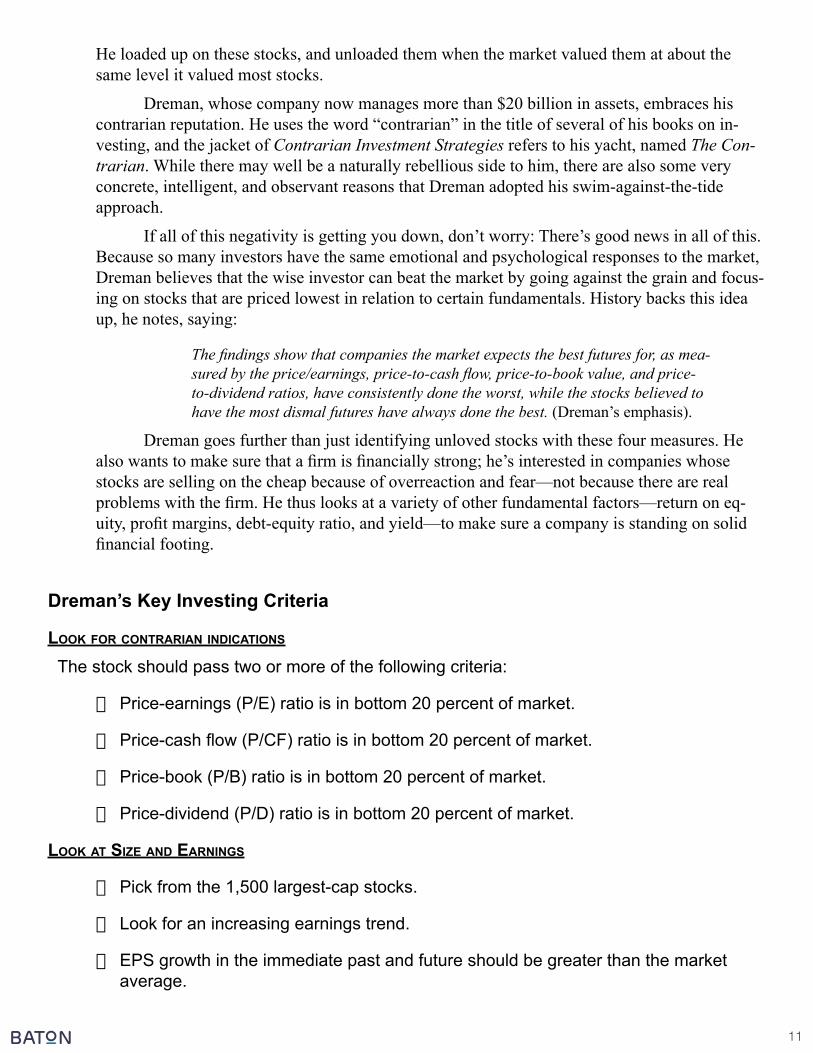
Dreman’s Key Investing Criteria
Look for contrarian inDications
The stock should pass two or more of the following criteria:
· Price-earnings (P/E) ratio is in bottom 20 percent of market.
· Price-cash flow (P/CF) ratio is in bottom 20 percent of market.
· Price-book (P/B) ratio is in bottom 20 percent of market.
· Price-dividend (P/D) ratio is in bottom 20 percent of market.
Look at size anD earninGs
· Pick from the 1,500 largest-cap stocks.
· Look for an increasing earnings trend.
· EPS growth in the immediate past and future should be greater than the market average.
12
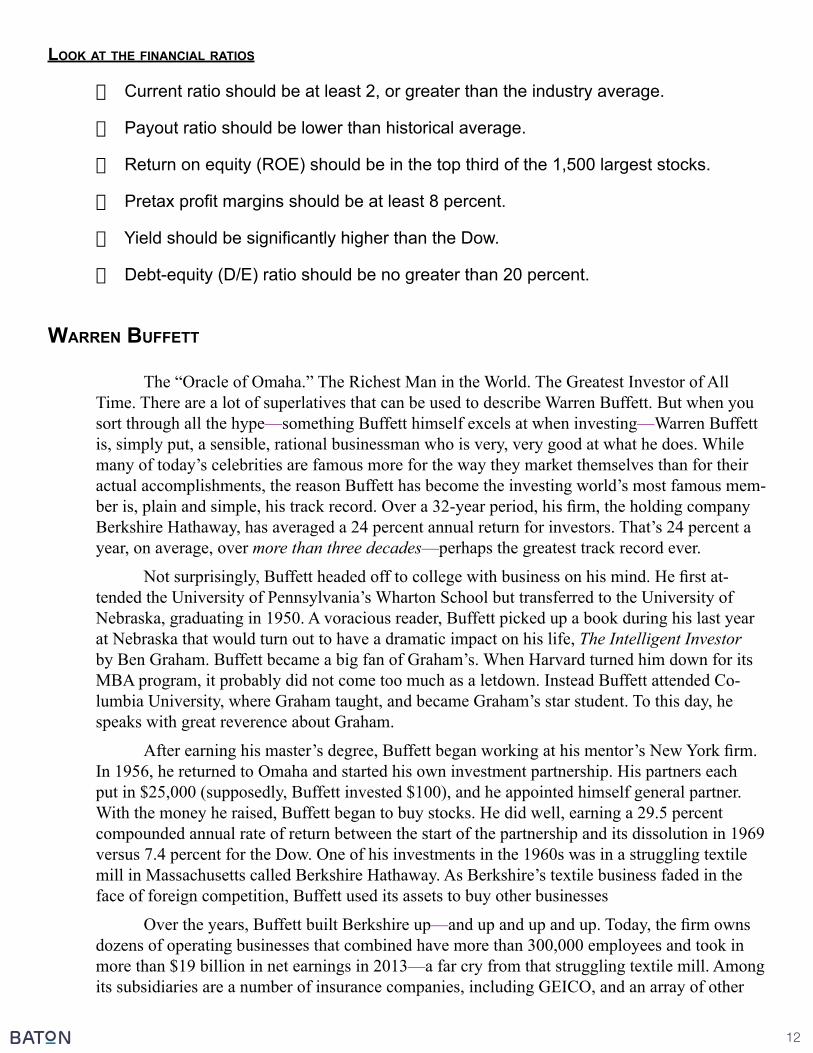
Look at the financiaL ratios
· Current ratio should be at least 2, or greater than the industry average.
· Payout ratio should be lower than historical average.
· Return on equity (ROE) should be in the top third of the 1,500 largest stocks.
· Pretax profit margins should be at least 8 percent.
· Yield should be significantly higher than the Dow.
· Debt-equity (D/E) ratio should be no greater than 20 percent.
Warren Buffett
The “Oracle of Omaha.” The Richest Man in the World. The Greatest Investor of All Time. There are a lot of superlatives that can be used to describe Warren Buffett. But when you sort through all the hype—something Buffett himself excels at when investing—Warren Buffett is, simply put, a sensible, rational businessman who is very, very good at what he does. While many of today’s celebrities are famous more for the way they market themselves than for their actual accomplishments, the reason Buffett has become the investing world’s most famous mem-ber is, plain and simple, his track record. Over a 32-year period, his firm, the holding company Berkshire Hathaway, has averaged a 24 percent annual return for investors. That’s 24 percent a year, on average, over more than three decades—perhaps the greatest track record ever.
Not surprisingly, Buffett headed off to college with business on his mind. He first at-tended the University of Pennsylvania’s Wharton School but transferred to the University of Nebraska, graduating in 1950. A voracious reader, Buffett picked up a book during his last year at Nebraska that would turn out to have a dramatic impact on his life, The Intelligent Investor by Ben Graham. Buffett became a big fan of Graham’s. When Harvard turned him down for its MBA program, it probably did not come too much as a letdown. Instead Buffett attended Co-lumbia University, where Graham taught, and became Graham’s star student. To this day, he speaks with great reverence about Graham.
After earning his master’s degree, Buffett began working at his mentor’s New York firm. In 1956, he returned to Omaha and started his own investment partnership. His partners each put in $25,000 (supposedly, Buffett invested $100), and he appointed himself general partner. With the money he raised, Buffett began to buy stocks. He did well, earning a 29.5 percent compounded annual rate of return between the start of the partnership and its dissolution in 1969 versus 7.4 percent for the Dow. One of his investments in the 1960s was in a struggling textile mill in Massachusetts called Berkshire Hathaway. As Berkshire’s textile business faded in the face of foreign competition, Buffett used its assets to buy other businesses
Over the years, Buffett built Berkshire up—and up and up and up. Today, the firm owns dozens of operating businesses that combined have more than 300,000 employees and took in more than $19 billion in net earnings in 2013—a far cry from that struggling textile mill. Among its subsidiaries are a number of insurance companies, including GEICO, and an array of other
13
businesses, such as Fruit of the Loom, Benjamin Moore, NetJets, and Shaw Industries. So re-vered is Berkshire that its annual meeting has become known as “Woodstock for capitalists.” In 2013, the Omaha event drew about 30,000 people, many of whom were no doubt there to hear Buffett’s trademark investment wisdom—and his trademark wit.
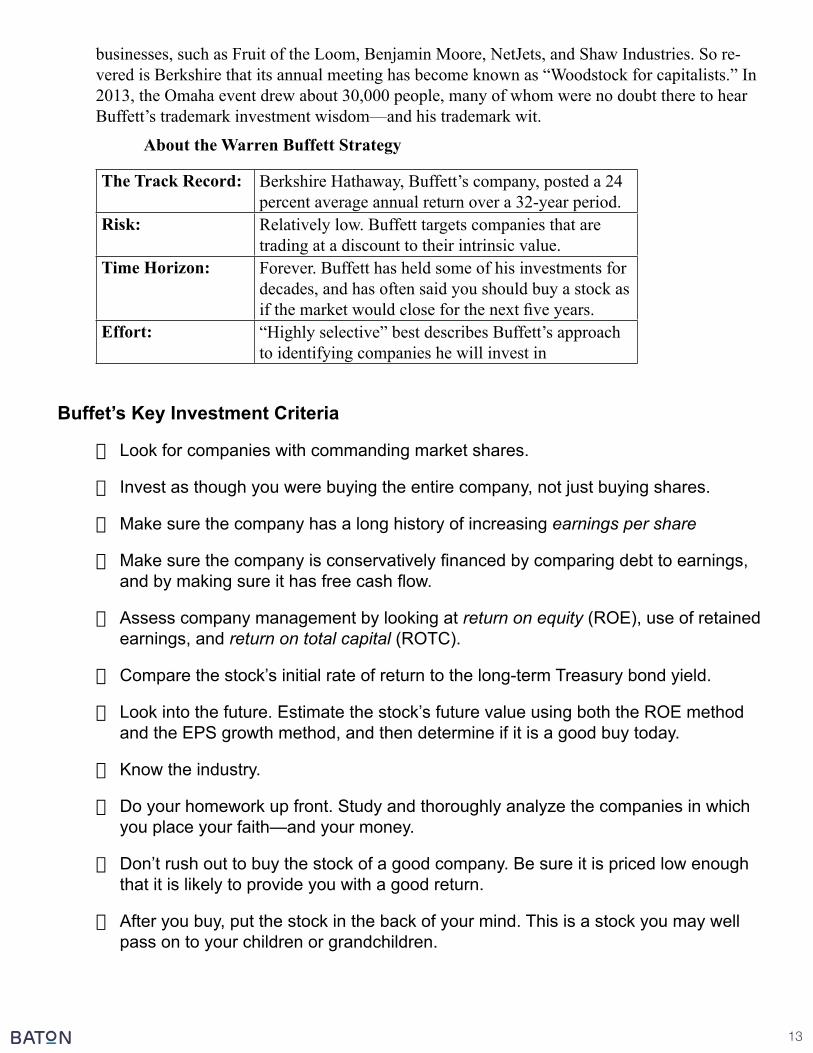
About the Warren Buffett Strategy
The Track Record: Berkshire Hathaway, Buffett’s company, posted a 24 percent average annual return over a 32-year period.
Risk: Relatively low. Buffett targets companies that are trading at a discount to their intrinsic value.
Time Horizon: Forever. Buffett has held some of his investments for decades, and has often said you should buy a stock as if the market would close for the next five years.
Effort: “Highly selective” best describes Buffett’s approach to identifying companies he will invest in
Buffet’s Key Investment Criteria
· Look for companies with commanding market shares.
· Invest as though you were buying the entire company, not just buying shares.
· Make sure the company has a long history of increasing earnings per share
· Make sure the company is conservatively financed by comparing debt to earnings, and by making sure it has free cash flow.
· Assess company management by looking at return on equity (ROE), use of retained earnings, and return on total capital (ROTC).
· Compare the stock’s initial rate of return to the long-term Treasury bond yield.
· Look into the future. Estimate the stock’s future value using both the ROE method and the EPS growth method, and then determine if it is a good buy today.
· Know the industry.
· Do your homework up front. Study and thoroughly analyze the companies in which you place your faith—and your money.
· Don’t rush out to buy the stock of a good company. Be sure it is priced low enough that it is likely to provide you with a good return.
· After you buy, put the stock in the back of your mind. This is a stock you may well pass on to your children or grandchildren.
14
Peter Lynch
When it comes to the great Peter Lynch, you don’t need to look too far past these three pairs of numbers to understand why he’s known as one of history’s greatest investors:
§15.8 and 29.2. From 1977 to 1990, the period that Lynch oversaw Fidelity Invest-ments’ Magellan Fund, the S&P 500 returned an average of 15.8 percent per year. Magellan, on the other hand, averaged a 29.2 percent annual return—nearly doubling the S&P for more than a decade.
§20 and 14. The first number, 20, is the amount of money, in millions of dollars, that Magellan managed when Lynch took over; the second, 14, is the amount, in billions of dollars, that it managed when he left—a 700-fold increase.
§$10,000 and $280,000. If you had put $10,000 into Magellan the day Lynch began overseeing the fund, you’d have had $280,000 by the day he retired 13 years later—putting you a lot closer to being able to retire!
Those numbers are impressive—very impressive. In fact, they make for one of the best investing track records of all time, and they are a big part of why Lynch remains one of the most well-known and frequently quoted investors in the world today, even though he retired nearly two decades ago.
But while Lynch’s staggering track record is no doubt a big part of his appeal, there are other reasons he is so revered in the investing world. A big part of his popularity is due to the fact that, despite having been one of the greatest—and richest—professional investors ever, Lynch’s investment philosophy is one that just about anyone can understand and use. His ap-proach is grounded in common sense and he speaks with a down-to-earth sensibility, and is com-monly referred to as “GARP” – Growth At a Reasonable Price.
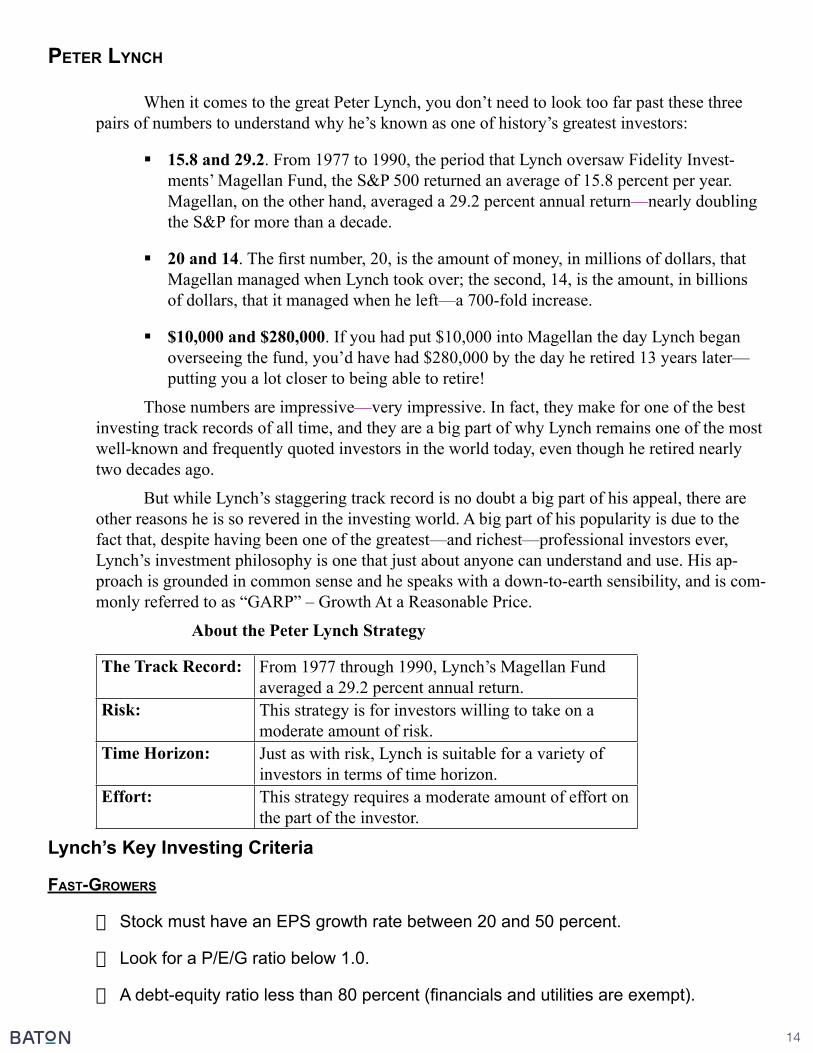
About the Peter Lynch Strategy
The Track Record: From 1977 through 1990, Lynch’s Magellan Fund averaged a 29.2 percent annual return.
Risk: This strategy is for investors willing to take on a moderate amount of risk.
Time Horizon: Just as with risk, Lynch is suitable for a variety of investors in terms of time horizon.
Effort: This strategy requires a moderate amount of effort on the part of the investor.
Lynch’s Key Investing Criteria
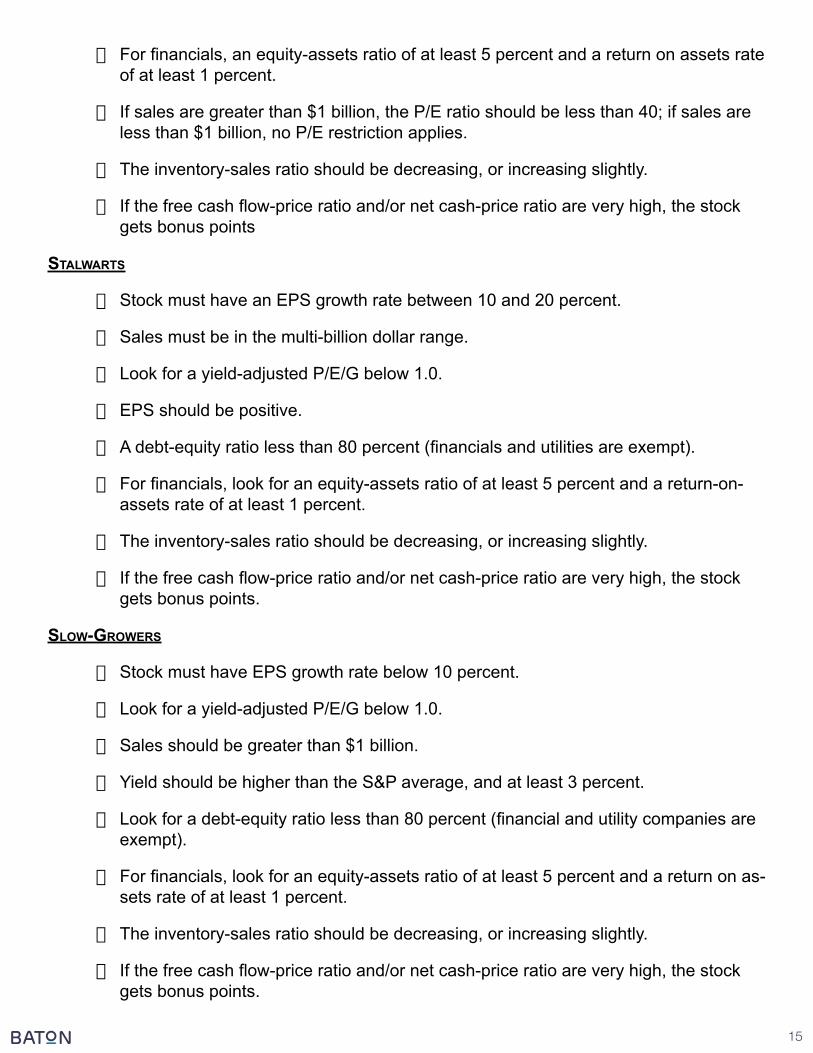
fast-GroWers
· Stock must have an EPS growth rate between 20 and 50 percent.
· Look for a P/E/G ratio below 1.0.
· A debt-equity ratio less than 80 percent (financials and utilities are exempt).
15
· For financials, an equity-assets ratio of at least 5 percent and a return on assets rate of at least 1 percent.
· If sales are greater than $1 billion, the P/E ratio should be less than 40; if sales are less than $1 billion, no P/E restriction applies.
· The inventory-sales ratio should be decreasing, or increasing slightly.
· If the free cash flow-price ratio and/or net cash-price ratio are very high, the stock gets bonus points
staLWarts
· Stock must have an EPS growth rate between 10 and 20 percent.
· Sales must be in the multi-billion dollar range.
· Look for a yield-adjusted P/E/G below 1.0.
· EPS should be positive.
· A debt-equity ratio less than 80 percent (financials and utilities are exempt).
· For financials, look for an equity-assets ratio of at least 5 percent and a return-on-assets rate of at least 1 percent.
· The inventory-sales ratio should be decreasing, or increasing slightly.
· If the free cash flow-price ratio and/or net cash-price ratio are very high, the stock gets bonus points.
sLoW-GroWers
· Stock must have EPS growth rate below 10 percent.
· Look for a yield-adjusted P/E/G below 1.0.
· Sales should be greater than $1 billion.
· Yield should be higher than the S&P average, and at least 3 percent.
· Look for a debt-equity ratio less than 80 percent (financial and utility companies are exempt).
· For financials, look for an equity-assets ratio of at least 5 percent and a return on as-sets rate of at least 1 percent.
· The inventory-sales ratio should be decreasing, or increasing slightly.
· If the free cash flow-price ratio and/or net cash-price ratio are very high, the stock gets bonus points.
16
kenneth L. fisher
If you’re at all familiar with the stock market you almost surely have some knowledge of the price-earnings ratio. For decades, the P/E ratio has been the most frequently used and dis-cussed stock analysis ratio. The P/E ratio is determined by dividing a stock’s per-share price by the amount of per-share earnings it generates to give investors an idea of how much bang they are getting for their buck. As you’ve already seen, Ben Graham, John Neff, David Dreman, and Peter Lynch all used the P/E ratio in one way or another when analyzing stocks, and the statistic has become so widely used that it is often the only financial ratio included in newspapers’ daily listings of stock quotes.
But when most people are focused on one thing, you’ll usually find Kenneth Fisher fo-cused on something else—and quite often to great benefit. That certainly was the case back in 1984, when Fisher’s book Super Stocks turned the P/E-focused investment world on its head. While many investors relied heavily on the P/E ratio, Fisher believed there was a major hole in its usefulness. Part of the problem, he explained in Super Stocks, is that earnings—even the earnings of good companies—can fluctuate greatly from year to year. The decision to replace equipment or facilities in one year rather than in another, the use of money for new research that will help the company reap profits later on, and changes in accounting methods can all turn one quarter’s profits into the next quarter’s losses. And that can happen without regard for what Fisher thought was truly important in the long term: how well or poorly the company’s underly-ing business was performing.
While earnings fluctuate, Fisher found that sales were far more stable. In fact, he found that the sales of what he called “super companies”—those that were capable of growing their stock price 3 to 10 times in value in a period of three to five years—rarely decline significantly. Because of that, he pioneered the use of a new way to value stocks: the price-sales ratio (PSR), which compared the total price of a company’s stock to the total sales the company generated.
Fisher’s innovative theory made for big news in stock market circles, and Super Stocks became a best seller. Since its publication, the price-sales ratio has become a major tool for many investors, and Fisher has built something of an empire in the investment world. With a net worth of $1.8 billion, he was one of the 300 richest Americans as of 2007, according to Forbes.com, and his money management firm, Fisher Investments, oversees about $45 billion in as-sets. In addition, Fisher has become one of the longest-running columnists in Forbes magazine’s history, and he’s written three more books on investing. And, through it all, Fisher remains very much a stock market rebel.
Fisher’s Key Investing Criteria
· Look for a low price-sales ratio.
· Look for a low debt-equity ratio, unless the company is a financial firm.
· Look at the price-research ratio if the company is a medical or technology firm.
17
· If the company passes all of these criteria, the Fisher model has some interest. It then continues testing to see if the company is a super stock.
is the comPany a suPer stock?
· Price-sales ratio should be 0.75 or less for noncyclicals or 0.4 or less for cyclicals.
· Inflation-adjusted EPS growth rate should be greater than 15 percent.
· Free cash flow per share should be positive.
· Three-year average net profit margin should be 5 percent or greater.
· If the company passes all of the super stock criteria, this method has a significant interest in the stock. The most important variable here is the price-sales ratio.
martin zWeiG
Martin Zweig may not have been born a great investor, but it took him less time than per-haps any other guru we follow to start making himself into one.
Thanks to a birthday gift from his uncle of six shares of General Motors stock, Zweig was just 13 years old when he began following the stock market. He started tracking GM and some other stocks, and before long, he was hooked. By the time he was in high school, Zweig writes in his book, Winning on Wall Street, he had made up his mind: He was going to become a millionaire, and he would do so by investing in stocks.
Millions of people have made a similar decision over the years. But unlike the vast ma-jority of them, Zweig followed through. He began paying more and more attention to the mar-ket. Soon he was wowing his high school teachers with his knowledge of stocks. By the time he was in college, Zweig was buying and selling stocks, and as a graduate student he performed groundbreaking research in the field of stock analysis.
It wasn’t long before he’d reached the goal he’d set for himself in high school. In fact, you might say he obliterated it becoming not only a millionaire, but also the owner of what Forbes reported was the most expensive apartment in New York City and the eighth most expen-sive home in the world—a $70 million penthouse that sits atop Manhattan’s chic Pierre Hotel.
Given how fixated he was on beating the market at such an early age, it almost seems Zweig was destined to become one of the world’s best investors. “Ever since I can remember,” he wrote Winning on Wall Street, “I have had an almost overwhelming desire to learn all I could about the stock market and to play it successfully. Perhaps my urge was not too different from that attributed to the mountain climber who must assault the mountain just because it’s there. … [F]rom an early age I wanted to surmount the summit of the stock market, so to speak. It was a challenge I couldn’t resist.”
Zweig’s intense desire and ambition may have been a gift of birth, but his stock market success—his stock recommendation newsletter was ranked number one based on risk-adjusted returns by Hulbert Financial Digest during the 15 years Hulbert monitored it—wasn’t simply

18
due to natural ability. His development into a great investor was marked by years of study and hard work, and the ability to adhere to a strict, thorough investment strategy.
About the Martin Zweig Strategy
The Track Record: During the 15 years that it was monitored, Zweig’s stock recommendation newsletter returned an aver-age of 15.9 percent per year, during which time it was ranked number one based on risk-adjusted returns by Hulbert Financial Digest.
Risk: Moderate or a little below moderate. While Zweig was a growth investor, he used an extensive, multi-faceted approach to analyzing earnings to make sure a company was likely to continue its growth, and he also used value-type variables like the price-earnings and debt-equity ratios to limit risk.
Time Horizon: Medium to long term.Effort: Fairly low.
Zweig’s Key Investing Criteria
· Look for a reasonable P/E ratio—not too high and not too low.
· Make sure revenue is growing comparably to the 3-year EPS growth rate.
· Look for rising sales growth over the past year.
· Look for positive earnings growth in the current quarter.
· Look for earnings growth in the past several quarters to be at least half of the long term growth rate.
· Compare EPS growth in the current quarter with the prior three quarters; avoid slow-ing growth.
· Compare EPS growth in the current quarter with historical growth.
· Look for earnings persistence over the past five years.
· Look for the long-term EPS growth rate to be at least 15 percent.
· Look for no debt or a low debt-equity ratio compared to a stock’s industry.
· Look for insider buying and no insider selling.
· Look at the economy, especially the actions of the Federal Reserve Bank; be more risk adverse while the Fed is increasing rates.
19
james o’shauGhnessy
In his 1996 book What Works on Wall Street, James O’Shaughnessy detailed what may be the most in-depth quantitative stock market study in history, one in which he used Standard & Poor’s high-powered Compustat computer database to back-test the performance of dozens of stock-picking approaches over more than four decades, from the early 1950s to the mid-1990s. Large market caps, small market caps, high or low price-earnings ratios, strong or weak cash flows—O’Shaughnessy studied how these and myriad other factors (and combinations of fac-tors) affected stock performance for most of the post–World War II era. According to his book, his study marked the first time Compustat’s full historical data was released to an outside re-searcher.
In addition to finding out how certain strategies had performed in terms of returns over the long term, O’Shaughnessy’s study also allowed him to find out how risky or volatile each strategy he examined was. After looking at all sorts of different approaches, he was thus able to find the one that produced the best risk-adjusted returns—what he called his “United Corner-stone” strategy.
The United Cornerstone approach, which we used to establish our O’Shaughnessy-based model, is actually a combination of two separate models that O’Shaughnessy tested, one growth-focused and one value-focused. His growth method—”Cornerstone Growth”—produced better returns than his “Cornerstone Value” approach, and was a little more risky. The Cornerstone Value strategy, meanwhile, produced returns that were a bit lower, but with less volatility. To-gether, they formed an exceptional one-two punch, averaging a compound return of 17.1 percent from 1954 through 1996, easily beating the S&P 500s 11.5 percent compound return during that time while maintaining relatively low levels of risk. That 5.6 percent spread is enormous when compounded over 42 years: If you’d invested $10,000 using the United Cornerstone approach on the first day of the period covered by O’Shaughnessy’s study, you’d have had almost $7.6 million by the end of 1996—more than $6.6 million more than you’d have ended up with if you’d invested $10,000 in the S&P for the same period. That seems powerful evidence that stock prices do not—as efficient market believers suggest—move in a “random walk,” but instead, as O’Shaughnessy writes, with a “purposeful stride.”
About the James O’Shaughnessy Strategy
20
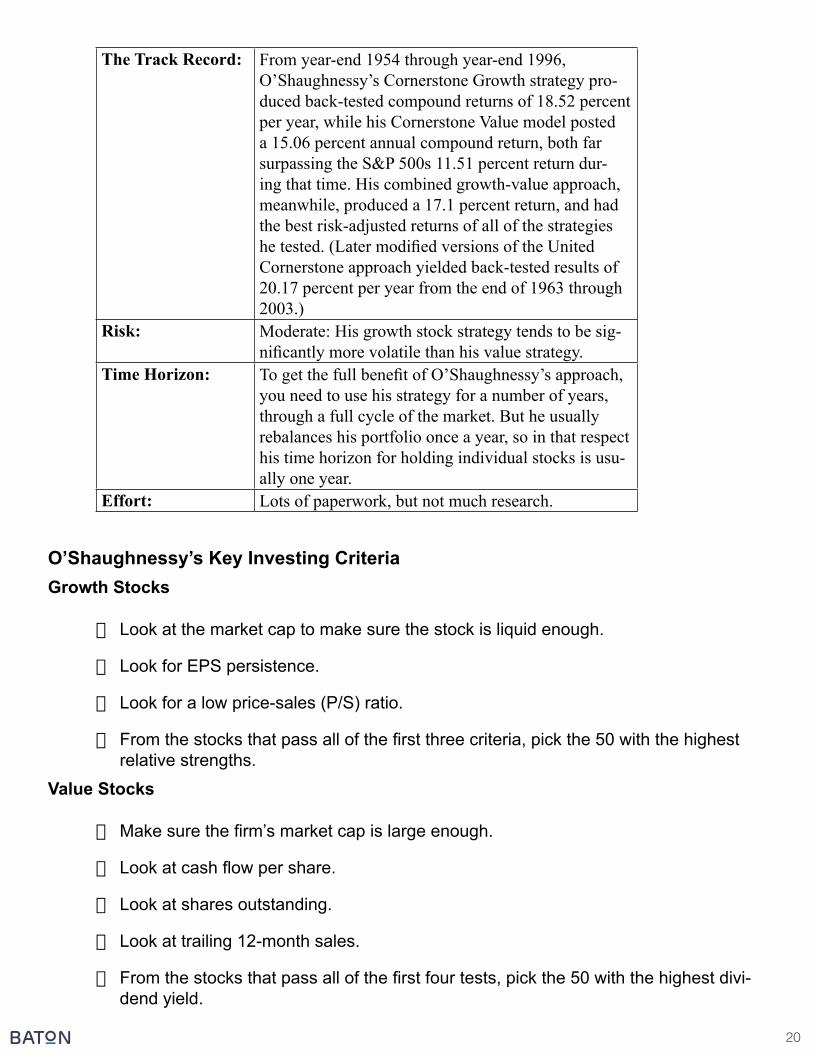
The Track Record: From year-end 1954 through year-end 1996, O’Shaughnessy’s Cornerstone Growth strategy pro-duced back-tested compound returns of 18.52 percent per year, while his Cornerstone Value model posted a 15.06 percent annual compound return, both far surpassing the S&P 500s 11.51 percent return dur-ing that time. His combined growth-value approach, meanwhile, produced a 17.1 percent return, and had the best risk-adjusted returns of all of the strategies he tested. (Later modified versions of the United Cornerstone approach yielded back-tested results of 20.17 percent per year from the end of 1963 through 2003.)
Risk: Moderate: His growth stock strategy tends to be sig-nificantly more volatile than his value strategy.
Time Horizon: To get the full benefit of O’Shaughnessy’s approach, you need to use his strategy for a number of years, through a full cycle of the market. But he usually rebalances his portfolio once a year, so in that respect his time horizon for holding individual stocks is usu-ally one year.
Effort: Lots of paperwork, but not much research.
O’Shaughnessy’s Key Investing CriteriaGrowth Stocks
· Look at the market cap to make sure the stock is liquid enough.
· Look for EPS persistence.
· Look for a low price-sales (P/S) ratio.
· From the stocks that pass all of the first three criteria, pick the 50 with the highest relative strengths.
Value Stocks
· Make sure the firm’s market cap is large enough.
· Look at cash flow per share.
· Look at shares outstanding.
· Look at trailing 12-month sales.
· From the stocks that pass all of the first four tests, pick the 50 with the highest divi-dend yield.
21
· With both of these methodologies, it is an all-or-none approach. There is no “some” level of interest, only “strong” interest or no interest at all.
joeL GreenBLatt
One of the keys to beating the market over the long haul is having a strategy that looks at a stock from multiple perspectives. Whether it’s the relatively simple four-variable O’Shaughnessy growth model or the more in-depth, 13-variable David Dreman approach, these strategies examine a stock from more than one angle. For all of our research, we’ve yet to come across an exceptional long-term strategy that uses just one variable; it seems that not even Jack Bauer or Schwarzenegger could take down the market with just one bullet.
But guess what: You can do it with two.
In his 2005 bestseller The Little Book That Beats The Market, hedge fund manager Joel Greenblatt laid out a stunningly simple way to beat the market using two—and only two—fun-damental variables. The “Magic Formula,” as he called it, looks only at the return a company generates on its capital, and at the firm’s earnings yield (which is similar, but not identical to, the inverse of its price-earnings ratio).
Sound too good to be true? It’s not. Using this strategy, Greenblatt produced back-tested average returns of 30.8 percent per year from 1988 through 2004, about two-and-a-half times the S&P 500’s 12.4 percent average annual return during that time. And since we started track-ing our Magic Formula–based strategy in December 2005, it, too, has outpaced the market by a decent margin.
This people-friendly approach reflects two of Greenblatt’s main contentions: First, “if you really want to ‘beat the market,’ most professionals and academics can’t help you”; and, second, “that leaves only one real alternative: You must do it yourself.”
But while Greenblatt’s explanations, and the details of his magic formula, are simplistic, don’t assume that his approach is easy to follow. This is one strategy in which psychological barriers can definitely rear their ugly heads, as you’ll soon see.
What Greenblatt’s approach does show, however, is that while beating the market might be hard, it doesn’t have to be complicated. “It won’t even take much work—just minutes every few months,” Greenblatt writes of using his magic formula. The logistics aren’t the hard part here. “[T]he hard part,” he says, “is making sure that you understand why the magic formula makes sense. The hard part is continuing to believe that the magic formula still makes sense even when friends, experts, the news media, and [the market] indicate otherwise.”
So why does the magic formula work? In part, it works because its two variables—return on total capital and earnings yield—combine to target solid companies that are selling at reason-able prices. According to Greenblatt, another big reason that the strategy works—and will con-tinue to work even if everyone knows about it—is that, ironically, it doesn’t work sometimes.
About the Joel Greenblatt Strategy
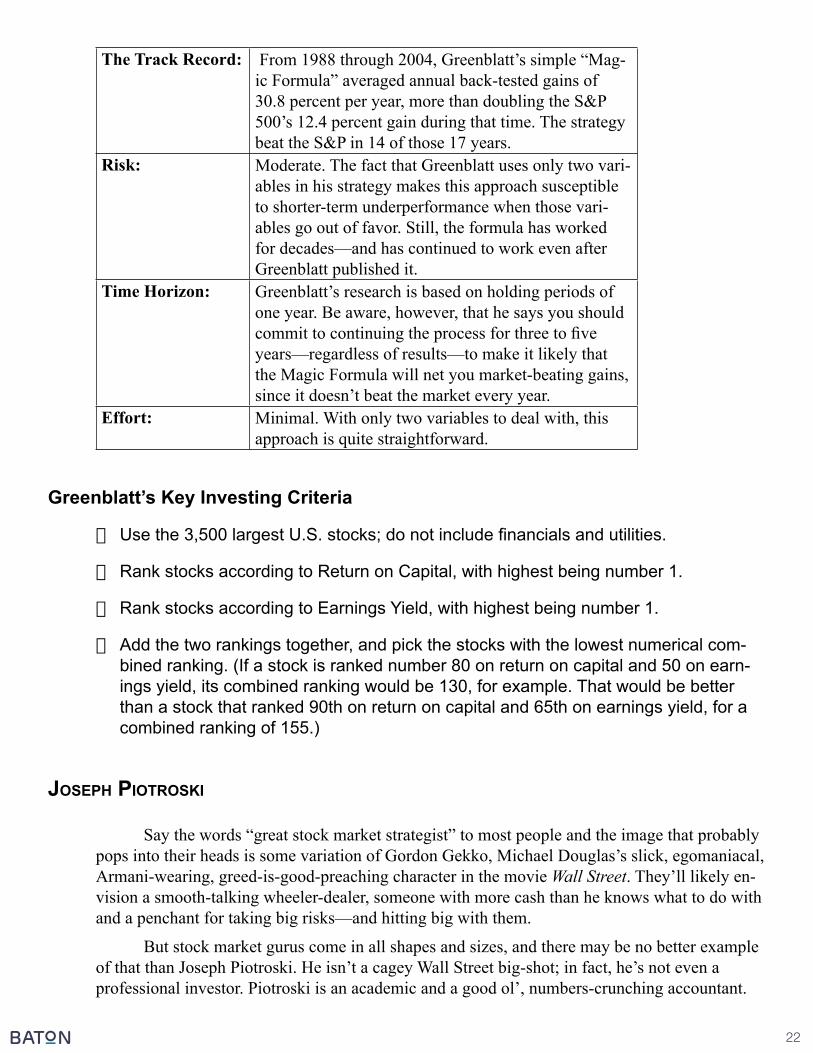
22
The Track Record: From 1988 through 2004, Greenblatt’s simple “Mag-ic Formula” averaged annual back-tested gains of 30.8 percent per year, more than doubling the S&P 500’s 12.4 percent gain during that time. The strategy beat the S&P in 14 of those 17 years.
Risk: Moderate. The fact that Greenblatt uses only two vari-ables in his strategy makes this approach susceptible to shorter-term underperformance when those vari-ables go out of favor. Still, the formula has worked for decades—and has continued to work even after Greenblatt published it.
Time Horizon: Greenblatt’s research is based on holding periods of one year. Be aware, however, that he says you should commit to continuing the process for three to five years—regardless of results—to make it likely that the Magic Formula will net you market-beating gains, since it doesn’t beat the market every year.
Effort: Minimal. With only two variables to deal with, this approach is quite straightforward.
Greenblatt’s Key Investing Criteria
· Use the 3,500 largest U.S. stocks; do not include financials and utilities.
· Rank stocks according to Return on Capital, with highest being number 1.
· Rank stocks according to Earnings Yield, with highest being number 1.
· Add the two rankings together, and pick the stocks with the lowest numerical com-bined ranking. (If a stock is ranked number 80 on return on capital and 50 on earn-ings yield, its combined ranking would be 130, for example. That would be better than a stock that ranked 90th on return on capital and 65th on earnings yield, for a combined ranking of 155.)
josePh Piotroski
Say the words “great stock market strategist” to most people and the image that probably pops into their heads is some variation of Gordon Gekko, Michael Douglas’s slick, egomaniacal, Armani-wearing, greed-is-good-preaching character in the movie Wall Street. They’ll likely en-vision a smooth-talking wheeler-dealer, someone with more cash than he knows what to do with and a penchant for taking big risks—and hitting big with them.
But stock market gurus come in all shapes and sizes, and there may be no better example of that than Joseph Piotroski. He isn’t a cagey Wall Street big-shot; in fact, he’s not even a professional investor. Piotroski is an academic and a good ol’, numbers-crunching accountant.
23
During the work week, you won’t find him in the press making headlines or in the board room making billion-dollar deals; instead, you’ll find him in the classroom, teaching accounting cours-es at Stanford University, whose website states that Piotroski’s research focuses on “financial reporting issues.” Talk about a far cry from Gordon Gekko.
While Piotroski may be the least-known of all the investing strategists we follow, his contributions to the field of stock market analysis make him absolutely worthy of guru status. In 2000, while teaching at the University of Chicago, he authored a highly regarded academic paper on stock investing that turned quite a few heads on Wall Street. His research focused on companies that had high book-market ratios—the type of unpopular stocks whose book values (equal to their total assets minus their total liabilities) were high compared to the value investors ascribed to them (their market capitalization—share price multiplied by their number of shares).
Using a series of balance sheet, accounting-based measures, Piotroski developed a meth-odology to identify high book-market companies that were likely to become big winners. His explanation of this method isn’t as fun a read as Lynch’s or Dreman’s books; his paper is filled with math and accounting terms like “cross-sectional regression,” and tables whose headings say things like “Decomposition of DROA: Changes in Asset Turnover and Gross Margins.”
But here’s the thing: The strategy works, and it works big time. Piotroski’s research found that buying high book-market firms that passed his tests and shorting those that didn’t would have produced a 23 percent average annual return from 1976 through 1996—more than double the S&P 500’s gain during that time. And, as you’ll soon see, our Piotroski-based method is evi-dence that the strategy still works today.
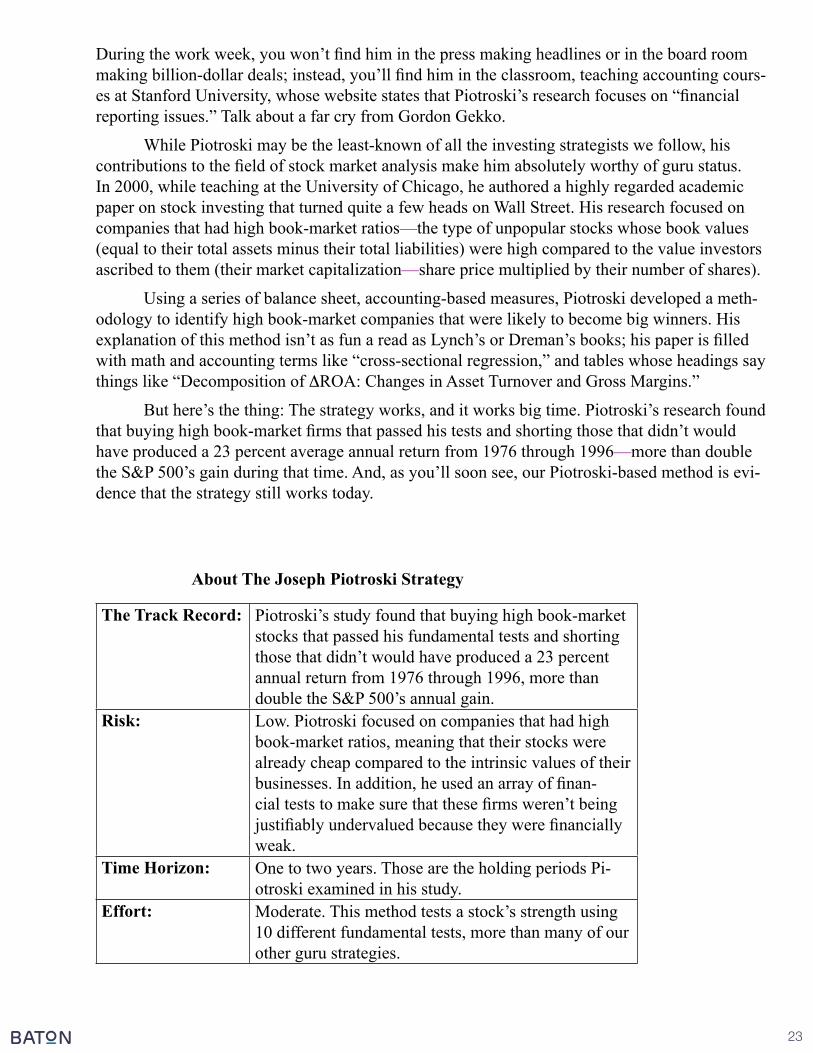
About The Joseph Piotroski Strategy
The Track Record: Piotroski’s study found that buying high book-market stocks that passed his fundamental tests and shorting those that didn’t would have produced a 23 percent annual return from 1976 through 1996, more than double the S&P 500’s annual gain.
Risk: Low. Piotroski focused on companies that had high book-market ratios, meaning that their stocks were already cheap compared to the intrinsic values of their businesses. In addition, he used an array of finan-cial tests to make sure that these firms weren’t being justifiably undervalued because they were financially weak.
Time Horizon: One to two years. Those are the holding periods Pi-otroski examined in his study.
Effort: Moderate. This method tests a stock’s strength using 10 different fundamental tests, more than many of our other guru strategies.
24
Piotroski’s Key Investing Criteria
· Firm must have high book-market ratio; if not, it fails this method even if it passes all other tests.
· Return on assets should be positive and increasing.
· Cash flow from operations should be positive and greater than net income.
· Long-term debt-assets ratio should be decreasing.
· Current ratio should be increasing.
· Number of shares outstanding should not be increasing.
· Gross margin should be increasing.
· Asset turnover should be increasing.
the PrinciPLes of Guru investinG
So now that we know who our ten gurus are and how we can use their time-prov-en methodologies to beat the market, how do we integrate that into a cohesive portfolio management process? In addition to developing stock selection models for each of the individual gurus, we have also developed the following set of principles that informs our portfolio allocation on an ongoing basis.
All of these principles have been integrated into a formula that points to the two most attractive stocks from the five most successful guru strategies at a given point in time. By no means is this portfolio static; in fact, in an average month roughly half of the stocks in the portfolio are replaced by ones that score higher. That doesn’t necessarily mean that anything is wrong with the stocks being replaced, only that the new stocks offer more immediate upside opportunity based on our unique formula.
Guru Investing Principle 1: Combine Strategies
· Because of compounding, downside volatility isn’t just uncomfortable—it actually costs you money.
· To maximize returns in the Baton portfolio, I only look at stocks that get approval from the best performing guru strategies.
Guru Investing Principle 2: Stick to the Numbers
· Using proven, quantitative strategies allows you to make buy and sell decisions solely on the numbers—a stock’s fundamentals—helping to remove emotion from
25
the process.
· Tinkering with a proven quantitative strategy may work today, tomorrow, or a few months from now. But you have no idea what the repercussions will be over the long term. It’s best to stick firmly to strategies that are backed up by long, proven track records.
Guru Investing Principle 3: Stay Disciplined Over the Long Haul
· It’s essential to stick to your strategy for the long term. Even the best strategies have down periods, and it can sometimes take over a year to reap the benefits of a good method. If you try to time your use of a strategy, you’ll likely miss out on some big gains.
· Expectations shape reactions; be prepared for short-term 10 to 20 percent down-turns that are inevitable in the stock market—and the less frequent but also inevi-table 35 to 50 percent downturns you’ll occasionally experience. You can’t predict when they’ll happen, so you just have to roll with them if you want to reap the mar-ket’s long-term benefits.
Guru Investing Principle 4: Diversify, but Don’t Own the Market
· Diversification is good—to a point. Maintain a focused portfolio that includes enough stocks to limit stock-specific risk, but don’t hold so many that you end up simply mir-roring the market’s returns.
· In a rigid fundamental-based investing system, portfolios as small as 10 stocks can significantly beat the market over the long haul.
Guru Investing Principle 5: Don’t Limit Yourself
· Studies show that “style-box” investing, or selecting stocks that represent a cross-section of the stock market by size and sector, can limit your gains by about 300 basis points per year.
· Using “strategy-based investing” allows you to pick the best values in the market at any given time, regardless of market cap or growth-value designations.
Guru Investing Principle 6: Stick to the Strategy—Not the Stocks
· If a stock no longer meets the fundamental criteria that led you to buy it, don’t feel obligated to hold on to it.
· You’re a long-term investor if you stick to a strategy for the long haul—not because you blindly hold on to individual stocks for long periods.
26
In addition to knowing when to buy a stock, knowing when to sell a stock is just as critical to long term success. If you hold a stock too long then you run the risk of either giving back most of your gains, or missing out on bigger gains in other stocks that have become more attractive according to your criteria. Here are some of the selling criteria I use in managing the Baton portfolio:
The Key Guru Selling Points
· Rebalance your portfolio at fixed intervals (i.e., every month, every quarter, or every year), selling stocks that no longer meet the fundamental criteria you used buy them in the first place. Replace them with new stocks that do meet your criteria.
· Sell stocks immediately if they are involved in accounting or earnings scandals, or if they become a major bankruptcy concern. In these cases, do not wait until your next rebalancing date to sell.
· Don’t be discouraged when your system calls for you to lock in losses on a stock; not even the best investors in the world are right all the time.
Put Guru investinG to Work for you
The three primary reasons Baton chose this methodology for its portfolios is that it works, it’s inexpensive, and it’s easy to implement.
o IT WORKS: In the first ten years of implementation (July 2003 – December 2013) our system more than tripled the performance of the S&P500 Index.IT’S INEX-PENSIVE: Baton doesn’t charge a fee based on the amount of money you have to invest, or an hourly rate based on their time. Instead, you only pay a monthly subscription fee that costs less than your phone bill.
o IT’S EASY: You only need to execute buy and sell orders one day each month, and we’ve made it even easier for you by setting up model portfolios at Motif and Folio who will execute all transactions for you once you give them the okay!
Find out if Baton is a good fit for you. Go to BatonInvesting.com and click the Get Start-ed link now!

27