punterprofits.com betting journalwelcome to the first edition of punters profits – the new and...
TRANSCRIPT

PunterProfits.Com
Betting Journal
Issue 1 June 2004
PunterProfits.com Journal Issue 1
- 1 - All Content Copyright www.PunterProfits.com
Index
1. Editorial. 2. Royal Ascot – A Statistical Look by Statsman. 3. A Detailed look at Chester draw bias (5 & 6 furlongs) 1996 to 2003 by David Renham. 4. Stable Tour by John Wainwright. 5. Value is the single most important thing in betting by Steve Jones. 6. 2 Year Old Sires by Gary Cooke. 7. Horses to note in the coming month by Eagle-Eyed. 8. Compiling Ratings by Paul Dyson. 9. Backing Places by the Officer. 10. Robert Winston – Jockey in Focus by David Renham. 11. Getting into the mind of a trainer by Peter Walker. 12. Biorhythms in Racing by Alex Rouse. 13. Betting Exchanges – It gets even better! by Neil Dawkins. 14. Wokingham Competition

PunterProfits.com Journal Issue 1
- 2 - All Content Copyright www.PunterProfits.com
Editorial Welcome to the first edition of Punters Profits – the new and innovative on-line betting journal. Horse racing is the focus of this first edition, and although that will continue to be the case over the coming months, it is my intention to cover any sport where we think we can provide profitable advice. The first objective of the journal is to give punters an interesting and varied set of articles. Many betting based publications have, in the past, offered only the odd article worth reading. However, it is hoped that each article in Punter Profits will hold the reader’s interest. In this first journal, many different facets of racing are discussed including the effect of the draw, trainer patterns, sires, the betting exchanges, biorhythms and compiling ratings. We have a great set of writers with a wide range of experiences in this field so if there are any topics or ideas you would like to be covered in future issues, please e-mail me on [email protected] and we will try to accommodate them. A further objective is to constantly maintain (and improve if necessary), the quality and the content of the journal. Hence, I am always on the lookout for new contributors to work alongside our present team of writers, and if you would like to submit an article or a series of articles, please contact me on the above address. The first issue as you all know is free, but from issue 2 onwards there will be a charge. However, unlike traditional offline betting magazines, Punter Profits will use its online nature to offer something different. Readers will of course learn from reading the articles, however each article will also have its own thread on the Punter Profits forum. Here you will be able to discuss their content with other Punter Profits readers and even the authors themselves. If there was a point you did not fully understand, the forums will act as back up support. Perhaps an article may inspire in you further ideas for your own betting, if so you can test them out on the message boards. Punter Profits is unique in offering this facility, one which I believe makes it stand out even further from other betting publications. The next journal will be out in time for the King George VI and Queen Elizabeth Diamond Stakes at Ascot, which is also just before Glorious Goodwood. The 3rd issue will be ready for the Ebor Meeting at York in August. In the next issue Gary Cooke continues his sire research; Alex Rouse expands on biorhythms; Neil Dawkins looks at a new Betfair “angle”; Paul Dyson moves on to the process of compiling ratings; Statsman will be looking forward to Glorious Goodwood; Simon Walton will once again give his top 10 speed horses for all codes; while I will be looking in detail at another draw biased course. In addition, there will further articles from Peter Walker, Steve Jones, The Officer and Eagled Eyed, plus some new writers to add more variety to an already varied topic base. I hope you enjoy this first issue. The first of many! David Renham
PunterProfits.com Journal Issue 1
- 3 - All Content Copyright www.PunterProfits.com
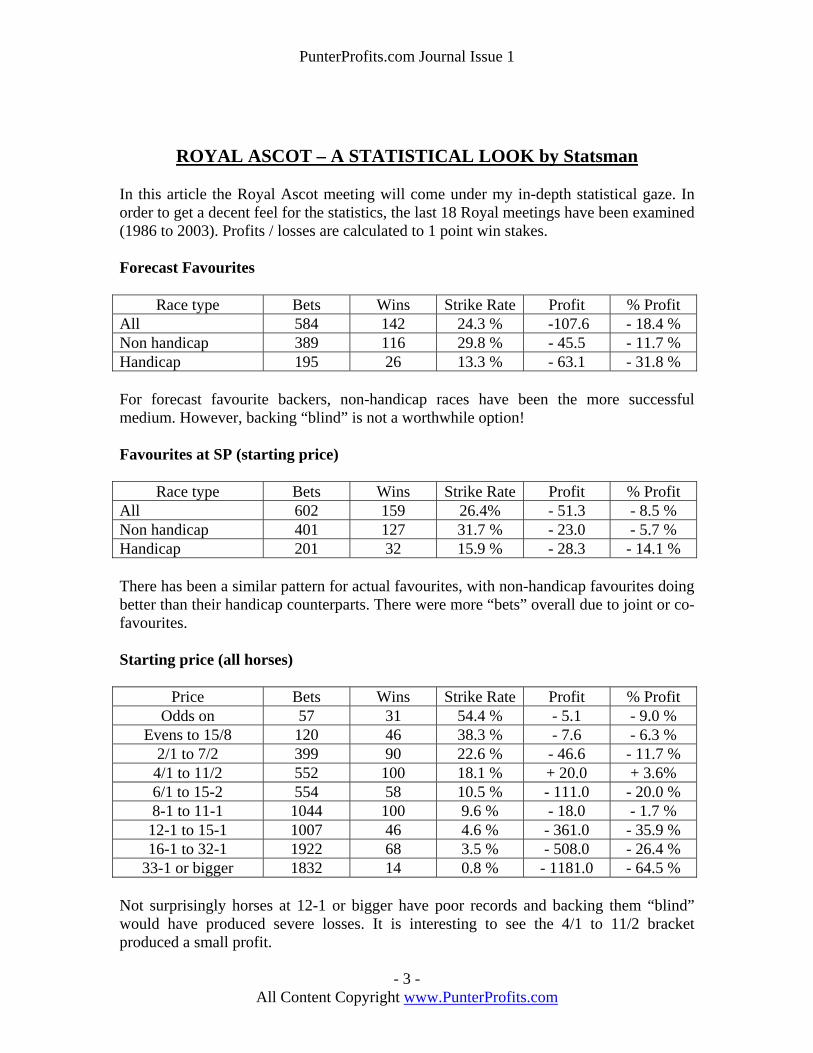
ROYAL ASCOT – A STATISTICAL LOOK by Statsman In this article the Royal Ascot meeting will come under my in-depth statistical gaze. In order to get a decent feel for the statistics, the last 18 Royal meetings have been examined (1986 to 2003). Profits / losses are calculated to 1 point win stakes. Forecast Favourites
Race type Bets Wins Strike Rate Profit % Profit All 584 142 24.3 % -107.6 - 18.4 % Non handicap 389 116 29.8 % - 45.5 - 11.7 % Handicap 195 26 13.3 % - 63.1 - 31.8 % For forecast favourite backers, non-handicap races have been the more successful medium. However, backing “blind” is not a worthwhile option! Favourites at SP (starting price)
Race type Bets Wins Strike Rate Profit % Profit All 602 159 26.4% - 51.3 - 8.5 % Non handicap 401 127 31.7 % - 23.0 - 5.7 % Handicap 201 32 15.9 % - 28.3 - 14.1 % There has been a similar pattern for actual favourites, with non-handicap favourites doing better than their handicap counterparts. There were more “bets” overall due to joint or co-favourites. Starting price (all horses)
Price Bets Wins Strike Rate Profit % Profit Odds on 57 31 54.4 % - 5.1 - 9.0 %
Evens to 15/8 120 46 38.3 % - 7.6 - 6.3 % 2/1 to 7/2 399 90 22.6 % - 46.6 - 11.7 % 4/1 to 11/2 552 100 18.1 % + 20.0 + 3.6% 6/1 to 15-2 554 58 10.5 % - 111.0 - 20.0 % 8-1 to 11-1 1044 100 9.6 % - 18.0 - 1.7 % 12-1 to 15-1 1007 46 4.6 % - 361.0 - 35.9 % 16-1 to 32-1 1922 68 3.5 % - 508.0 - 26.4 %
33-1 or bigger 1832 14 0.8 % - 1181.0 - 64.5 % Not surprisingly horses at 12-1 or bigger have poor records and backing them “blind” would have produced severe losses. It is interesting to see the 4/1 to 11/2 bracket produced a small profit.
PunterProfits.com Journal Issue 1
- 4 - All Content Copyright www.PunterProfits.com
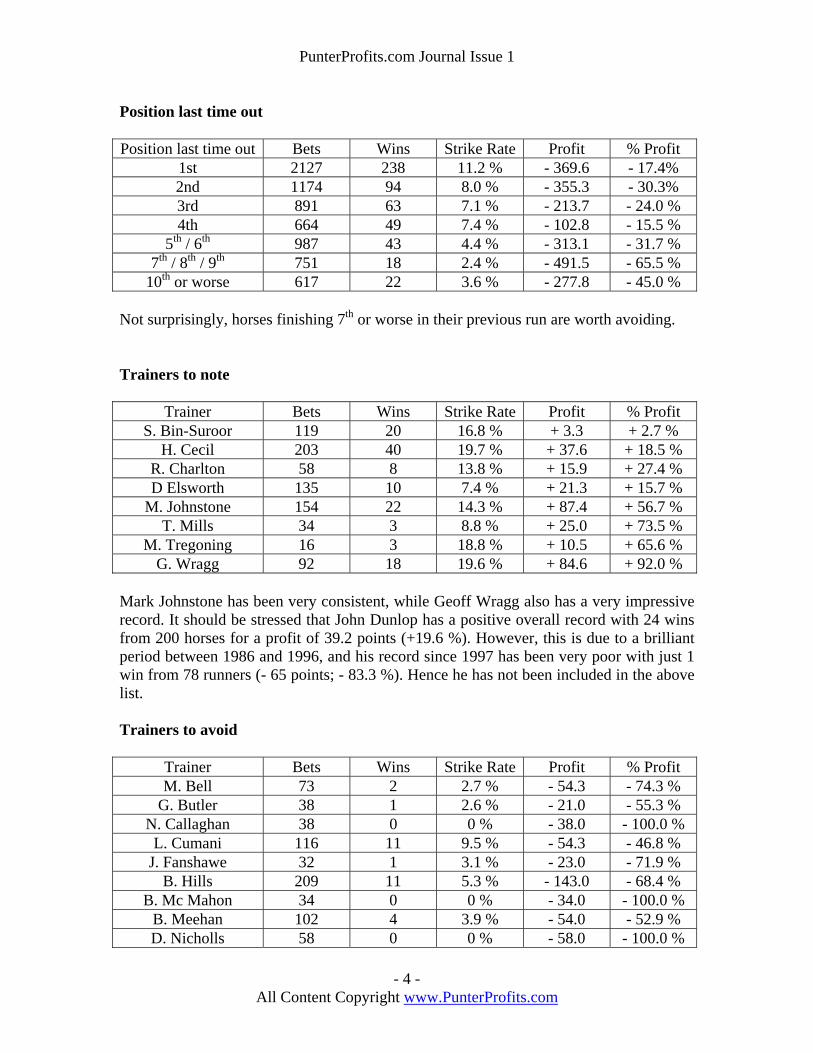
Position last time out Position last time out Bets Wins Strike Rate Profit % Profit
1st 2127 238 11.2 % - 369.6 - 17.4% 2nd 1174 94 8.0 % - 355.3 - 30.3% 3rd 891 63 7.1 % - 213.7 - 24.0 % 4th 664 49 7.4 % - 102.8 - 15.5 %
5th / 6th 987 43 4.4 % - 313.1 - 31.7 % 7th / 8th / 9th 751 18 2.4 % - 491.5 - 65.5 %
10th or worse 617 22 3.6 % - 277.8 - 45.0 % Not surprisingly, horses finishing 7th or worse in their previous run are worth avoiding. Trainers to note
Trainer Bets Wins Strike Rate Profit % Profit S. Bin-Suroor 119 20 16.8 % + 3.3 + 2.7 %
H. Cecil 203 40 19.7 % + 37.6 + 18.5 % R. Charlton 58 8 13.8 % + 15.9 + 27.4 % D Elsworth 135 10 7.4 % + 21.3 + 15.7 %
M. Johnstone 154 22 14.3 % + 87.4 + 56.7 % T. Mills 34 3 8.8 % + 25.0 + 73.5 %
M. Tregoning 16 3 18.8 % + 10.5 + 65.6 % G. Wragg 92 18 19.6 % + 84.6 + 92.0 %
Mark Johnstone has been very consistent, while Geoff Wragg also has a very impressive record. It should be stressed that John Dunlop has a positive overall record with 24 wins from 200 horses for a profit of 39.2 points (+19.6 %). However, this is due to a brilliant period between 1986 and 1996, and his record since 1997 has been very poor with just 1 win from 78 runners (- 65 points; - 83.3 %). Hence he has not been included in the above list. Trainers to avoid
Trainer Bets Wins Strike Rate Profit % Profit M. Bell 73 2 2.7 % - 54.3 - 74.3 %
G. Butler 38 1 2.6 % - 21.0 - 55.3 % N. Callaghan 38 0 0 % - 38.0 - 100.0 % L. Cumani 116 11 9.5 % - 54.3 - 46.8 %
J. Fanshawe 32 1 3.1 % - 23.0 - 71.9 % B. Hills 209 11 5.3 % - 143.0 - 68.4 %
B. Mc Mahon 34 0 0 % - 34.0 - 100.0 % B. Meehan 102 4 3.9 % - 54.0 - 52.9 % D. Nicholls 58 0 0 % - 58.0 - 100.0 %
PunterProfits.com Journal Issue 1
- 5 - All Content Copyright www.PunterProfits.com
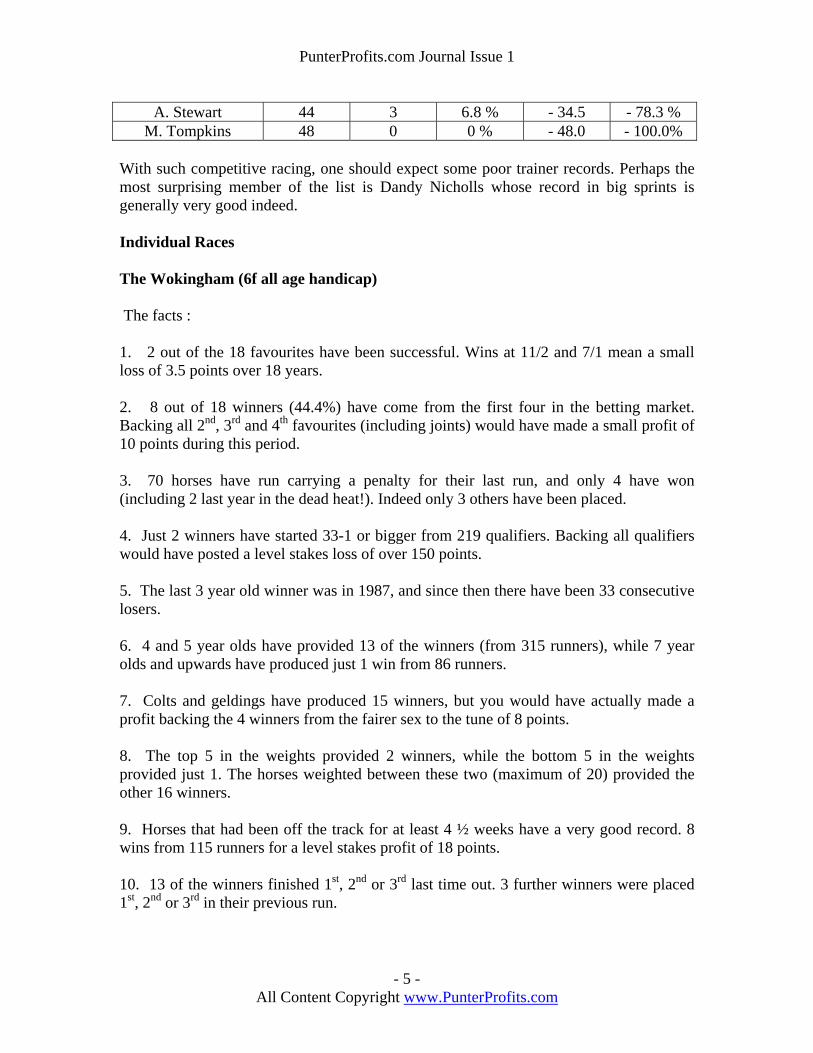
A. Stewart 44 3 6.8 % - 34.5 - 78.3 % M. Tompkins 48 0 0 % - 48.0 - 100.0%
With such competitive racing, one should expect some poor trainer records. Perhaps the most surprising member of the list is Dandy Nicholls whose record in big sprints is generally very good indeed. Individual Races The Wokingham (6f all age handicap) The facts : 1. 2 out of the 18 favourites have been successful. Wins at 11/2 and 7/1 mean a small loss of 3.5 points over 18 years. 2. 8 out of 18 winners (44.4%) have come from the first four in the betting market. Backing all 2nd, 3rd and 4th favourites (including joints) would have made a small profit of 10 points during this period. 3. 70 horses have run carrying a penalty for their last run, and only 4 have won (including 2 last year in the dead heat!). Indeed only 3 others have been placed. 4. Just 2 winners have started 33-1 or bigger from 219 qualifiers. Backing all qualifiers would have posted a level stakes loss of over 150 points. 5. The last 3 year old winner was in 1987, and since then there have been 33 consecutive losers. 6. 4 and 5 year olds have provided 13 of the winners (from 315 runners), while 7 year olds and upwards have produced just 1 win from 86 runners. 7. Colts and geldings have produced 15 winners, but you would have actually made a profit backing the 4 winners from the fairer sex to the tune of 8 points. 8. The top 5 in the weights provided 2 winners, while the bottom 5 in the weights provided just 1. The horses weighted between these two (maximum of 20) provided the other 16 winners. 9. Horses that had been off the track for at least 4 ½ weeks have a very good record. 8 wins from 115 runners for a level stakes profit of 18 points. 10. 13 of the winners finished 1st, 2nd or 3rd last time out. 3 further winners were placed 1st, 2nd or 3rd in their previous run.

PunterProfits.com Journal Issue 1
- 6 - All Content Copyright www.PunterProfits.com
Summary : 4 and 5 year olds have good records, as do horses that have been off the track for at least 4 ½ weeks, and horses that finished 1st, 2nd or 3rd last time out. Conversely, it is worth avoiding the top 5 and bottom 5 in the weights, 7 year olds and older, horses carrying a penalty and horses priced 33-1 or bigger. The Royal Hunt Cup (1 mile all age handicap) This race in its current form was first run in 1991 so we have 13 years to look back on. The facts : 1. Only 1 out of the 14 favourites has been successful (there were joint favourites in 1992). Backing all favourites would have incurred a loss of 5 points. 2. 38 horses have run carrying a penalty for their last run, and just 1 has won (Macadamia in 2003). 3. No horse has won priced 33-1 or bigger. 171 have tried and failed (11 have been placed). 4. 9 of the 13 winners finished 1st, 2nd or 3rd last time out. 5. 12 of the 13 winners were aged 4 or 5. Horses aged 6 and above managed 1 win from 85 runners. 6. Horses that had been off the track for at least 4 ½ weeks have a very good record. 8 wins from 121 runners for a level stakes profit of 17.5 points. Horses returning to the track within 15 days have a poor record with just 2 wins from 124 runners. 7. Horses carrying 9 stone or more have a very poor record with just 1 winner from 105 runners. 8. Horses carrying between 8 stone 9 and 8 stone 13 have a good record with 7 wins from 78 runners. Backing all qualifiers would have yielded a 34.5 point profit (+ 44.2 % profit on turnover). . 9. The 40 horses that have worn blinkers or visors in the race have all lost (2 were placed). 10. Horses dropping down in trip (last run 8 ½ furlongs or more) have a poor record with just 1 win from 90 runners. Summary : It is worth concentrating on 4 and 5 year olds as they have provided all bar one of the winners, while horses that finished 1st, 2nd or 3rd last time out also have a
PunterProfits.com Journal Issue 1
- 7 - All Content Copyright www.PunterProfits.com
good record. On the negative side, favourites have a poor record, as do horses carrying 9 stone or more, and those dropping down in distance. Ascot Gold Cup (2 ½ miles – Group 1) The facts : 1. 4 out of the 18 favourites have been successful showing a level stakes loss of over 9 points (- 50%). 2. 11 out of 18 races (61%) were won by horses from the top 3 in betting. 3. There have been 4 wins for horses priced 16-1 or bigger. 4. 9 of the 18 winners had won their previous race. 5 other winners had been placed in their previous race. 5. 6 year olds have an excellent record with 6 wins from 25 runners for a level stakes profit of nearly 46 points (+ 183 % profit on turnover). 6. 10 of the 18 winners had raced in a Group 3 event the run before. 7. 3 of the winners won on their seasonal debut. 8. 7 of the winners were based in Newmarket. Backing all Newmarket charges over the years would have incurred a small loss of just 2 points to level stakes. 9. Previous course winners have a good record in this event with 9 winners from 53 runners. Backing all selections would have yielded a 21.6 point profit (+ 40.8 % profit on turnover). 10. Horses that are lightly raced have a good record in this race. Horses that had previously had 8 career starts or less accounted for 8 of the winners. Backing all qualifiers would have yielded a small 10.5 point profit. Summary : 50% of the winners won their last race, while course winners boast the same record. In addition, 6 year olds have done especially well with a strike rate of 24%.
PunterProfits.com Journal Issue 1
- 8 - All Content Copyright www.PunterProfits.com
The King’s Stand (5 furlongs – Group 2) 1. There have been 4 winning favourites from 21. Backing all favourites would have produced a loss of over 9 points to level stakes. 2. 7 of the 18 winners were priced 16-1 or more (including 4 out of the past 5 years). 3. 8 of the 18 winners had won their previous race. Backing all last time winners would have yielded a 10 point profit. 4. Horses dropping down in distance have a very poor record with just 2 wins from 79 qualifiers. 5. 7 of the 18 winners had yet to win on the respective going. 6. 9 of the winners won on their seasonal debut. Backing the 61 qualifiers would have yielded a massive 68 point profit (111.5 % profit on turnover). 7. 3 and 4 year olds have good records with 6 wins a-piece. 8. 26 horses have stepped up from handicap company in their previous race with just 1 winning. 9. 28 horses have come into the race having not reached the first three in any of their last three runs and none have won. Having said that, 3 horses have won having not reached the first three in any of their two previous runs. 10. Jockeys who have not recently ridden a winner are worth avoiding. Those having not had a win in their last 12 rides have recorded just 3 wins from 79 runners (loss of 56 points). Summary : 3 and 4 year olds have good records, and last time out winners are also worth noting. Horses to avoid include those dropping down in distance and those stepping up from handicap company.
PunterProfits.com Journal Issue 1
- 9 - All Content Copyright www.PunterProfits.com
A Detailed look at Chester draw bias (5 & 6 furlongs) 1996 to 2003
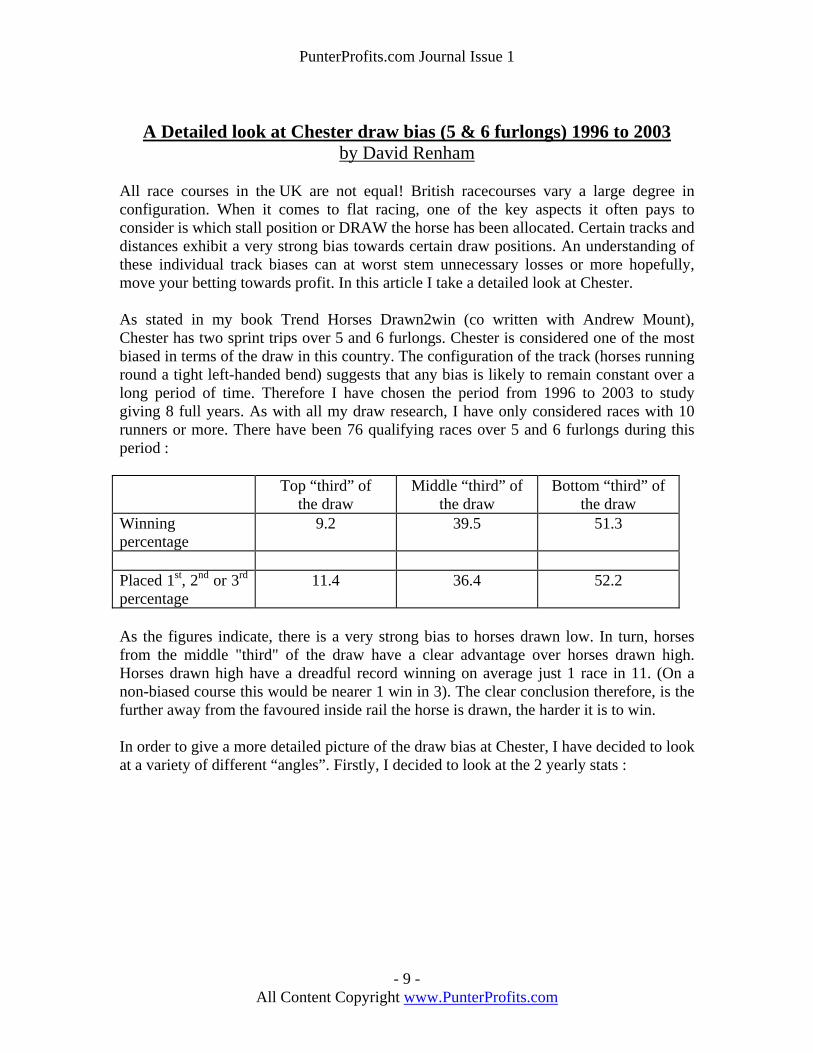
by David Renham All race courses in the UK are not equal! British racecourses vary a large degree in configuration. When it comes to flat racing, one of the key aspects it often pays to consider is which stall position or DRAW the horse has been allocated. Certain tracks and distances exhibit a very strong bias towards certain draw positions. An understanding of these individual track biases can at worst stem unnecessary losses or more hopefully, move your betting towards profit. In this article I take a detailed look at Chester. As stated in my book Trend Horses Drawn2win (co written with Andrew Mount), Chester has two sprint trips over 5 and 6 furlongs. Chester is considered one of the most biased in terms of the draw in this country. The configuration of the track (horses running round a tight left-handed bend) suggests that any bias is likely to remain constant over a long period of time. Therefore I have chosen the period from 1996 to 2003 to study giving 8 full years. As with all my draw research, I have only considered races with 10 runners or more. There have been 76 qualifying races over 5 and 6 furlongs during this period : Top “third” of
the draw Middle “third” of
the draw Bottom “third” of
the draw Winning percentage
9.2 39.5 51.3
Placed 1st, 2nd or 3rd percentage
11.4 36.4 52.2
As the figures indicate, there is a very strong bias to horses drawn low. In turn, horses from the middle "third" of the draw have a clear advantage over horses drawn high. Horses drawn high have a dreadful record winning on average just 1 race in 11. (On a non-biased course this would be nearer 1 win in 3). The clear conclusion therefore, is the further away from the favoured inside rail the horse is drawn, the harder it is to win. In order to give a more detailed picture of the draw bias at Chester, I have decided to look at a variety of different “angles”. Firstly, I decided to look at the 2 yearly stats :
PunterProfits.com Journal Issue 1
- 10 - All Content Copyright www.PunterProfits.com
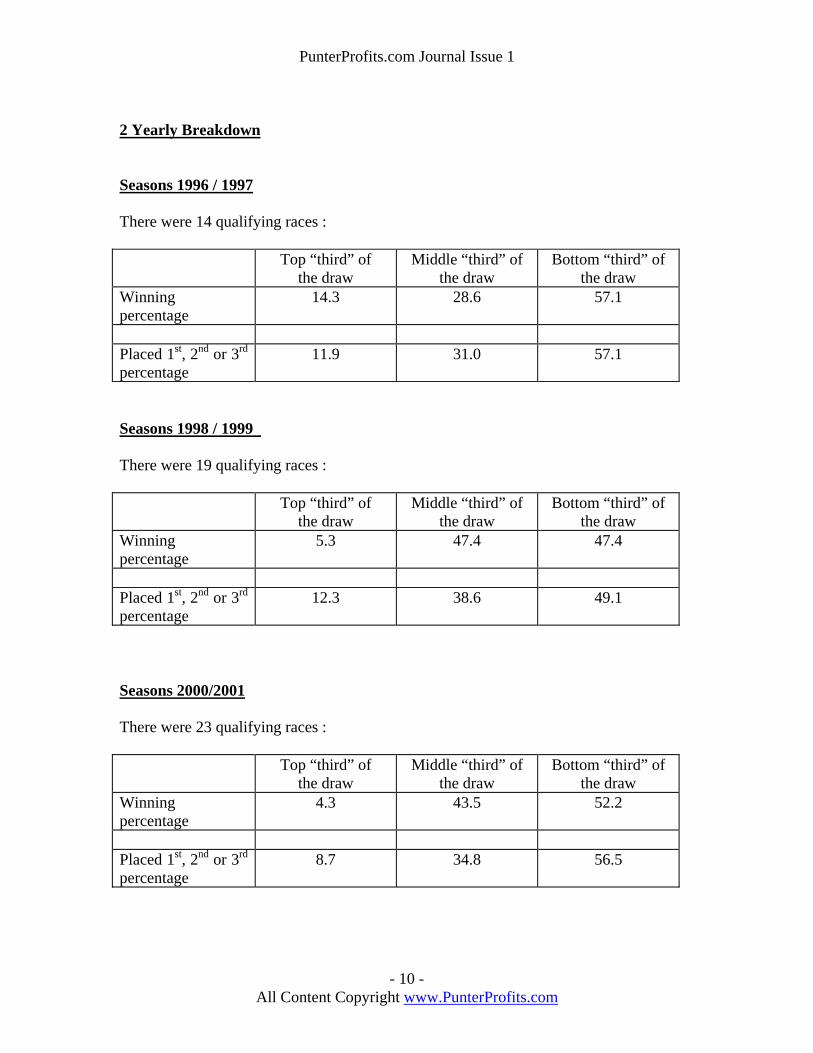
2 Yearly Breakdown Seasons 1996 / 1997 There were 14 qualifying races : Top “third” of
the draw Middle “third” of
the draw Bottom “third” of
the draw Winning percentage
14.3 28.6 57.1
Placed 1st, 2nd or 3rd percentage
11.9 31.0 57.1
Seasons 1998 / 1999 There were 19 qualifying races : Top “third” of
the draw Middle “third” of
the draw Bottom “third” of
the draw Winning percentage
5.3 47.4 47.4
Placed 1st, 2nd or 3rd percentage
12.3 38.6 49.1
Seasons 2000/2001 There were 23 qualifying races : Top “third” of
the draw Middle “third” of
the draw Bottom “third” of
the draw Winning percentage
4.3 43.5 52.2
Placed 1st, 2nd or 3rd percentage
8.7 34.8 56.5

PunterProfits.com Journal Issue 1
- 11 - All Content Copyright www.PunterProfits.com
Seasons 2002/2003 There were 20 qualifying races : Top “third” of
the draw Middle “third” of
the draw Bottom “third” of
the draw Winning percentage
15 35 50
Placed 1st, 2nd or 3rd percentage
13.3 40 46.7
As you can see, the bias is fairly consistent throughout with the favoured “third” having winning percentages that vary from 47.4 to 57.1%. The next “angle” I investigated was “the effect of field size” (number of runners). The effect of field size The maximum field size over 5 and 6 furlongs at Chester is 16. I have split the races into the following field size groups. Firstly, races with 10 to 12 runners, and secondly races with 13 to 16 runners. Races with 10 to 12 runners There were 43 qualifying races over the 8 years studied. Here are the statistics : Top “third” of
the draw Middle “third” of
the draw Bottom “third” of
the draw Winning percentage
14.0 37.2 48.8
Placed 1st, 2nd or 3rd percentage
13.2 36.4 50.4

PunterProfits.com Journal Issue 1
- 12 - All Content Copyright www.PunterProfits.com
Races with 13 to 16 runners There were 33 qualifying races over the 8 years studied. Here are the statistics : Top “third” of
the draw Middle “third” of
the draw Bottom “third” of
the draw Winning percentage
3.0 42.4 54.5
Placed 1st, 2nd or 3rd percentage
9.1 36.4 54.5
Field size does seem to make a difference at Chester with the bias strengthening when the number of runners increases. In races of 13 to 16 runners, horses drawn in the bottom “third” of the draw are 18 times more likely to win than those horses drawn in the highest “third”!!! With smaller fields (10 to 12) this advantage to the bottom “third” reduces to 3 ½ times. The reason higher drawn horses struggle in bigger fields is no surprise – the wider the draw of the horse, the further away it is from the favoured inside rail. The effect of the going Good to firm or firmer There have been 34 races on good to firm ground or firmer over the past 8 years. Here are the percentages : Top “third” of
the draw Middle “third” of
the draw Bottom “third” of
the draw Winning percentage
14.7 38.2 47.1
Placed 1st, 2nd or 3rd percentage
12.7 36.3 51
PunterProfits.com Journal Issue 1
- 13 - All Content Copyright www.PunterProfits.com
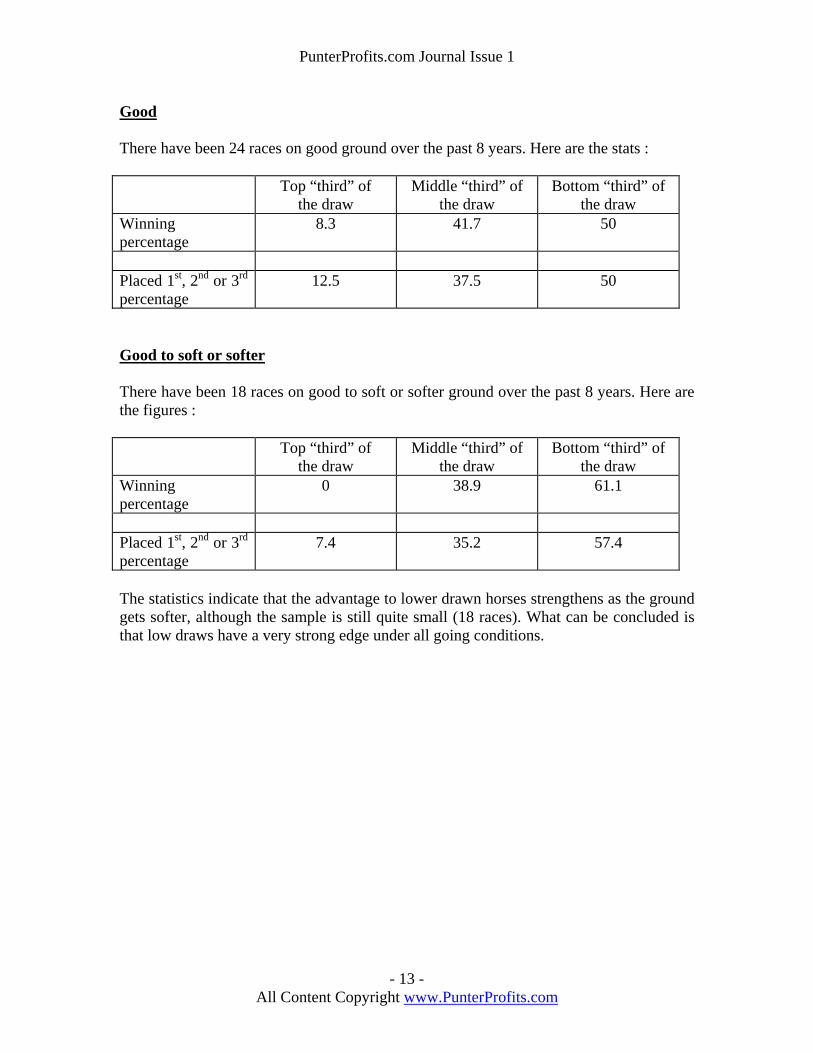
Good There have been 24 races on good ground over the past 8 years. Here are the stats : Top “third” of
the draw Middle “third” of
the draw Bottom “third” of
the draw Winning percentage
8.3 41.7 50
Placed 1st, 2nd or 3rd percentage
12.5 37.5 50
Good to soft or softer There have been 18 races on good to soft or softer ground over the past 8 years. Here are the figures : Top “third” of
the draw Middle “third” of
the draw Bottom “third” of
the draw Winning percentage
0 38.9 61.1
Placed 1st, 2nd or 3rd percentage
7.4 35.2 57.4
The statistics indicate that the advantage to lower drawn horses strengthens as the ground gets softer, although the sample is still quite small (18 races). What can be concluded is that low draws have a very strong edge under all going conditions.
PunterProfits.com Journal Issue 1
- 14 - All Content Copyright www.PunterProfits.com
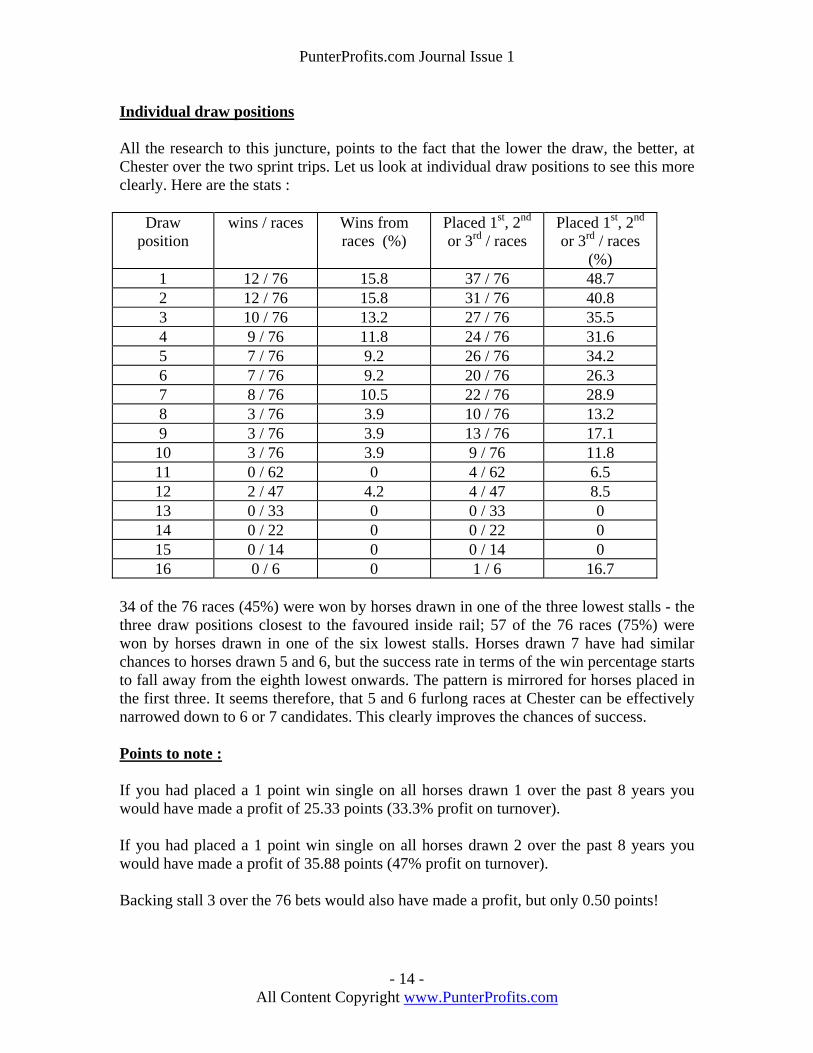
Individual draw positions All the research to this juncture, points to the fact that the lower the draw, the better, at Chester over the two sprint trips. Let us look at individual draw positions to see this more clearly. Here are the stats :
Draw position
wins / races Wins from races (%)
Placed 1st, 2nd or 3rd / races
Placed 1st, 2nd or 3rd / races
(%) 1 12 / 76 15.8 37 / 76 48.7 2 12 / 76 15.8 31 / 76 40.8 3 10 / 76 13.2 27 / 76 35.5 4 9 / 76 11.8 24 / 76 31.6 5 7 / 76 9.2 26 / 76 34.2 6 7 / 76 9.2 20 / 76 26.3 7 8 / 76 10.5 22 / 76 28.9 8 3 / 76 3.9 10 / 76 13.2 9 3 / 76 3.9 13 / 76 17.1 10 3 / 76 3.9 9 / 76 11.8 11 0 / 62 0 4 / 62 6.5 12 2 / 47 4.2 4 / 47 8.5 13 0 / 33 0 0 / 33 0 14 0 / 22 0 0 / 22 0 15 0 / 14 0 0 / 14 0 16 0 / 6 0 1 / 6 16.7
34 of the 76 races (45%) were won by horses drawn in one of the three lowest stalls - the three draw positions closest to the favoured inside rail; 57 of the 76 races (75%) were won by horses drawn in one of the six lowest stalls. Horses drawn 7 have had similar chances to horses drawn 5 and 6, but the success rate in terms of the win percentage starts to fall away from the eighth lowest onwards. The pattern is mirrored for horses placed in the first three. It seems therefore, that 5 and 6 furlong races at Chester can be effectively narrowed down to 6 or 7 candidates. This clearly improves the chances of success. Points to note : If you had placed a 1 point win single on all horses drawn 1 over the past 8 years you would have made a profit of 25.33 points (33.3% profit on turnover). If you had placed a 1 point win single on all horses drawn 2 over the past 8 years you would have made a profit of 35.88 points (47% profit on turnover). Backing stall 3 over the 76 bets would also have made a profit, but only 0.50 points!
PunterProfits.com Journal Issue 1
- 15 - All Content Copyright www.PunterProfits.com
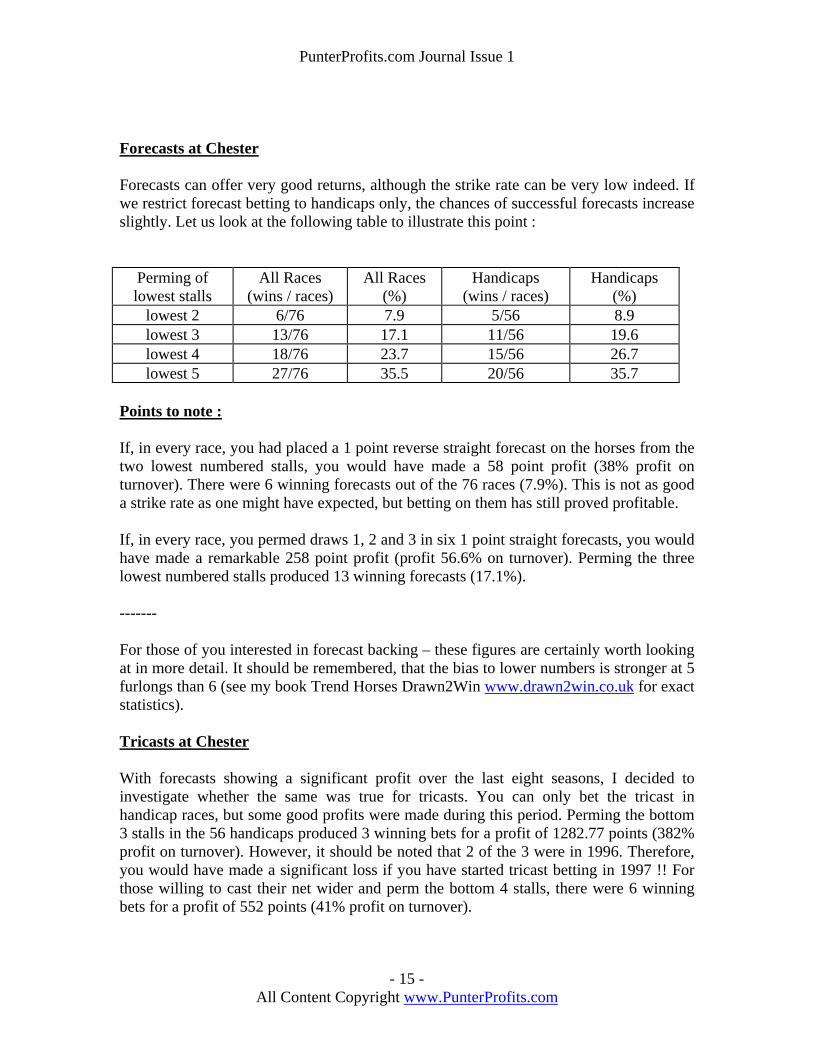
Forecasts at Chester Forecasts can offer very good returns, although the strike rate can be very low indeed. If we restrict forecast betting to handicaps only, the chances of successful forecasts increase slightly. Let us look at the following table to illustrate this point :
Perming of lowest stalls
All Races (wins / races)
All Races (%)
Handicaps (wins / races)
Handicaps (%)
lowest 2 6/76 7.9 5/56 8.9 lowest 3 13/76 17.1 11/56 19.6 lowest 4 18/76 23.7 15/56 26.7 lowest 5 27/76 35.5 20/56 35.7
Points to note : If, in every race, you had placed a 1 point reverse straight forecast on the horses from the two lowest numbered stalls, you would have made a 58 point profit (38% profit on turnover). There were 6 winning forecasts out of the 76 races (7.9%). This is not as good a strike rate as one might have expected, but betting on them has still proved profitable. If, in every race, you permed draws 1, 2 and 3 in six 1 point straight forecasts, you would have made a remarkable 258 point profit (profit 56.6% on turnover). Perming the three lowest numbered stalls produced 13 winning forecasts (17.1%). ------- For those of you interested in forecast backing – these figures are certainly worth looking at in more detail. It should be remembered, that the bias to lower numbers is stronger at 5 furlongs than 6 (see my book Trend Horses Drawn2Win www.drawn2win.co.uk for exact statistics). Tricasts at Chester With forecasts showing a significant profit over the last eight seasons, I decided to investigate whether the same was true for tricasts. You can only bet the tricast in handicap races, but some good profits were made during this period. Perming the bottom 3 stalls in the 56 handicaps produced 3 winning bets for a profit of 1282.77 points (382% profit on turnover). However, it should be noted that 2 of the 3 were in 1996. Therefore, you would have made a significant loss if you have started tricast betting in 1997 !! For those willing to cast their net wider and perm the bottom 4 stalls, there were 6 winning bets for a profit of 552 points (41% profit on turnover).

PunterProfits.com Journal Issue 1
- 16 - All Content Copyright www.PunterProfits.com
Tricast betting is only worth considering to small stakes, as patience and a large bank roll is required. CONCLUSIONS TO BE “DRAWN” There is probably nothing “earth-shattering” amongst these findings, although it just re-emphasises the importance of the draw at Chester over the sprint trips. With nearly 45% of the races being won by one of the bottom three stalls, it is clear that these horses always require the closest scrutiny. In addition to this, you can confidently discount horses drawn 8 or wider. To summarize, give preference to the lowest stall, over the second lowest, over the third lowest, and so on. If only all courses were as straight-forward as Chester. Happy punting! Read Dave’s Draw Bias views every Saturday for free – go to www.drawn2win.co.uk to find out more.
PunterProfits.com Journal Issue 1
- 17 - All Content Copyright www.PunterProfits.com
STABLE TOUR of John Wainwright’s Yard John Wainwright is one of the most genuine trainers in the business. He trains in Kennythorpe, North Yorkshire. John has kindly talked about 10 of his best horses in this piece. 1. CATCH THE CAT Won a handicap at Musselburgh off a mark of 72. An improving five year old, John expects him to be able to win off a mark in the 80s. Mainly a summer horse, he has taken a while to come to himself. He is ideally suited by good / good to soft ground over 5 furlongs. His main Targets are the Portland and the Doncaster handicap he won last year. 2. LE MERIDIAN She is in foal and will be back in training within the next two weeks. The aim is to get four or five runs into her before she retires to the paddocks. John is confident she can go out with a win and she is the ideal type for a mare’s only handicap at Beverley and will be a good thing if she gets a high draw. 3. TOMMY SMITH Has taken a bit of time to come back to form after an operation to remove chips in his knees this winter. The combination of fast ground and an uphill track are ideal. John states the horse is in much better form now and his early season form can be ignored. Won well at Pontefract the other day. 4. ALPINE HIDEAWAY Has come on for his run last week and is being specially trained for a claiming race at Beverley in August. Likes good ground, but best watched until that August race. Will also run over hurdles this winter. 5. CUT RIDGE. Showing more at home over the last 10 days and is well capable of winning a few low grade races this year. Had no chance last week at Beverley from the 2 draw.
PunterProfits.com Journal Issue 1
- 18 - All Content Copyright www.PunterProfits.com
6.BARON RHODES Been running well without winning this year. The softer the better for him and has not had his ideal conditions yet. He would not want the ground to firm up, and this is a horse with more to come. * Won at 8-1 on Saturday 10th June (after this interview took place). 7. MIS CHICAF Now rated 90 after her brilliant win at York in May. She won by seven lengths in a very good time beating previous winners easily. The track was ideal for her and she was also carrying top weight. A very good prospect. 8. BEYOND THE CLOUDS Suspended for 40 days over an alleged non-trying incident, he will not be able to be entered for races until June 13th. Sure to come back from his enforced holiday fresh!! The Gosport Park Cup at the end of June is his main target and he still has races in him. 9. LORD WISHING WELL Third on the 1st June at Redcar (at 33-1), this half brother to Prince Aaron is improving with every run and John thinks he will improve with age in the same mould as Prince Aaron. Good ground on the turf is ideal and he will be worth a second look if running on the all weather in the winter. 10. FAIRGAME MAN. Very well handicapped off 49, he showed that he was still capable of winning when he ran second at Beverley recently from a poor draw. A stiff five on good ground is his ideal and will be worth a punt when returned to Beverley if drawing one of the top six stalls.
PunterProfits.com Journal Issue 1
- 19 - All Content Copyright www.PunterProfits.com
Value is the single most important thing in betting by Steve Jones
A good strike rate is no use at all if the bets are not made at value odds.
That is why I decided to write this short piece.
The scenario I want you to imagine is of three people walking into a room where different bets are on offer.
The first person sees a table where you can bet on the spin of a coin. The odds on offer are 10/11 for a correct choice.
He feels lucky and bets on heads, which comes up. So he has another bet, and this also wins. "I'm feeling lucky", he says, "I'm going to stay at this table all night".
The second person sees a table where you can bet on the correct number thrown with a dice. The odds on offer are 11/2.
He has a bet on '3', which loses, then on '5', which loses. But he's not deterred; "I'm staying on this table", he says, "see you later".
The third person sees a table where you can bet on predicting a playing card randomly chosen from a pack. The odds on offer are 66/1.
He likes the prospect of a big win, so he has a go. In fact he has 10 goes, and none are correct. Luckily, he has brought plenty of cash with him, so he says "I'm staying here for the night".
The three agree to meet up again in 8 hours time, when they will compare how each has done.
Eight hours passed, and it was time for the three to go home.
The coin man was not happy: "I seemed to be winning regularly", he said, "I didn't have any long losing runs, but I'm out of pocket!"
In fact he'd had 1,000 bets, and 500 of them had been correct. He'd been betting at £20 a time, as he knew he wouldn't have long losing runs. So over the night he'd staked £20,000, and from his 500 winners paying £38.18 a time, he'd received a total of £19,090. He had lost £910 when he seemed to be doing so well. People had been remarking at how many winners he was having, but that didn't matter to him now. He certainly wouldn't play that game again.
PunterProfits.com Journal Issue 1
- 20 - All Content Copyright www.PunterProfits.com
The second arrived, with a smile on his face; "I started slowly", he said, "and my strike rate was not good all night - I had many losing runs well into double figures. I didn't feel as if I was winning, but now that I've counted up I realise that I've done well."
In fact, he too had placed 1,000 bets over the night at £20 each. He had picked 166 winners and 834 losers. At his quoted odds of 11/2, each winner had paid him £130 - a total return of £21,580.
He had won £1,580 on the night and was happy.
The third returned laughing; "I can't believe it", he said, "I chose those cards terribly - I had massive losing runs which I thought would never end. In fact I had 1,000 bets at £20 each and only won 19 of them - good job my bank was big enough for the evening!" But at 66/1, the 19 winners had returned a total of £25,460, making him £5,460 - enough for the cruise he'd been planning.
Simple enough, and we can see why the coin man was attracted by the prospect of regular winners - it made him feel like he was doing well. The dice man had a strike rate of 16.67%, which was more than enough, given that he was offered the value odds of 11/2 each time. The odds were only quoted half a point too high, but that was enough for him and he took advantage. The card man was fortunate to have a big bank behind him - his losing runs were massive, only 19 winners from 1,000 at a strike rate of 1.9%. But the 66/1 he was given was far too high, and he made a lot of money.
If these people were to return every night for a year, betting on the same games and with the same stakes, the coin man would lose £332,150, the dice man would win £576,700 and the card man would win £1,992,900.
They were all winning as often as they were entitled to do - nobody was luckier or unluckier than the others. It all came down to the value their bets offered.
In that example, the value was easy to see. Mathematically, it could be determined exactly. But how do we know what value is in horse racing? How do we know we won't end up like the coin man?
The answer is that we need to determine, first of all, what the actual odds are of our horse winning. We can't do this exactly, of course, but we can get fairly close.
Say for example the race we are studying has 10 runners, and we have decided that 4 of them have no chance whatsoever. We can confidently cross those 4 through, but we must be absolutely sure they can't win. That leaves 6 runners, and we may decide that 3 of those can't be dismissed completely even though we don't think they can win. Maybe they have half a chance. Fine, that's 3 runners with half a chance each, and the other 3 are the serious contenders (of which one is obviously our selection).

PunterProfits.com Journal Issue 1
- 21 - All Content Copyright www.PunterProfits.com
So our selection has 1 chance in 4.5 (3 serious plus 3 half chances). Its actual odds, as far as we can see are 7/2.
If we can get better than 7/2 for our selection we bet. The bigger the price above 7/2, the more we stake. It makes sense - if the dice man went back the following night he would stake much higher at that price. If our horse, however, is quoted at less than 7/2 we cannot bet - not ever.
It may well win, but if we continually take chances like that we will come unstuck eventually. If the odds are 3/1 we have to leave it alone and come back another day.
Again, that's a simple example, and I'm sure most punters think along those lines. To get more of an exact figure we need to break our fractions down further - down to percentage chances.
If we say that the total chances of all the runners in a race are 100%, we need to then determine how much of that 100% is made up of our horse's chance. In the above example the 100% was split between 6 runners that had either a chance or half a chance. There were a total of 4.5 chances, each one 22.22% of the overall 100%.
A 22.22% chance is equal to 7/2, so if we are right in our judgement (and we must stick to our judgement, as that is the whole point of betting), anything better than 7/2 offers value.
A friend of mine has the same approach, although he tackles it slightly differently. He allocates 100 points to a race (each point is a 1% chance). From those 100 points, he allocates to each horse a number, which he thinks represents it's chance of winning. The important thing here is that all the points must come back to 100 when added at the end.
He may analyse a race like this: His selection 27pts, horse 'B' 20pts, horses 'C', 'D', 'E', and 'F' 12pts each, and horse 'G' 5pts.
He has given his selection a 27% chance, which equals just over 11/4. So if my friend can get 11/4, or preferably 3/1 for his bet, he will be on. If not, he won't.
To convert the points out of 100 you have awarded to each horse into odds, do the following:
Say you gave 28pts : divide 100 by 28 = 3.57, then deduct 1 = 2.57.
Those are the odds to one - 2.57/1. Given that 2.5/1 is the same as 5/2, you would need better than 5/2 for a horse to which you had awarded 28pts.
Please make sure you don't totally discount a horse and give it 0pts unless you are sure that it can't win. Make sure all your points total 100 exactly. You will have to change them many times before they do - and don't bother if the points awarded are strange

PunterProfits.com Journal Issue 1
- 22 - All Content Copyright www.PunterProfits.com
numbers, like 27 or 41. It doesn't matter as long as you work out the true odds correctly afterwards.
You will suddenly find that you are spending less time trying to pick winners, and more time selecting horses that are likely to run to the best of their abilities at prices which are bigger than they really should be.
Value - the single most important thing, no matter what you bet on. More from Steve can be found at his website http://www.cdsystems.uk.com.
PunterProfits.com Journal Issue 1
- 23 - All Content Copyright www.PunterProfits.com
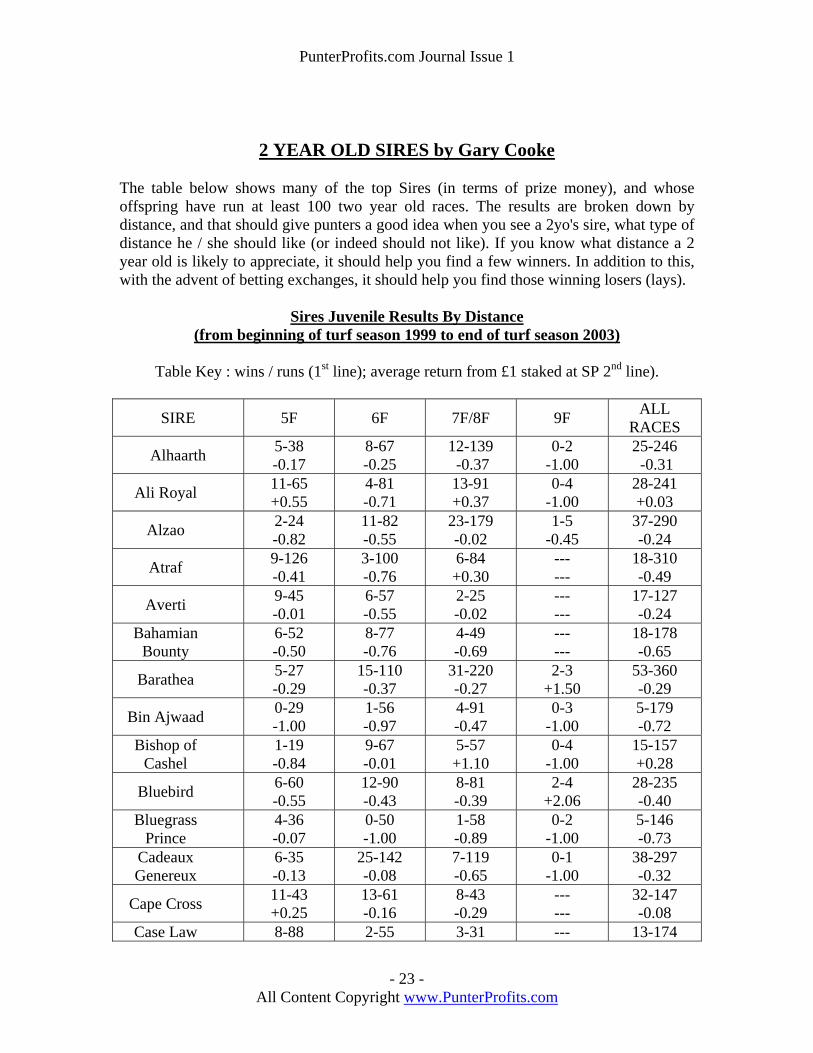
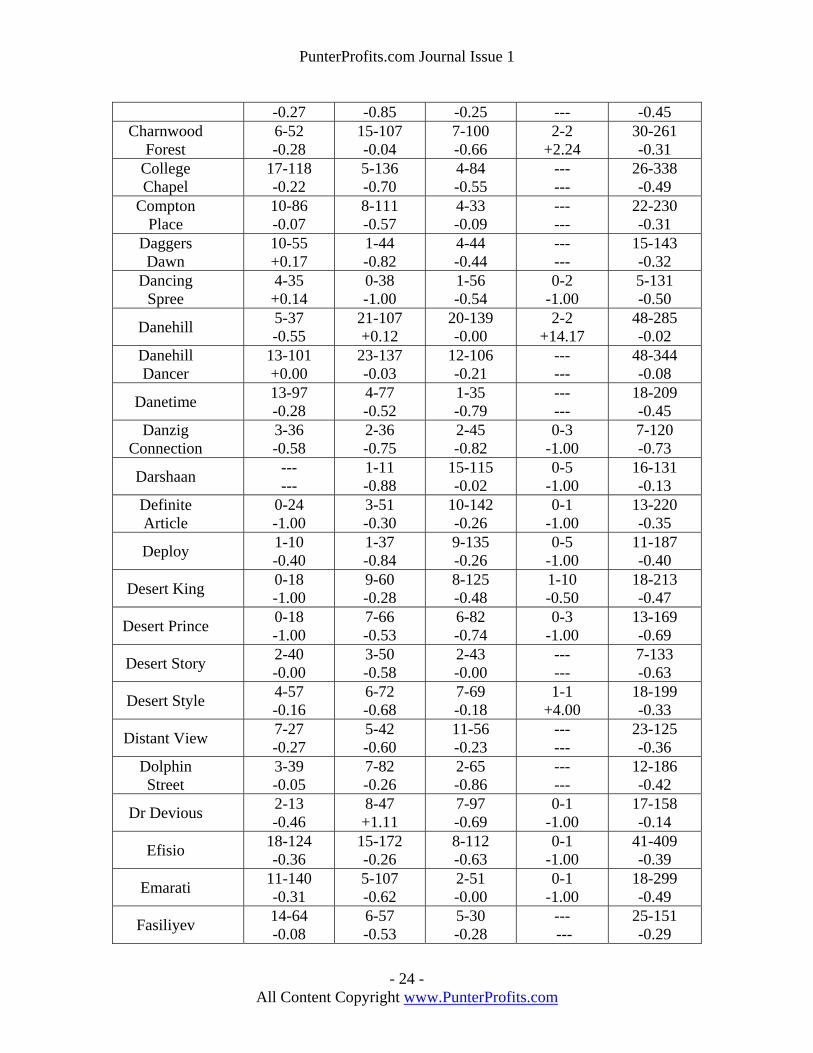
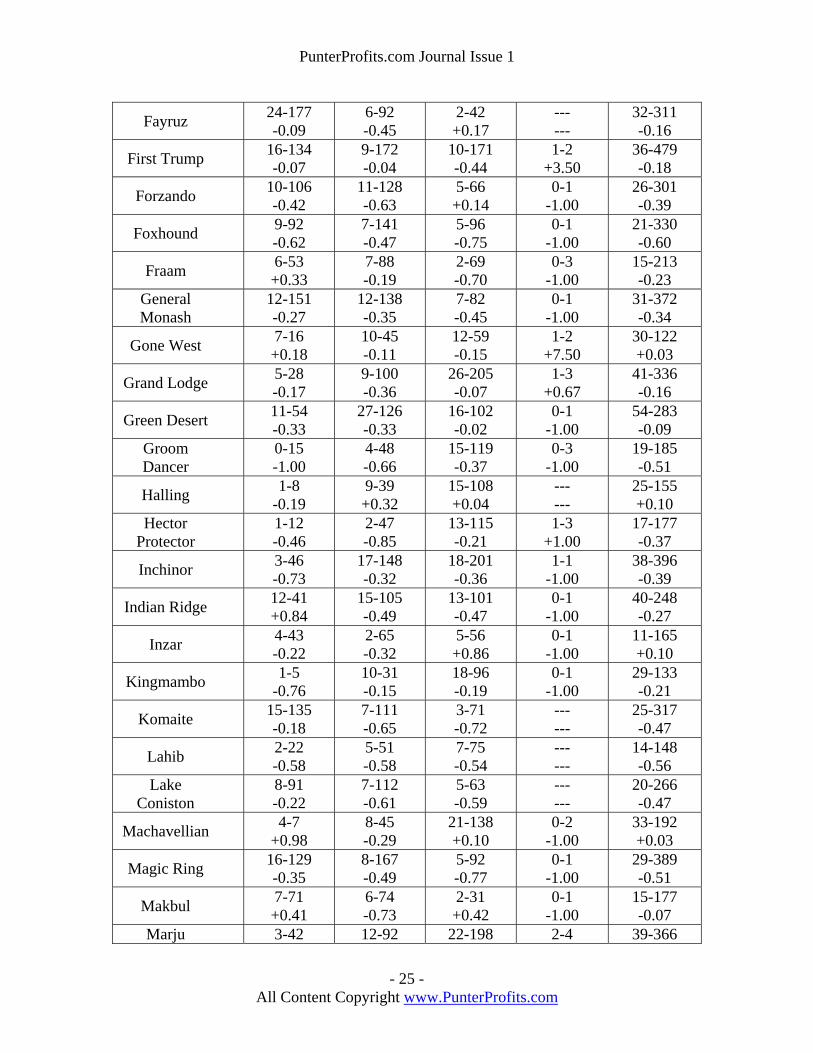
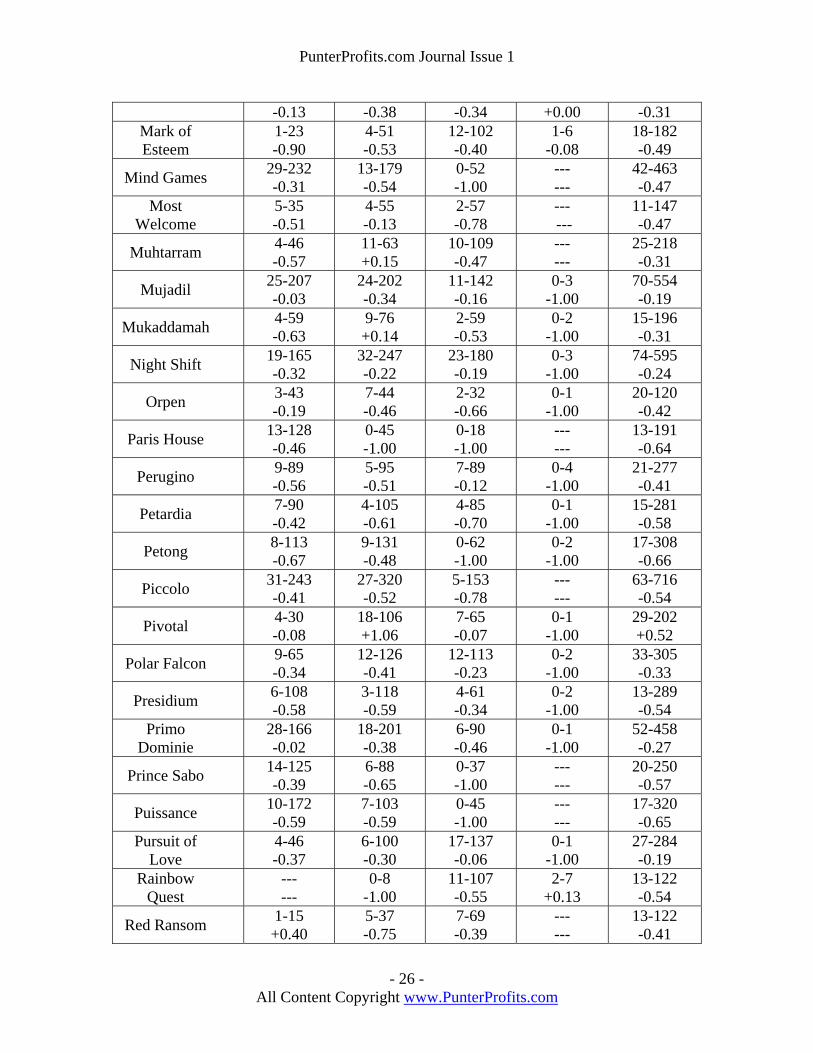
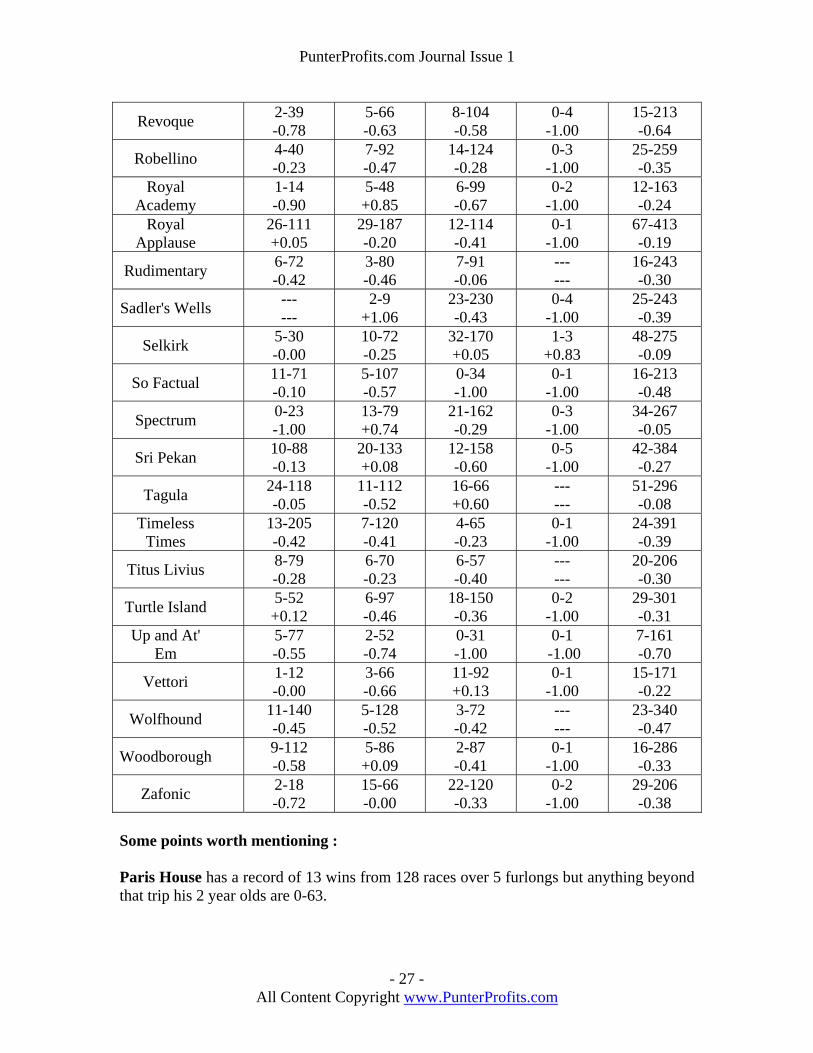
2 YEAR OLD SIRES by Gary Cooke The table below shows many of the top Sires (in terms of prize money), and whose offspring have run at least 100 two year old races. The results are broken down by distance, and that should give punters a good idea when you see a 2yo's sire, what type of distance he / she should like (or indeed should not like). If you know what distance a 2 year old is likely to appreciate, it should help you find a few winners. In addition to this, with the advent of betting exchanges, it should help you find those winning losers (lays).
Sires Juvenile Results By Distance (from beginning of turf season 1999 to end of turf season 2003)
Table Key : wins / runs (1st line); average return from £1 staked at SP 2nd line).
SIRE 5F 6F 7F/8F 9F ALL RACES
Alhaarth 5-38 -0.17
8-67 -0.25
12-139 -0.37
0-2 -1.00
25-246 -0.31
Ali Royal 11-65 +0.55
4-81 -0.71
13-91 +0.37
0-4 -1.00
28-241 +0.03
Alzao 2-24 -0.82
11-82 -0.55
23-179 -0.02
1-5 -0.45
37-290 -0.24
Atraf 9-126 -0.41
3-100 -0.76
6-84 +0.30
--- ---
18-310 -0.49
Averti 9-45 -0.01
6-57 -0.55
2-25 -0.02
--- ---
17-127 -0.24
Bahamian Bounty
6-52 -0.50
8-77 -0.76
4-49 -0.69
--- ---
18-178 -0.65
Barathea 5-27 -0.29
15-110 -0.37
31-220 -0.27
2-3 +1.50
53-360 -0.29
Bin Ajwaad 0-29 -1.00
1-56 -0.97
4-91 -0.47
0-3 -1.00
5-179 -0.72
Bishop of Cashel
1-19 -0.84
9-67 -0.01
5-57 +1.10
0-4 -1.00
15-157 +0.28
Bluebird 6-60 -0.55
12-90 -0.43
8-81 -0.39
2-4 +2.06
28-235 -0.40
Bluegrass Prince
4-36 -0.07
0-50 -1.00
1-58 -0.89
0-2 -1.00
5-146 -0.73
Cadeaux Genereux
6-35 -0.13
25-142 -0.08
7-119 -0.65
0-1 -1.00
38-297 -0.32
Cape Cross 11-43 +0.25
13-61 -0.16
8-43 -0.29
--- ---
32-147 -0.08
Case Law 8-88 2-55 3-31 --- 13-174
PunterProfits.com Journal Issue 1
- 24 - All Content Copyright www.PunterProfits.com
-0.27 -0.85 -0.25 --- -0.45 Charnwood
Forest 6-52 -0.28
15-107 -0.04
7-100 -0.66
2-2 +2.24
30-261 -0.31
College Chapel
17-118 -0.22
5-136 -0.70
4-84 -0.55
--- ---
26-338 -0.49
Compton Place
10-86 -0.07
8-111 -0.57
4-33 -0.09
--- ---
22-230 -0.31
Daggers Dawn
10-55 +0.17
1-44 -0.82
4-44 -0.44
--- ---
15-143 -0.32
Dancing Spree
4-35 +0.14
0-38 -1.00
1-56 -0.54
0-2 -1.00
5-131 -0.50
Danehill 5-37 -0.55
21-107 +0.12
20-139 -0.00
2-2 +14.17
48-285 -0.02
Danehill Dancer
13-101 +0.00
23-137 -0.03
12-106 -0.21
--- ---
48-344 -0.08
Danetime 13-97 -0.28
4-77 -0.52
1-35 -0.79
--- ---
18-209 -0.45
Danzig Connection
3-36 -0.58
2-36 -0.75
2-45 -0.82
0-3 -1.00
7-120 -0.73
Darshaan --- ---
1-11 -0.88
15-115 -0.02
0-5 -1.00
16-131 -0.13
Definite Article
0-24 -1.00
3-51 -0.30
10-142 -0.26
0-1 -1.00
13-220 -0.35
Deploy 1-10 -0.40
1-37 -0.84
9-135 -0.26
0-5 -1.00
11-187 -0.40
Desert King 0-18 -1.00
9-60 -0.28
8-125 -0.48
1-10 -0.50
18-213 -0.47
Desert Prince 0-18 -1.00
7-66 -0.53
6-82 -0.74
0-3 -1.00
13-169 -0.69
Desert Story 2-40 -0.00
3-50 -0.58
2-43 -0.00
--- ---
7-133 -0.63
Desert Style 4-57 -0.16
6-72 -0.68
7-69 -0.18
1-1 +4.00
18-199 -0.33
Distant View 7-27 -0.27
5-42 -0.60
11-56 -0.23
--- ---
23-125 -0.36
Dolphin Street
3-39 -0.05
7-82 -0.26
2-65 -0.86
--- ---
12-186 -0.42
Dr Devious 2-13 -0.46
8-47 +1.11
7-97 -0.69
0-1 -1.00
17-158 -0.14
Efisio 18-124 -0.36
15-172 -0.26
8-112 -0.63
0-1 -1.00
41-409 -0.39
Emarati 11-140 -0.31
5-107 -0.62
2-51 -0.00
0-1 -1.00
18-299 -0.49
Fasiliyev 14-64 -0.08
6-57 -0.53
5-30 -0.28
--- ---
25-151 -0.29
PunterProfits.com Journal Issue 1
- 25 - All Content Copyright www.PunterProfits.com
Fayruz 24-177 -0.09
6-92 -0.45
2-42 +0.17
--- ---
32-311 -0.16
First Trump 16-134 -0.07
9-172 -0.04
10-171 -0.44
1-2 +3.50
36-479 -0.18
Forzando 10-106 -0.42
11-128 -0.63
5-66 +0.14
0-1 -1.00
26-301 -0.39
Foxhound 9-92 -0.62
7-141 -0.47
5-96 -0.75
0-1 -1.00
21-330 -0.60
Fraam 6-53 +0.33
7-88 -0.19
2-69 -0.70
0-3 -1.00
15-213 -0.23
General Monash
12-151 -0.27
12-138 -0.35
7-82 -0.45
0-1 -1.00
31-372 -0.34
Gone West 7-16 +0.18
10-45 -0.11
12-59 -0.15
1-2 +7.50
30-122 +0.03
Grand Lodge 5-28 -0.17
9-100 -0.36
26-205 -0.07
1-3 +0.67
41-336 -0.16
Green Desert 11-54 -0.33
27-126 -0.33
16-102 -0.02
0-1 -1.00
54-283 -0.09
Groom Dancer
0-15 -1.00
4-48 -0.66
15-119 -0.37
0-3 -1.00
19-185 -0.51
Halling 1-8 -0.19
9-39 +0.32
15-108 +0.04
--- ---
25-155 +0.10
Hector Protector
1-12 -0.46
2-47 -0.85
13-115 -0.21
1-3 +1.00
17-177 -0.37
Inchinor 3-46 -0.73
17-148 -0.32
18-201 -0.36
1-1 -1.00
38-396 -0.39
Indian Ridge 12-41 +0.84
15-105 -0.49
13-101 -0.47
0-1 -1.00
40-248 -0.27
Inzar 4-43 -0.22
2-65 -0.32
5-56 +0.86
0-1 -1.00
11-165 +0.10
Kingmambo 1-5 -0.76
10-31 -0.15
18-96 -0.19
0-1 -1.00
29-133 -0.21
Komaite 15-135 -0.18
7-111 -0.65
3-71 -0.72
--- ---
25-317 -0.47
Lahib 2-22 -0.58
5-51 -0.58
7-75 -0.54
--- ---
14-148 -0.56
Lake Coniston
8-91 -0.22
7-112 -0.61
5-63 -0.59
--- ---
20-266 -0.47
Machavellian 4-7 +0.98
8-45 -0.29
21-138 +0.10
0-2 -1.00
33-192 +0.03
Magic Ring 16-129 -0.35
8-167 -0.49
5-92 -0.77
0-1 -1.00
29-389 -0.51
Makbul 7-71 +0.41
6-74 -0.73
2-31 +0.42
0-1 -1.00
15-177 -0.07
Marju 3-42 12-92 22-198 2-4 39-366
PunterProfits.com Journal Issue 1
- 26 - All Content Copyright www.PunterProfits.com
-0.13 -0.38 -0.34 +0.00 -0.31 Mark of Esteem
1-23 -0.90
4-51 -0.53
12-102 -0.40
1-6 -0.08
18-182 -0.49
Mind Games 29-232 -0.31
13-179 -0.54
0-52 -1.00
--- ---
42-463 -0.47
Most Welcome
5-35 -0.51
4-55 -0.13
2-57 -0.78
--- ---
11-147 -0.47
Muhtarram 4-46 -0.57
11-63 +0.15
10-109 -0.47
--- ---
25-218 -0.31
Mujadil 25-207 -0.03
24-202 -0.34
11-142 -0.16
0-3 -1.00
70-554 -0.19
Mukaddamah 4-59 -0.63
9-76 +0.14
2-59 -0.53
0-2 -1.00
15-196 -0.31
Night Shift 19-165 -0.32
32-247 -0.22
23-180 -0.19
0-3 -1.00
74-595 -0.24
Orpen 3-43 -0.19
7-44 -0.46
2-32 -0.66
0-1 -1.00
20-120 -0.42
Paris House 13-128 -0.46
0-45 -1.00
0-18 -1.00
--- ---
13-191 -0.64
Perugino 9-89 -0.56
5-95 -0.51
7-89 -0.12
0-4 -1.00
21-277 -0.41
Petardia 7-90 -0.42
4-105 -0.61
4-85 -0.70
0-1 -1.00
15-281 -0.58
Petong 8-113 -0.67
9-131 -0.48
0-62 -1.00
0-2 -1.00
17-308 -0.66
Piccolo 31-243 -0.41
27-320 -0.52
5-153 -0.78
--- ---
63-716 -0.54
Pivotal 4-30 -0.08
18-106 +1.06
7-65 -0.07
0-1 -1.00
29-202 +0.52
Polar Falcon 9-65 -0.34
12-126 -0.41
12-113 -0.23
0-2 -1.00
33-305 -0.33
Presidium 6-108 -0.58
3-118 -0.59
4-61 -0.34
0-2 -1.00
13-289 -0.54
Primo Dominie
28-166 -0.02
18-201 -0.38
6-90 -0.46
0-1 -1.00
52-458 -0.27
Prince Sabo 14-125 -0.39
6-88 -0.65
0-37 -1.00
--- ---
20-250 -0.57
Puissance 10-172 -0.59
7-103 -0.59
0-45 -1.00
--- ---
17-320 -0.65
Pursuit of Love
4-46 -0.37
6-100 -0.30
17-137 -0.06
0-1 -1.00
27-284 -0.19
Rainbow Quest
--- ---
0-8 -1.00
11-107 -0.55
2-7 +0.13
13-122 -0.54
Red Ransom 1-15 +0.40
5-37 -0.75
7-69 -0.39
--- ---
13-122 -0.41
PunterProfits.com Journal Issue 1
- 27 - All Content Copyright www.PunterProfits.com
Revoque 2-39 -0.78
5-66 -0.63
8-104 -0.58
0-4 -1.00
15-213 -0.64
Robellino 4-40 -0.23
7-92 -0.47
14-124 -0.28
0-3 -1.00
25-259 -0.35
Royal Academy
1-14 -0.90
5-48 +0.85
6-99 -0.67
0-2 -1.00
12-163 -0.24
Royal Applause
26-111 +0.05
29-187 -0.20
12-114 -0.41
0-1 -1.00
67-413 -0.19
Rudimentary 6-72 -0.42
3-80 -0.46
7-91 -0.06
--- ---
16-243 -0.30
Sadler's Wells --- ---
2-9 +1.06
23-230 -0.43
0-4 -1.00
25-243 -0.39
Selkirk 5-30 -0.00
10-72 -0.25
32-170 +0.05
1-3 +0.83
48-275 -0.09
So Factual 11-71 -0.10
5-107 -0.57
0-34 -1.00
0-1 -1.00
16-213 -0.48
Spectrum 0-23 -1.00
13-79 +0.74
21-162 -0.29
0-3 -1.00
34-267 -0.05
Sri Pekan 10-88 -0.13
20-133 +0.08
12-158 -0.60
0-5 -1.00
42-384 -0.27
Tagula 24-118 -0.05
11-112 -0.52
16-66 +0.60
--- ---
51-296 -0.08
Timeless Times
13-205 -0.42
7-120 -0.41
4-65 -0.23
0-1 -1.00
24-391 -0.39
Titus Livius 8-79 -0.28
6-70 -0.23
6-57 -0.40
--- ---
20-206 -0.30
Turtle Island 5-52 +0.12
6-97 -0.46
18-150 -0.36
0-2 -1.00
29-301 -0.31
Up and At' Em
5-77 -0.55
2-52 -0.74
0-31 -1.00
0-1 -1.00
7-161 -0.70
Vettori 1-12 -0.00
3-66 -0.66
11-92 +0.13
0-1 -1.00
15-171 -0.22
Wolfhound 11-140 -0.45
5-128 -0.52
3-72 -0.42
--- ---
23-340 -0.47
Woodborough 9-112 -0.58
5-86 +0.09
2-87 -0.41
0-1 -1.00
16-286 -0.33
Zafonic 2-18 -0.72
15-66 -0.00
22-120 -0.33
0-2 -1.00
29-206 -0.38
Some points worth mentioning : Paris House has a record of 13 wins from 128 races over 5 furlongs but anything beyond that trip his 2 year olds are 0-63.

PunterProfits.com Journal Issue 1
- 28 - All Content Copyright www.PunterProfits.com
Puissance offspring can win over 5/6 furlongs but over 7 furlongs or more they are 0 wins from 45. Spectrum`s – 2 year olds are 0 wins from 23 over the minimum trip, but over 6 furlongs and above they are 34 wins from 244. Rainbow Quest, Darshaan and Saddler’s Wells – their progeny have not run over 5 Furlongs and the few times they have tried to run over 6 furlongs they are 3 wins from 28. Their progeny usually improve with age. Danzig Connection – 2 year olds have a record of 7 wins from 120 runners, and for every £1 staked you would lose 73p. Halling – has a 25 from 155 record with his juveniles and to a £1 stake you would be in profit by £15.50. Mind Games – 0 wins from 52 races at 7 furlongs or more. Next month Gary will be looking at the same sires and races, but looking at going preferences.
PunterProfits.com Journal Issue 1
- 29 - All Content Copyright www.PunterProfits.com
Horses to note in the coming month by Eagle-Eyed
Here are some horses that have been noted in running in recent weeks and who look worthy of support under the correct race conditions in the near future. PRINCE AARON – won the Wokingham trial at Kempton easily and looks seriously on the upgrade. A sprinter who should win another couple by the end of the season. Was poorly drawn at Epsom last time, but still ran well to be competitive. MUTAWAQED – did best of stands’ side group in the race won by Prince Aaron at Kempton (29/5/04), and followed up with a good second at Epsom on Derby Day (5/6/04) from a wide draw. Is ideally suited by good or softer ground. Could well be aimed at the Stewards Cup at Goodwood again this year (7th last year when poorly drawn). CAMP COMMANDER – 4th in the Victoria Cup when not ideally drawn. Has always looked a 7 furlong specialist, but hopefully will go well if running in the Royal Hunt Cup at Royal Ascot over 1 mile. VORTEX – 3rd in the Victoria Cup from what was a poor low draw that day. He pulled clear of his side and should appreciate the return to 1 mile. The Royal Hunt Cup is within his compass. ROYAL REBEL – 7th in the Group 2 Henry II Stakes at Sandown on May 31st, beaten 7 lengths, but shaped pretty well considering it was only his second run in just under two years. His previous two runs in this event had seen him finish 22 and 13 lengths respectively behind the winner. This Sandown race was his prep for the Ascot Gold Cup in 2001 and 2002 and he won both of those, so he should not be written off yet for a repeat dose in 2004. BALLYBUNION – has shown little on first few starts this year, but is dropping down the handicap quickly. Showed plenty of dash at Haydock first time out to suggest the horse will be winning races this year. Is best at 6f and is also 3 from 4 at Catterick. MERLIN’S DANCER – impressive winner at Ripon at the end of May and could be plenty more to come. Dandy Nicholls does well with his new sprinters (and his old ones for that matter!). PIRLIE HILL – won a weak maiden 3 year old handicap at Hamilton on 3rd June, but won well despite drifting right across the track. Should continue to be competitive at a lowly level, especially in own age group. TEXAS GOLD – looks set for another good season. Good effort at Epsom on 5th June when 4th in hot 5f handicap. Stewards Cup at Goodwood is the main target and will go

PunterProfits.com Journal Issue 1
- 30 - All Content Copyright www.PunterProfits.com
close if getting a high draw. Also entered in the Wokingham at Royal Ascot, but the stiff 6f might be his undoing. CITRINE SPIRIT – good effort at Ascot on May 22nd when poorly drawn. Subsequently disappointed next time at Nottingham, but should not be written off just yet as it seemed that the ground was too firm that day.
PunterProfits.com Journal Issue 1
- 31 - All Content Copyright www.PunterProfits.com
Compiling Ratings by Paul Dyson In this series of articles, Paul Dyson takes us through the process he has been through to compile horse ratings for sprint handicaps. Based on actual experience in 2003 and 2004 the articles will cover the theory and approach; detailed analyses (which will provide useful pointers on their own), and an assessment of how the ratings have performed to date. Introduction During the first three months of 2003 I embarked on producing ratings for horse races. I have never done this before and I have no idea how other people produce their ratings, but I had some clear opinions on how to go about it, and being a chartered statistician, the statistical know-how (one would hope…). As a starting point I concentrated on sprint handicaps and the ratings performed well over the summer of 2003. In late 2003 I produced a new set for All-weather races (I felt the key elements would be different – and they were) and at the beginning of 2004 the initial flat ratings models were updated based on what had been learned over the previous 12 months. Of course there are two extremes with ratings – the official handicapper produces ratings based I presume, on his wealth of experience and knowledge of horse-racing (and from watching hours and hours of races) giving him a good idea of a horse’s current ability. I expect he (they) can spot quality quite quickly from just watching a horse run. At the other extreme is my approach – based purely in statistics. I watch only a few races, I do not go to many meetings, but I believe that the wealth (and quantity) of statistics produced by horse racing should hold some decent information about the likelihood of each horse’s chances in a race. Before starting out, I had a vague idea of what I would do…basically look at lots of data, find out which factors were important (by “factors” I mean age, position last time out etc.) and combine them together to produce an overall rating. This combining process (or modelling) is the key step (with many pitfalls) and involves giving a weight to each of the factors to produce the overall rating. This is the heavy statistics part and involves fitting non-linear lines to data, finding best fits etc. etc. When I talk about a “model” I simply mean the set of weights attached to each factor used to weight them together into one figure – the rating. Despite there being a lot of racing and therefore a lot of data constantly coming in, (a statistician’s dream!), you still need a long run of data to produce ratings. To start with you need to treat race distances and race-types (by which I mean handicaps, maidens, stakes races etc.) differently. You need a different ratings model for each combination because even if the key factors remain the same their relative importance may change (e.g. speed vs stamina for short and long distances).
PunterProfits.com Journal Issue 1
- 32 - All Content Copyright www.PunterProfits.com
You also need to have full access to all of the information and the ability to generate new statistics that are a combination of existing ones. For instance, current form is a key part of any rating but very difficult to sum up in one statistic. Position last time out is an obvious candidate, but a horse may come 10th simply because he was stepping up a couple of grades to a class B race for the first time. In this case 10th may be a good performance (but, from a purely statistical point of view does not look like it!). So it is necessary to account for the quality of the competition (as well as other factors such as the distances between horses). The point is that current form is very difficult to quantify in one figure and compiling ratings may need calculation (and testing) of new statistics which are a combination of existing ones. For all these reasons there is a need for a lot of data. I could not really start this process until I had at least 3 years of information. However, you can have too much data – over time things change: jockey-club rulings and practices; the betting market (taxes, exchanges); the courses (all-weather surfaces; attempts to reduce draw biases); trainer methods (scientific research) etc. This can make data from 10 years ago much less useful for predicting today’s winners. So at the end of the day it is a bit of a trade-off between having enough data to do the job successfully and with some confidence, but not having data that is too old and therefore less relevant. What is the focus? As I have been building up my database over the years, I have been using the information to try and produce “systems” i.e. combinations of factors that select horses with a decent chance of producing a profit from betting over time. The focus of this process is profit. Strike rate is important but in a way, incidental – important only in how it fits with your particular betting style. For instance it might be possible to produce a system that makes 10% profit on turnover by selecting odds-on horses with a 60% strike rate. On the other hand a different system might select horses in the price range 5/1 to 10/1 and also make 10% profit in the long term but only with a strike rate of 20%. These two systems are equally good in profit terms but one produces regular small wins, while the other produces occasional big wins. By the same token I have seen plenty of systems with a strike rate over 50% that make a loss over time (this type of system is, unfortunately all too easy to find!) so strike rate alone can be very misleading. In my opinion, I think it is very difficult to produce significant profit betting on short priced horses. Here, you are at the short-end of the market – where the bookie makes his profit or loss – so he is going to give special attention to the price of the favourites and make sure he gets it right. And many professional gamblers that I have spoken to argue that most value lies in the 5/1 to 20/1 range which backs up this view. Of course any

PunterProfits.com Journal Issue 1
- 33 - All Content Copyright www.PunterProfits.com
system - odds-on or odds-against - that makes a profit – however small - is worth following! The point is that the focus of system development must be profit. There are also many other things to consider (consistency, a decent sample size, at least 3 years data etc.), but profit is the primary consideration. However, should profit be the focus of ratings development? After all, the idea behind developing ratings is to identify value bets and therefore make a profit from betting. But the answer, in my opinion is a resounding “NO”. The ultimate set of ratings would perfectly predict the finishing order of all of the horses in a race. Of course this is impossible to achieve in reality (for literally hundreds of reasons) but this at least should be the aim – to get as close as possible to the actual finishing positions of all horses. In other words we should try and maximise the strike rate – not only for getting the winning horse to be top rated, but also for getting the 2nd placed horse to be 2nd top rated and so on. This should ensure that the factors used to produce the rating (as determined by the statistical modelling process) will have a general predictive ability across races (in other words, in general, the lower a horse scores on a particular factor, the lower down the order he is likely to finish). Put another way, if we developed a set of ratings that maximised profit, then the factors used in the rating will be heavily influenced by the occasional horse that wins at 33/1 (or longer). These horses are out of the ordinary in some respect (they must be otherwise the price would not be so long) – maybe they have not raced for a long time in which case ratings based on maximising profit will be fooled into thinking that being off the track a long time improves the chances of winning when in fact the opposite is true. There is however, little point in trying to predict which horse will finish 6th and which will finish 7th etc. To start with, from a betting proposition it is only the first 3 or 4 horses that pay out as win or each-way bets. Even from a laying point of view it is only necessary to identify horses that are unlikely to win or be placed. More importantly however, finishing positions beyond the first 4 to 5 can be highly suspect – often when it is clear to a jockey that his horse will be outside the places he can be eased down and thus the true ability of the horse will not be reflected in his finishing position (indeed this may be an advantage in terms of preventing the horse from rising too much in the ratings); or a horse may encounter difficulty in running which may knock him back further than he should have been. The way around this is to develop ratings over a decent sample size where these type of incidents will average out. The point is however, that ratings should not be expected to be perfect in predicting the lower positions in the race. If the top 3 or 4 rated horses can be estimated as accurately as possible then this will be a good starting point.
PunterProfits.com Journal Issue 1
- 34 - All Content Copyright www.PunterProfits.com
What makes a good rating model? Obviously a good rating model will pick winners with some regularity, but how regularly? Some of the best-regarded ratings (e.g. Massey) only have a strike rate of 15-20%, in other words the top-rated horse only wins 15-20% of the time. However, backing all top-rated horses in a good ratings model should be able to make a profit in the long run – but again it may only be in the 5% to 20% of turnover range. With a good ratings model, the 2nd place horse in the ratings will probably win 12-17% of the time. Of course it should win less frequently than the top-rated horse (otherwise there is something basically wrong with the ratings) but it will not be far behind. And it may be that the 2nd rated horse – if backed in every race – does not make a profit. These figures may be surprisingly low, but the uncertainties in horse racing are so many that to expect anything more is a tall order. And if the performance of a ratings model is so low, it begs the question: “is it worth it?” Well, of course the answer is yes. The key point is that a ratings model should be used as a guide to the chances of all the horses in a race. Ratings should not be seen as a “system” that automatically selects a horse to back in a race without any more thought. This might work with the top rated horse but the returns may be too low to warrant all the effort or cost of compiling the ratings. Besides, used properly the ratings should be able to provide a much more significant income (as I will try to show in this series of articles). To continue with this point (because I feel it is very important), ratings provide an estimate of each horse’s chance of winning and the user therefore needs to interpret the ratings to find the optimum betting strategy for that race; (and the strategy will undoubtedly vary by race). More often than not the strategy will be “no bet” and of course if the ratings have told you it is impossible to pick a winner because things are so close then they should be deemed to have worked. As an example, the ratings for one race might show two horses closely matched at the top but clear of the rest. If the prices are decent (say 4/1 or higher) both horses could be backed to win. If not, a reverse forecast may be a better option – especially if one of the two horses is a short priced favourite and the other is say, 10/1. Usually the strategy is just a case of common sense (and a bit of maths to make sure it is a profitable strategy). However, the user should also be prepared to delve into the ratings. Understanding which element of the ratings model has elevated a 50/1 outsider into second place is vital. At the end of the day a ratings model is looking for general patterns but there will be exceptions and often quite a few. For instance, in the models I have developed, days since last run is an important factor – horses that have run recently have a higher strike rate than those that have not run for some time. And it is usually a continuous factor (as I will show later) i.e. not just a case of classifying a horse as having run recently (say in the last month) or not – a horse that ran 4 days ago, will on average be more likely to win than
PunterProfits.com Journal Issue 1
- 35 - All Content Copyright www.PunterProfits.com
one that ran 7 days ago which will in turn be more likely to win than one that ran 14 days ago. Of course, other factors need to be considered, but the relationship is fairly well defined. With this factor however, a horse turning out on consecutive days will get a significant boost to its ratings irrespective of how it performed the day before and this may be enough to elevate it up the rankings by a false number of places (of course a good ratings model will also include a measure of how well the horse performed last time out which should pull it back down). The point is however that the ratings are a model of general patterns and as such exceptions will occur and confuse if not understood. Although the last few paragraphs may seem to have diverged from the topic for this section – what makes a good ratings model – they are in fact highly relevant. There are two key elements to a good ratings model without which none of the above could be done with any confidence:
1. As we move down the ranking of the rated horses, their strike rate must drop. It just does not make sense for the 4th rated horse to win more often than the 3rd rated horse. Some leeway should be given well down the list (e.g. 10th rated may win slightly more than 9th rated because finishing positions can be false that far down) but not much!
2. The bigger the gap between horses in terms of the rating, the more likely the higher rated horse will finish in front. As an example, the strike rate of the top rated horse should be higher when the gap to the second rated horse is bigger (but the same should apply further down too).
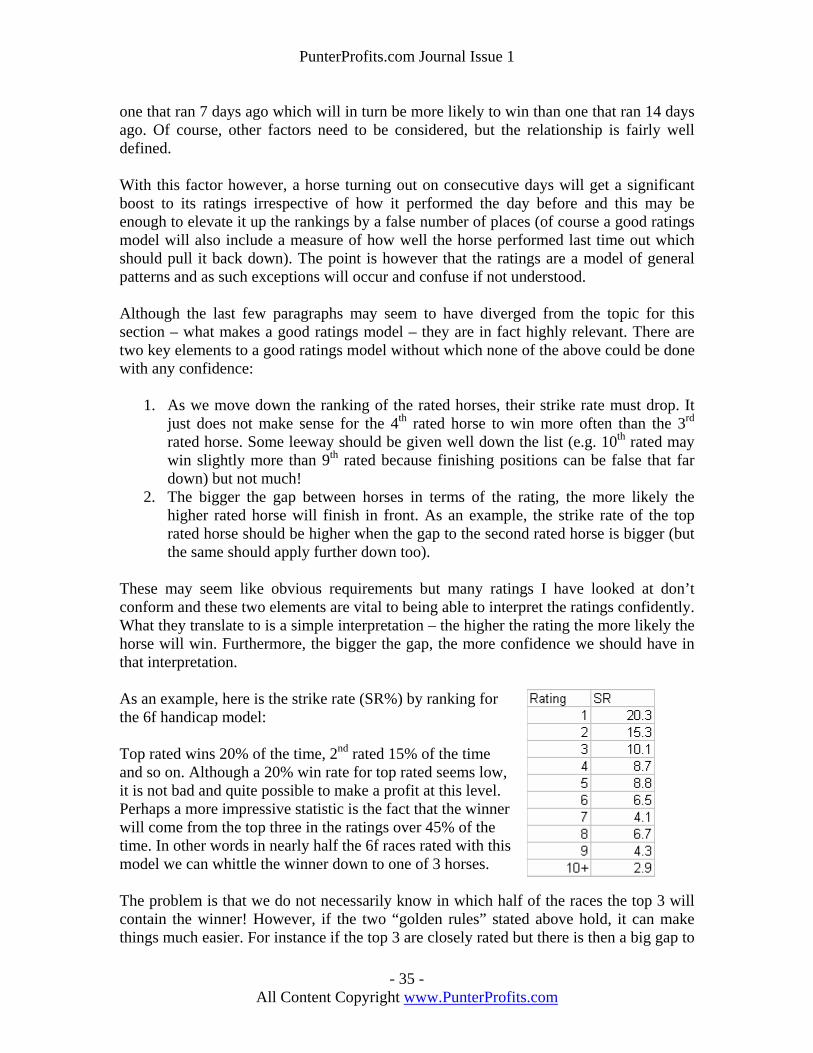
These may seem like obvious requirements but many ratings I have looked at don’t conform and these two elements are vital to being able to interpret the ratings confidently. What they translate to is a simple interpretation – the higher the rating the more likely the horse will win. Furthermore, the bigger the gap, the more confidence we should have in that interpretation. As an example, here is the strike rate (SR%) by ranking for the 6f handicap model: Top rated wins 20% of the time, 2nd rated 15% of the time and so on. Although a 20% win rate for top rated seems low, it is not bad and quite possible to make a profit at this level. Perhaps a more impressive statistic is the fact that the winner will come from the top three in the ratings over 45% of the time. In other words in nearly half the 6f races rated with this model we can whittle the winner down to one of 3 horses. The problem is that we do not necessarily know in which half of the races the top 3 will contain the winner! However, if the two “golden rules” stated above hold, it can make things much easier. For instance if the top 3 are closely rated but there is then a big gap to

PunterProfits.com Journal Issue 1
- 36 - All Content Copyright www.PunterProfits.com
fourth rated, we can have some confidence that this will be one of those races where the winner is in the top 3. Next month: Paul takes us through the process of compiling ratings.

PunterProfits.com Journal Issue 1
- 37 - All Content Copyright www.PunterProfits.com
Backing Places by the Officer Question : When is a 5/1 shot not a 5/1 shot? Answer: When you are backing it to place. The whole purpose of this article is to show where the real value lies in modern betting. With the advent of betting exchanges, it is now possible to back a horse to place, or lay a horse not to place. Also we still have the good old bookmakers offering great odds E.W. seriously? Consider the following odds 1/5, 5/1, 33/1, 33/1, 33/1. 33/1, 33/1, 33/1 Some bookies will still offer a fifth the odds a place 1,2,3 for this race. Using a place calculator the 5/1 shot is considered to be a 1/5 shot to place. The bookies will pay out even money on a place that is 1/5th of 5/1. The place calculator assumes the 5/1 shot is really a 7.5/1 shot when bookies percentages are taken into account, therefore using mathematical probability it should win this race 4 times in 33, and place 26 times out of 33, since it should place 4 out of every 5 races. Therefore in 33 races the win portion of the bet loses (33-4) - (4*5) = -9 points, while the place portion of the bet wins 26 - (33 -26) = 19 points Total theoretical profit = +10 points. In practice the place calculator is an exact representation of the place odds in relation to the win odds, but this is not the case with Odds On shots. They tend to win in proportion to their win odds, or run a stinker and finish unplaced. Horse Racing is not an exact science, but mathematics is. Caution and common sense needs to be exercised here. However, there is no denying that the punter gets the biggest edge with this skewed type of betting show. If you do not believe me then try backing that same horse (win price 5/1) at evens on Betfair for a place. You will find that it will be more likely to be odds on at 1.7 than evens at 2.0. The big bookies are well aware of the above types of race, which is why you will sometimes only get 1/6 the odds when a FAV starts odds on, for a place. To place or not to place? Consider this example with the following odds : 11/10 3/1 6/1 9/1 20/1 25/1 33/1 66/1 Another great betting shape for the EW backer. If the 2nd favourite is a genuine 3/1 shot then it is begging to be backed for a place…………………………or is it? It all depends

PunterProfits.com Journal Issue 1
- 38 - All Content Copyright www.PunterProfits.com
on the type of race. If it were a handicap I would not be backing it, however if this were a weak maiden I would. Well it is a weak handicap isn’t it? The odds suggest so. However, in reality any of these horses could win, as they should all be of roughly equal ability with the lead in the saddle to balance things out. It is my theory that punters take too much notice of form in these races, and back the horses accordingly. For example, the 66-1 shot could have a much bigger chance than its odds suggest. Imagine an excellent 7-pound claimer is on board, it has been dropped a massive 10 pounds in the handicap, the horse has switched stables and it has been off the track for 400 days. In theory the horse could be 17 pounds well in. The market has taken the long lay off, and the drop in the handicap as major negatives – hence the price. This horse could be a true 66-1 shot, but it is not beyond the bounds of possibility that the horse actually is nearer a single figure price chance. We cannot be sure. What I am trying to say therefore, is that handicaps are unpredictable and don't the bookies know it! They will offer all sorts of concessions in these races, tricasts, early odds etc. They want you to back to win and even more so each way. In handicaps, I am a layer, even in the weak races. I will lay the shorter priced horses not to place, only when I have calculated that the place odds are 20% in my favour. I use a spreadsheet, to calculate the place odds in relation to win odds, taking into account the number of runners. The system in practice Derby Day 5/6/2004 15:30 Vodaphone “Dash” Handicap 5f 20 Runners Prices : 3/1,4/1,12/1,14/1, 3 at 16/1 and 7 at 20/1 and 2 at 25/1 and 2 at 33/1 50/1 60/1 On the face of it this looks a weak to average handicap, 2 very short price horses for a 20- runner field. However, this is a handicap and the remaining 18 horses are not that spread out betting wise, with three at 16/1 and seven at 20/1. In my view the more runners the more chance of an upset, trouble in running, draw elements taking a hand, etc. In the end I calculated the second favourite to be a 1.95 chance to place on Betfair (bookmaker odds at the time were 9/2). I layed at odds of 1.76, which is 20% less. The starting price was 4/1, real place odds 1.84, which gave me a theoretical 10% edge. I am not unhappy with this situation, because I know from past experience that these types of races are a real cavalry charge and very unpredictable. 1st 20/1, 2nd 25/1 3rd20/1, 4th 16/1 This was in fact an ultra-competitive race. A blanket finish with the 2nd favorite in 6th and the favourite nearly last. Great stuff for layers! If this had been a maiden I would not have played at all, despite the number of runners. With everything at level weights the

PunterProfits.com Journal Issue 1
- 39 - All Content Copyright www.PunterProfits.com
chance of a shock result are greatly reduced, even with only 3 places. 15:40 Haydock 1m Class C handicap Prices : 9/2,5/1,5/1,13/2,7/1,8/1,10/1,12/1,33/1,100/1 A fairly competitive race with one absolute outsider. I calculate the favourite at place odds of 2.17 and eventually lay at 1.97 for a 17% edge. Result 1st 12/1 2nd 33/1 3rd 9/2 I just missed out here, but what another blinding result for the layers. After commission, a small loss is made over the two bets. I layed two short priced horses, in two unpredictable races (with a bit of hindsight!) to an average theoretical profit margin of 13.5%. I may have 10 bets on any given day, or maybe none at all. I will only back when I have the percentages well in my favour. However, a losing run can happen at any time and will happen to any good gambler or bookmaker, and it does not matter what the percentages are if you are not backing winners. You just have to ride it out, backed up by a large betting bank. The winning runs will come along again and wipe out those losses and a bit more. The worst losses I suffered were when using a place calculator and laying too many horses in the same race. I could not control my losing runs. The answer lies in laying those horses in the right events and then taking on the big money. Remember that I have not mentioned form at all in this article, or even the name of any horses, I am purely applying mathematical chances against a volatile betting market. When the cash is down, just as in the stock market, a horse’s price may plummet too far, before creeping back up to a more realistic betting show. Hopefully I will lay horses at the bottom market prices, before the price trend creeps back up . Here is a list of rules that I apply to laying short priced horses not to place :
1) Lay in handicaps only. 2) Aim to make a profit of 20% per bet. 3) The more runners to places, the better. 4) Place your bet or bets on before the rush starts. 5) Have a sufficient bank for losers. 6) Be patient! The bets will come. 7) Don’t rely on a place calculator!
The ideal race would be a 15-runner handicap with only 3 places, and a couple of horses

PunterProfits.com Journal Issue 1
- 40 - All Content Copyright www.PunterProfits.com
at say 3/1 joint favourite, although realistically most of my bets would be in races with 8 to 10 runners. There is no reason why you cannot back all the other runners to place against these short price horses, it is just I prefer to be a layer. If you wish to make a profit on stakes races, maidens, condition, sellers etc, look at the prices on Betfair, and if you fancy a horse and it is trading way below what the internet bookie is offering each way, then these are the most profitable place bets to be had. If you lay in races like the real examples above, I feel it is virtually impossible to make a loss in the long run, and you will have a good chance of making a decent profit. Nothing is written in stone, but generally lay the shorter priced horses in handicaps, and bet the 2nd or 3rd favs in stakes races, when the market is skewed i.e. there is a strong favourite and only a couple of others are single figure odds. I have not revealed exactly how I calculate the “real” place odds, but it is not an exact science anyway. Take up the baton and run with it!!!!!
PunterProfits.com Journal Issue 1
- 41 - All Content Copyright www.PunterProfits.com
ROBERT WINSTON - JOCKEY IN FOCUS By David Renham
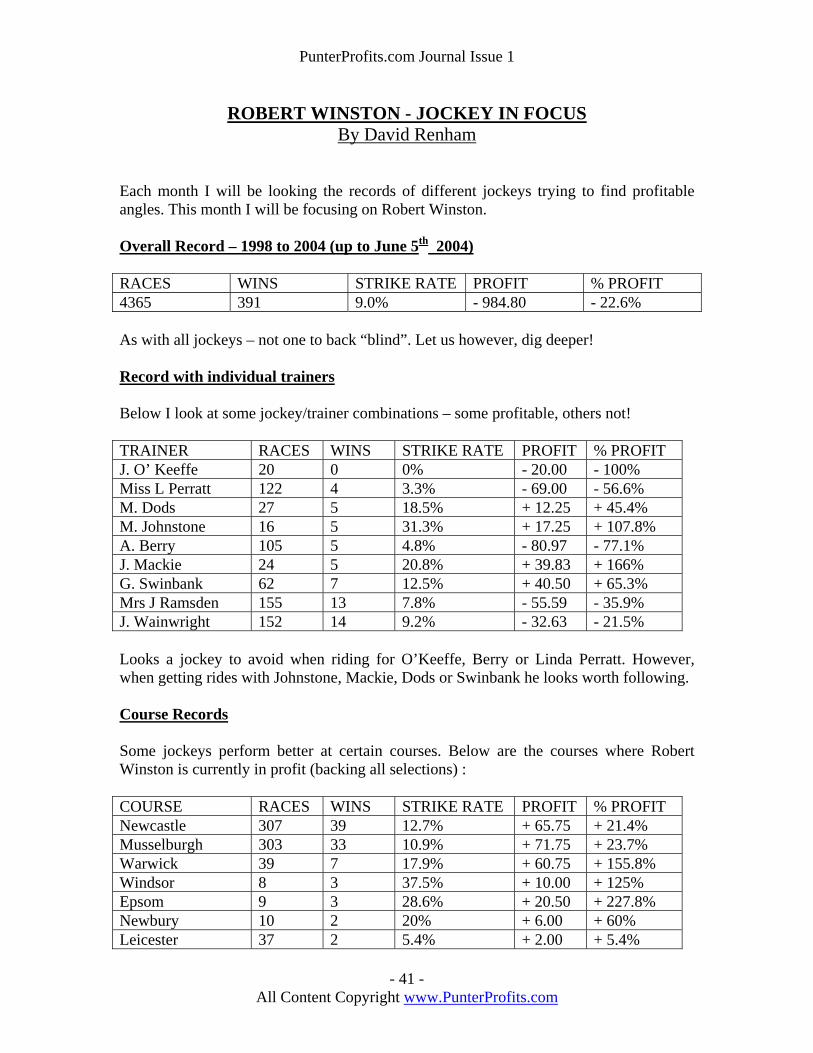
Each month I will be looking the records of different jockeys trying to find profitable angles. This month I will be focusing on Robert Winston. Overall Record – 1998 to 2004 (up to June 5th 2004) RACES WINS STRIKE RATE PROFIT % PROFIT 4365 391 9.0% - 984.80 - 22.6% As with all jockeys – not one to back “blind”. Let us however, dig deeper! Record with individual trainers Below I look at some jockey/trainer combinations – some profitable, others not! TRAINER RACES WINS STRIKE RATE PROFIT % PROFIT J. O’ Keeffe 20 0 0% - 20.00 - 100% Miss L Perratt 122 4 3.3% - 69.00 - 56.6% M. Dods 27 5 18.5% + 12.25 + 45.4% M. Johnstone 16 5 31.3% + 17.25 + 107.8% A. Berry 105 5 4.8% - 80.97 - 77.1% J. Mackie 24 5 20.8% + 39.83 + 166% G. Swinbank 62 7 12.5% + 40.50 + 65.3% Mrs J Ramsden 155 13 7.8% - 55.59 - 35.9% J. Wainwright 152 14 9.2% - 32.63 - 21.5% Looks a jockey to avoid when riding for O’Keeffe, Berry or Linda Perratt. However, when getting rides with Johnstone, Mackie, Dods or Swinbank he looks worth following. Course Records Some jockeys perform better at certain courses. Below are the courses where Robert Winston is currently in profit (backing all selections) : COURSE RACES WINS STRIKE RATE PROFIT % PROFIT Newcastle 307 39 12.7% + 65.75 + 21.4% Musselburgh 303 33 10.9% + 71.75 + 23.7% Warwick 39 7 17.9% + 60.75 + 155.8% Windsor 8 3 37.5% + 10.00 + 125% Epsom 9 3 28.6% + 20.50 + 227.8% Newbury 10 2 20% + 6.00 + 60% Leicester 37 2 5.4% + 2.00 + 5.4%
PunterProfits.com Journal Issue 1
- 42 - All Content Copyright www.PunterProfits.com
Clearly he rides well at Newcastle and Musselburgh. The samples for Windsor, Epsom and Newbury are too small to make any concrete conclusions. Further “angles” Here are some other profitable angles I have unearthed : 1. His record at Newcastle has already been highlighted, but he has performed best at 5 to 7 furlongs showing a profit of just under 65 points (+ 35.7%). 2. When granted a high draw at Beverley over 5 furlongs he should be noted. When drawn 15 or higher he has registered 5 wins from just 13 runs for a profit of over 26 points (+ 202%). 3. When granted a low draw at Newcastle over 5 and 6 furlongs he has a good record. When drawn 4 or lower he has enjoyed 7 wins from 34 runs for a profit of 27.2 points (+ 80%). 4. Over 5 and 6 furlongs, when riding the favourite (joint favourite included) he has made a decent profit when the horses have been priced 7-2 or bigger. His record reads 13 wins from 57 for a profit of 15 points (+ 26.3%). 5. Over 5 and 6 furlongs, when riding a horse from the first three in the betting (handicap races only), he has made a decent profit when the horses have been priced 7-2 or bigger. His record reads 38 wins from 221 runs for a profit of 39.5 points (+ 17.9%). 6. He has a profitable record in 2 year old nurseries (handicaps) with 17 wins from 157 runs for a profit of 45 points (+ 28.7%). Conclusion Robert Winston is a good rider, especially in sprint races and is one to note when bagging a decent draw on a draw biased course. More articles from Dave Renham can be found on his website www.drawn2win.co.uk
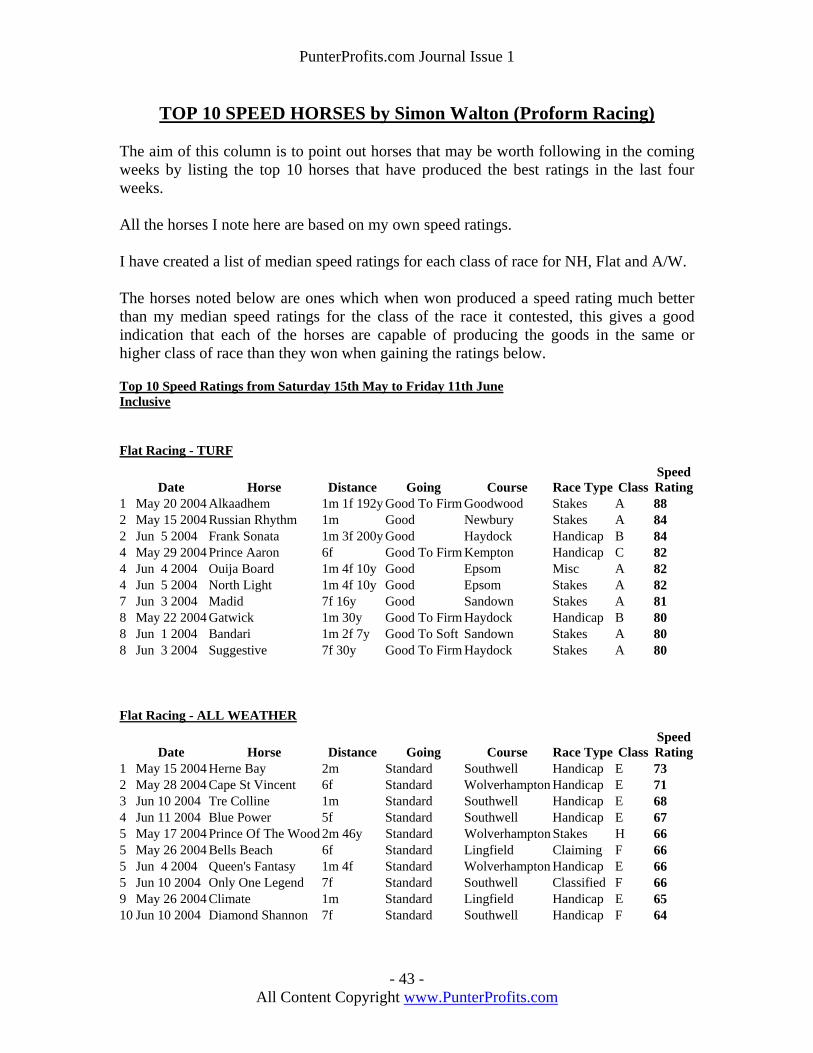
PunterProfits.com Journal Issue 1
- 43 - All Content Copyright www.PunterProfits.com
TOP 10 SPEED HORSES by Simon Walton (Proform Racing) The aim of this column is to point out horses that may be worth following in the coming weeks by listing the top 10 horses that have produced the best ratings in the last four weeks. All the horses I note here are based on my own speed ratings. I have created a list of median speed ratings for each class of race for NH, Flat and A/W. The horses noted below are ones which when won produced a speed rating much better than my median speed ratings for the class of the race it contested, this gives a good indication that each of the horses are capable of producing the goods in the same or higher class of race than they won when gaining the ratings below. Top 10 Speed Ratings from Saturday 15th May to Friday 11th June Inclusive Flat Racing - TURF
Date Horse Distance Going Course Race Type Class Speed Rating
1 May 20 2004 Alkaadhem 1m 1f 192y Good To Firm Goodwood Stakes A 88 2 May 15 2004 Russian Rhythm 1m Good Newbury Stakes A 84 2 Jun 5 2004 Frank Sonata 1m 3f 200y Good Haydock Handicap B 84 4 May 29 2004 Prince Aaron 6f Good To Firm Kempton Handicap C 82 4 Jun 4 2004 Ouija Board 1m 4f 10y Good Epsom Misc A 82 4 Jun 5 2004 North Light 1m 4f 10y Good Epsom Stakes A 82 7 Jun 3 2004 Madid 7f 16y Good Sandown Stakes A 81 8 May 22 2004 Gatwick 1m 30y Good To Firm Haydock Handicap B 80 8 Jun 1 2004 Bandari 1m 2f 7y Good To Soft Sandown Stakes A 80 8 Jun 3 2004 Suggestive 7f 30y Good To Firm Haydock Stakes A 80 Flat Racing - ALL WEATHER
Date Horse Distance Going Course Race Type Class Speed Rating
1 May 15 2004 Herne Bay 2m Standard Southwell Handicap E 73 2 May 28 2004 Cape St Vincent 6f Standard Wolverhampton Handicap E 71 3 Jun 10 2004 Tre Colline 1m Standard Southwell Handicap E 68 4 Jun 11 2004 Blue Power 5f Standard Southwell Handicap E 67 5 May 17 2004 Prince Of The Wood 2m 46y Standard Wolverhampton Stakes H 66 5 May 26 2004 Bells Beach 6f Standard Lingfield Claiming F 66 5 Jun 4 2004 Queen's Fantasy 1m 4f Standard Wolverhampton Handicap E 66 5 Jun 10 2004 Only One Legend 7f Standard Southwell Classified F 66 9 May 26 2004 Climate 1m Standard Lingfield Handicap E 65 10 Jun 10 2004 Diamond Shannon 7f Standard Southwell Handicap F 64
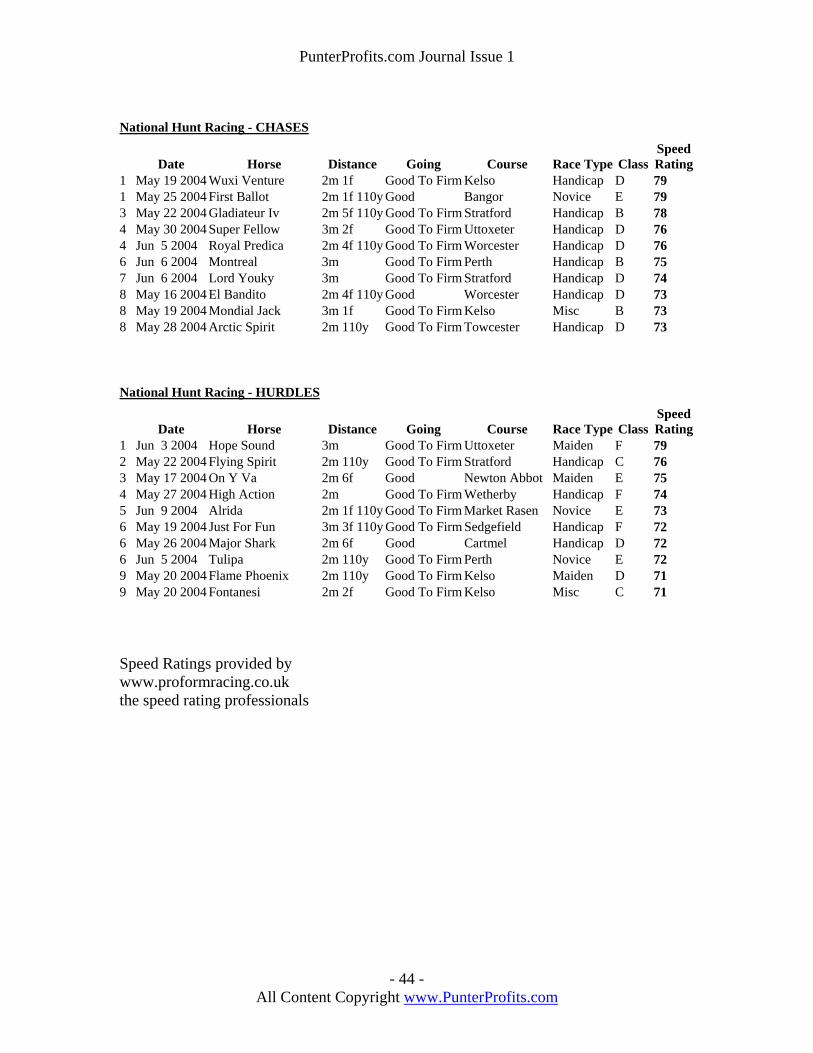
PunterProfits.com Journal Issue 1
- 44 - All Content Copyright www.PunterProfits.com
National Hunt Racing - CHASES
Date Horse Distance Going Course Race Type Class Speed Rating
1 May 19 2004 Wuxi Venture 2m 1f Good To Firm Kelso Handicap D 79 1 May 25 2004 First Ballot 2m 1f 110y Good Bangor Novice E 79 3 May 22 2004 Gladiateur Iv 2m 5f 110y Good To Firm Stratford Handicap B 78 4 May 30 2004 Super Fellow 3m 2f Good To Firm Uttoxeter Handicap D 76 4 Jun 5 2004 Royal Predica 2m 4f 110y Good To Firm Worcester Handicap D 76 6 Jun 6 2004 Montreal 3m Good To Firm Perth Handicap B 75 7 Jun 6 2004 Lord Youky 3m Good To Firm Stratford Handicap D 74 8 May 16 2004 El Bandito 2m 4f 110y Good Worcester Handicap D 73 8 May 19 2004 Mondial Jack 3m 1f Good To Firm Kelso Misc B 73 8 May 28 2004 Arctic Spirit 2m 110y Good To Firm Towcester Handicap D 73 National Hunt Racing - HURDLES
Date Horse Distance Going Course Race Type Class Speed Rating
1 Jun 3 2004 Hope Sound 3m Good To Firm Uttoxeter Maiden F 79 2 May 22 2004 Flying Spirit 2m 110y Good To Firm Stratford Handicap C 76 3 May 17 2004 On Y Va 2m 6f Good Newton Abbot Maiden E 75 4 May 27 2004 High Action 2m Good To Firm Wetherby Handicap F 74 5 Jun 9 2004 Alrida 2m 1f 110y Good To Firm Market Rasen Novice E 73 6 May 19 2004 Just For Fun 3m 3f 110y Good To Firm Sedgefield Handicap F 72 6 May 26 2004 Major Shark 2m 6f Good Cartmel Handicap D 72 6 Jun 5 2004 Tulipa 2m 110y Good To Firm Perth Novice E 72 9 May 20 2004 Flame Phoenix 2m 110y Good To Firm Kelso Maiden D 71 9 May 20 2004 Fontanesi 2m 2f Good To Firm Kelso Misc C 71 Speed Ratings provided by www.proformracing.co.uk the speed rating professionals
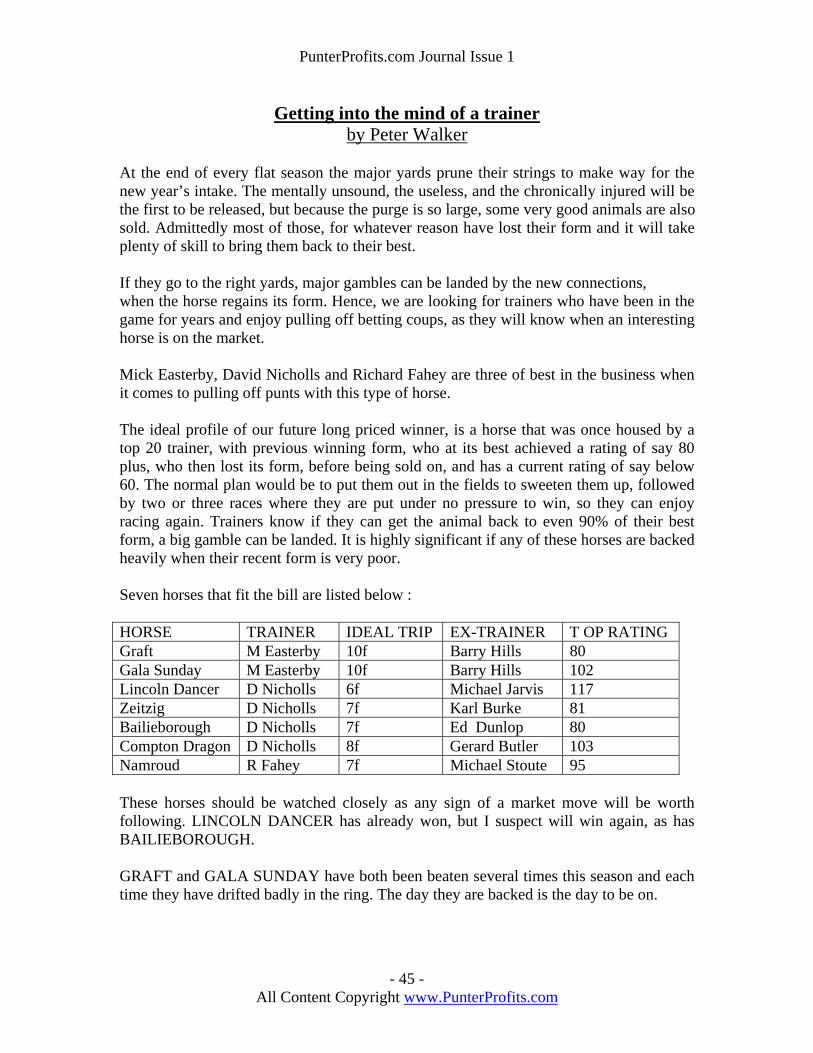
PunterProfits.com Journal Issue 1
- 45 - All Content Copyright www.PunterProfits.com
Getting into the mind of a trainer by Peter Walker
At the end of every flat season the major yards prune their strings to make way for the new year’s intake. The mentally unsound, the useless, and the chronically injured will be the first to be released, but because the purge is so large, some very good animals are also sold. Admittedly most of those, for whatever reason have lost their form and it will take plenty of skill to bring them back to their best. If they go to the right yards, major gambles can be landed by the new connections, when the horse regains its form. Hence, we are looking for trainers who have been in the game for years and enjoy pulling off betting coups, as they will know when an interesting horse is on the market. Mick Easterby, David Nicholls and Richard Fahey are three of best in the business when it comes to pulling off punts with this type of horse. The ideal profile of our future long priced winner, is a horse that was once housed by a top 20 trainer, with previous winning form, who at its best achieved a rating of say 80 plus, who then lost its form, before being sold on, and has a current rating of say below 60. The normal plan would be to put them out in the fields to sweeten them up, followed by two or three races where they are put under no pressure to win, so they can enjoy racing again. Trainers know if they can get the animal back to even 90% of their best form, a big gamble can be landed. It is highly significant if any of these horses are backed heavily when their recent form is very poor. Seven horses that fit the bill are listed below : HORSE TRAINER IDEAL TRIP EX-TRAINER T OP RATING Graft M Easterby 10f Barry Hills 80 Gala Sunday M Easterby 10f Barry Hills 102 Lincoln Dancer D Nicholls 6f Michael Jarvis 117 Zeitzig D Nicholls 7f Karl Burke 81 Bailieborough D Nicholls 7f Ed Dunlop 80 Compton Dragon D Nicholls 8f Gerard Butler 103 Namroud R Fahey 7f Michael Stoute 95 These horses should be watched closely as any sign of a market move will be worth following. LINCOLN DANCER has already won, but I suspect will win again, as has BAILIEBOROUGH. GRAFT and GALA SUNDAY have both been beaten several times this season and each time they have drifted badly in the ring. The day they are backed is the day to be on.
PunterProfits.com Journal Issue 1
- 46 - All Content Copyright www.PunterProfits.com
Another angle to consider is at the other end of the training spectrum. The new trainer who is eager to make an impression. Mark Wallace was head lad with Mick Channon before setting up on his own in Newmarket. Ex-head lads need to make an early impact when they start off, or they will soon struggle to attract owners to the yard. Winners and successful punts for their new owners are vital to boost confidence so watch out for two horses listed below : 1. SOLDIER ON was rated 87 at one stage, when trained by Channon, and now racing off a mark of 70. 2. NOBLE NICK was rated 83 at his best, before coming to Mark's yard from the David Nicholls stable, and is now currently rated 65. Wallace was involved in a few betting controversies in 2003 and it suggests that he is following a pattern where he is trying to land punts to keep his owners happy.
PunterProfits.com Journal Issue 1
- 47 - All Content Copyright www.PunterProfits.com
Biorhythms in Racing by Alex Rouse I contend that Racehorses run to a cycle of days and that the cycle continually repeats. However, I need to start this article in another arena. Firstly, let me state that I do not hold with the theory that claims daily lives are significantly affected by rhythmic cycles, popularly known as biorhythms. I am hoping you will be vaguely familiar with these biorhythms. If not please forgive me for not explaining the background in more detail. Unfortunately, there is no serious scientific evidence that supports a 23 day physical cycle or a 28 emotional cycle etc. The theory and associated dates were conjured up more than a century ago by the German numerologist Wilhelm Flies supported by Sigmund Freud. I cannot buy into the proposition people having the same birth date will universally be subject on certain dates throughout their lives to the same influence of being in a positive or negative state, and experiencing special strengths or special weaknesses. The theory also requires that from birth the first quarter of any of these cycles in the sine wave detail will ascend before peaking, and then moving into a descent before once again rising and then repeating. Why should all such cycles start in the ascendancy? If you are reading this article you will likely be a racing fan, and as such will probably have heard of “the bounce”. It is an American import used to explain when a horse’s form fails miserably following a lifetime best run and having to run again within a few weeks of that best run. Although the jury is still out on its worth, “the bounce” led me to further reading of this phenomenon. American Handicapping books are not the easiest to digest, however, I did get the sense in the spaghetti of handicapping Thoroughbreds and Quarter Horses that forces, (until now not investigated), are at work, and that racehorses may be subject to an influence of a Circadian (daily) rhythm. Having already been fascinated with traditional biorhythms I now paradoxically turned to that theory to borrow the graph detail to fit a unique racehorse scenario. I decided to construct a biorhythmic theory where each runner would be allotted a personal cycle. The number of days in any cycle would be determined according to plotting good racecourse performances as indicated by Official ratings or Racing Post Ratings with their associated race dates for these performances. The resultant graph is a dynamic interpretation, predicting possible states of % highs or lows of physical performances for any given date. I had hoped to automate a system so that meaningful data might throw more light on the bounce theory and so I could use the empirical findings to aid form study. Unfortunately, I have not been able to automate, but I have managed to build a useful, spreadsheet. Armed with the foaling dates and the lifetime form, I take the best three performances, determined by using Official or Racing Post Ratings, for each runner (best two performances when form is limited). I use the previous two years form to produce a graph that will show the complete cycle associated with these best performances and the current race being analysed. Taking a mean of the best three performances and having regard for any lifetime best rating that may not come within the previous two years, it is

PunterProfits.com Journal Issue 1
- 48 - All Content Copyright www.PunterProfits.com
possible to plot a track whose axis has dates and ratings, recognising the best performances as high points in the graph detail. I expect everyone is familiar with the shape of waveform that is commonly used in these graphs. They move in a repeating fashion having regular highs, and lows according to certain dates in their cycle. Regardless of how many days cycle is determined for the particular runner, the cycle will have +100% as its peak and –100% as its lowest point. Each runner will be unique with a variation between runners in the number of day’s cycle that is determined by the previous good performance dates and periods between. Poor performances are disregarded for the purposes of plotting a track because there are a myriad of reasons why a performance may be poor. Quite possibly, a runner may have been in a + period of cycle but running on a surface totally unsuited etc. On the other hand, the best performances are only achieved when the runner will be in a +% state. Although, even when best performances to date are returned it cannot be assumed that these are the optimum. Obviously, two and three year olds will be open to more improvement than older campaigners. Indeed, as more form becomes available the shape of the waveform for that runner will likely change somewhat in recognition if new best performances are achieved. Older runners are a more reliable yardstick. Albeit that the form of the previous two years is that which is plotted, there is scope to moderate in recognising the runner’s lifetime high rating if the mean plotting should tend to this upper. Because the cycles are calculated individually, the sex of the runner is automatically considered. Findings to date seem to be recognising a longer cycle for older runners but there is insufficient data to conclude any difference in the cycles between colts and fillies. Whilst the sine wave track is plotted against a cycle of days it is absolutely no use unless we know where the analysed race day fits into this cycle. This is done by totaling the number of days since the foaling date for the particular runner, with the date of the actual race and then dividing by that runner’s pre determined cycle to set the position in the cycle of days. It is then possible to cross the race day line in the graph with the sine wave to determine the position for this date. The resultant position should be read off against the scale in the graph and will be noted as being somewhere in the range between +100% and –100%. Although it is possible to simply use the raw % figure to determine which runner is “best in”, the race type does need some consideration. Handicaps where the horses are theoretically weighted by the professional handicappers to finish in line, need no more than to apply the highest +% to adjudge which runner holds the advantage for this particular race. Races other than handicaps will have runners of differing ability not weighted to theoretically finish together. In these races the highest +% will give an advantage, but if the runner in question does not have the ability to beat others in the race, the best that can happen is that our +% runner will run close to its personal best. In non handicap races I apply a scale to relate the % to lbs.

PunterProfits.com Journal Issue 1
- 49 - All Content Copyright www.PunterProfits.com
Looking back over the above paragraphs I now realise that the theory and the mechanics may appear somewhat complicated. I did not intend this. In fact, I have consciously only detailed what I thought was necessary to give an outline as to Biorhythms in Racing. In my next article I will update you with how results are progressing. I will also be able to devote more space to comments on past races from a biorhythm perspective. Hopefully, I will also be able to forecast some future winners and lays.
PunterProfits.com Journal Issue 1
- 50 - All Content Copyright www.PunterProfits.com
Betting Exchanges – It gets even better! by Neil Dawkins
Punters have “never had it so good” is constantly heard within horse racing circles, and I think that is probably true. Betting exchanges generally offer better prices than traditional bookmakers, particularly if you looking to back horses with odds above 4-1. In today’s market I would never dream of backing a horse without first checking the price available on the exchanges, as I am confident they will offer the best value. With an average of 10 to 20% bigger prices on offer for the backer, or the option to lay that favourite you have always thought was overrated, without doubt Betting Exchanges are giving the best value to Punters ever. Surely the only service they do not offer, is telling you which horse is actually going to win the race ………… or maybe they do? My research has uncovered some very interesting information indicating that Exchanges do actually provide a profitable System to follow! For example in March, I fancied a horse called Shirley Oaks in the 4.30 at Lingfield which was available with all bookmakers at 5-1. (The price available with all the bookmakers is known as the board price). When I logged on to Betfair I was surprised to see if was trading at 5.6 (just over 9-2), and there was significant money to back the horse below the widely available 5-1. I wondered at the time if this “support” indicated that the market “knew” something! I decided to back Shirley Oaks at 5-1 and was very happy to see it finish well to win by ¾ of a length. This got me thinking, why would anyone back a horse on the Exchanges at a shorter price than generally available with all Bookmakers? Obviously some small punters probably cannot be bothered to phone their bookie to put £5 on, to gain 0.2 of a point, but if you are looking to wager £100+ surely you would not take a lesser price on the Exchanges. I decided to carry out some research on horses trading at a smaller price on the Exchanges than the board price. (I have made no allowance for Exchange commission, so the Exchange return would actually be less).To clarify this, the equivalent of a horse at a board price of 4-1, would be 5.0 on the Exchange. I decided to set some “guide lines” to limit my “selections” : 1. Flat racing only. 2. Do not back any horse above 9-1 or below 5-2. 3. The “Back” price must be at least 0.2 points below the comparable board price. 4. No account is taken of any “Early Prices” during the day. I started the research by opening two sites on my computer, one being a betting exchange site, in my case Betfair, and the other a Bookmaker site ideally one who you have an

PunterProfits.com Journal Issue 1
- 51 - All Content Copyright www.PunterProfits.com
internet account with. If you do not have any internet accounts, you will still have time to place any bets by phone. With most races the opening show is available about 5 to10 minutes before the off, and this is where you need to start the comparison. Using my “guidelines” I am looking to find any horse that is “trading” at a lower price on Betfair than generally available with the Bookmakers. I do this by simply switching between the 2 sites I have open on my computer. It is also important that you click on the refresh icon on the sites to ensure you are seeing the latest information. I believe most sites only automatically update in the region of every 30 seconds which is too long. If and when you find a horse that is trading below the board price by at least 0.2 points, you need to confirm that there are 2 other key factors in place before deciding to back the horse. 1. That the price being “laid” is within 0.2 Points of this price. e.g. if the Best Price to back is 5.3, the price requested by the backer must be a maximum of 5.5. Any bigger and the market is not close enough to represent a true price. 2. That there is significant money in the “Lay” section of the horse you are looking at. What you are looking for is reasonable market support, so the odd £50 would not warrant a bet. From my research, I believe you need to see at least £800-1000 in the 3 “lay windows”, to warrant a bet. Once you have confirmed this simply get on to the Bookmaker and place a bet. I have included an example below to illustrate my point from a race at Lingfield in April. The horse I was interested in was Ballygriffin Kid, who was available with the Bookmakers at 11/4 but trading below that on Betfair at 3.55. As you will see from my “Key Factors” : 1. The horse’s price is below the available board price. 2. The lowest lay is within 0.2 points, in this case 0.05 points. 3. There is £1293 across the 3 “lay” windows. Under these circumstances I would place a bet with the Bookmaker as soon as I could.

PunterProfits.com
- 52 - All Content Copyright www.PunterProfits.com
Journal Issue 1 Page from Betfair Ling 13th May - 18:00 7f Band Stks
View P&L Total selections: 4
i Sea Jade
2.8
£1288 2.82£870
2.84 £123 2.86
£440 2.88
£1275 2.9
£1370
i Rathmullan
4.8 £504
4.9 £606
5 £51 5.1
£200 5.2
£140 5.3
£105
i Ballygriffin Kid
3.45 £137
3.50£160
3.55 £158 3.60
£628 3.65£202
3.70£463
i Newcorr 5.3 5.5 5.6 5.7 5.8 5.9
Page from Coral Online
6.00 Lingfield Refresh
In The Event Of Non Runners Rule 4 May Apply Win Only
WINNER FORECAST
No. Selection Odds Current odds
Each Way Stake
4 SEA JADE 13/8 » 7/4
-
2 BALLYGRIFFIN KID 3/1 » 11/4
-
1 RATHMULLAN 3/1 » 10/3
-
3 NEWCORR 4/1
-
Clear Selections Add to Slip Bet Now So what did I find? It did appear from my research that the Exchanges do “lead” the market, and when you see a horse is trading below its available board price, there is a very good chance it will shortly be dropping on the board. One item to note was that during my research, I noticed that a lot of the horses I backed did increase in price back towards the board price in the last 1-2 minutes before the race started. So really concentrate in the period leading up to the start. This is possibly caused by punters “laying off” a bet, having previously backed the horse at a bigger price.
PunterProfits.com Journal Issue 1
- 53 - All Content Copyright www.PunterProfits.com
So what did the research reveal? Horses Backed 46 Winners 18 Profit 54.0 points (at SP) Now by any stretch of the imagination this is an impressive return. Anyone betting at £20 per bet would have meant an outlay of £920, but they would have collected £2000, with a £1080 Profit. However, further detailed investigation of the statistics found that if I limited my bets to Banded races only the following results were achieved : Horses Backed 19 Winners 10 Profit 37.0 Points (At SP) Now I do not know if you are like me, but I could not care less whether the winner I back is in the Derby or a Banded race at Lingfield! What I am interested in is winners and more importantly profit. Another area that showed well from the analysis was by keeping the number of runners in each race to 9 or less. I recorded these results : Horses Backed 28 Winners 13 Profit 37.25 Points (at SP) However, one area where the system failed miserably was in Handicaps. This did surprise me, but the statistics seem to suggest that this “system” does not work as well in Handicap racing. Horses Backed 14 Winners 2 Profit -7.0 Points (at SP) So in conclusion, what have I found? In general terms the Betting Exchanges offer the best value, as I had to look at over 250 races with an average of 10 runners per race, to find 46 horses that were trading at less on the exchanges. I still do not know the reason that people place these bets on the Exchanges below the

PunterProfits.com Journal Issue 1
- 54 - All Content Copyright www.PunterProfits.com
available “board” price, although I am sure you could come up with as many theories as me. The main thing is that following these horses will make you a profit! Note : Limiting the betting to Banded races seems to be really profitable. Summary 1 Back horses trading below available board price. 2 Banded races and races with 9 or less runners seem best. 3 Be wary using this System in Handicaps. 4 Make sure a proper market has formed. 5 Ensure there is plenty of support for your horse. Next month I intend to study the notorious “drifters” on the Exchanges, just because a horse drifts from 7-4 to 7-2 should it be avoided like the plague, or is there a profit to be made in following these “overpriced” favourites ?

PunterProfits.com Journal Issue 1
- 55 - All Content Copyright www.PunterProfits.com
Subscribers Forecast Competition. £100 Prize Competition Race - The Wokingham Handicap - Ascot - 4.25 pm Saturday 19 June 2004 The aim of the competition is to correctly predict the first two home in the correct order. Email your predicated one - two horses to [email protected] Entries MUST be received by 4 pm on Saturday 19 June. For example if your prediction is that Red Rum will Win the Race with Shergar in Second place submit your entry as follows. 1. Red Rum 2. Shergar Each subscriber is allowed one attempt only! Please order your selections correctly. Remember your aim this week is to predict the first and second (in the correct order) from the Wokingham Handicap on Saturday June 19th. You will win £100 if you are the only winner. In the event of a tie, Punterprofits will advise of a tie breaker round to determine the sole winner. If we have no winners the pot will roll over to £200 next time. If you think you have won you need to stake your claim for the prize by emailing [email protected] Claims are to be received by 1.30 pm on Monday 21st June. Non Runner Clarification. As stated above only one entry is permitted per subscriber. However if your original entry contains a non runner, you are free to make a second entry. The replacement entry however still needs to be in prior to 4pm on Saturday. Good luck with the competition. Remember if you are not in, you can not win !