beurs stappenplan sessie 1
DESCRIPTION
Beurs Stappenplan: Sessie 1 (Stefaan Duchateau)TRANSCRIPT
1
EFFICIËNT VERMOGENSBEHEER
INLEIDEND KADER
Enkele Principes en Concrete Toepassingen
10/04/2023
[email protected]+32 474 977 464

2
Efficiënt Portefeuillebeheer
Oordeelkundige afweging van verwachte opbrengst en risico …“In a hole in the ground there lived a hobbit”
“Not a nasty, dirty, wet hole, filled with the ends of worms and an oozy smell, nor yet a dry, bare, sandy hole with nothing in it to sit down on or to eat: it was a hobbit-hole, and that means comfort …”

10/04/2023
3
Efficiënt Portefeuillebeheer
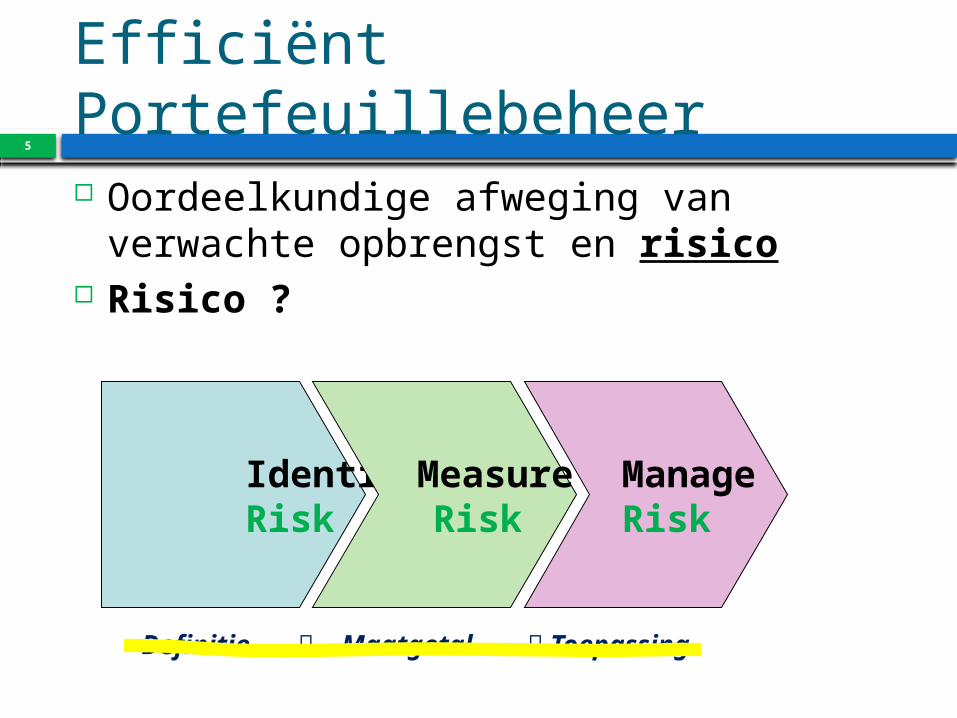
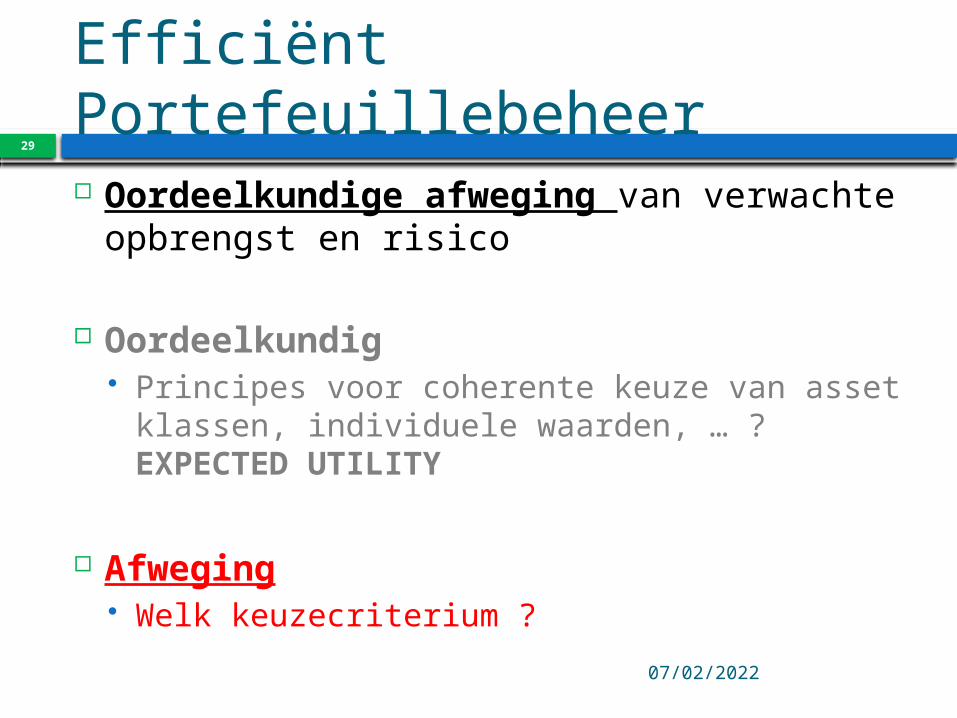
Oordeelkundige afweging van verwachte opbrengst en risico
Oordeelkundig Principes voor coherente keuze van asset
klassen, individuele waarden, … ?
Afweging Welk keuzecriterium ?

10/04/2023
4
Efficiënt Portefeuillebeheer
Oordeelkundige afweging van verwachte opbrengst en risico
Verwachte opbrengst ?Beknopte historische schets
Statistische interpretatieDynamische interpretatie
Model ?Actief portefeuillebeheer
5
Efficiënt Portefeuillebeheer
Oordeelkundige afweging van verwachte opbrengst en risico
Risico ?
Identify Risk
Measure Risk
Manage Risk
Definitie Maatgetal Toepassing
10/04/2023
6
Verwachte Opbrengst
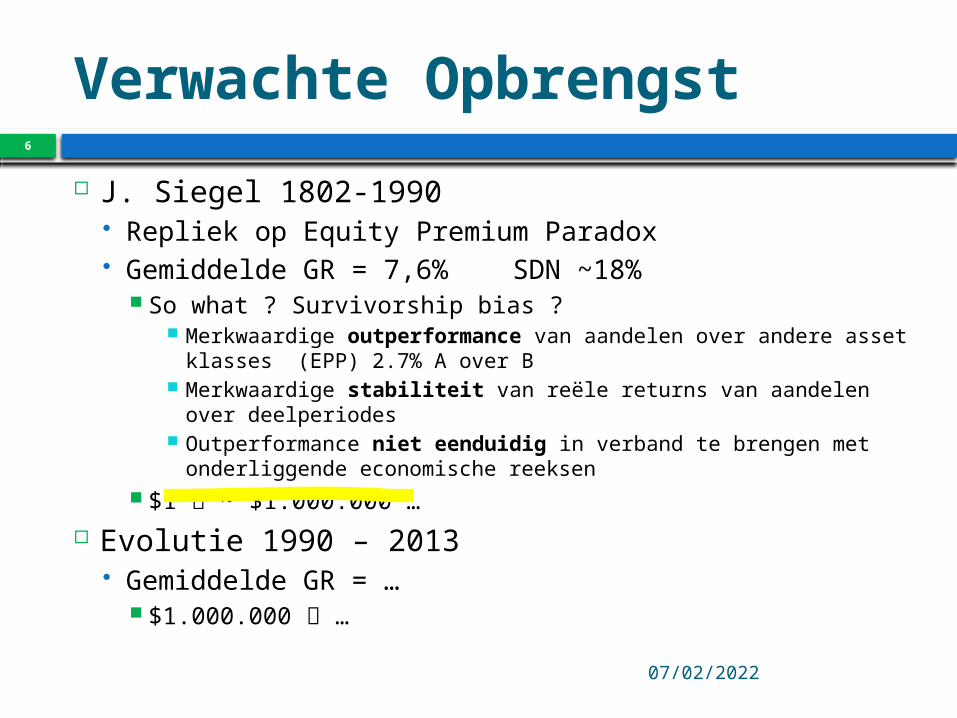
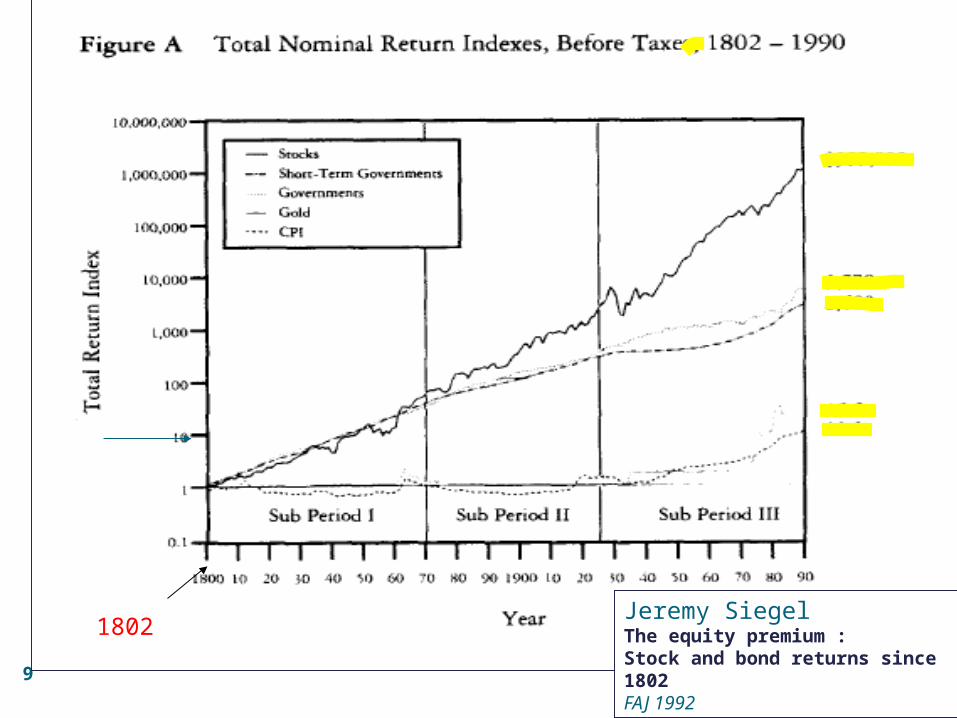
J. Siegel 1802-1990 Repliek op Equity Premium Paradox Gemiddelde GR = 7,6% SDN ~18%
So what ? Survivorship bias ? Merkwaardige outperformance van aandelen over andere
asset klasses (EPP) 2.7% A over B Merkwaardige stabiliteit van reële returns van aandelen over
deelperiodes Outperformance niet eenduidig in verband te brengen met
onderliggende economische reeksen $1 ~ $1.000.000 …
Evolutie 1990 – 2013 Gemiddelde GR = …
$1.000.000 …

Advanced Portfolio Management7
Nadien bestseller :Stocks for the long run
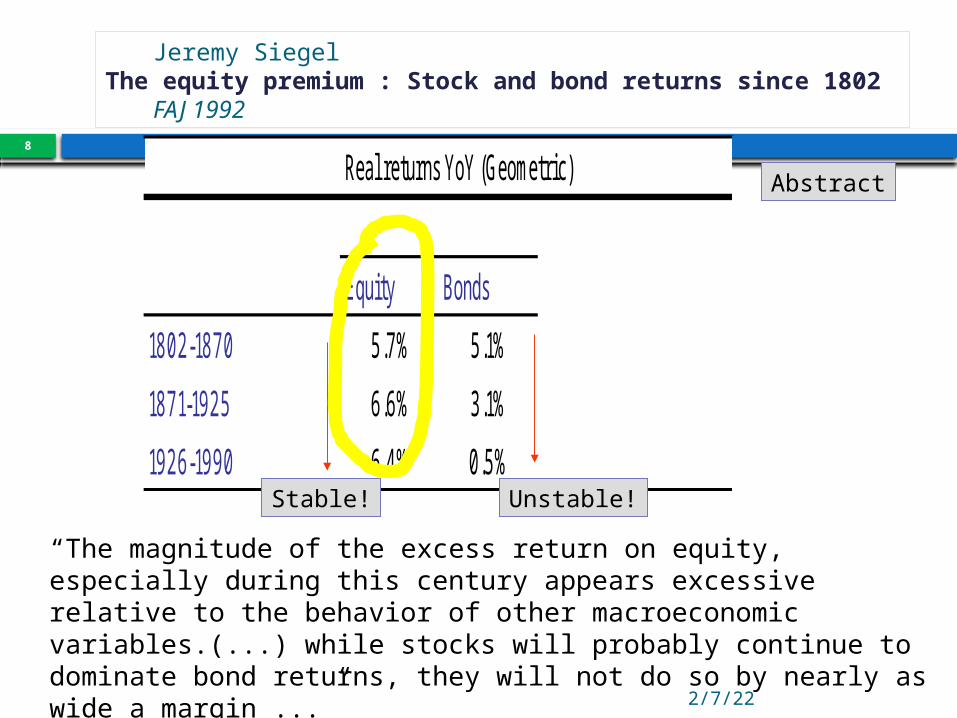
Jeremy SiegelThe equity premium : Stock and bond returns since 1802
FAJ 1992
Apr 10, 2023
8
Real returns YoY (Geometric)
Equity Bonds
1802-1870 5.7% 5.1%
1871-1925 6.6% 3.1%
1926-1990 6.4% 0.5%
“The magnitude of the excess return on equity, especially during this century appears excessive relative to the behavior of other macroeconomic variables.(...) while stocks will probably continue to dominate bond returns, they will not do so by nearly as wide a margin ...”
Abstract
Stable! Unstable!
Apr 10, 20239
Jeremy SiegelThe equity premium :Stock and bond returns since 1802FAJ 1992
1802
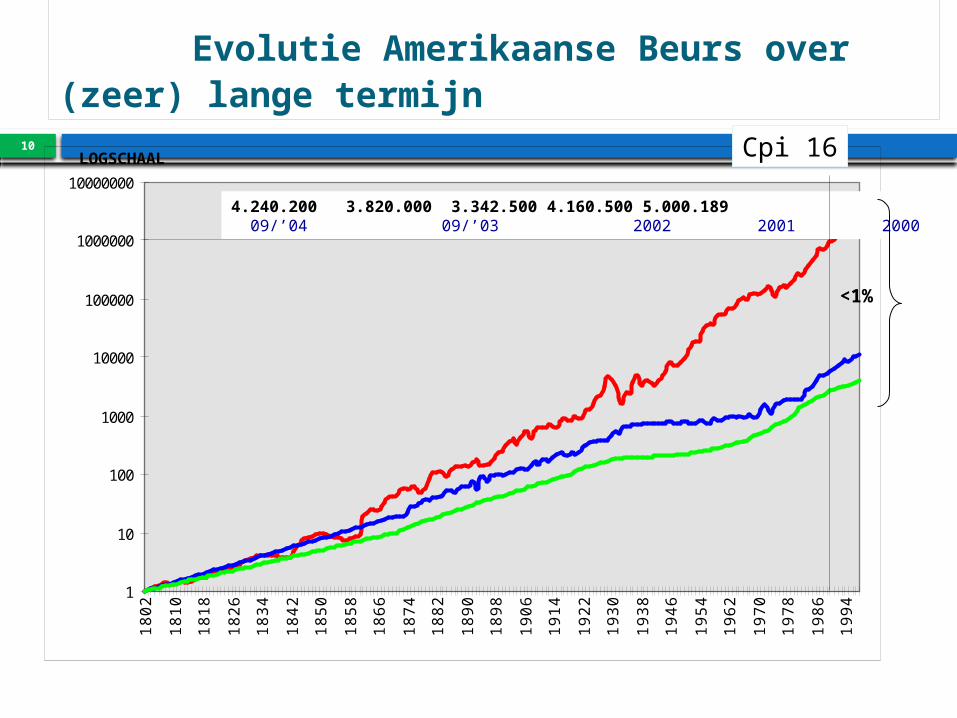
Evolutie Amerikaanse Beurs over (zeer) lange termijn
10
1
10
100
1000
10000
100000
1000000
10000000
1802
1810
1818
1826
1834
1842
1850
1858
1866
1874
1882
1890
1898
1906
1914
1922
1930
1938
1946
1954
1962
1970
1978
1986
1994
4.240.200 3.820.000 3.342.500 4.160.500 5.000.189 09/’04 09/’03 2002 2001 2000
LOGSCHAAL
<1%
Cpi 16
21
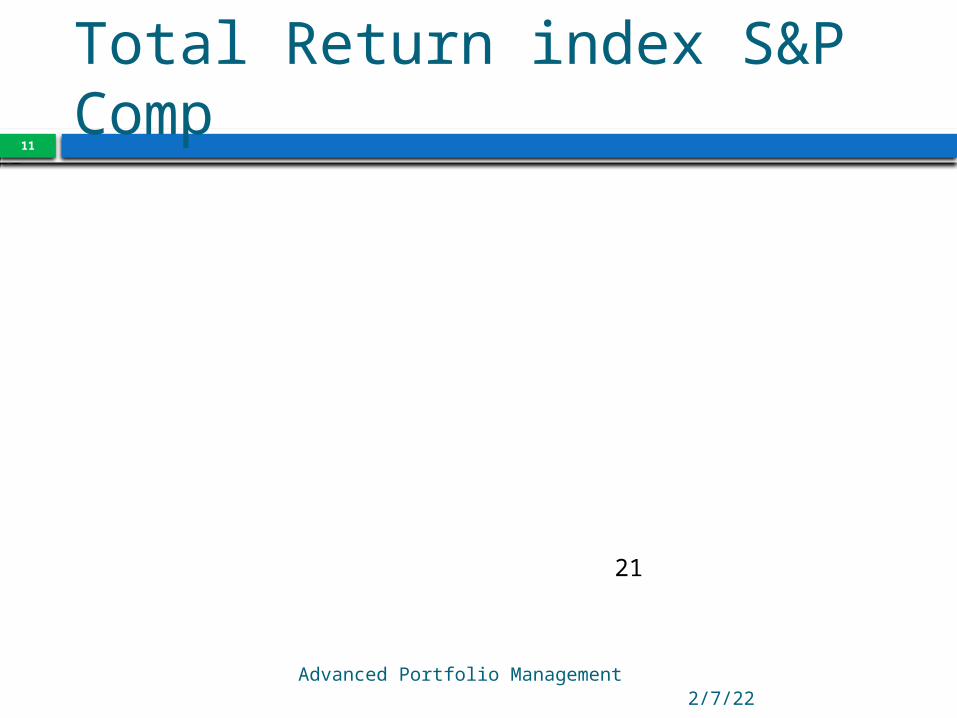
Total Return index S&P Comp
Apr 10, 2023
11
Advanced Portfolio Management
17/10/13919293949596979899000102030405060708091011120100200300400500600700800900S&P 500 COMPOSITE - TOT RETURN INDSource: Thomson Datastream
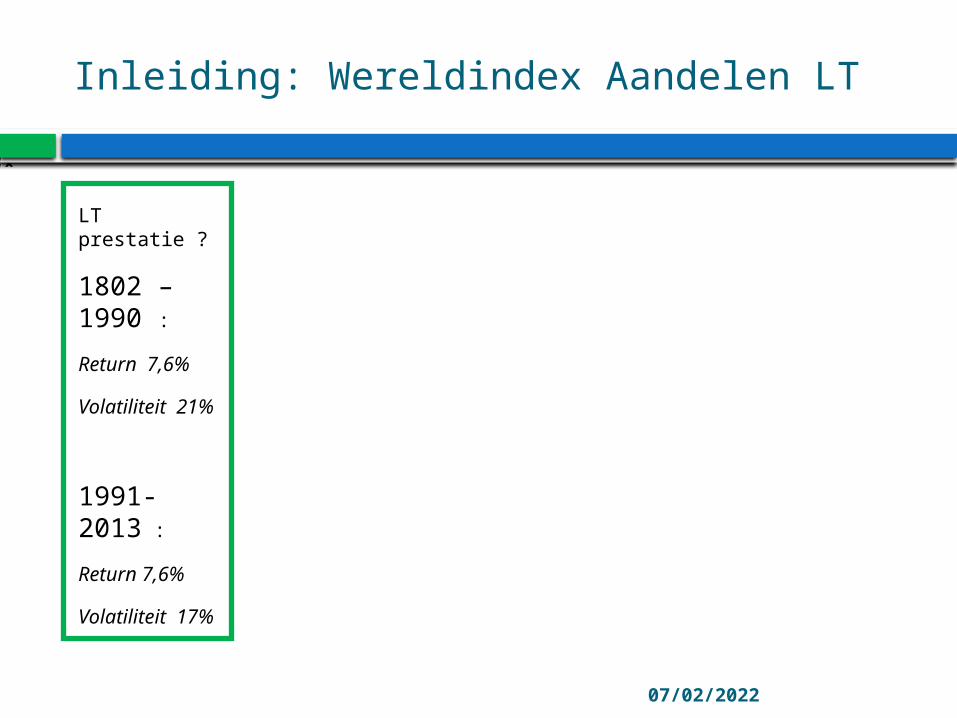
Inleiding: Wereldindex Aandelen LT
10/04/2023
LT prestatie ?
1802 –1990 :
Return 7,6%
Volatiliteit 21%
1991-2013 :
Return 7,6%
Volatiliteit 17%
17/10/13919293949596979899000102030405060708091011120100200300400500600700MSCI WORLD U$ - TOT RETURN IND (~E )Source: Thomson Datastream
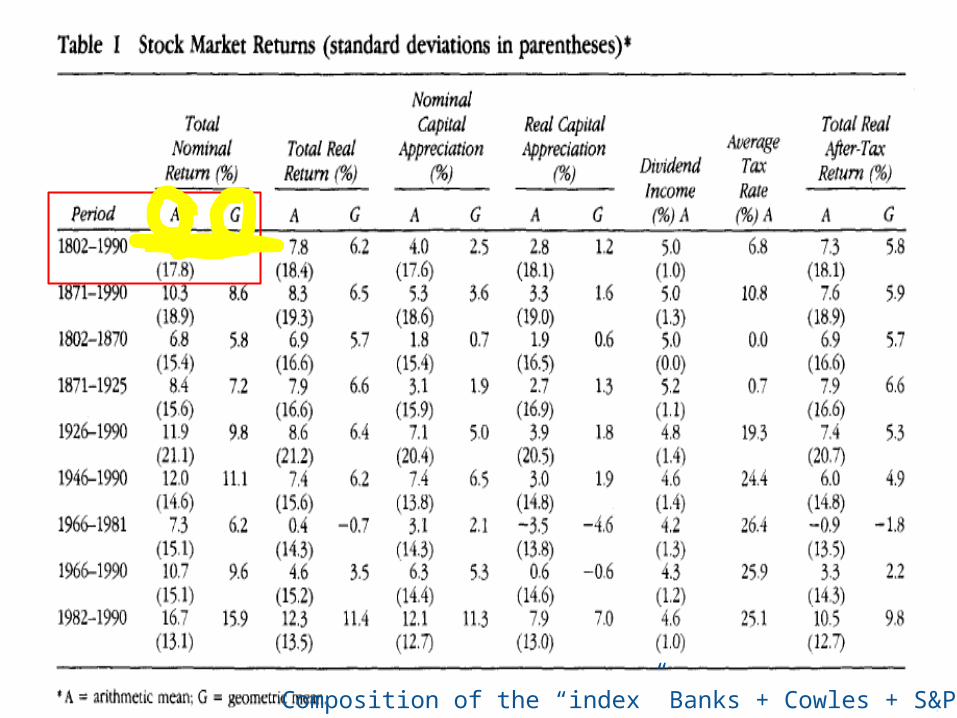
Apr 10, 2023Advanced Portfolio Management13Composition of the “index” Banks + Cowles + S&P
14
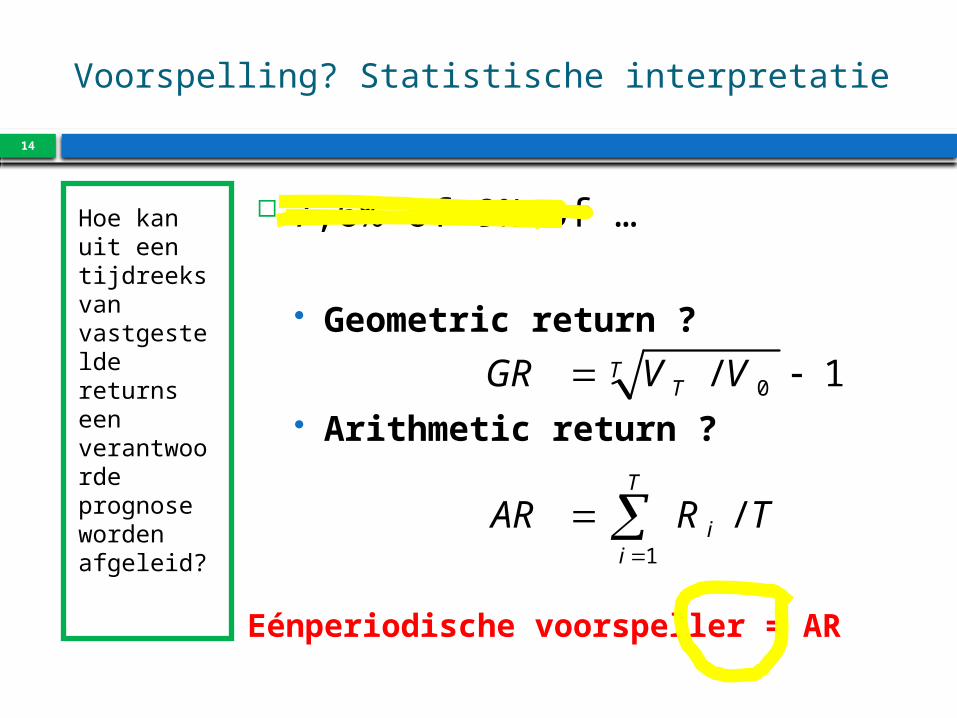
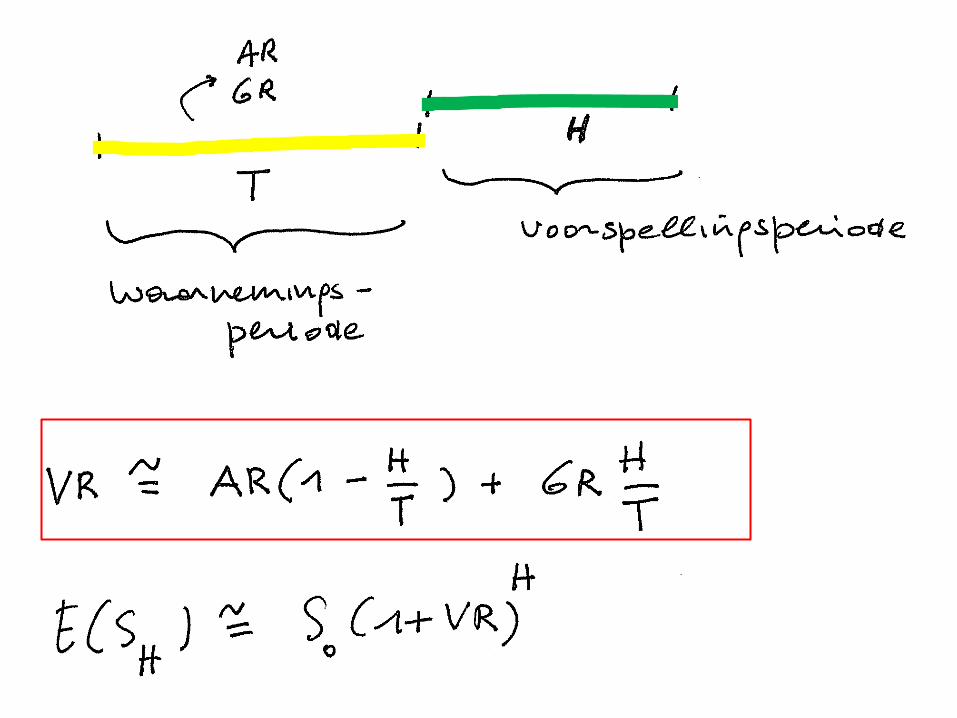
Voorspelling? Statistische interpretatie
Hoe kan uit een tijdreeks van vastgestelde returns een verantwoorde prognose worden afgeleid?
7,6% of 9% of …
Geometric return ?
Arithmetic return ?
TRAR
VVGR
T
ii
TT
/
1/
1
0
Eénperiodische voorspeller = AR
10/04/2023
15
10/04/2023
16
10/04/2023
17
18
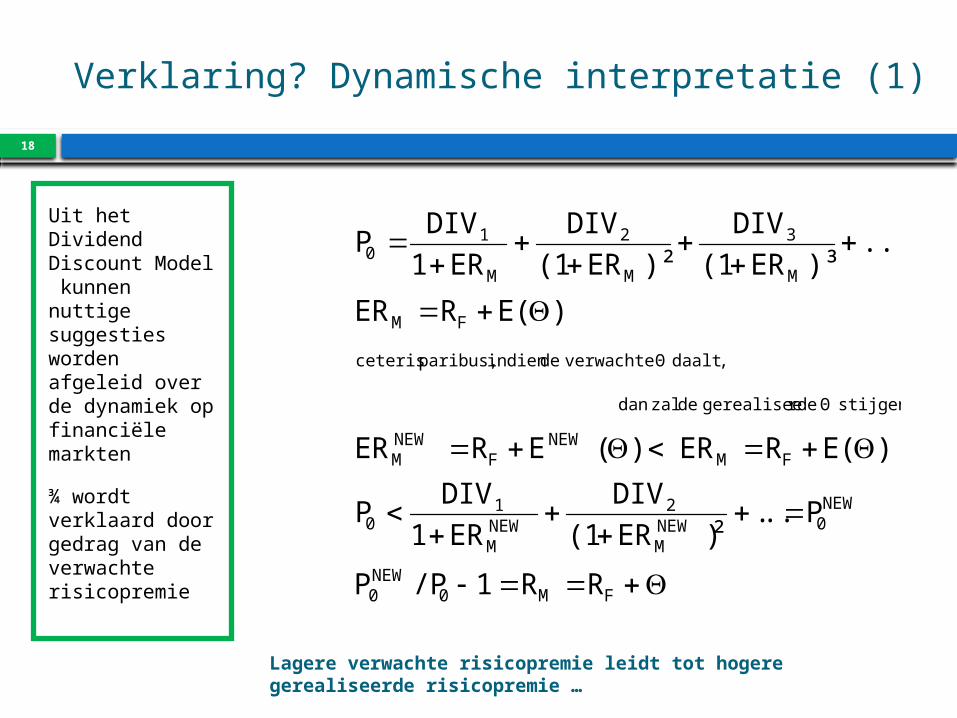
Verklaring? Dynamische interpretatie (1)
Lagere verwachte risicopremie leidt tot hogere gerealiseerde risicopremie …
Uit het Dividend Discount Model kunnen nuttige suggesties worden afgeleid over de dynamiek op financiële markten
¾ wordt verklaard door gedrag van de verwachte risicopremie
FM
NEW0NEW
M
2NEWM
10
FMNEW
FNEWM
stijgen Θ rdegerealisee de zal dan
daalt verwachte de indien paribus, ceteris
FM
M
3
M
2
M
10
RR
P..²ER(1
DIVER1DIV
P
)E(RER )(ERER
)E(RER
...)³ER(1
DIV)²ER(1
DIVER1
DIVP
1/PP 0NEW0
, Θ
.)
04:58 AM
19
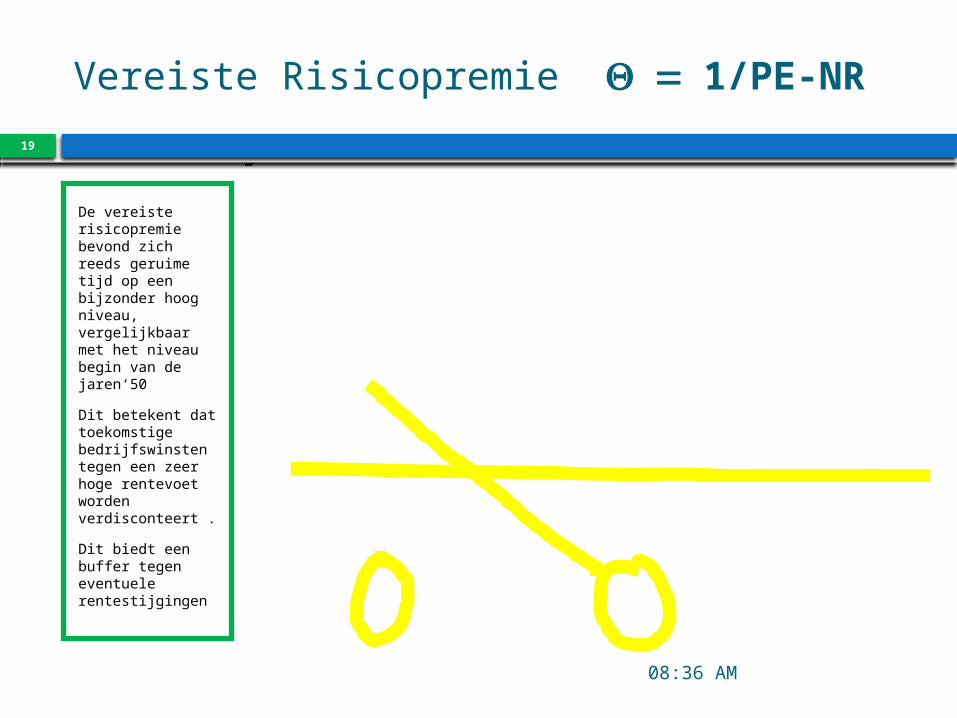
Vereiste Risicopremie = Q 1/PE-NR
De vereiste risicopremie bevond zich reeds geruime tijd op een bijzonder hoog niveau, vergelijkbaar met het niveau begin van de jaren‘50
Dit betekent dat toekomstige bedrijfswinsten tegen een zeer hoge rentevoet worden verdisconteert .
Dit biedt een buffer tegen eventuele rentestijgingen
100/@:USSP500(AF1PE)-0.6*AUSGVG1(RY)17/10/13838587899193959799010305070911-10123456789100/@:USSP500(AF1PE)-0.6*AUSGVG1(RY)Source: Thomson Datastream
10/04/2023
20
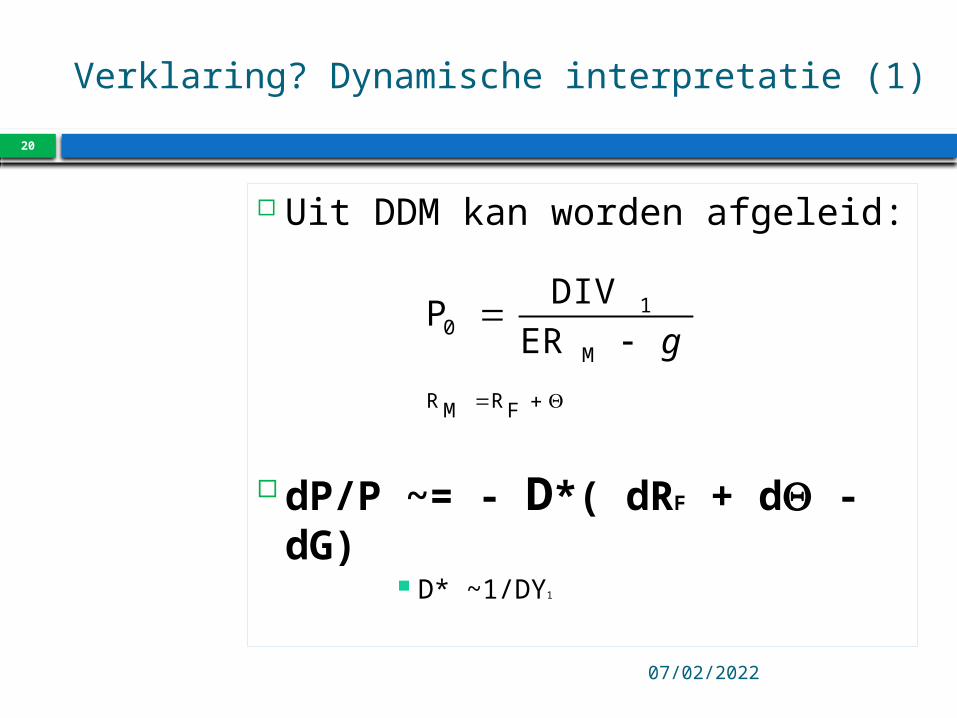
Verklaring? Dynamische interpretatie (1)
Uit DDM kan worden afgeleid:
dP/P ~= - D*( dRF + dQ - dG)
D* ~1/DY1
FRMR
M
10 ER
DIVP
g
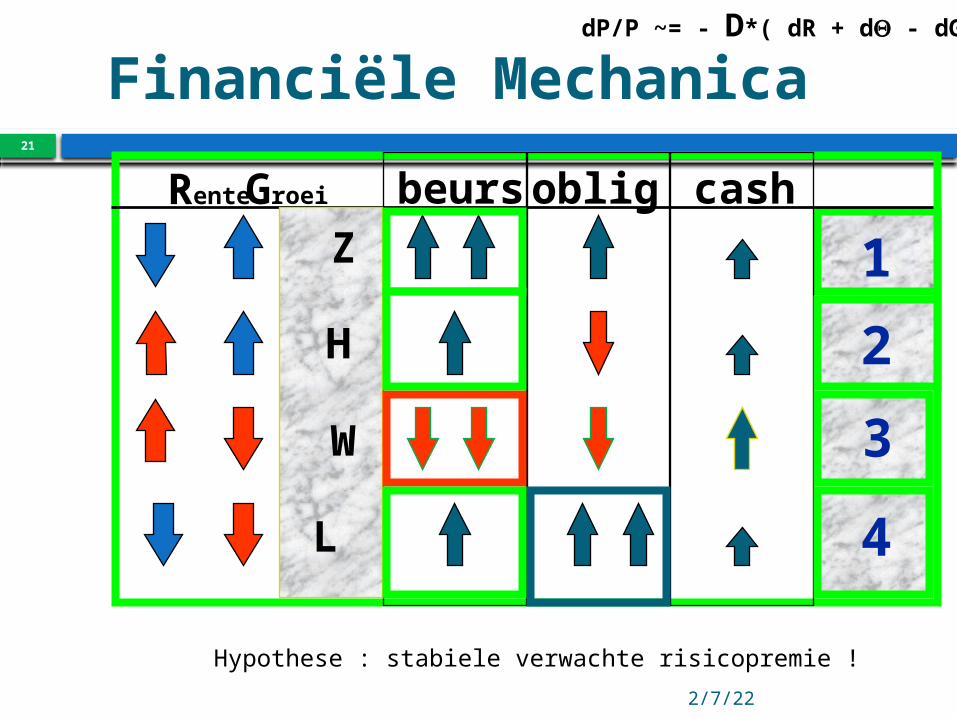
Financiële Mechanica
Apr 10, 2023
21
Rente Groei beursoblig cash
1
2
3
4
Z
H
W
L
Hypothese : stabiele verwachte risicopremie !
dP/P ~= - D*( dR + dQ - dG)
22
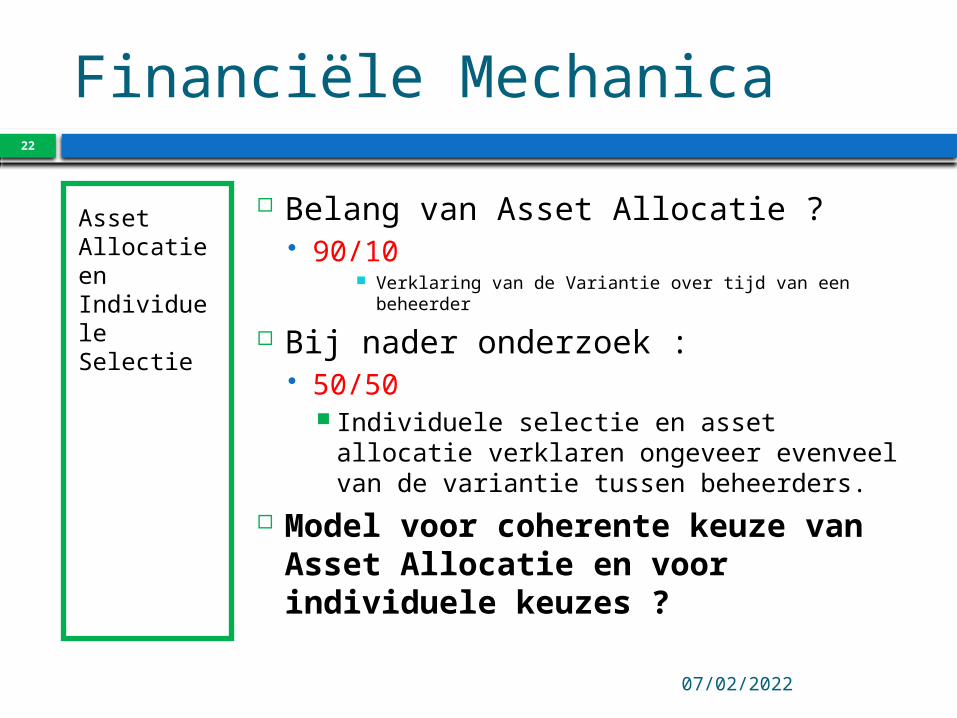
Financiële Mechanica
10/04/2023
Asset Allocatie en Individuele Selectie
Belang van Asset Allocatie ? 90/10
Verklaring van de Variantie over tijd van een beheerder
Bij nader onderzoek : 50/50
Individuele selectie en asset allocatie verklaren ongeveer evenveel van de variantie tussen beheerders.
Model voor coherente keuze van Asset Allocatie en voor individuele keuzes ?
23
Efficiënt Portefeuillebeheer
Oordeelkundige afweging van verwachte opbrengst en risico
?
24
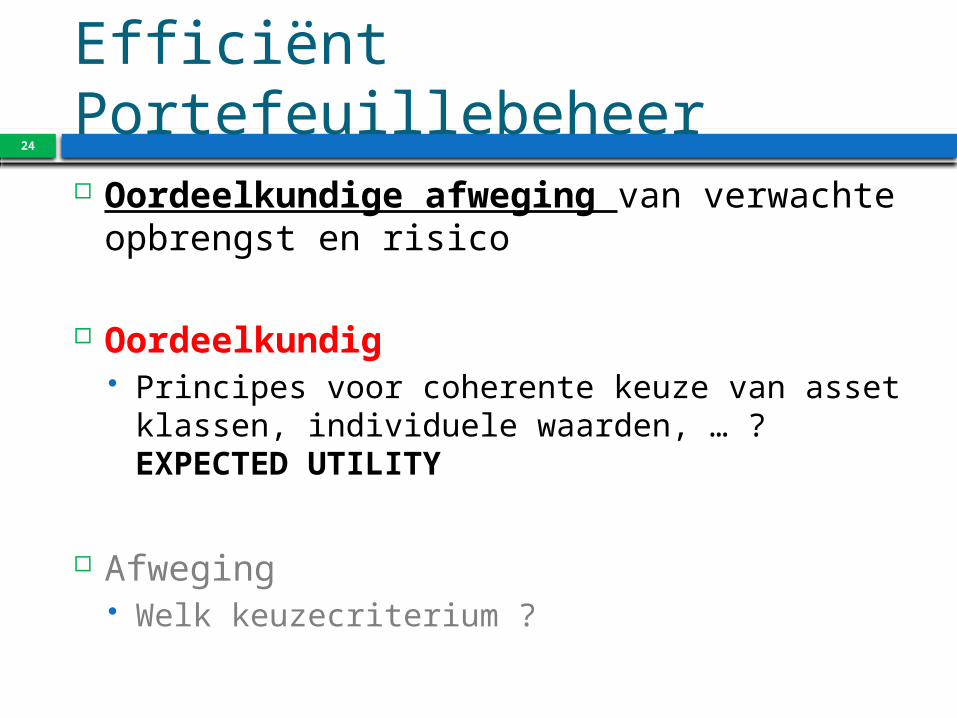
Efficiënt Portefeuillebeheer
Oordeelkundige afweging van verwachte opbrengst en risico
Oordeelkundig Principes voor coherente keuze van asset
klassen, individuele waarden, … ? EXPECTED UTILITY
Afweging Welk keuzecriterium ?
Apr 10, 202325
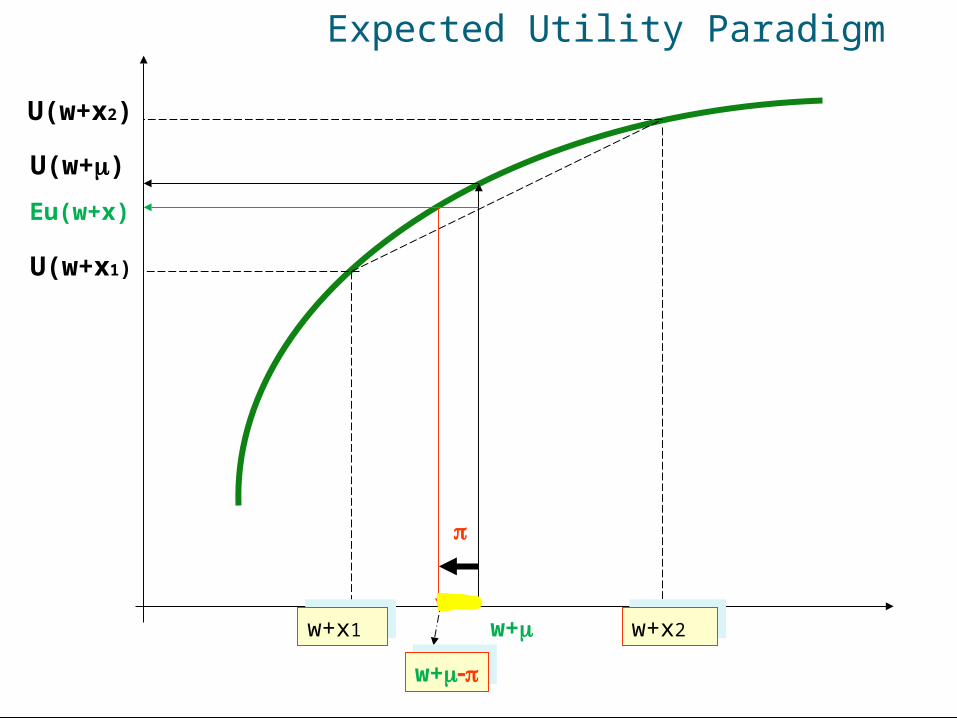
w+x1w+x1 w+x2w+x2
Expected Utility Paradigm
U(w+x2)
U(w+x1)
w+m
U(w+m)
Eu(w+x)
p
w+m-pw+m-p
Apr 10, 2023
26
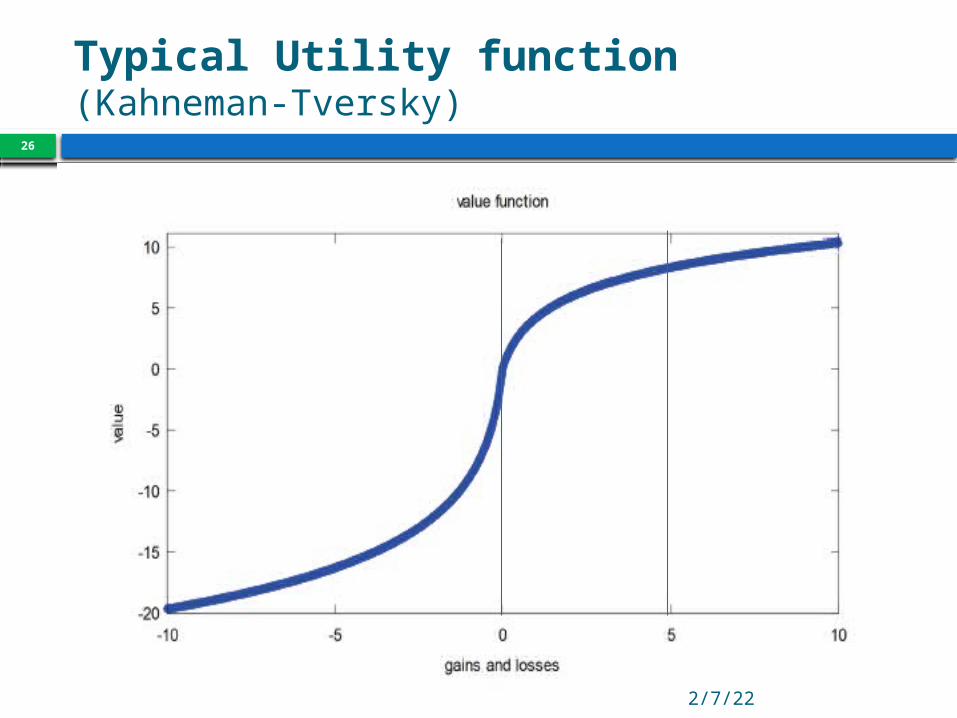
Typical Utility function (Kahneman-Tversky)
Apr 10, 2023
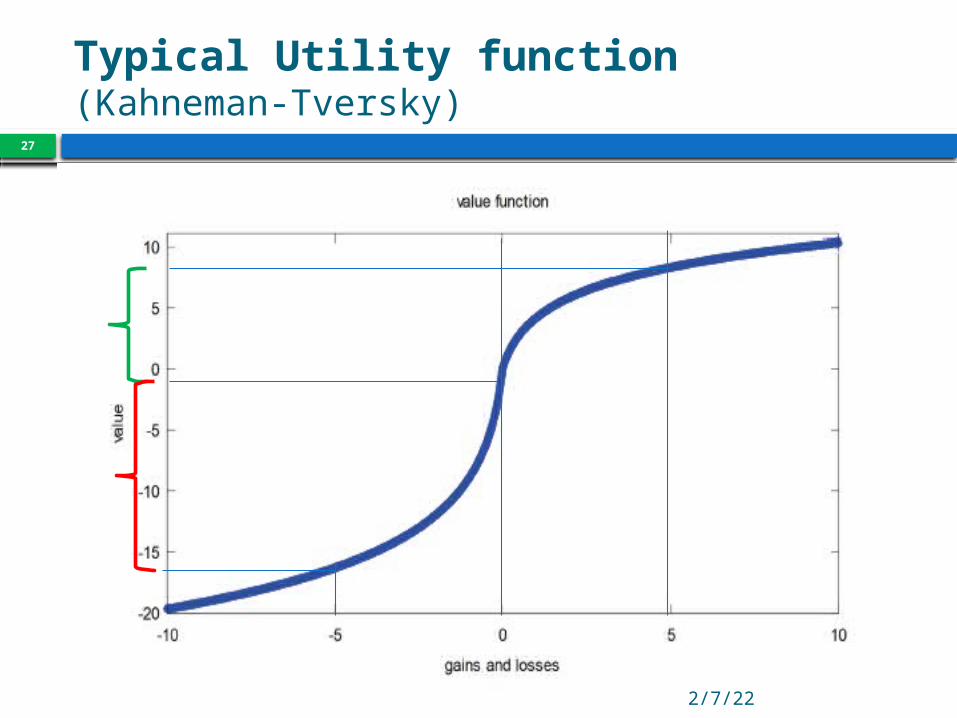
27
Typical Utility function (Kahneman-Tversky)
Apr 10, 2023
28
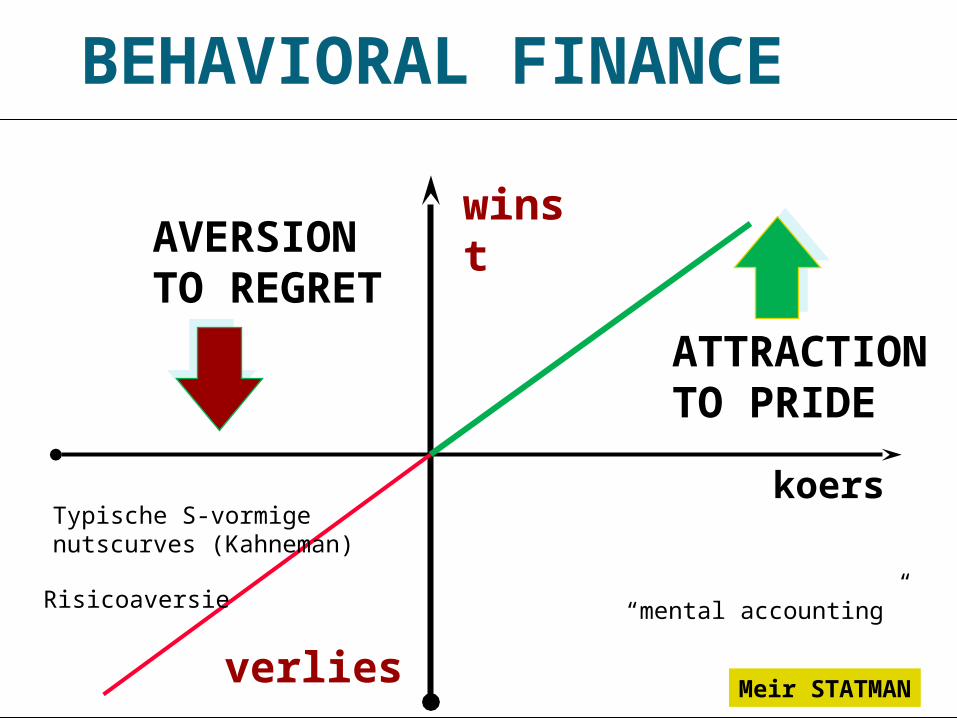
BEHAVIORAL FINANCE
koers
winst
verlies
AVERSIONTO REGRET
ATTRACTIONTO PRIDE
Meir STATMAN
Typische S-vormigenutscurves (Kahneman)
Risicoaversie “mental accounting”
10/04/2023
29
Efficiënt Portefeuillebeheer
Oordeelkundige afweging van verwachte opbrengst en risico
Oordeelkundig Principes voor coherente keuze van asset
klassen, individuele waarden, … ? EXPECTED UTILITY
Afweging Welk keuzecriterium ?
Apr 10, 202330
(.)'''6
³(.)''
2
²(.)~)~(
0)~(
(.)...'''6
)³~((.)''
2
)²~((.)')~((.)~)~(
(.))(
~
)...('''6
)³()(''
2
)²()(')()()(
uuuxwEu
xxE
uxxE
uxxE
uxxEuxwEu
uxwu
xwxwat
afat
afat
afataftf
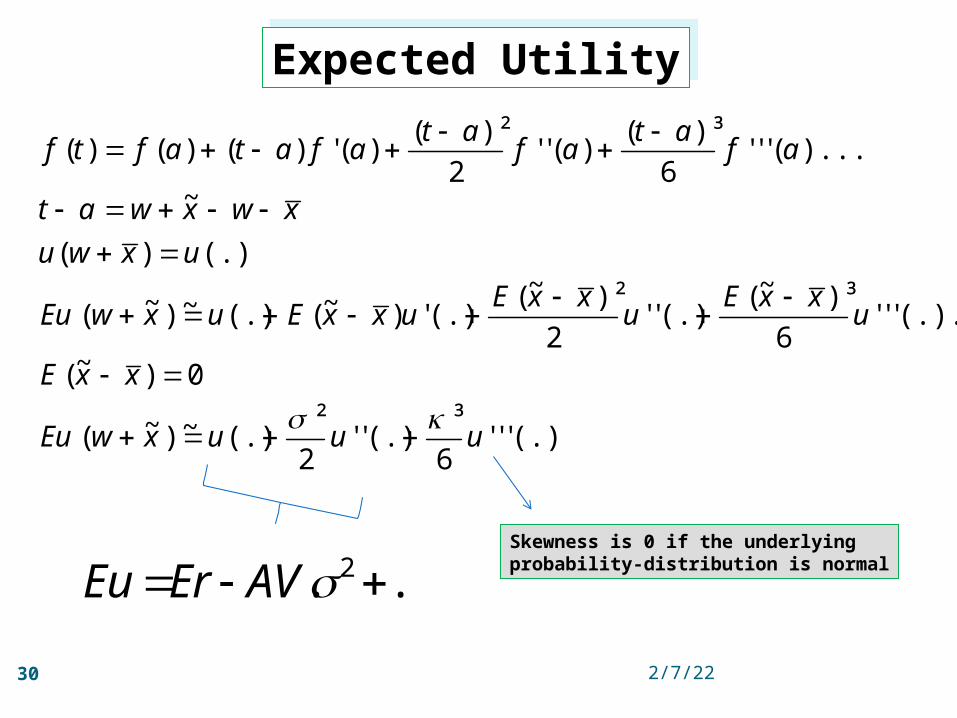
Expected UtilityExpected Utility
Skewness is 0 if the underlying probability-distribution is normal
.... 2 AVErEu
Apr 10, 2023
31
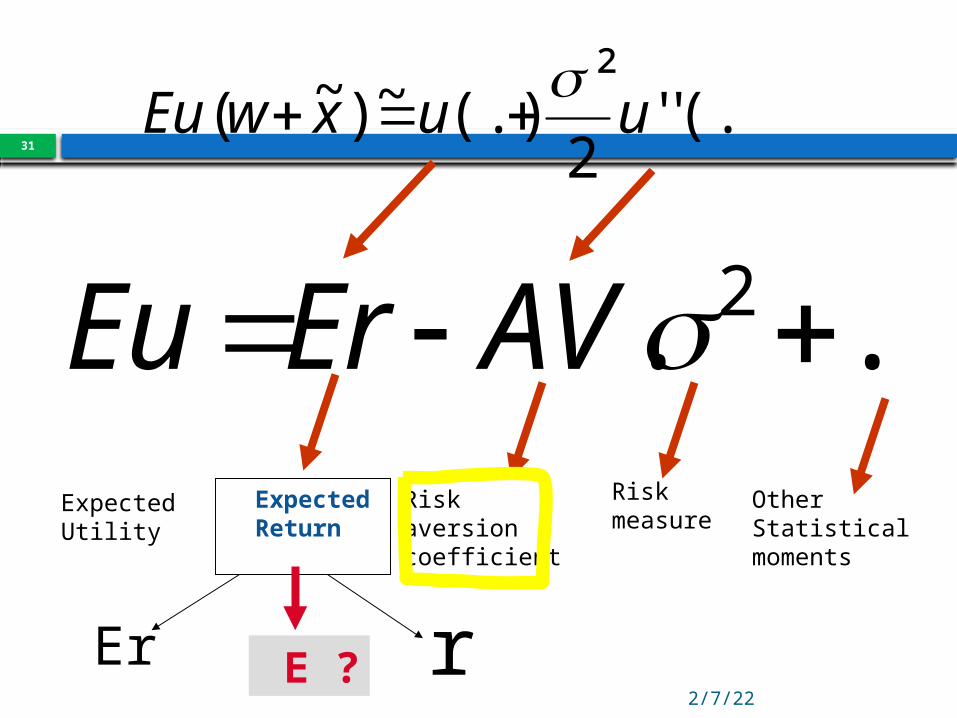
.... 2 AVErEuExpectedUtility
ExpectedReturn
Risk aversion coefficient
Riskmeasure
OtherStatisticalmoments
rEr E ?
(.)''2
²(.)~)~( uuxwEu
Apr 10, 2023
32
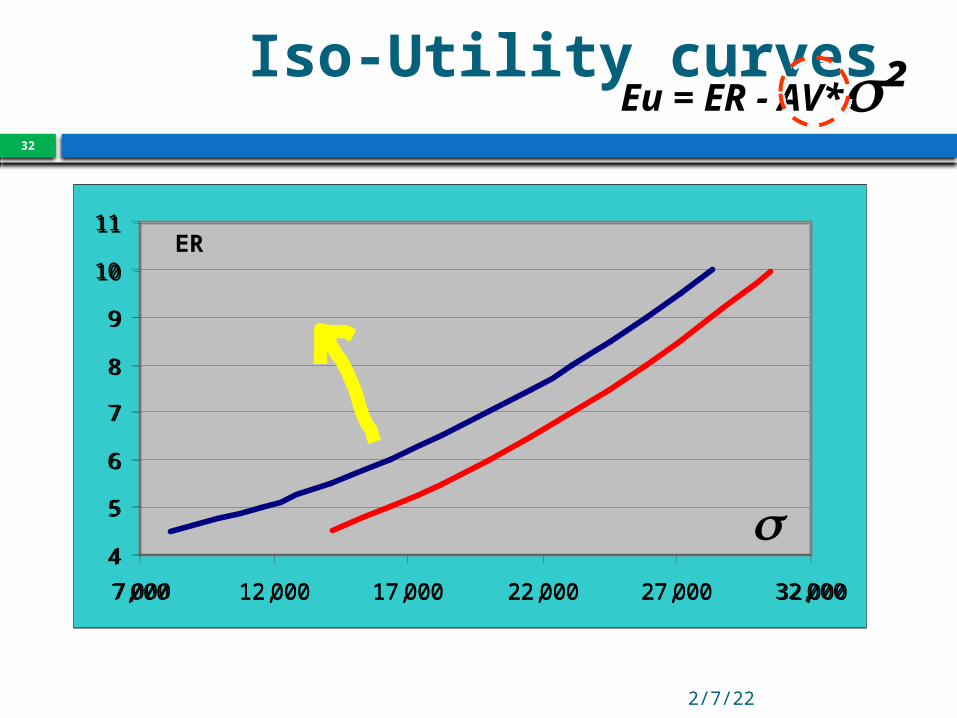
Iso-Utility curves
4
5
6
7
8
9
10
11
7,000 12,000 17,000 22,000 27,000 32,000
4
5
6
7
8
9
10
11
7,000 12,000 17,000 22,000 27,000 32,000
Eu = ER - AV*s²
ER
s
Apr 10, 202333
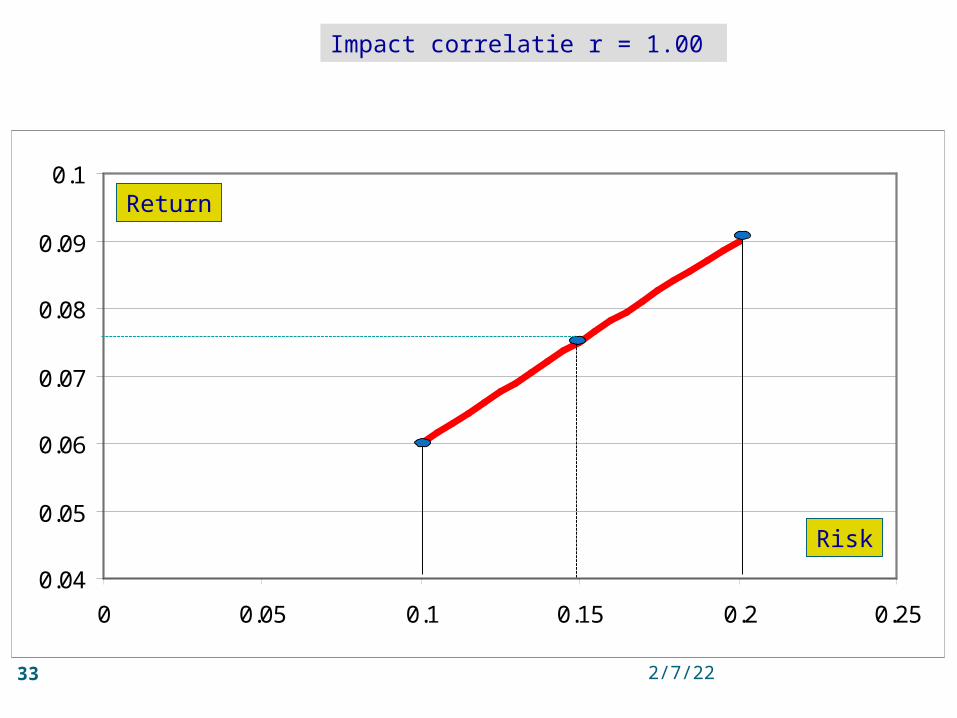
Impact correlatie r = 1.00
0.04
0.05
0.06
0.07
0.08
0.09
0.1
0 0.05 0.1 0.15 0.2 0.25
Return
Risk
Apr 10, 202334
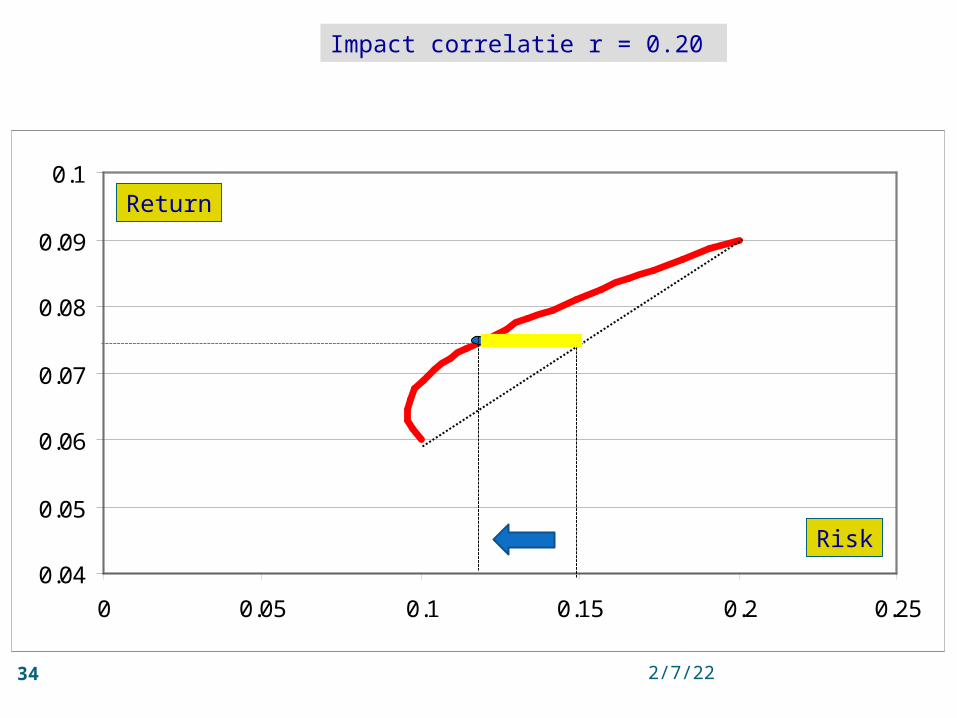
Impact correlatie r = 0.20
0.04
0.05
0.06
0.07
0.08
0.09
0.1
0 0.05 0.1 0.15 0.2 0.25
Return
Risk
Apr 10, 2023
35
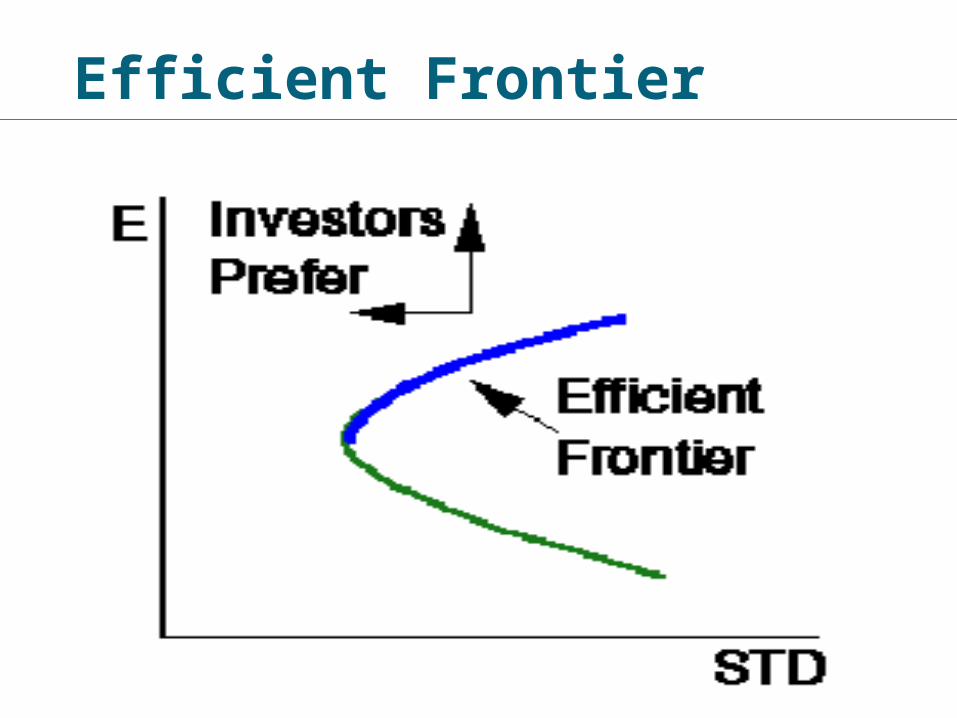
Efficient Frontier
36
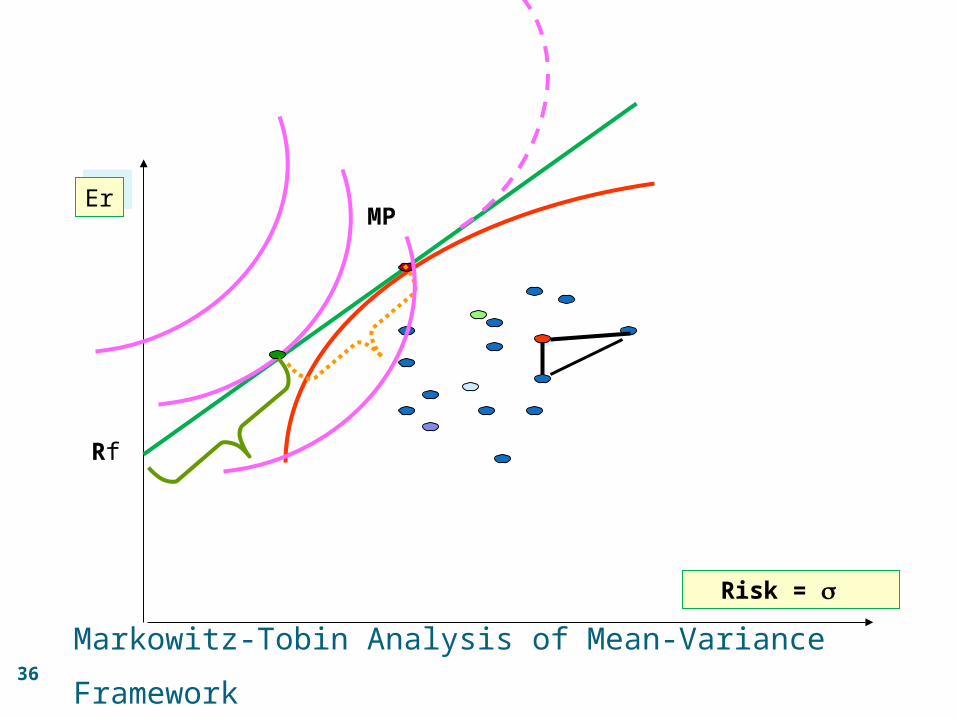
Markowitz-Tobin Analysis of Mean-Variance
Framework
Risk = s
return MP
Rf
ErEr
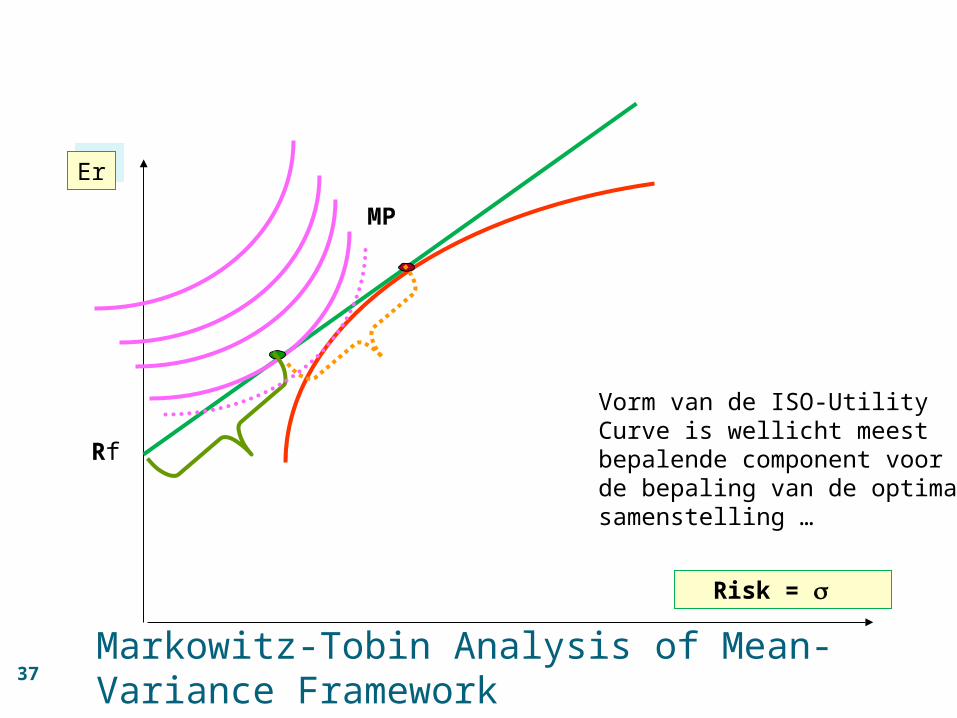
37Markowitz-Tobin Analysis of Mean-Variance Framework
Risk = s
return MP
Rf
ErEr
Vorm van de ISO-UtilityCurve is wellicht meestbepalende component voorde bepaling van de optimale samenstelling …
38
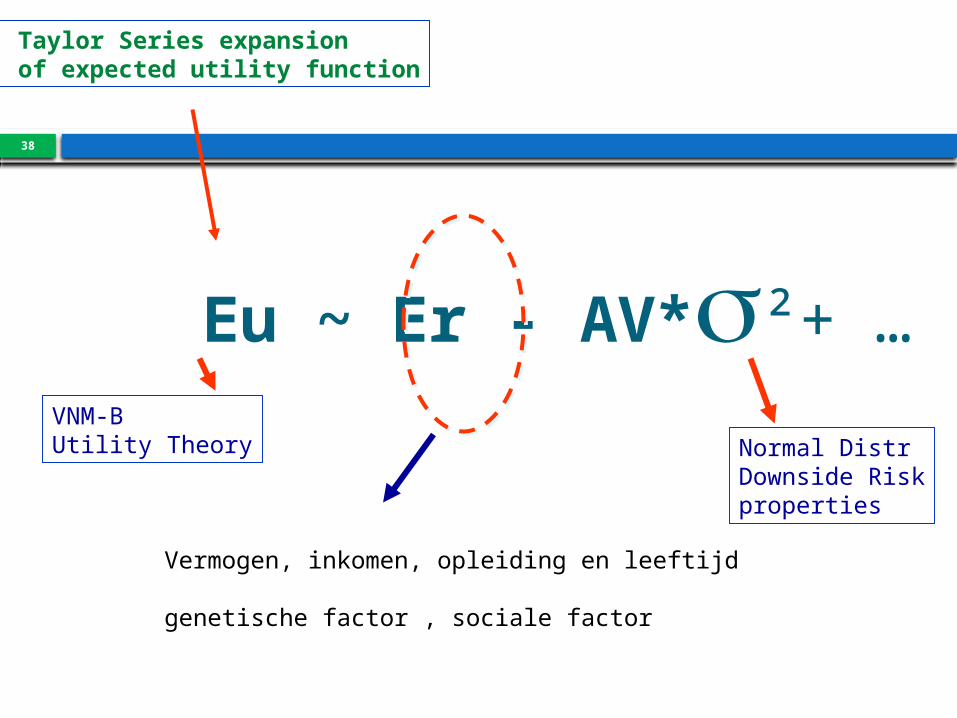
Eu ~ Er - AV*s²+ …VNM-BUtility Theory Normal Distr
Downside Riskproperties
Taylor Series expansion of expected utility function
Vermogen, inkomen, opleiding en leeftijd
genetische factor , sociale factor

39
Risico-Aversie en Leeftijd
10/04/2023
40
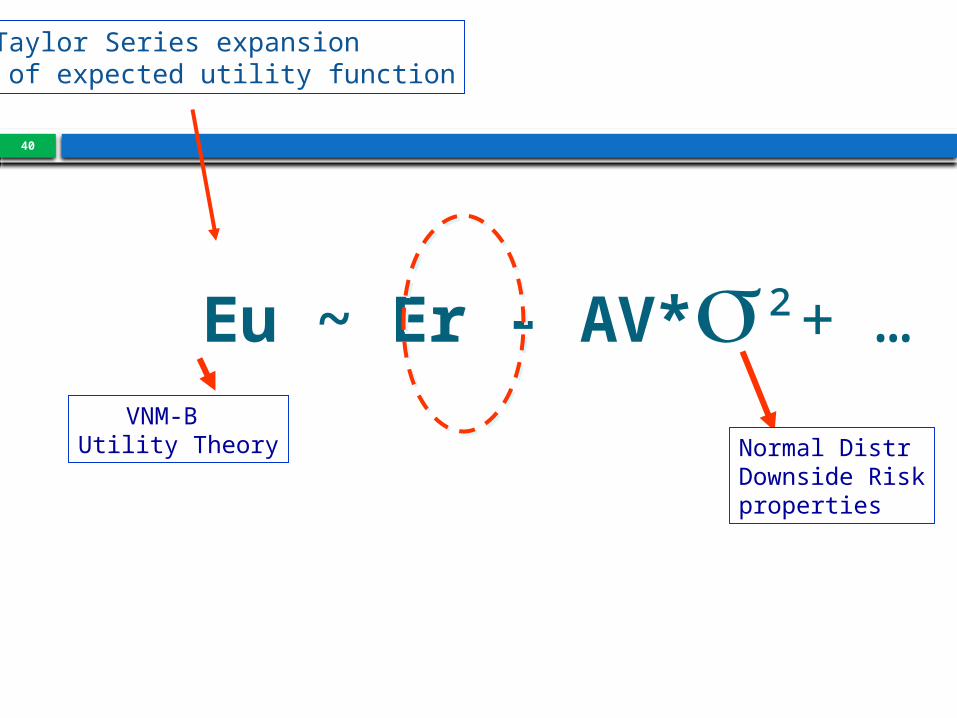
Eu ~ Er - AV*s²+ …VNM-B
Utility Theory Normal DistrDownside Riskproperties
Taylor Series expansion of expected utility function
41
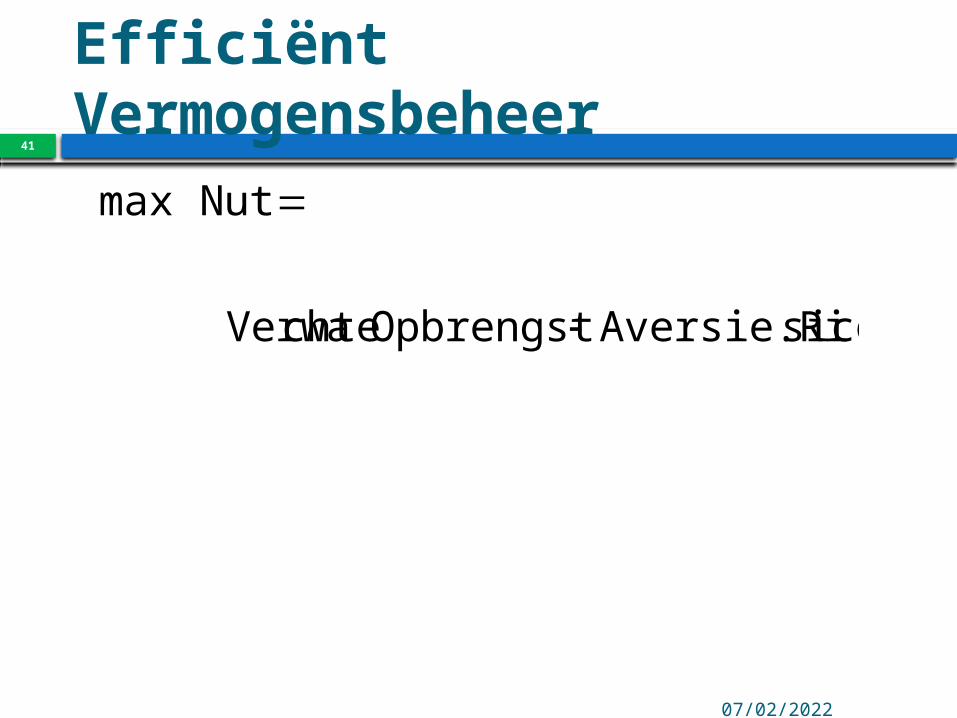
Efficiënt Vermogensbeheer
10/04/2023
sicoAversie.RiOpbrengst chte Verwa
Nutmax
42
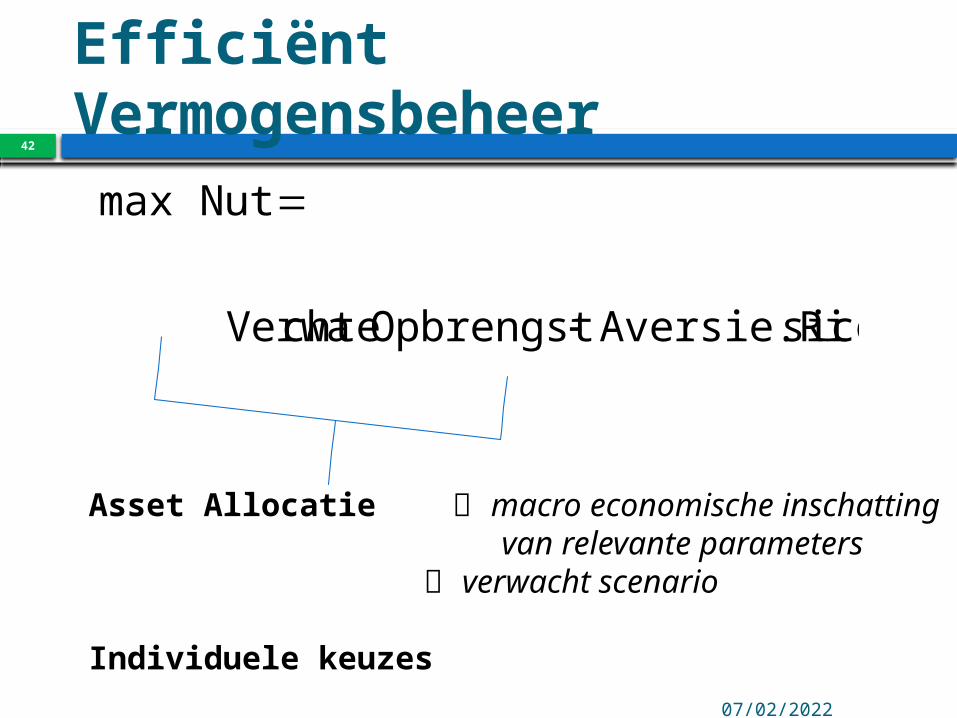
Efficiënt Vermogensbeheer
10/04/2023
sicoAversie.RiOpbrengst chte Verwa
Nutmax
Asset Allocatie macro economische inschatting van relevante
parameters verwacht scenario
Individuele keuzes
43
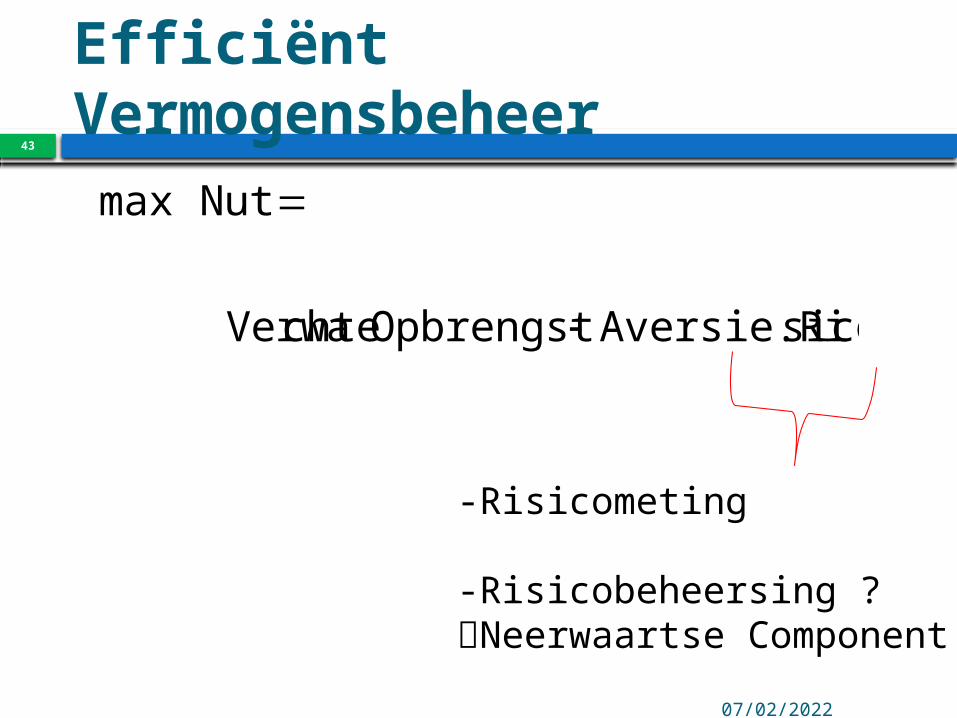
Efficiënt Vermogensbeheer
10/04/2023
sicoAversie.RiOpbrengst chte Verwa
Nutmax
-Risicometing
-Risicobeheersing ? Neerwaartse Component
44
10/04/2023
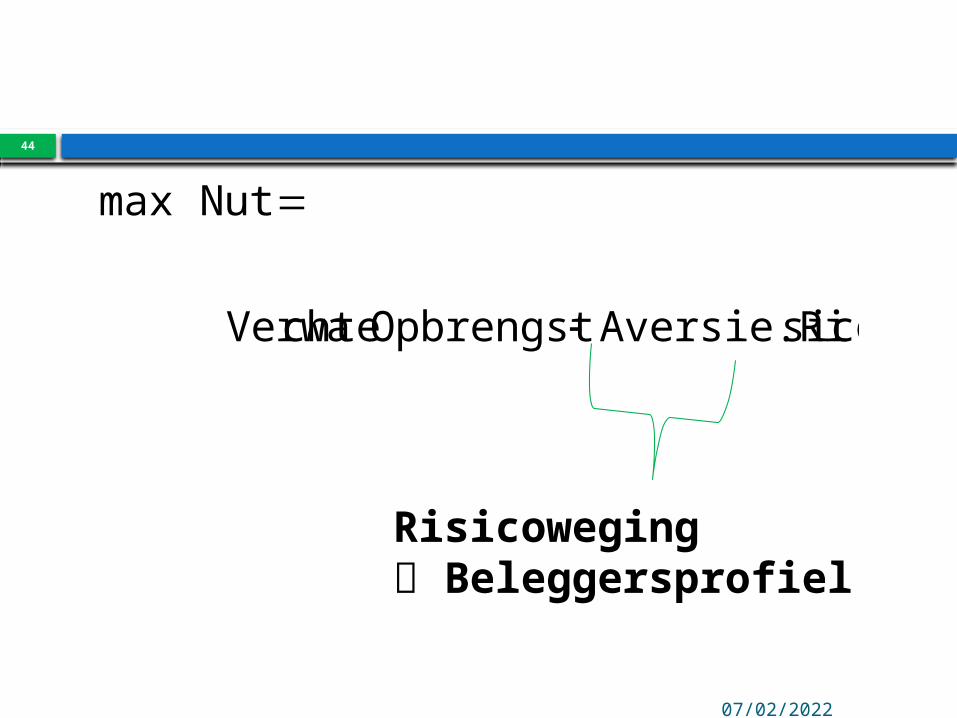
sicoAversie.RiOpbrengst chte Verwa
Nutmax
Risicoweging Beleggersprofiel
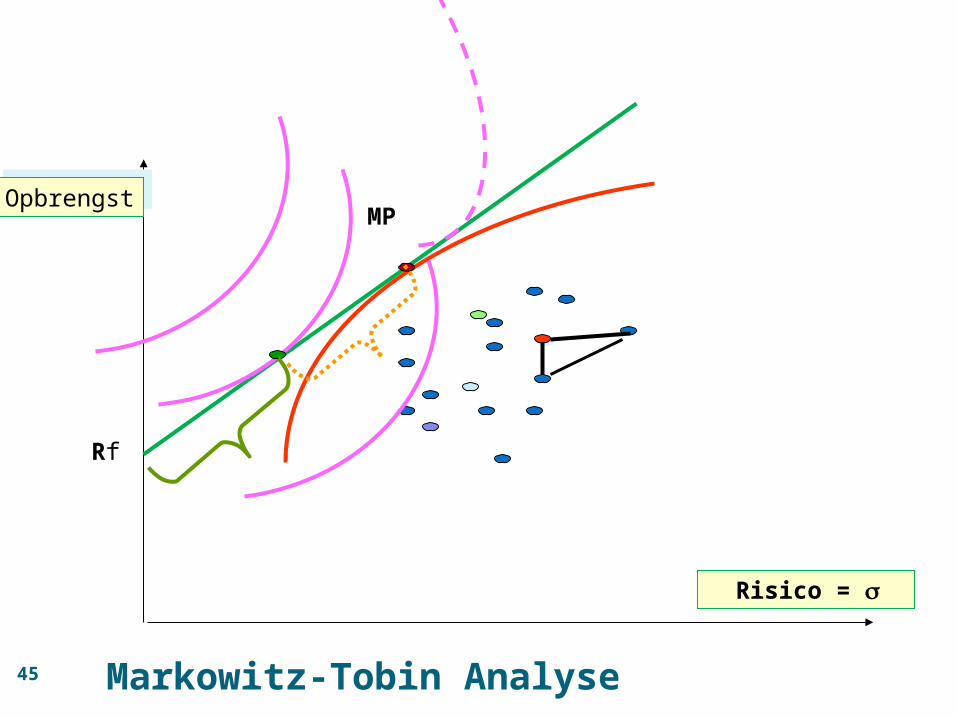
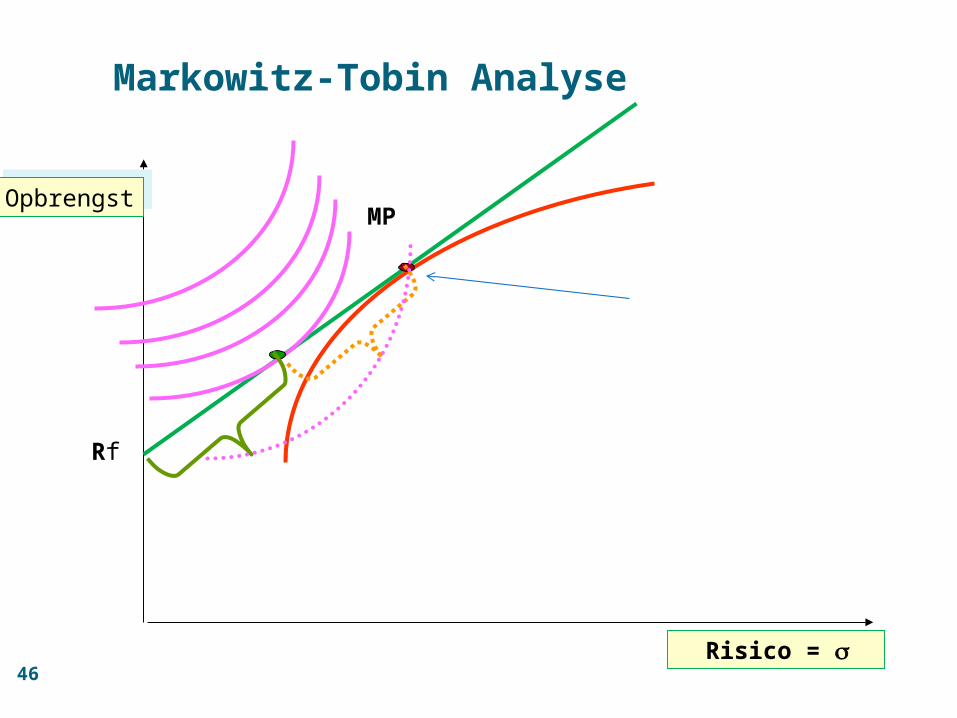
45 Markowitz-Tobin Analyse
Risico = s
return MP
Rf
OpbrengstOpbrengst
46
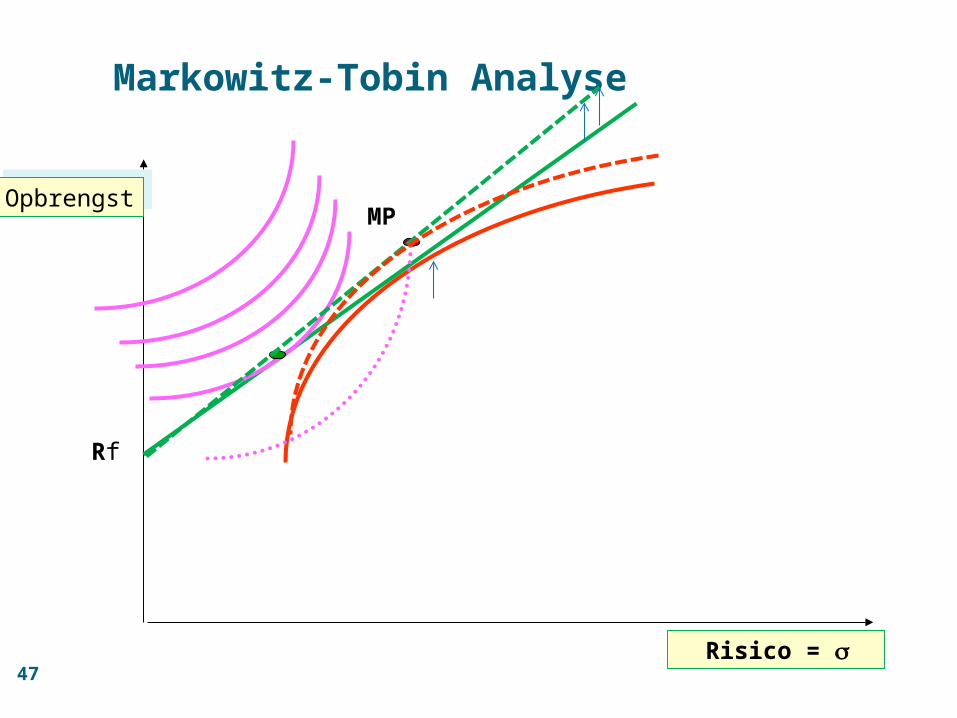
Markowitz-Tobin Analyse
Risico = s
return MP
Rf
OpbrengstOpbrengst
47
Markowitz-Tobin Analyse
Risico = s
return MP
Rf
OpbrengstOpbrengst
10/04/2023
48
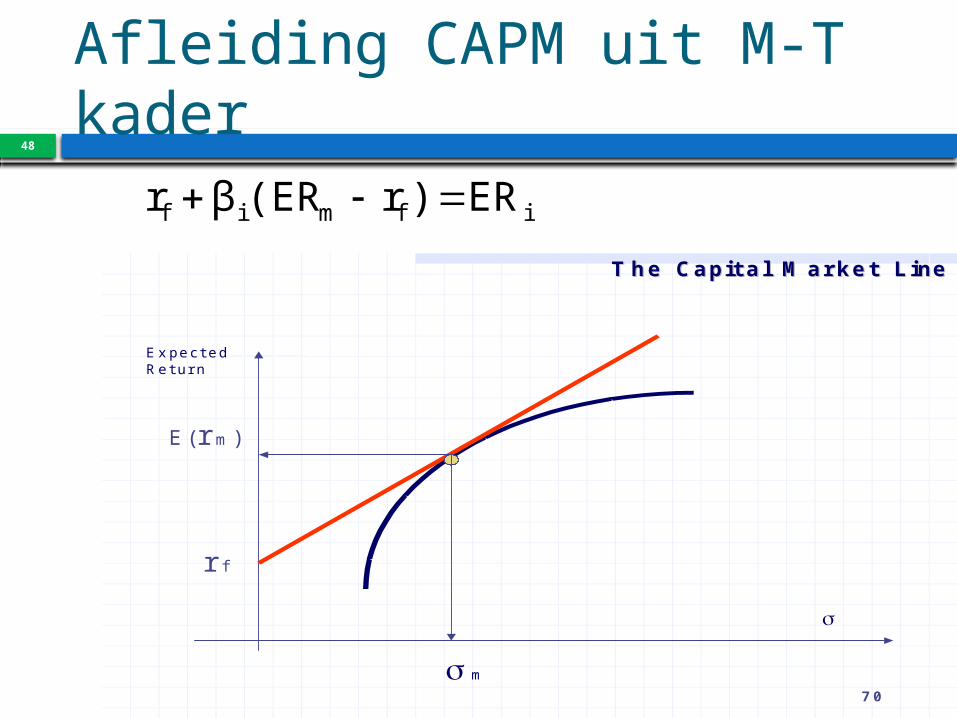
Afleiding CAPM uit M-T kader
70
r f
E(rm)
ExpectedReturn
The Capital Market LineThe Capital Market Line
m
ifmif ER)r(ERβr
49
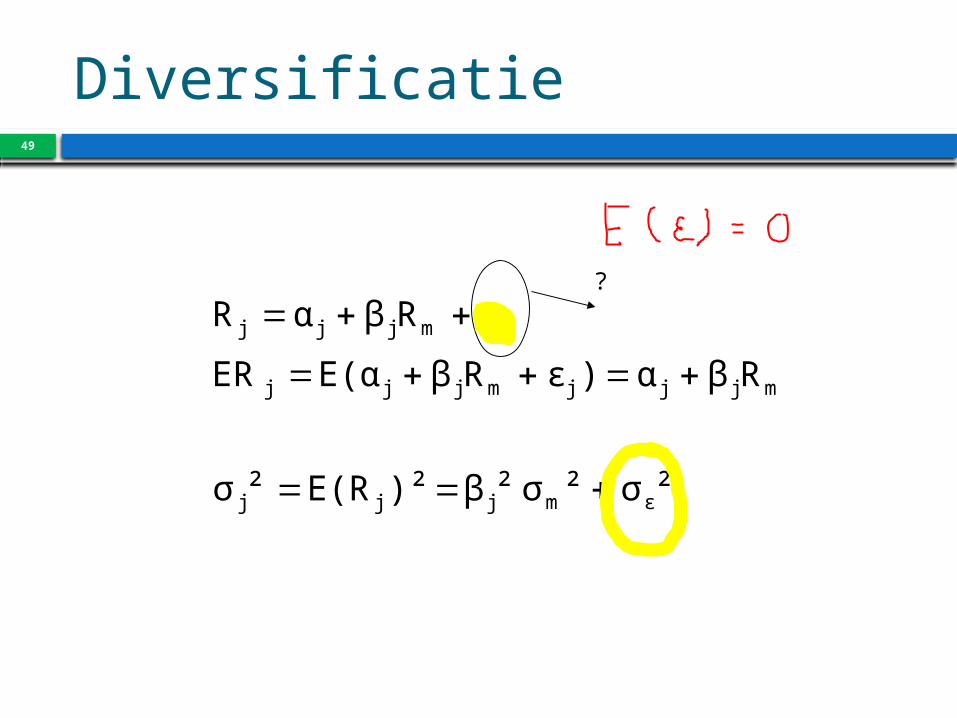
Diversificatie
²σ²² σβ)²E(R²σ
Rβα)εRβE(αER
εRβαR
εmjjj
mjjjmjjj
jmjjj
?
50
Apr 10, 2023
ifmifi )r(RRR
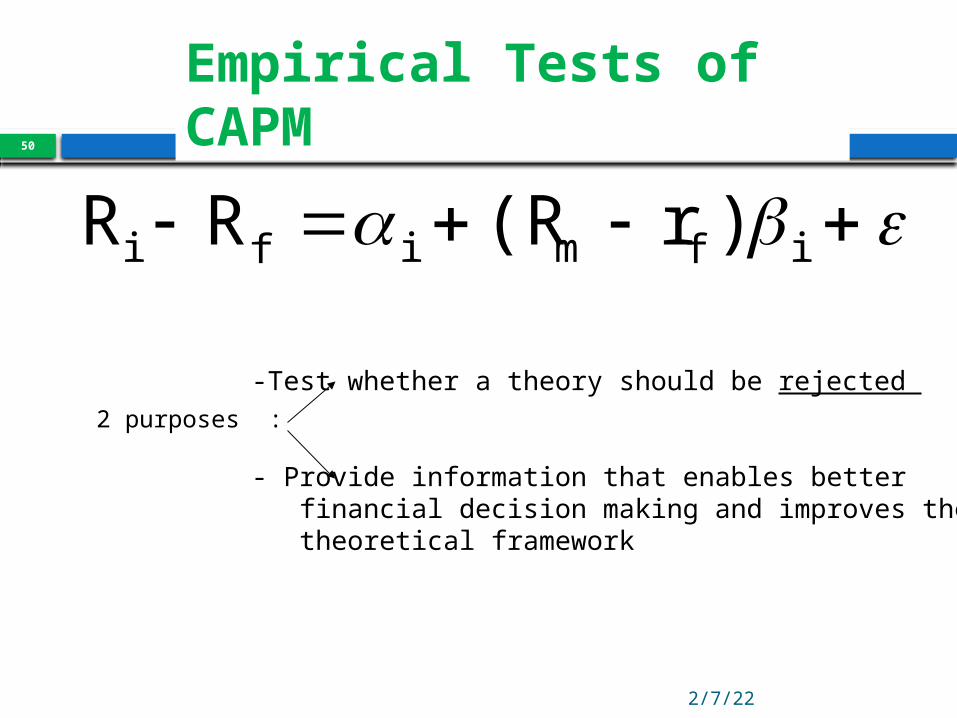
Empirical Tests of CAPM
2 purposes :
-Test whether a theory should be rejected
- Provide information that enables better financial decision making and improves the theoretical framework
51
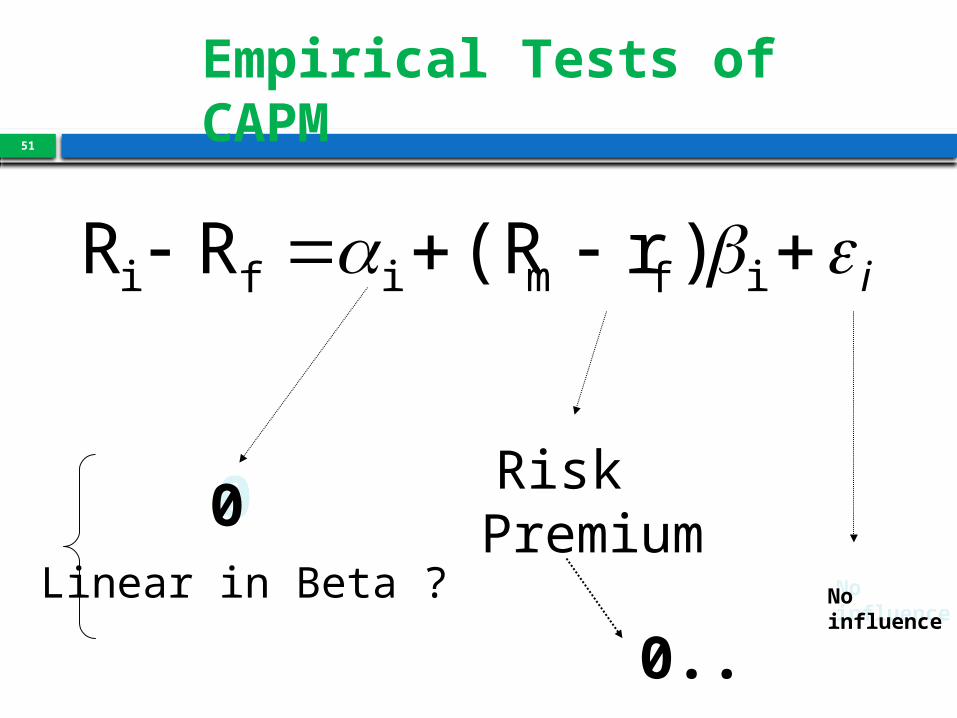
i ifmifi )r(RRR
Empirical Tests of CAPM
00 RiskPremium
Noinfluence
Noinfluence
Linear in Beta ?
0...
52
Apr 10, 2023
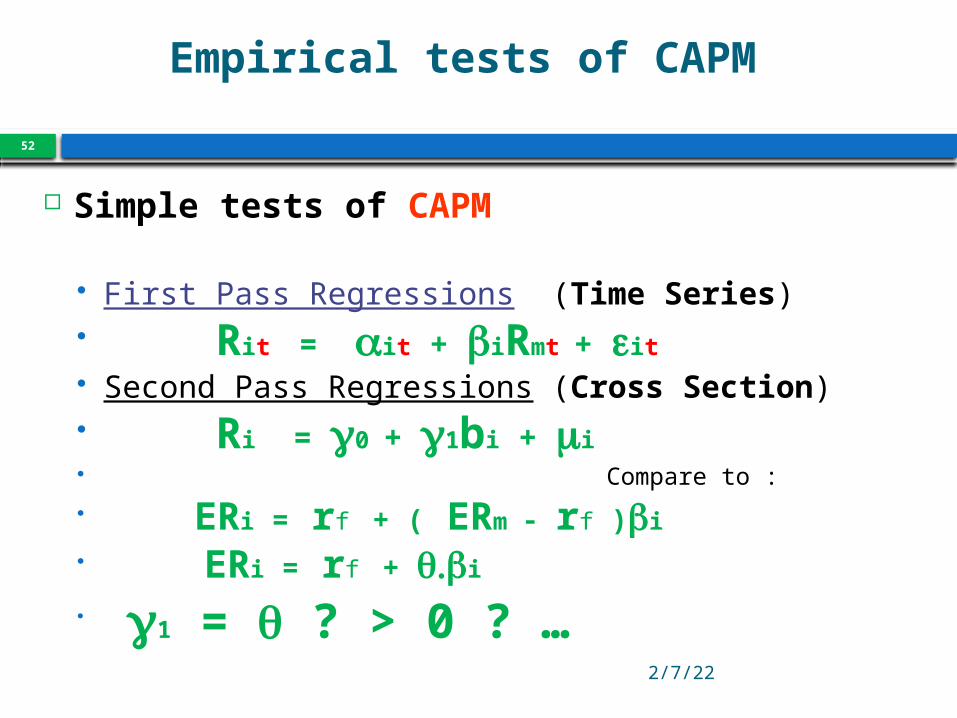
Empirical tests of CAPM
Simple tests of CAPM
First Pass Regressions (Time Series) Rit = ait + biRmt + eit
Second Pass Regressions (Cross Section) Ri = g0 + g1bi + mi Compare to : ERi = rf + ( ERm - rf )bi
ERi = rf + .q bi
g1 = q ? > 0 ? …

Meaning of m and s over longer periods of time?
Neerwaarts risico
Apr 10, 2023
54
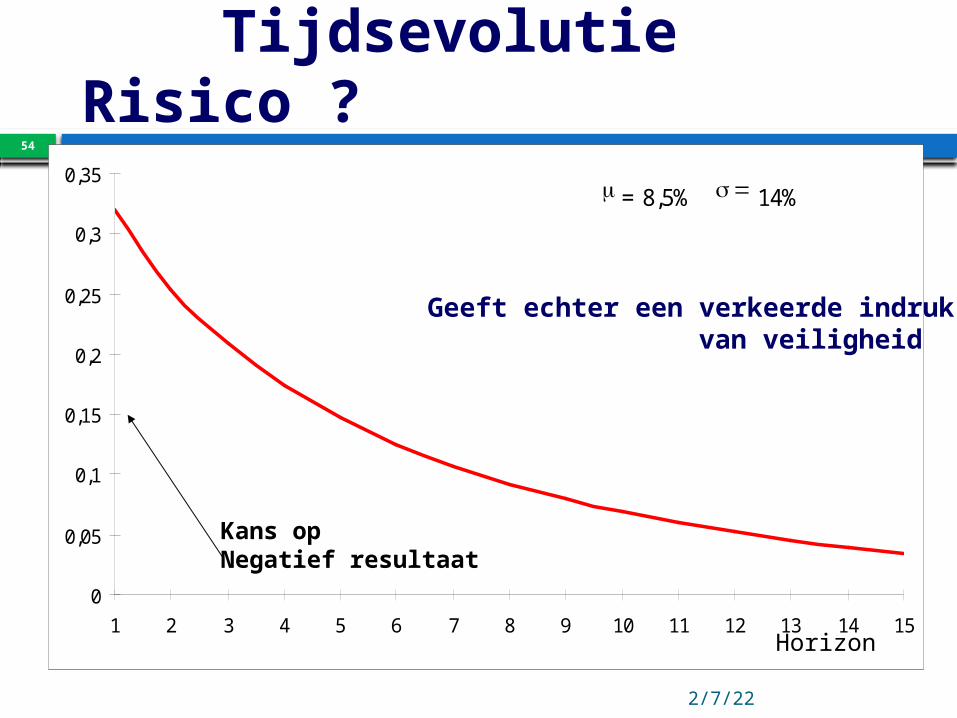
Tijdsevolutie Risico ?
0
0,05
0,1
0,15
0,2
0,25
0,3
0,35
1 2 3 4 5 6 7 8 9 10 11 12 13 14 15
m = 8,5% 14%
Geeft echter een verkeerde indruk van veiligheid
Kans op Negatief resultaat
Horizon
Apr 10, 2023
55
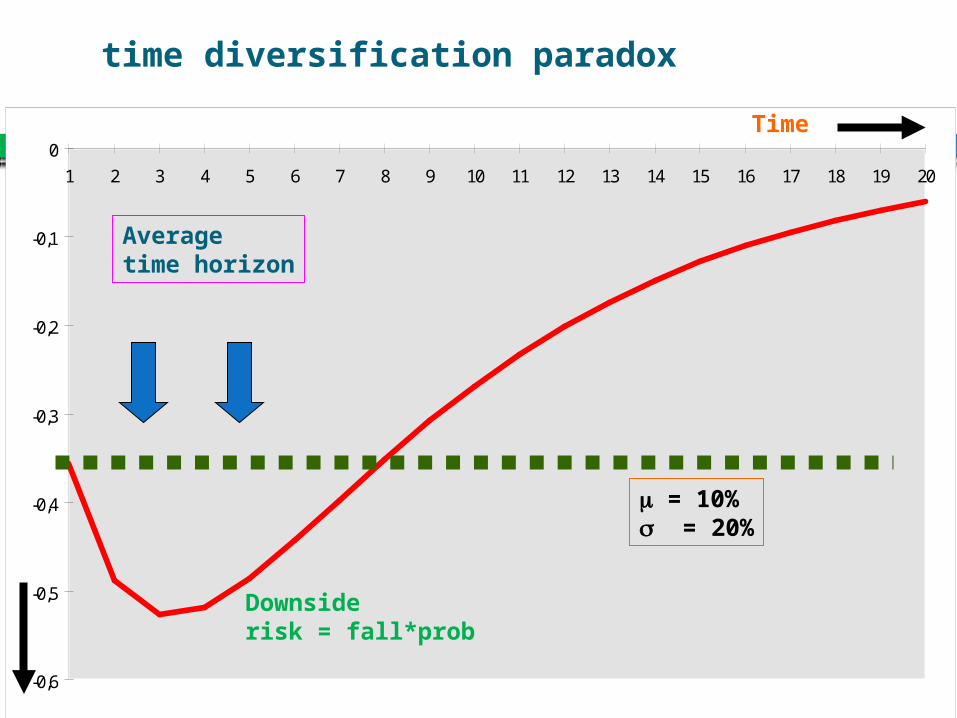
time diversification paradox
-0,6
-0,5
-0,4
-0,3
-0,2
-0,1
0
1 2 3 4 5 6 7 8 9 10 11 12 13 14 15 16 17 18 19 20
m = 10%s = 20%
Averagetime horizon
Downsiderisk = fall*prob
Time
Apr 10, 2023
56
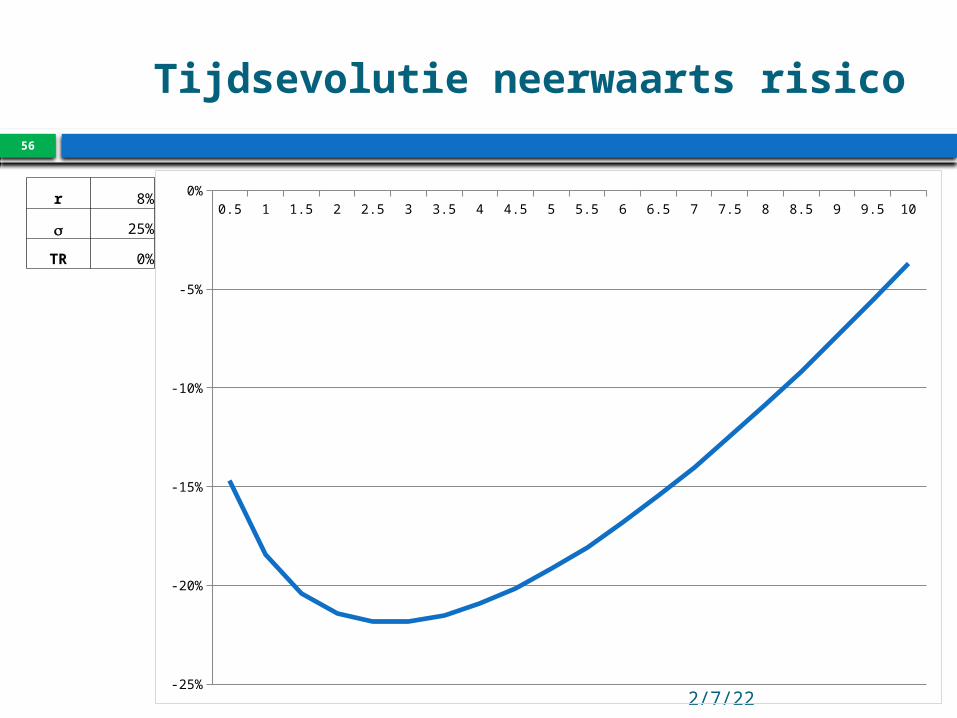
0.5 1 1.5 2 2.5 3 3.5 4 4.5 5 5.5 6 6.5 7 7.5 8 8.5 9 9.5 10
-25%
-20%
-15%
-10%
-5%
0%r 8%
s 25%
TR 0%
Tijdsevolutie neerwaarts risico
10/04/2023
57
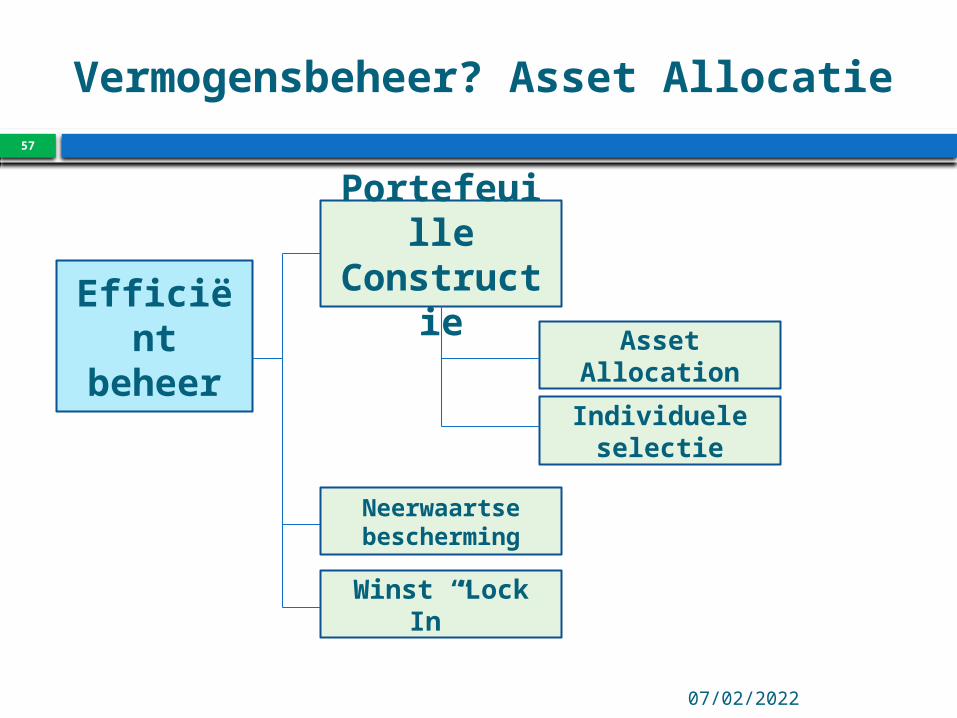
Vermogensbeheer? Asset Allocatie
Efficiëntbeheer
Portefeuille
Constructie
Neerwaartse bescherming
Winst “Lock In”
Asset Allocation
Individuele selectie
10/04/2023
58
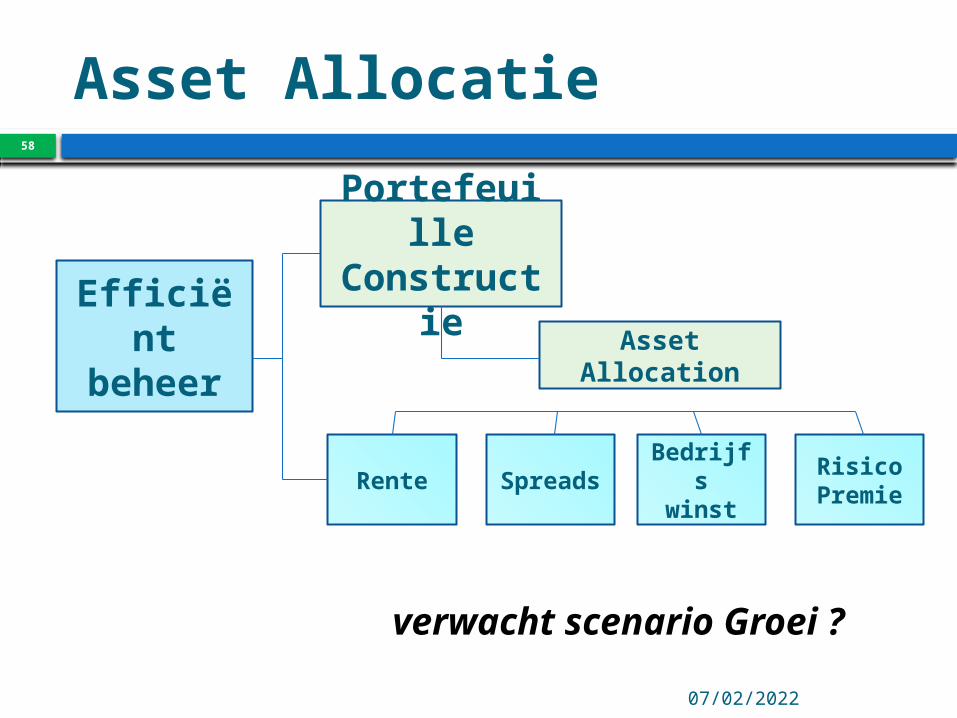
Asset Allocatie
Efficiëntbeheer
Portefeuille
Constructie Asset
Allocation
RenteSpread
sBedrijfswinst
RisicoPremie
verwacht scenario Groei ?
10 apr 2023S Duchateau
59
Index Aankoopdirecteuren VS
USCNFBUSQ17/10/132004200520062007200820092010201120123035404550556065US ISM PURCHASING MANAGERS INDEX (MFG SURVEY) SADJUS ISM NONMANUFACTURERS SURVEY INDEX: COMPOSITE NADJ50Source: Thomson Datastream
10/04/2023
60
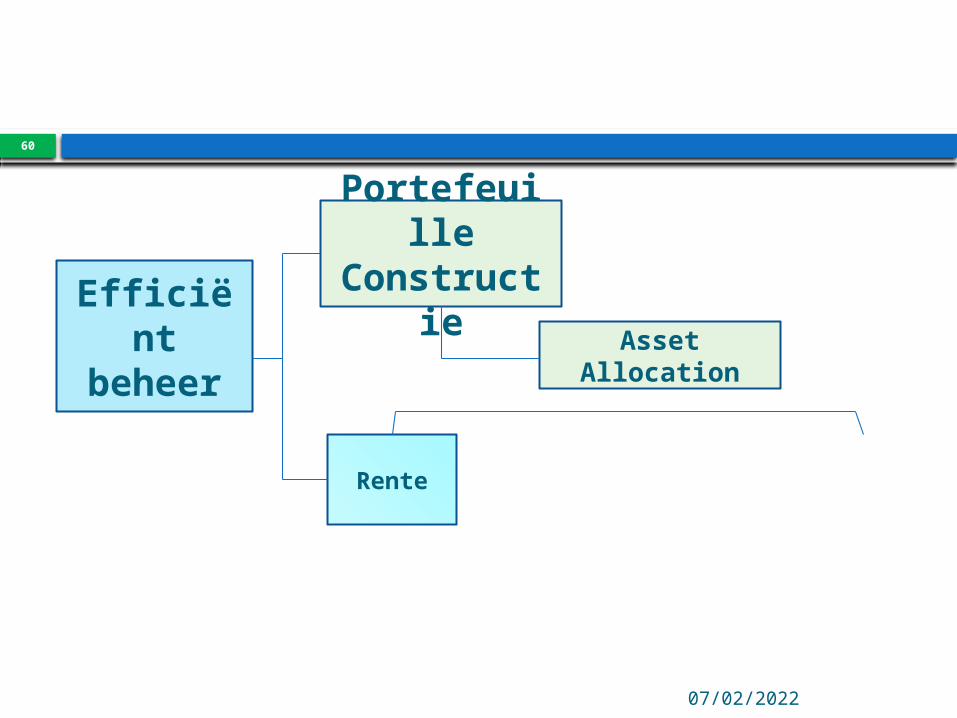
Efficiëntbeheer
Portefeuille
Constructie Asset
Allocation
Rente
10/04/2023
61
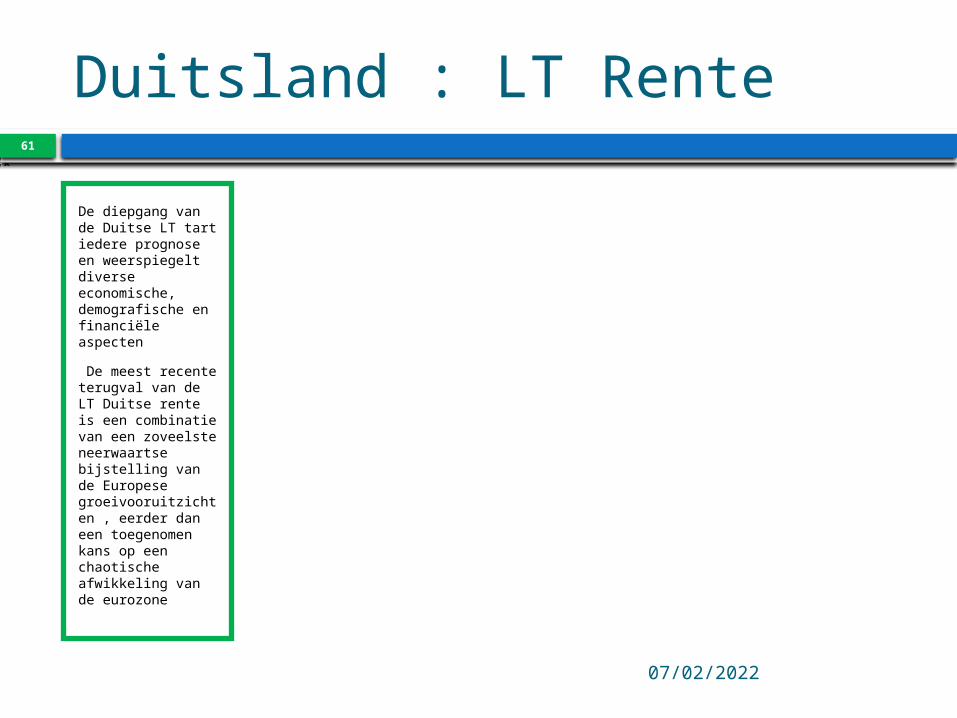
Duitsland : LT Rente
De diepgang van de Duitse LT tart iedere prognose en weerspiegelt diverse economische, demografische en financiële aspecten
De meest recente terugval van de LT Duitse rente is een combinatie van een zoveelste neerwaartse bijstelling van de Europese groeivooruitzichten , eerder dan een toegenomen kans op een chaotische afwikkeling van de eurozone
BDBRYLD17/10/13200920102011201220131.001.502.002.503.003.504.004.50GERMANY BENCHMARK BOND 10 YR (DS) - RED. YIELDSource: Thomson Datastream
10/04/2023
62
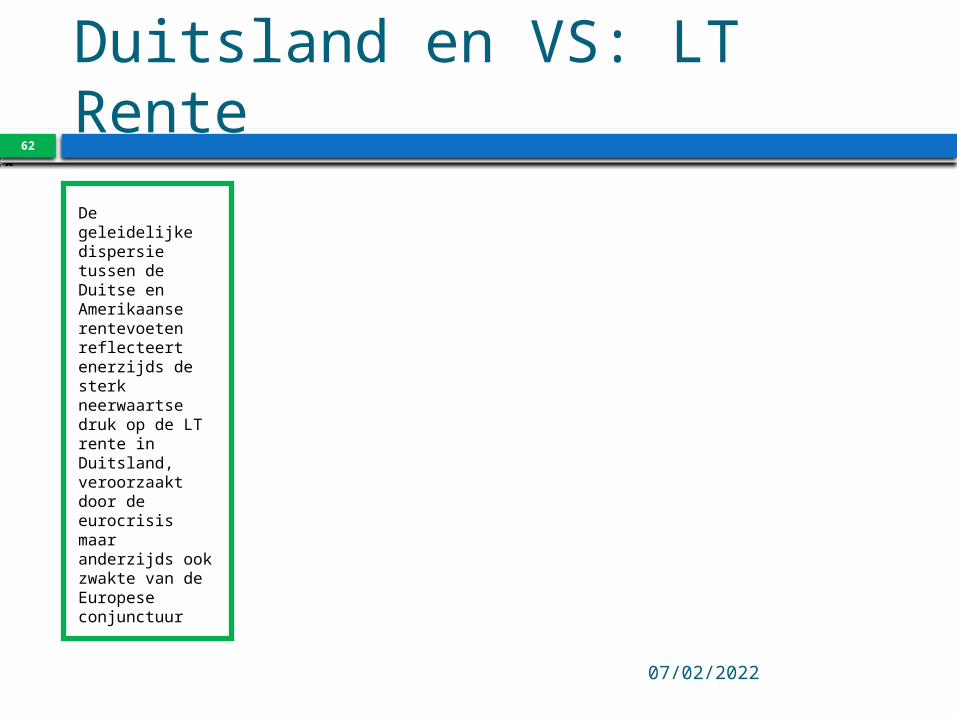
Duitsland en VS: LT Rente
De geleidelijke dispersie tussen de Duitse en Amerikaanse rentevoeten reflecteert enerzijds de sterk neerwaartse druk op de LT rente in Duitsland, veroorzaakt door de eurocrisis maar anderzijds ook zwakte van de Europese conjunctuur
BDBRYLD17/10/13APRMAYJUNJULAUGSEPOCT1.001.201.401.601.802.002.202.402.602.803.00GERMANY BENCHMARK BOND 10 YR (DS) - RED. YIELDUS TREAS.BENCHMARK BOND 10 YR (DS) - RED. YIELDSource: Thomson Datastream
10 apr 2023S Duchateau
63
Reële Rente VSUSBD10Y-PCH#(USCPCOREF,1Y)17/10/13200420052006200720082009201020112012-5-4-3-2-1012345USBD10Y-PCH#(USCPCOREF,1Y)AVG#(USBD10Y-PCH#(USCPCOREF,1Y))PCH#(USGDP...D,1Y)AVG#(PCH#(USGDP...D,1Y))Source: Thomson Datastream
10/04/2023
64
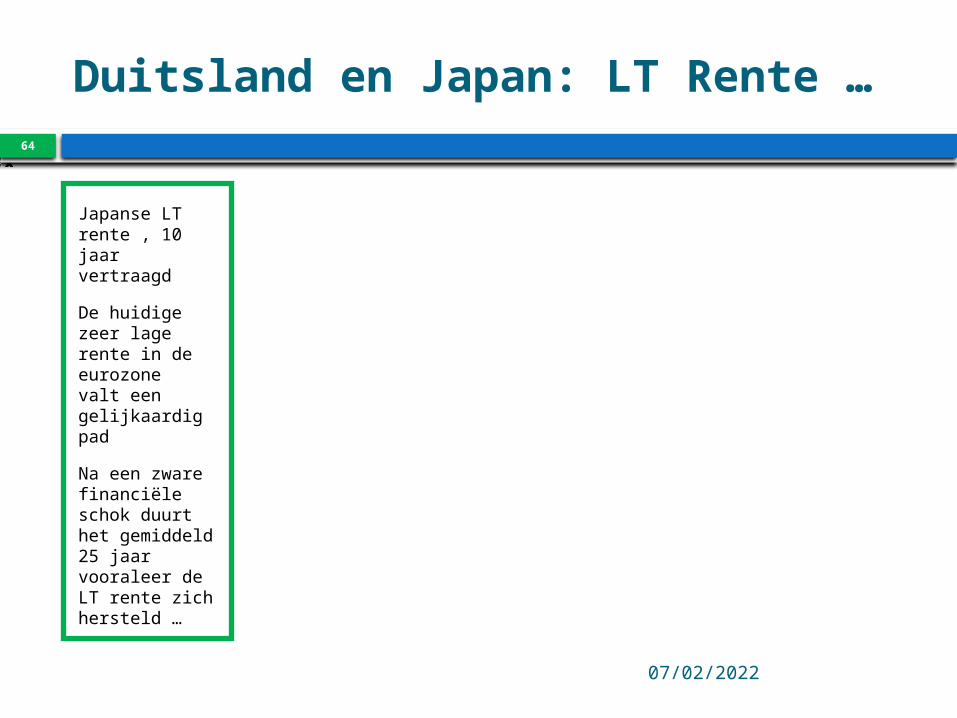
Duitsland en Japan: LT Rente …
Japanse LT rente , 10 jaar vertraagd
De huidige zeer lage rente in de eurozone valt een gelijkaardig pad
Na een zware financiële schok duurt het gemiddeld 25 jaar vooraleer de LT rente zich hersteld …
BDBRYLD17/10/139092949698000204060810121416182012345678910GERMANY BENCHMARK BOND 10 YR (DS) - RED. YIELDMAV#(LAG#(JPGBOND.,10Y),3Y)Source: Thomson Datastream
10/04/2023
65
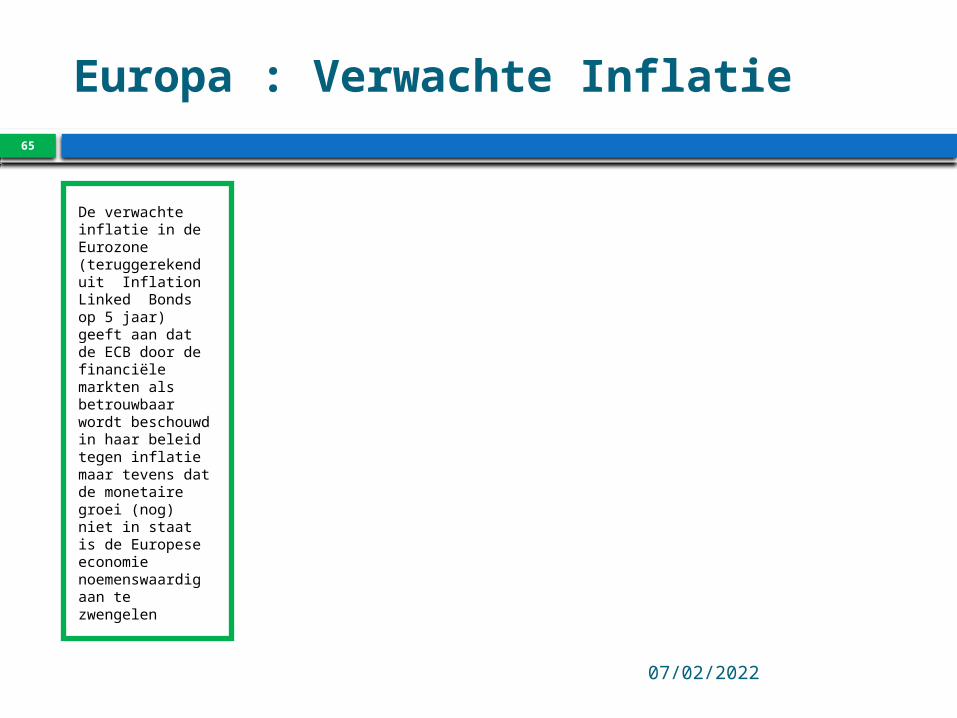
Europa : Verwachte Inflatie
De verwachte inflatie in de Eurozone (teruggerekend uit Inflation Linked Bonds op 5 jaar) geeft aan dat de ECB door de financiële markten als betrouwbaar wordt beschouwd in haar beleid tegen inflatie maar tevens dat de monetaire groei (nog) niet in staat is de Europese economie noemenswaardig aan te zwengelen
EURIS5Y17/10/132011201220131.401.601.802.002.202.402.60EUR INFLATION LINKED SWAP 5Y - MIDDLE RATE2Source: Thomson Datastream
10 apr 2023S Duchateau
66
KT Rente EurozoneBBERB3M17/10/13201120122013-0.2000.200.400.600.801.001.201.401.601.80EURO REPO BENCHMARK 3 MTH (EUR:FBE) - MIDDLE RATEEURIBOR 3 MONTH - OFFERED RATEEURO MAIN REFINANCING ECB - MIDDLE RATESource: Thomson Datastream
10/04/2023
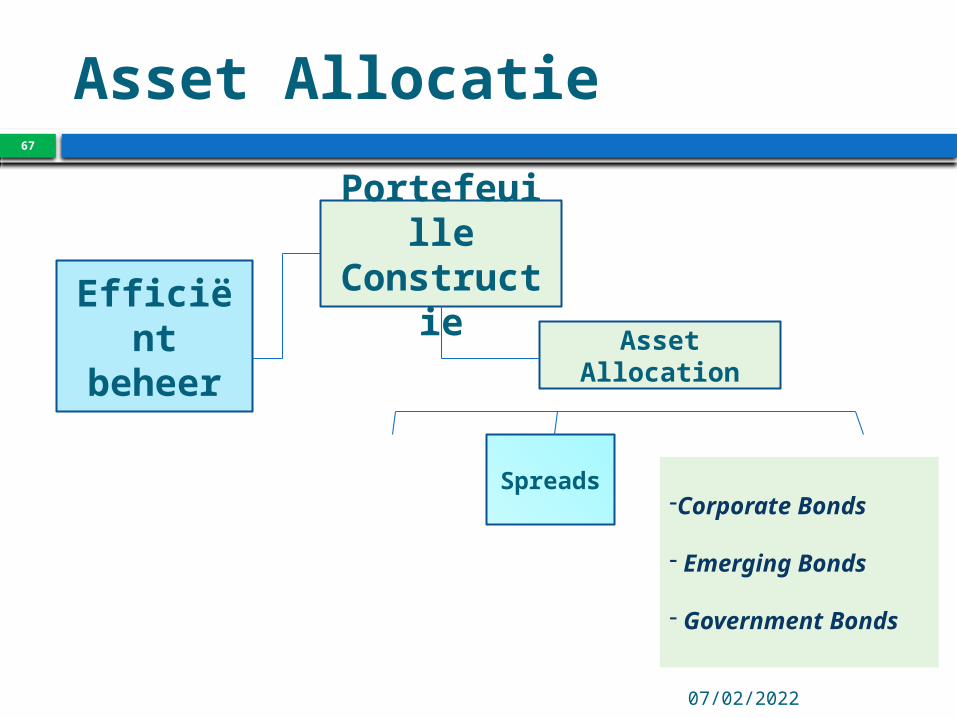
67
Asset Allocatie
Efficiëntbeheer
Portefeuille
Constructie Asset
Allocation
Spreads -Corporate Bonds
- Emerging Bonds
- Government Bonds
10/04/2023
68
Spreads Bedrijfsobligaties
LHAC7YE(RY)-TREUR7Y17/10/139900010203040506070809101112130123456LHAC7YE(RY)-TREUR7YLHAC3YE(RY)-TREUR3YAVG#(LHAC7YE(RY)-TREUR7Y)Source: Thomson Datastream
10/04/2023
69
Emerging BondsJPMETOC(RY)17/10/13ONDJFMAMJJASO1.802.002.202.402.602.803.003.203.403.603.804.00JPM EU EMBI GLB DIVS COMPOSITE - RED. YIELDJPM EU EMBI GLB DIVS 7-10 YEAR - RED. YIELDJPM EU EMBI GLB DIVS 1-3 YEAR - RED. YIELDJPM EU EMBI GLB DIVS 3-5 YEAR - RED. YIELDSource: Thomson Datastream
10/04/2023
70
Overheidsobligaties EurozoneESBRYLD-BDBRYLD17/10/13ONDJFMAMJJASO12345678ESBRYLD-BDBRYLDITBRYLD-BDBRYLDPTBRYLD-BDBRYLDIRBRYLD-BDBRYLDSource: Thomson Datastream
10/04/2023
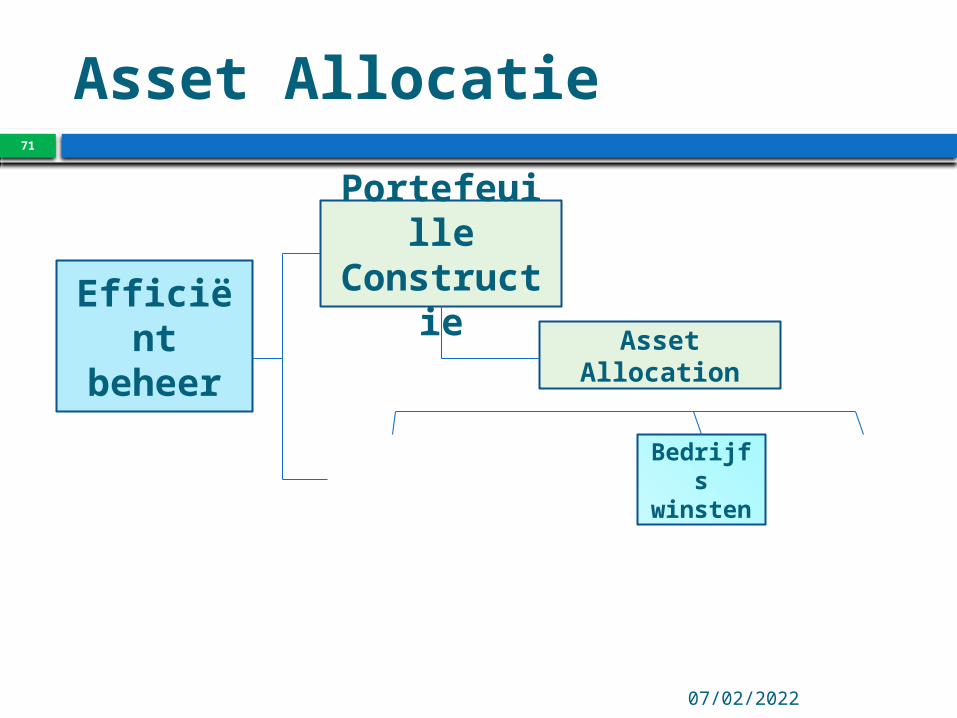
71
Asset Allocatie
Efficiëntbeheer
Portefeuille
Constructie Asset
Allocation
Bedrijfswinsten

10 apr 2023S Duchateau72
17/10/1320042005200620072008200920102011201250100150200250300MSCI EMG - 12MTH FWD WTD EPS (~E )MSCI EMU (UNADJUSTED) - 12MTH FWD WTD EPSMSCI U.S.A - 12MTH FWD WTD EPS (~E )MSCI GERMANY - 12MTH FWD WTD EPSMSCI JAPAN - 12MTH FWD WTD EPS (~E )Source: Thomson Datastream

10/04/202373
17/10/13200920102011201220136080100120140160180MSCI INDIA - 12MTH FWD WTD EPS (~E )MSCI BRAZIL - 12MTH FWD WTD EPS (~E )MSCI CHINA - 12MTH FWD WTD EPS (~E )MSCI EMU (UNADJUSTED) - 12MTH FWD WTD EPSSource: Thomson Datastream

10 apr 2023
74
17/10/13200720082009201020112012201330405060708090100110120MSCI GERMANY - 12MTH FWD WTD EPS (~E )MSCI EUROPE - 12MTH FWD WTD EPS (~E )MSCI EMU - 12MTH FWD WTD EPS (~E )MSCI FRANCE - 12MTH FWD WTD EPSMSCI ITALY - 12MTH FWD WTD EPSMSCI SPAIN - 12MTH FWD WTD EPSMSCI SWEDEN - 12MTH FWD WTD EPS (~E )MSCI BELGIUM - 12MTH FWD WTD EPS (~E )Source: Thomson Datastream
10/04/2023
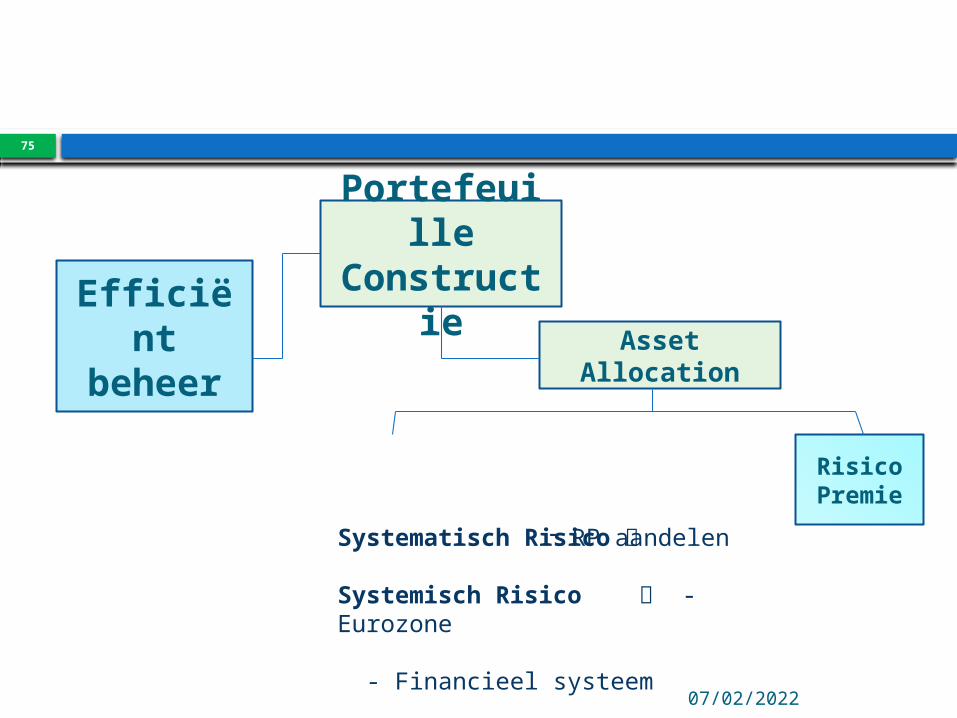
75
Efficiëntbeheer
Portefeuille
Constructie Asset
Allocation
RisicoPremie
Systematisch Risico
Systemisch Risico - Eurozone - Financieel systeem
- RP aandelen
10/04/2023
76
Verwachte Risicopremie100/@:USSP500(AF1PE)-0.6*AUSGVG1(RY)17/10/13838587899193959799010305070911-10123456789100/@:USSP500(AF1PE)-0.6*AUSGVG1(RY)Source: Thomson Datastream
10/04/2023
77
VolatiliteitCBOEVIX17/10/139495969798990001020304050607080910111213010203040506070CBOE SPX VOLATILITY VIX (NEW) - PRICE INDEXAVG#(CBOEVIX)Source: Thomson Datastream

10/04/2023
78
Flight-to-Quality Duitsland
TREUR2Y-GBBD02Y(RY)17/10/1320052006200720082009201020112012201300.200.400.600.801.001.201.40TREUR2Y-GBBD02Y(RY)Source: Thomson Datastream
10/04/2023
79
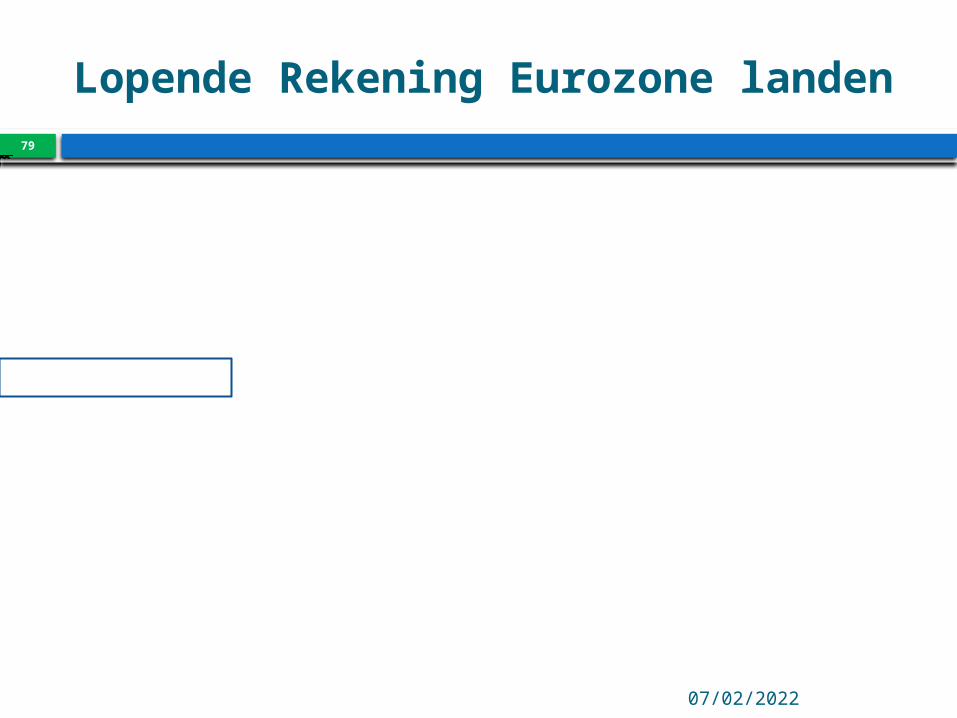
Lopende Rekening Eurozone landen
MAV#(ITCURBALA,1Y)17/10/13990001020304050607080910111213000'S -10-8-6-4-202468MAV#(ITCURBALA,1Y)MAV#(GRCURBALA,1Y)MAV#(IRCURBALA,1Y)MAV#(BGCURBALA,1Y)MAV#(ESCURBALA,1Y)Source: Thomson Datastream
10/04/2023
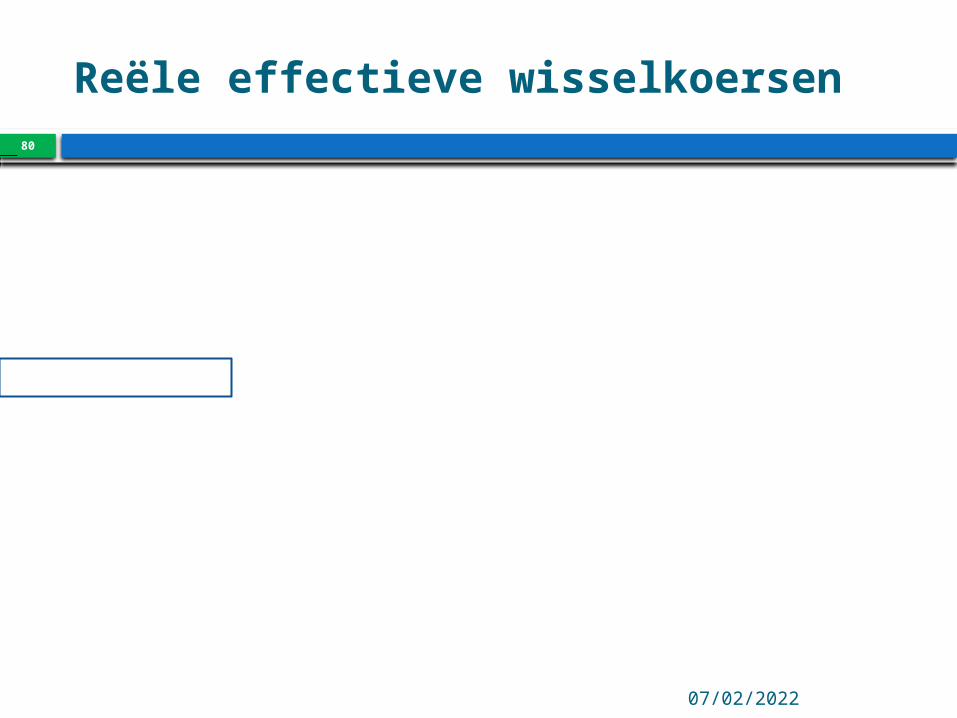
80
Reële effectieve wisselkoersen17/10/13000102030405060708091011121395100105110115120125130135BGI..RECE/BDI..RECEPTI..RECE/BDI..RECEGRI..RECE/BDI..RECEESI..RECE/BDI..RECEIRI..RECE/BDI..RECEITI..RECE/BDI..RECENLI..RECE/BDI..RECEFRI..RECE/BDI..RECESource: Thomson Datastream
10/04/2023
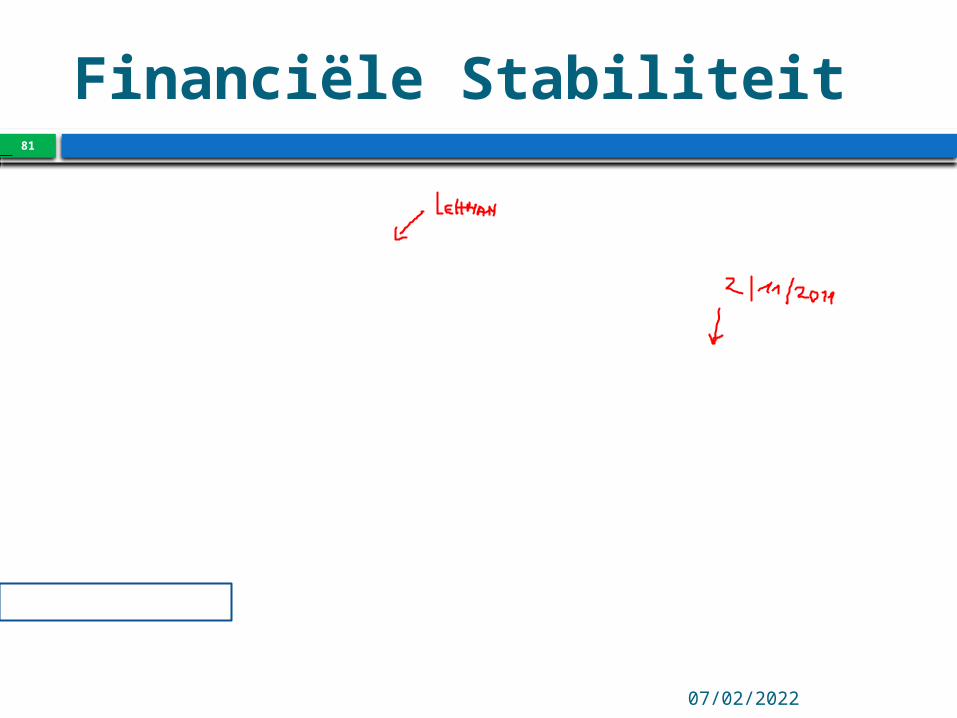
81
Financiële StabiliteitEIBOR3M-BBERB3M17/10/132006200720082009201020112012201300.200.400.600.801.001.201.401.601.802.00EIBOR3M-BBERB3MSource: Thomson Datastream
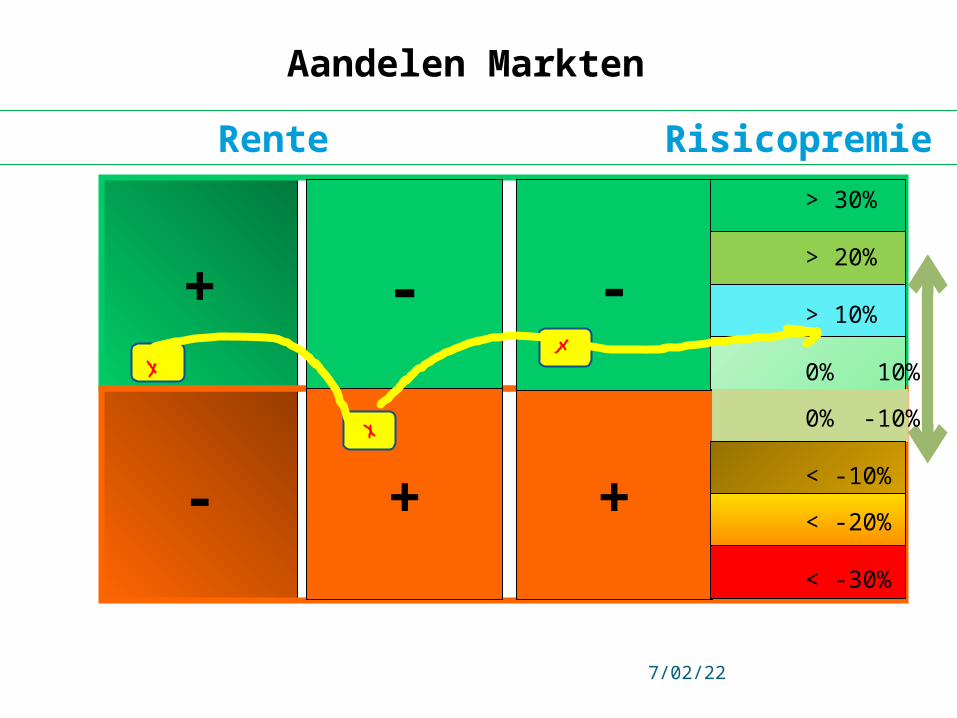
+
-
-
+ +
-
Aandelen Markten
> 30%
> 20%
> 10%
0% 10%
0% -10%
< -10%
< -20%
< -30%
Groei Rente Risicopremie Beurs
10 apr 2023
83
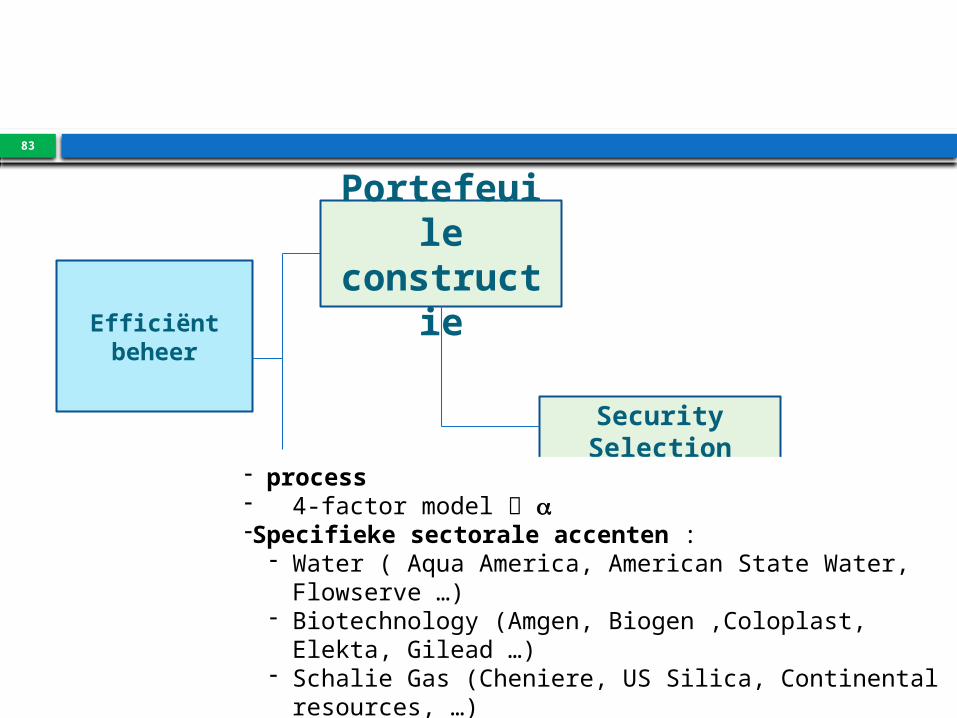
Efficiëntbeheer
Portefeuile
constructie
Security Selection
- process - 4-factor model a-Specifieke sectorale accenten :
- Water ( Aqua America, American State Water, Flowserve …)
- Biotechnology (Amgen, Biogen ,Coloplast, Elekta, Gilead …)
- Schalie Gas (Cheniere, US Silica, Continental resources, …)
-Specifieke geografische accenten- VS, Duitsland, Scandinavië, Japan, China
84
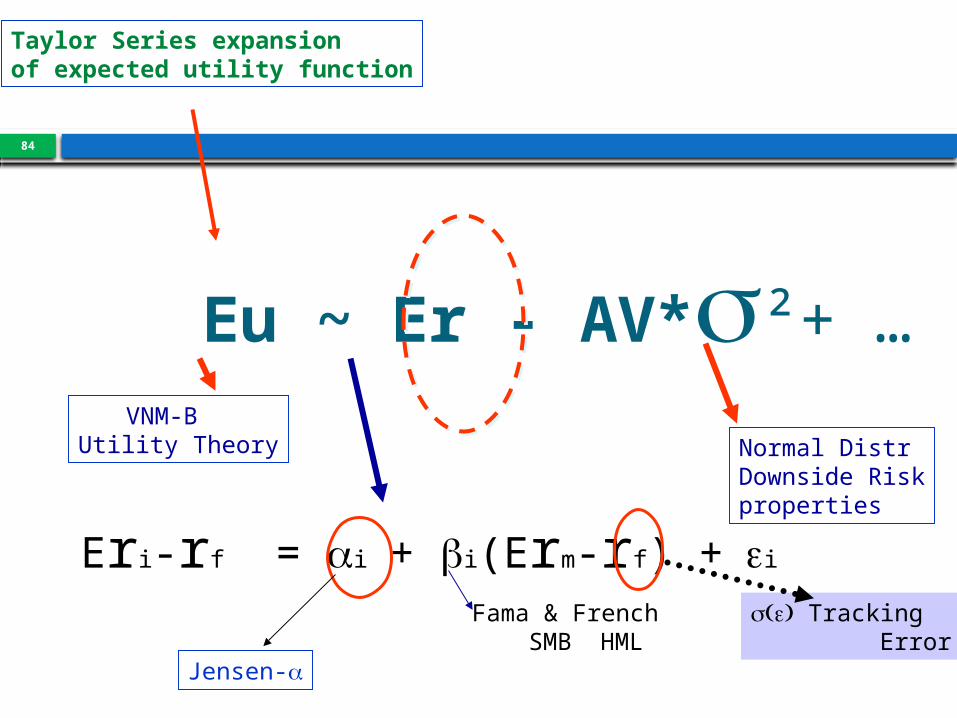
Eu ~ Er - AV*s²+ …VNM-B
Utility Theory
Eri-rf = ai + bi(Erm-rf) + ei
Normal DistrDownside Riskproperties
Taylor Series expansionof expected utility function
Jensen-a
Fama & French SMB HML
( )s e Tracking Error
85
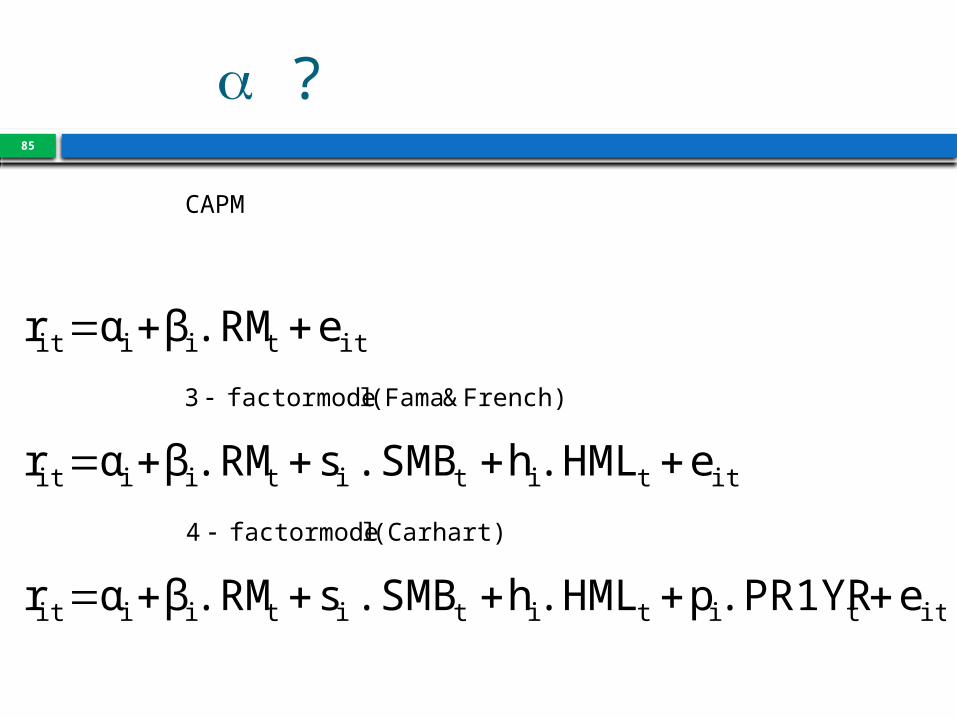
a ?
ittitititiiit
(Carhart) lfactormode4
ittititiiit
French) & (Fama lfactormode3
ittiiit
CAPM
e.PR1YRp.HMLh.SMBs.RMβαr
e.HMLh.SMBs.RMβαr
e.RMβαr
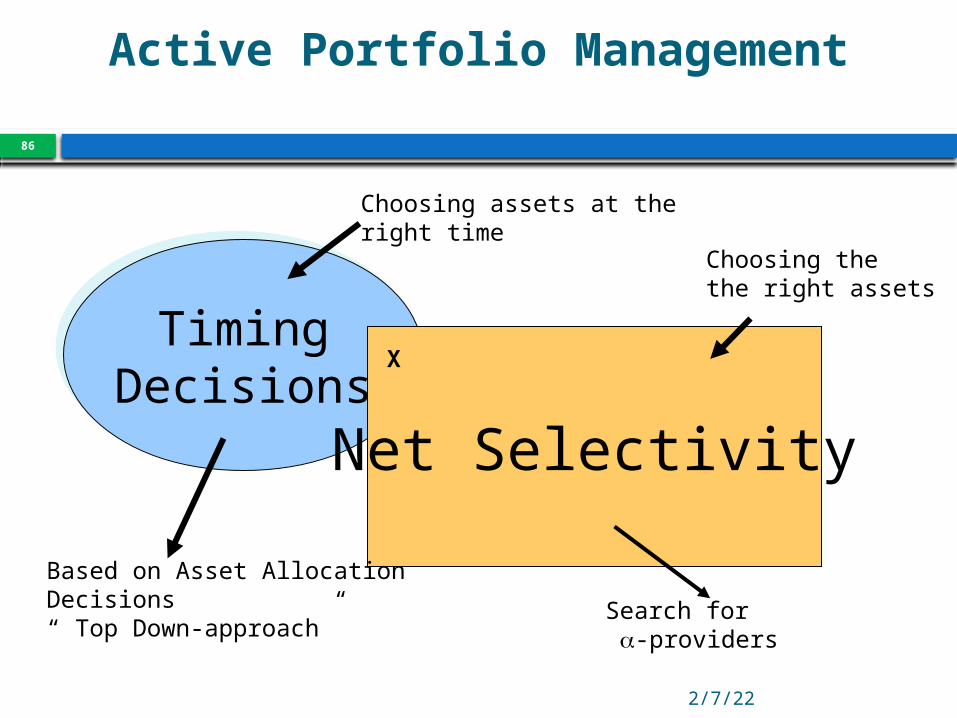
Active Portfolio Management
Apr 10, 2023
86
TimingDecisions
TimingDecisions
Net Selectivity
Based on Asset AllocationDecisions“ Top Down-approach”
Search for a-providers
Choosing assets at the right time
Choosing the the right assets
X
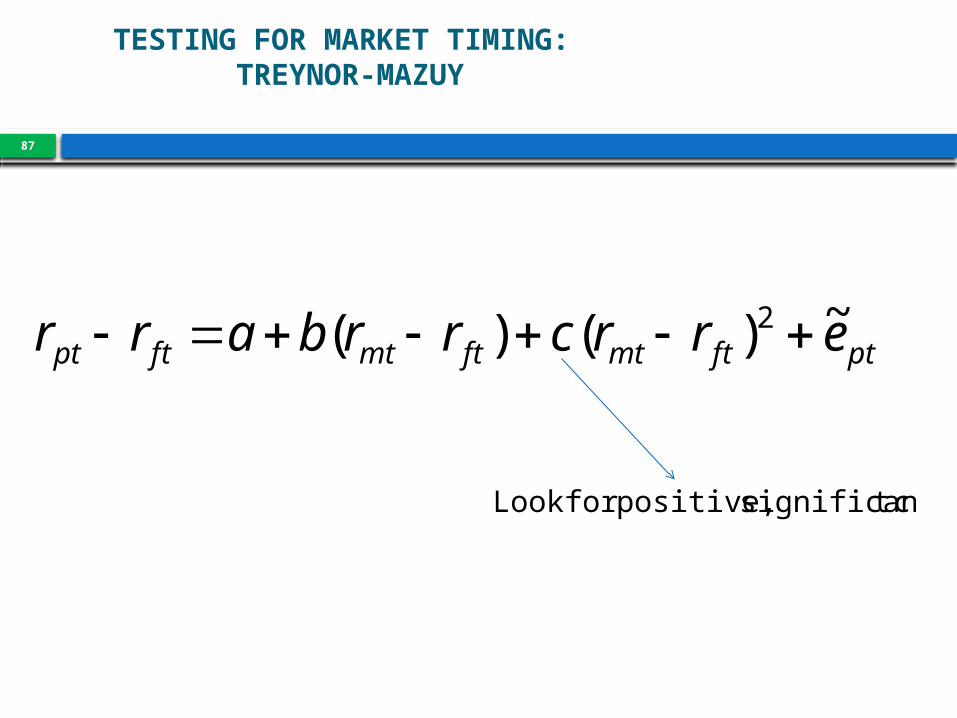
TESTING FOR MARKET TIMING: TREYNOR-MAZUY
c tsignifican positive, for Look
ptftmtftmtftpt errcrrbarr ~)()( 2
87
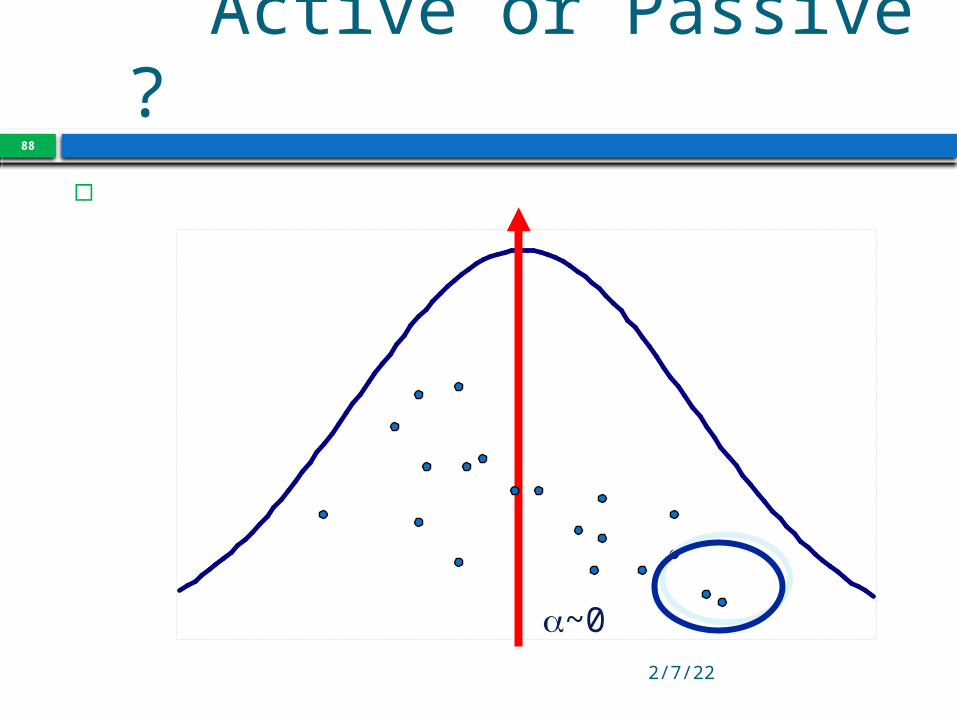
Active or Passive ?
Apr 10, 2023
88
a~0
89
11
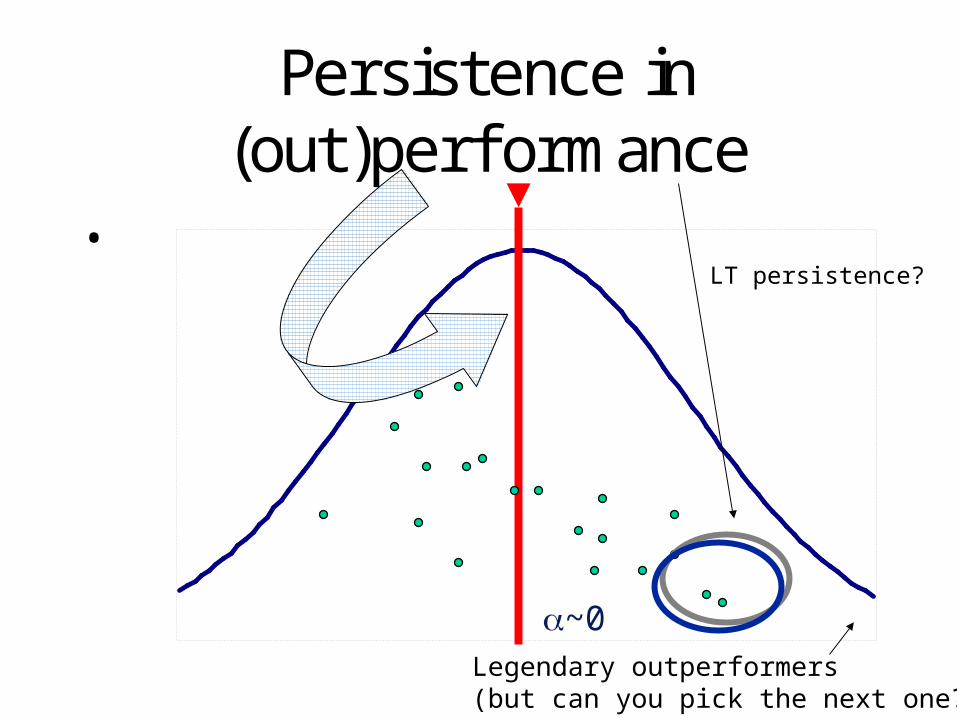
Persistence in (out)perf ormance
•
~0
LT persistence?
Legendary outperformers(but can you pick the next one?)
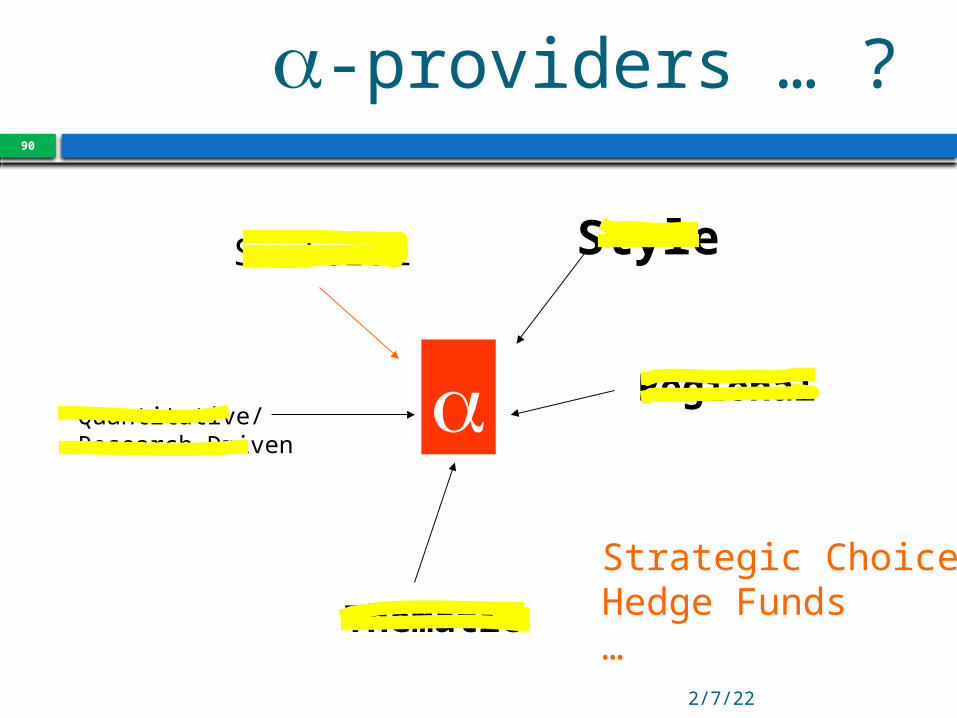
a-providers … ?
Apr 10, 2023
90
Sectoral
Regional
Thematic
Quantitative/Research Driven
a
Strategic ChoicesHedge Funds…
Style
04:5891
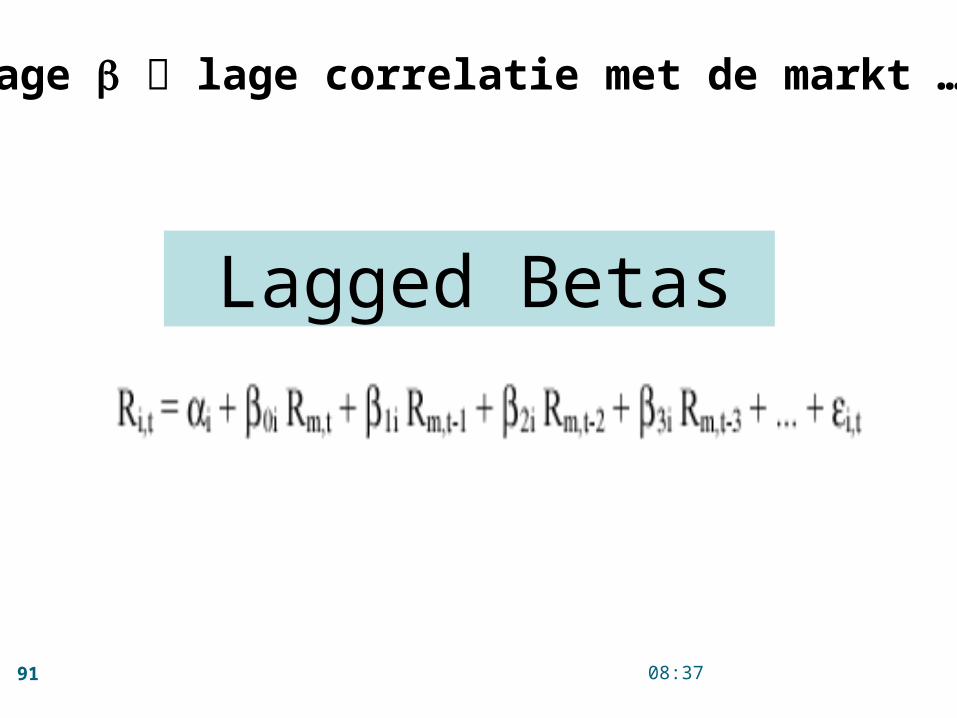
Lagged Betas
Lage b lage correlatie met de markt … ?
04:5892
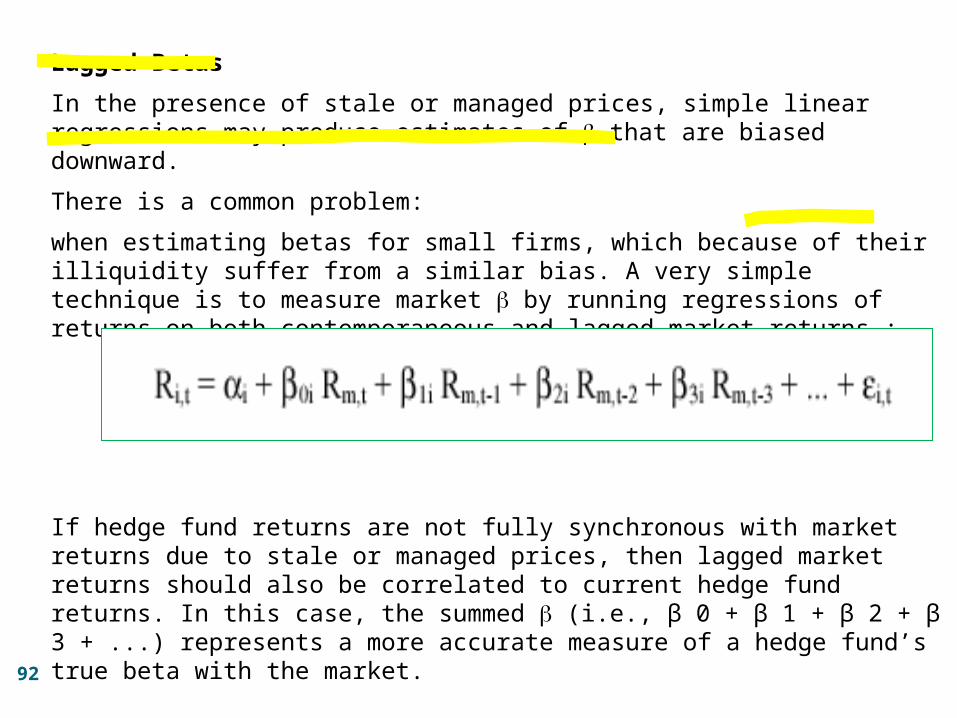
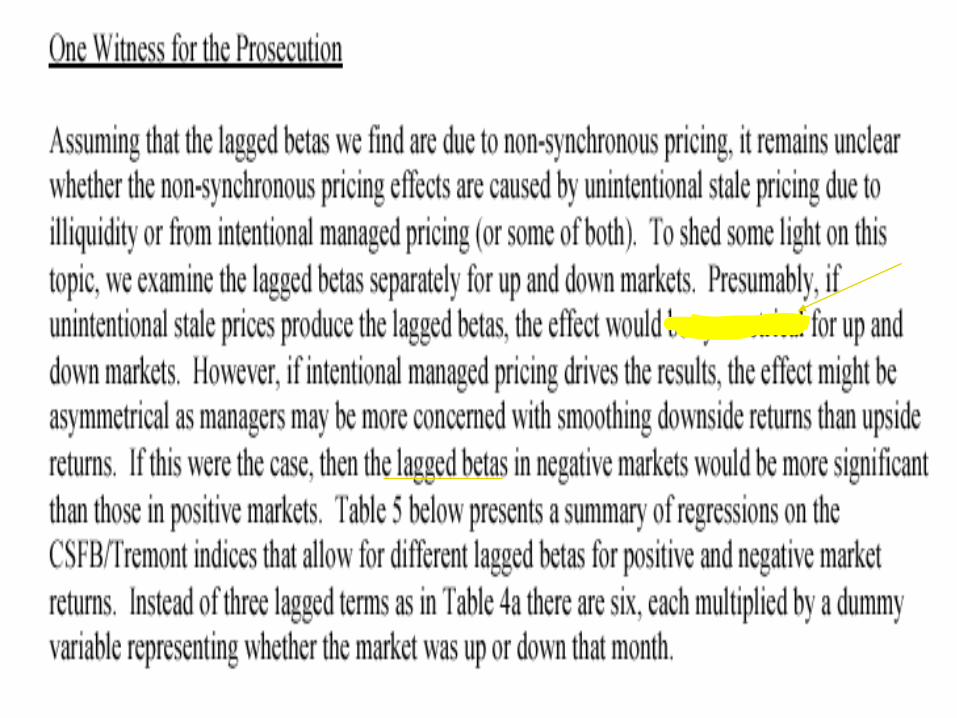
Lagged Betas
In the presence of stale or managed prices, simple linear regressions may produce estimates of b that are biased downward.
There is a common problem:
when estimating betas for small firms, which because of their illiquidity suffer from a similar bias. A very simple technique is to measure market b by running regressions of returns on both contemporaneous and lagged market returns :
If hedge fund returns are not fully synchronous with market returns due to stale or managed prices, then lagged market returns should also be correlated to current hedge fund returns. In this case, the summed b (i.e., β 0 + β 1 + β 2 + β 3 + ...) represents a more accurate measure of a hedge fund’s true beta with the market.
04:5893
04:5894
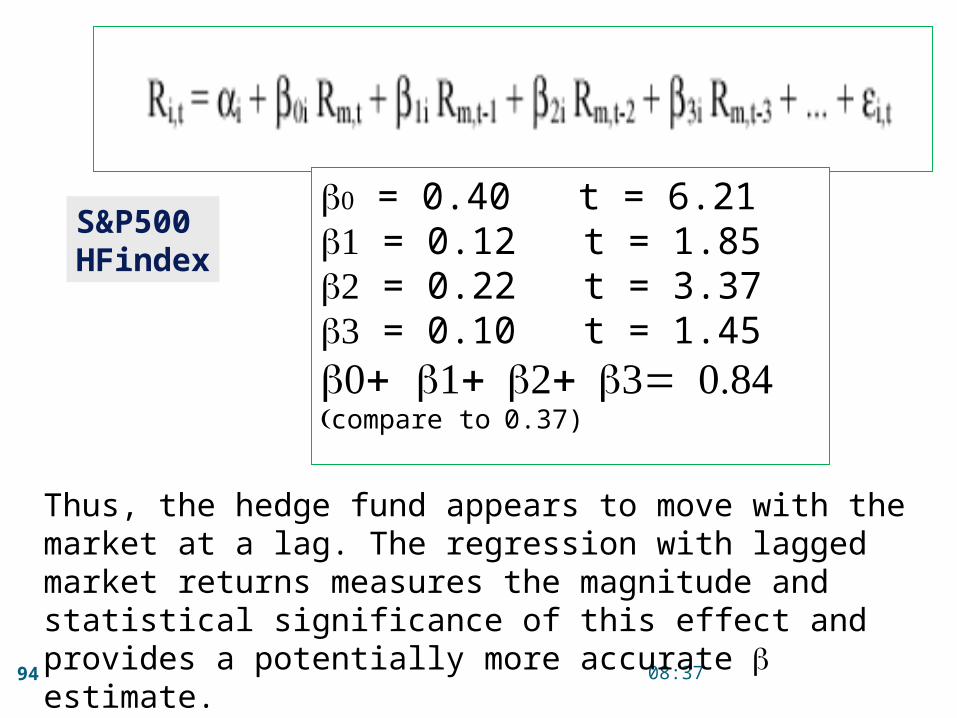
Thus, the hedge fund appears to move with the market at a lag. The regression with lagged market returns measures the magnitude and statistical significance of this effect and provides a potentially more accurate b estimate.
b0 = 0.40 t = 6.211b = 0.12 t = 1.852b = 0.22 t = 3.373b = 0.10 t = 1.45 0+b 1+ 2+ 3= 0.84b b b
(compare to 0.37)
S&P500HFindex
04:5895
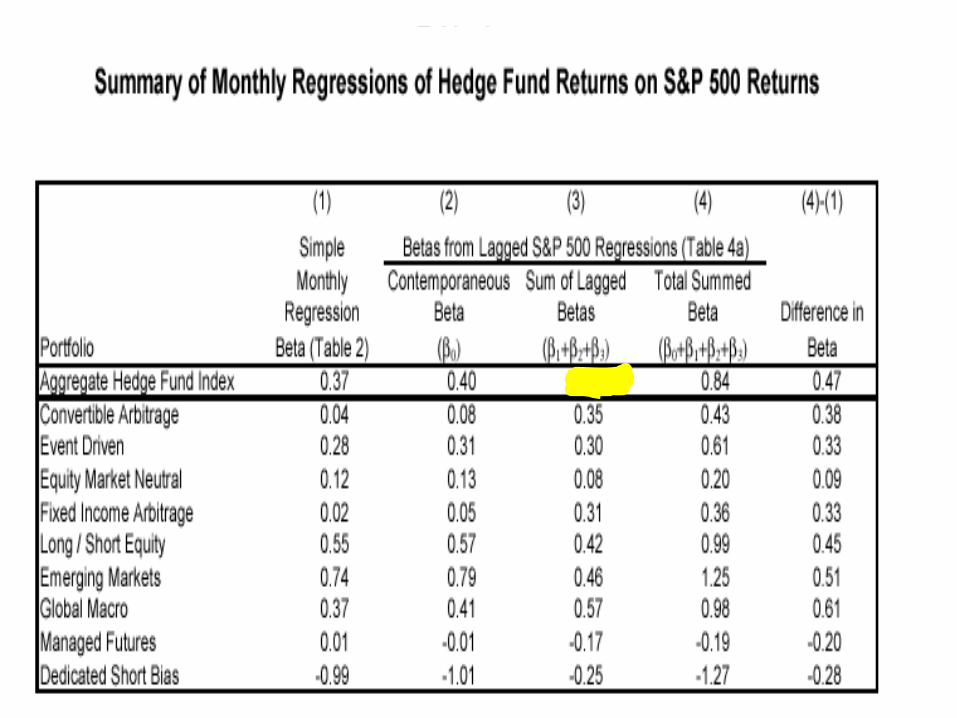
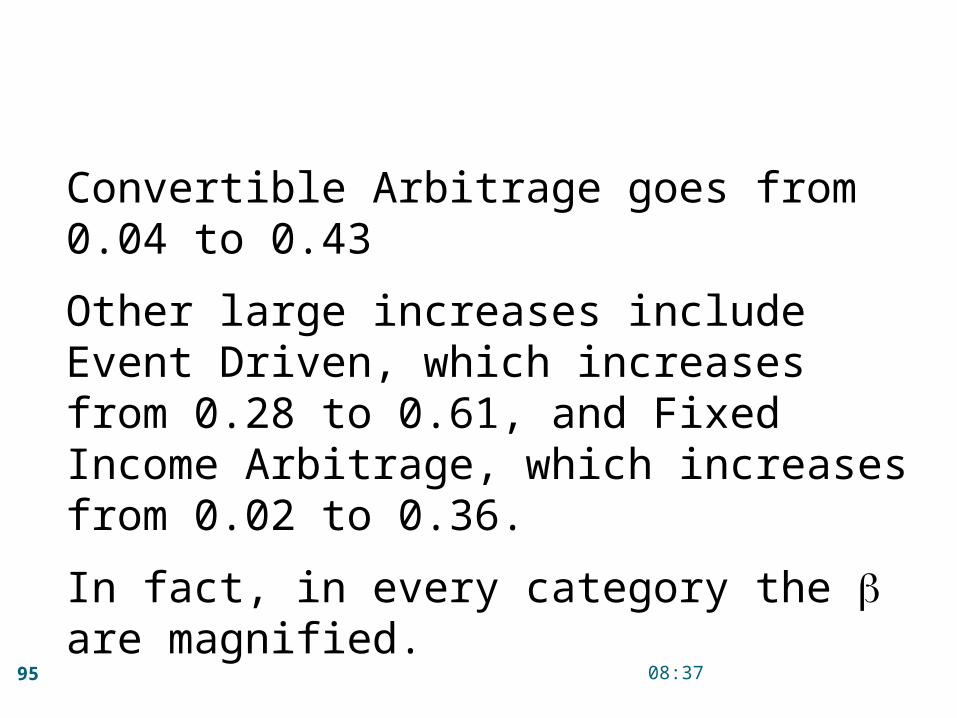
Convertible Arbitrage goes from 0.04 to 0.43
Other large increases include Event Driven, which increases from 0.28 to 0.61, and Fixed Income Arbitrage, which increases from 0.02 to 0.36.
In fact, in every category the b are magnified.
04:5896
04:5897
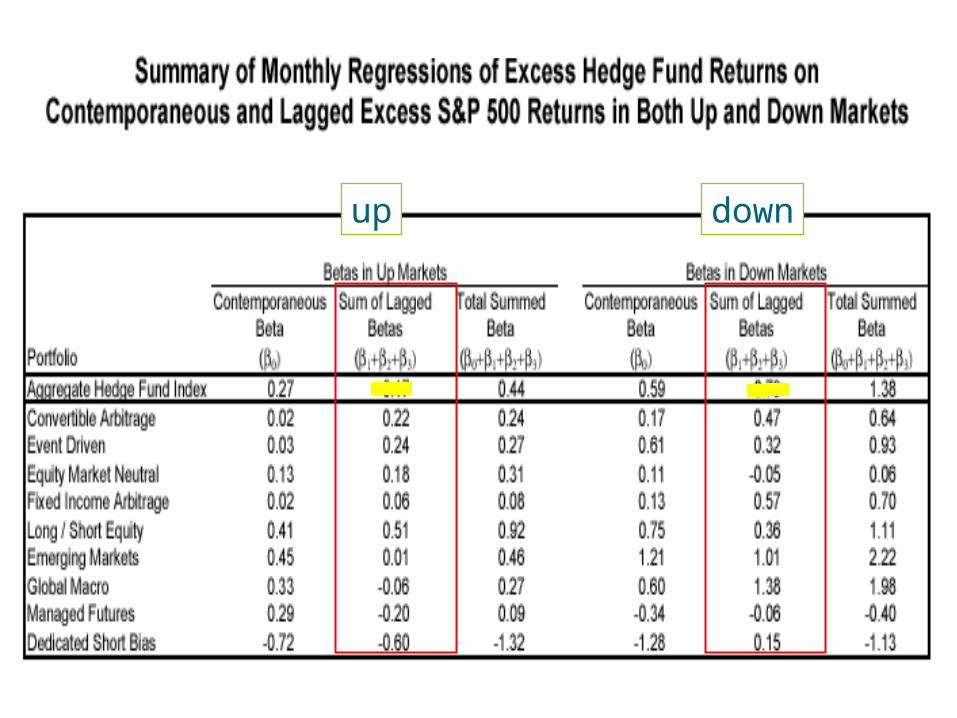
up down
10/04/2023
98
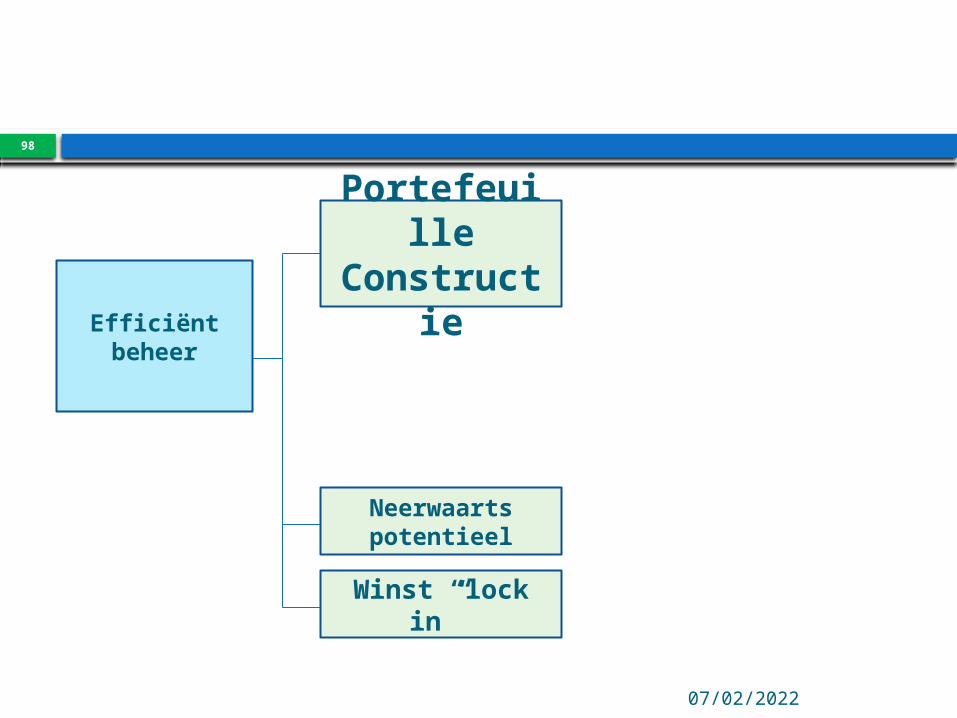
Efficiëntbeheer
Portefeuille
Constructie
Neerwaarts potentieel
Winst “lock in”
10/04/2023
99
Efficiënt Portefeuillebeheer
Oordeelkundige afweging van verwachte opbrengst en risico …

10/04/2023
100
Efficiënt Portefeuillebeheer
Oordeelkundige afweging van verwachte opbrengst en risico
Oordeelkundig Principes voor coherente keuze van asset
klassen, individuele waarden, … ?
Afweging Welk keuzecriterium ?

10/04/2023
101
Efficiënt Portefeuillebeheer
Oordeelkundige afweging van verwachte opbrengst en risico
Verwachte opbrengst ?Beknopte historische schets
Statistische interpretatieDynamische interpretatie
Model ?Actief portefeuillebeheer
102
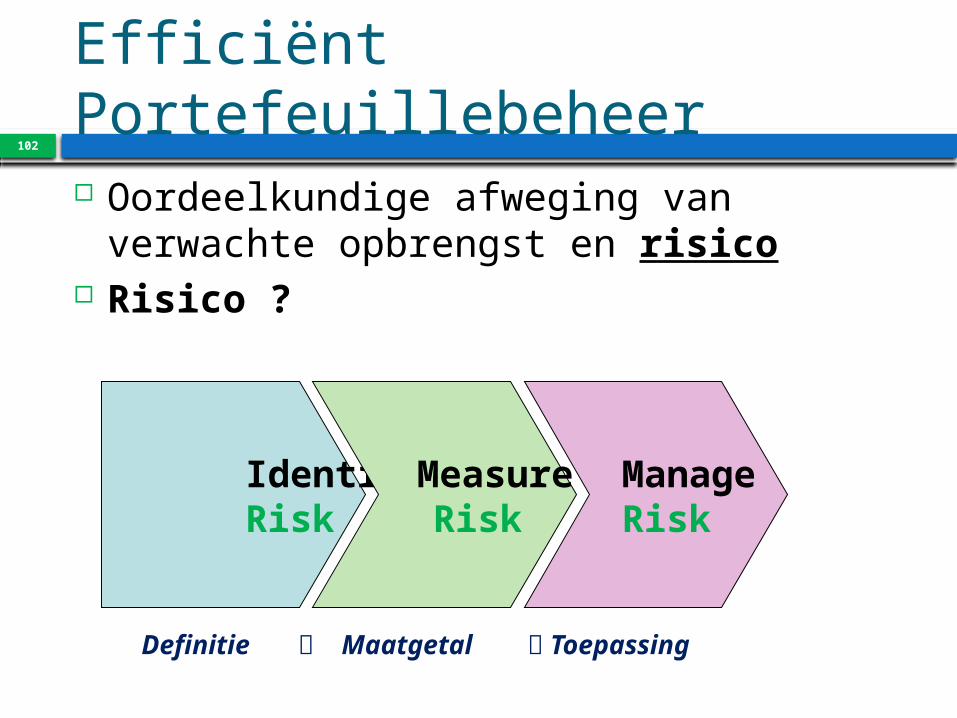
Efficiënt Portefeuillebeheer
Oordeelkundige afweging van verwachte opbrengst en risico
Risico ?
Identify Risk
Measure Risk
Manage Risk
Definitie Maatgetal Toepassing
10/04/2023
103
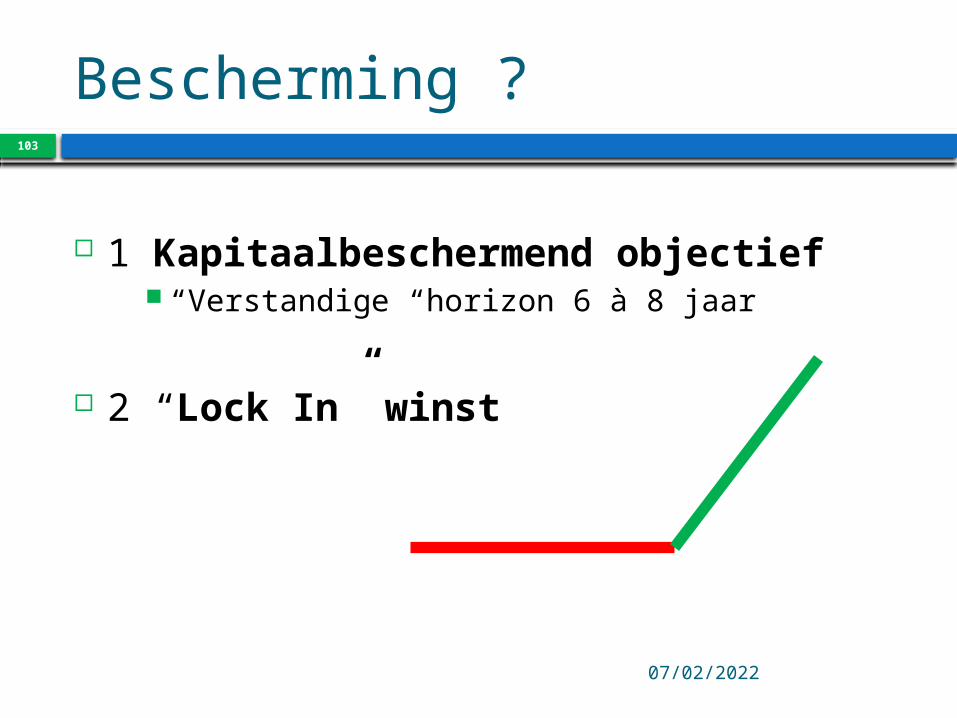
Bescherming ?
1 Kapitaalbeschermend objectief “Verstandige “horizon 6 à 8 jaar
2 “Lock In” winst
10/04/2023
104
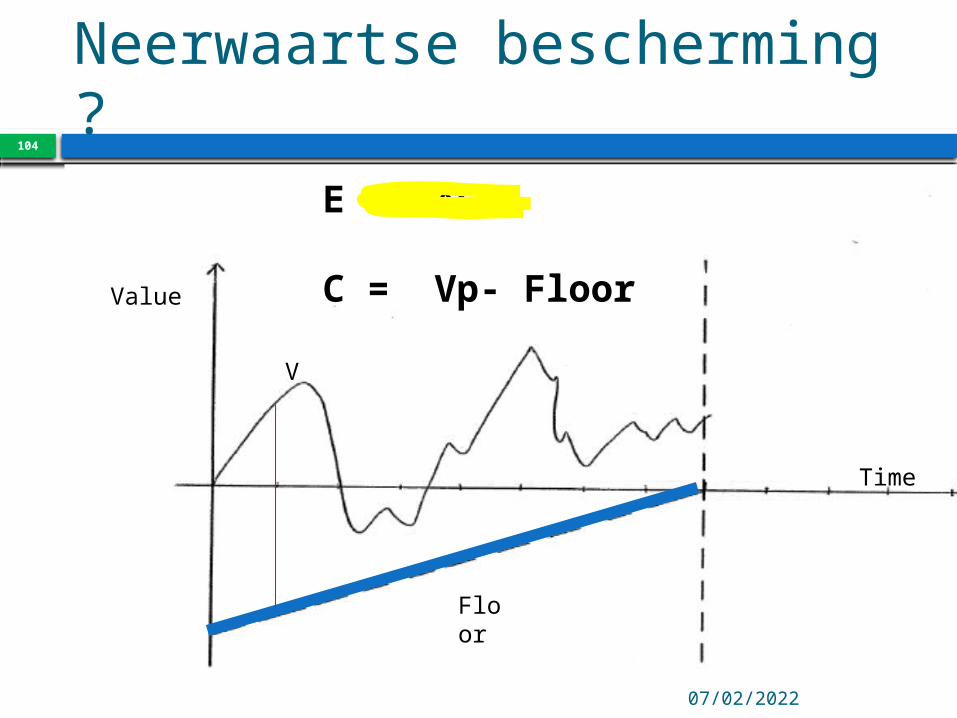
Neerwaartse bescherming ?
V
Floor
Time
Value
E = m*C
C = Vp- Floor
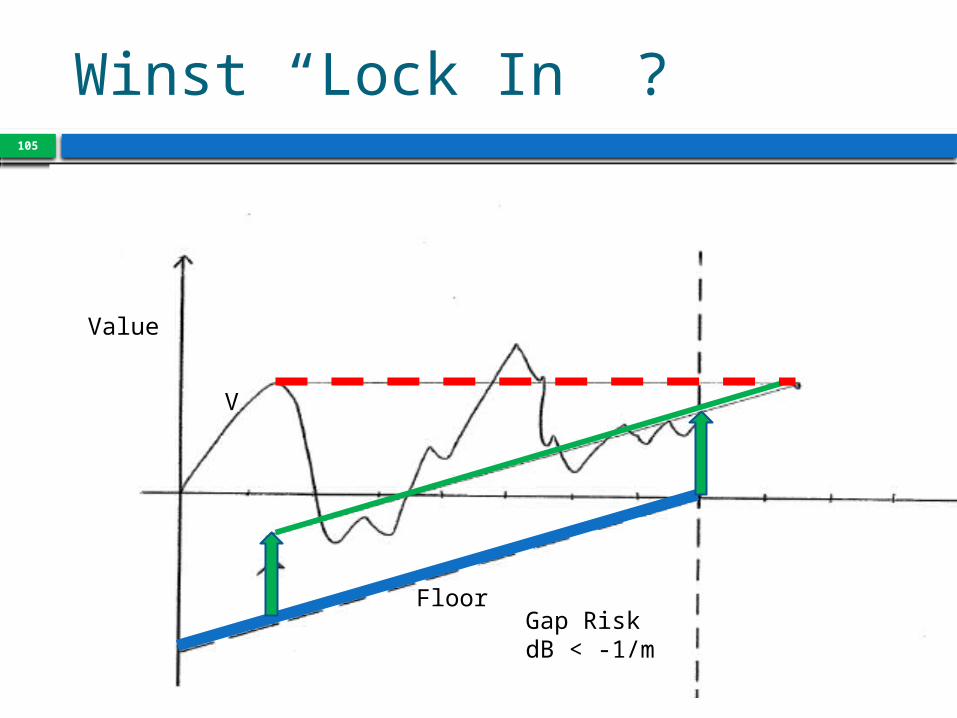
105
Winst “Lock In” ?
V
Floor
Value
Gap RiskdB < -1/m
10/04/2023
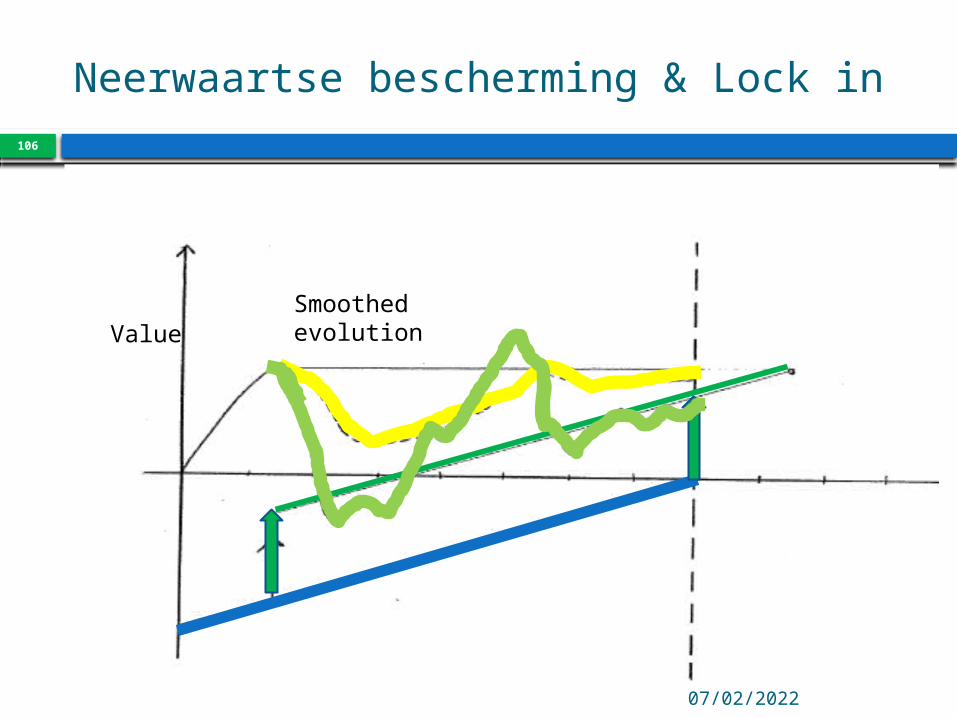
106
Neerwaartse bescherming & Lock in
ValueSmoothed evolution

Professor of : HUB
Advanced Portfolio Management Financial Engineering Financial Risk Management
U Hasselt Financial derivatives
KU Leuven Investment Management Security Pricing & Portfolio Selection
1
Prof Dr Stefan Duchateau 0474 977464