beverages global market global market... · juice drinks rtd carbonated soft drinks white milk...
TRANSCRIPT

Beverages Global Market
Update 2011

2
We would like you to take away from this presentation...
Orange Juice is still the main flavor in the Juice Category
Orange Juice and solids facing a decrease in volumes on the traditional markets
Other beverages competing in the share of throat
40 countries represent 84% of the Global RTD Juice Market and 86% of Global Orange Juice Consumption
Juice Drinks growing faster
Consumer understanding is a must to revamp the Orange Juice market
Tracking market information is also a must
Opportunities for growth in the developing countries
3
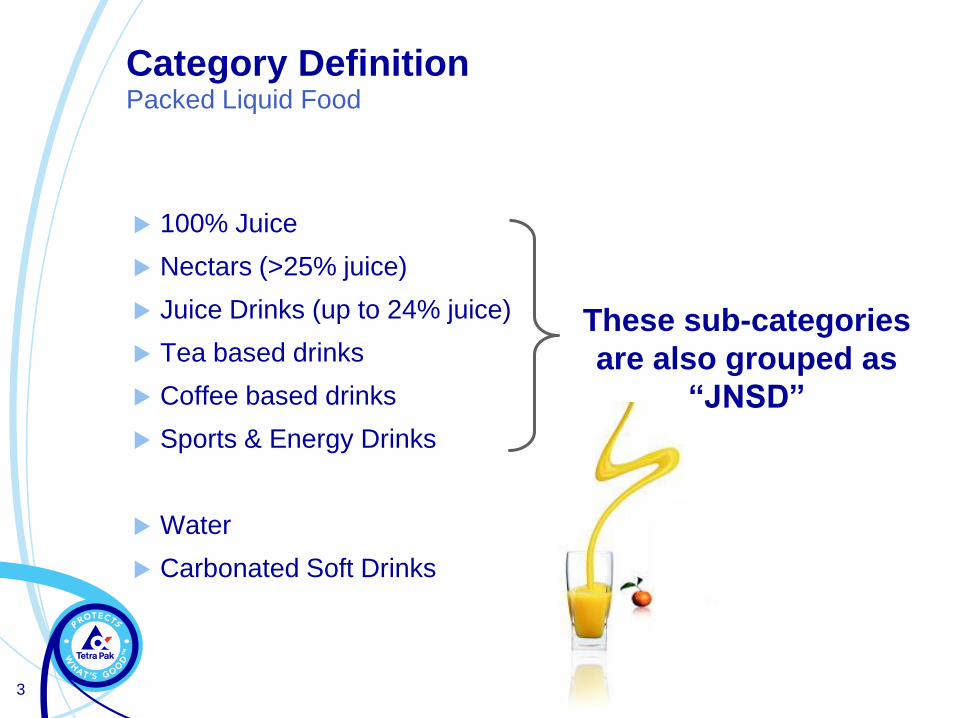
100% Juice
Nectars (>25% juice)
Juice Drinks (up to 24% juice)
Tea based drinks
Coffee based drinks
Sports & Energy Drinks
Water
Carbonated Soft Drinks
These sub-categories
are also grouped as
“JNSD”
Category DefinitionPacked Liquid Food

4
Beer
Juices and Nectars
Juice Drinks RTD
Carbonated Soft Drinks
White Milk
Water
Others
Dairy Based Beverages
Flavoured Milk
Hot Tea
WineHot Coffee
Total Packed Liquid Food Globally E2010Orange Juice contributes with 1.5% of the Total Consumption(Juice Drinks RTD with 0.7% and Juices and Nectars with 0.8%)
1.611 Bio litres (E2010)
Source: Compass 2010 Products & Packages and Industry Estimated
Reported Countries only. * only commercially traded volumes
20.9%
15.3%12.7%
7.2%12.3%
10.8%
0.9%
2.4%
2.4%
9.5%
1.7%
29%
35%
3.9%
Others: Spirits, Tea and Coffee Based Drinks,
Sports & Energy Drinks, FFSD Concentrate and
Powder
5
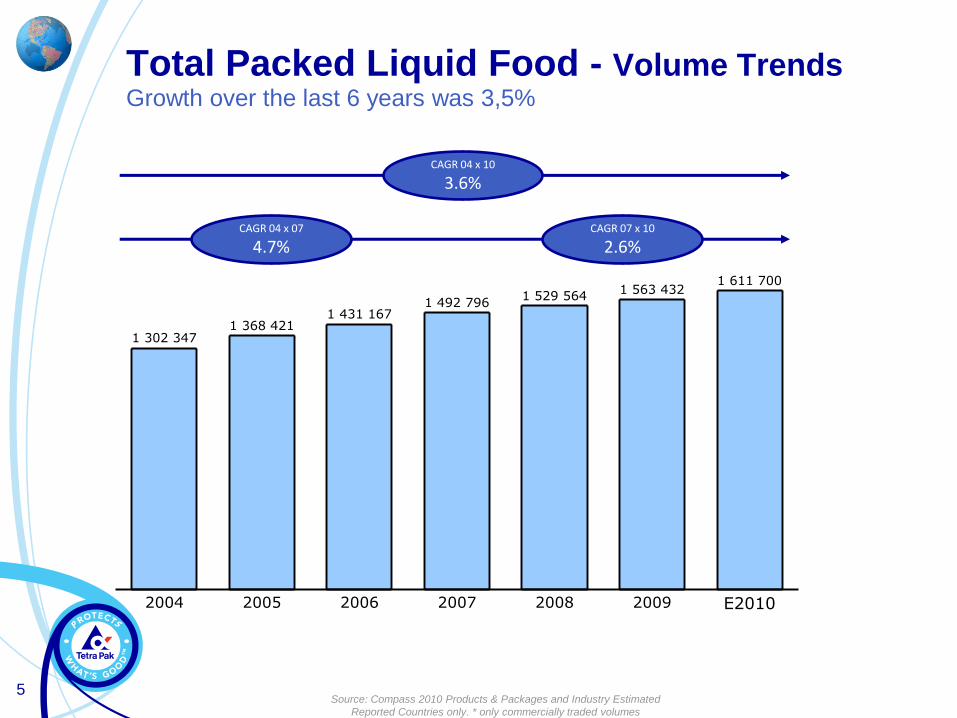
2004
1 302 347
2005
1 368 421
2006
1 431 167
2007
1 492 796
2008
1 529 564
2009
1 563 432
E2010
1 611 700
Total Packed Liquid Food - Volume TrendsGrowth over the last 6 years was 3,5%
Source: Compass 2010 Products & Packages and Industry Estimated
Reported Countries only. * only commercially traded volumes
CAGR 04 x 10
3.6%
CAGR 04 x 07
4.7%CAGR 07 x 10
2.6%
6
2004
1.8%
13.9%
13.3%
14.6%
2.6%
8.9%
6.8%
3.5%
11.2%
20.6%
1 310
2005
1.9%
13.5%
13.3%
14.1%
2.6%
10.0%
6.6%
3.3%
11.0%
21.0%
1 368
2006
2.0%
13.2%
13.8%
13.7%
2.5%
9.8%
6.7%
3.4%
11.1%
21.1%
1 431
2007
2.1%
13.0%
14.3%
13.2%
2.5%
9.6%
6.8%
3.6%
11.3%
21.0%
1 492
2008
2.2%
12.8%
14.7%
13.0%
2.5%
9.5%
6.9%
3.6%
11.2%
21.1%
1 529
2009
2.3%
12.5%
15.0%
12.9%
2.4%
9.5%
7.0%
3.7%
10.9%
21.0%
1 563
E2010
2.4%
12.3%
15.3%
12.7%
0.9%2.4%
9.5%
7.2%3.9%
10.8%
1.7%
20.9%
1 611
White Milk
Hot Coffee
Others
Dairy Based Beverages
Flavoured Milk
Juice and Nectar
Juice Drinks RTD
Carbonated Soft Drinks
Water
Beer
Wine
Hot Tea
CAGR
04x10
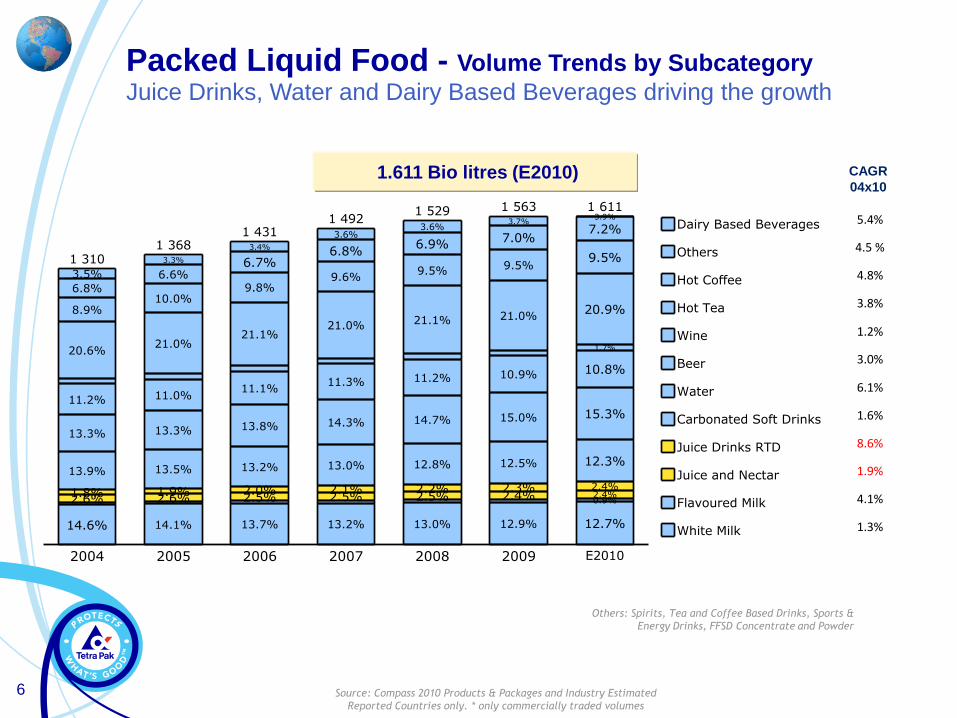
5.4%
4.5 %
4.8%
3.8%
1.2%
3.0%
6.1%
1.6%
8.6%
1.9%
4.1%
1.3%
Packed Liquid Food - Volume Trends by Subcategory
Juice Drinks, Water and Dairy Based Beverages driving the growth
1.611 Bio litres (E2010)
Source: Compass 2010 Products & Packages and Industry Estimated
Reported Countries only. * only commercially traded volumes
Others: Spirits, Tea and Coffee Based Drinks, Sports &
Energy Drinks, FFSD Concentrate and Powder

7
Top Flavors
Soft Drinks Bottled WaterCarbonated
Soft Drinks
Energy &
Sports Drinks
Fruit/Vegetable
JNSD
Flavor for dairy
drinksRTD tea/coffee
Orange Lemon Cola Orange Orange Milk Green Tea
Apple Lime Lemon Lemon Apple Strawberry Coffee
Lemon Orange Orange Lime Mango Chocolate Tea
Mango Apple Lime Citrus Pineapple Yogurt Milk
Strawberry Strawberry Apple Berry Peach Vanilla Lemon
Top 5
Soft Drinks Bottle WaterCarbonated
Soft Drinks
Energy &
Sports Drinks
Fruit/Vegetable
JNSD
Flavor for dairy
drinksRTD tea/coffee
Pomegranate Mineral Orange Pomegranate Pomegranate Strawberry Black Tea
Pineapple
Mango
Fastest growing
Source: Future flavors trends soft drinks 2009
- Euromonitor

8
0.0
0.2
0.4
0.6
0.8
1.0
Fruit Flavor
Mixed Fruits
Grape
Orange
Apple
Peach
Cranberry
Others
PineappleMango
Juice and Nectars - Flavors split e2010 volume mio liters
Source: Euromonitor e2010- % of 40 selected countries representing 84% of world consumption
13.4%
Orange & AppleThe most desired fruits
36.5%
9
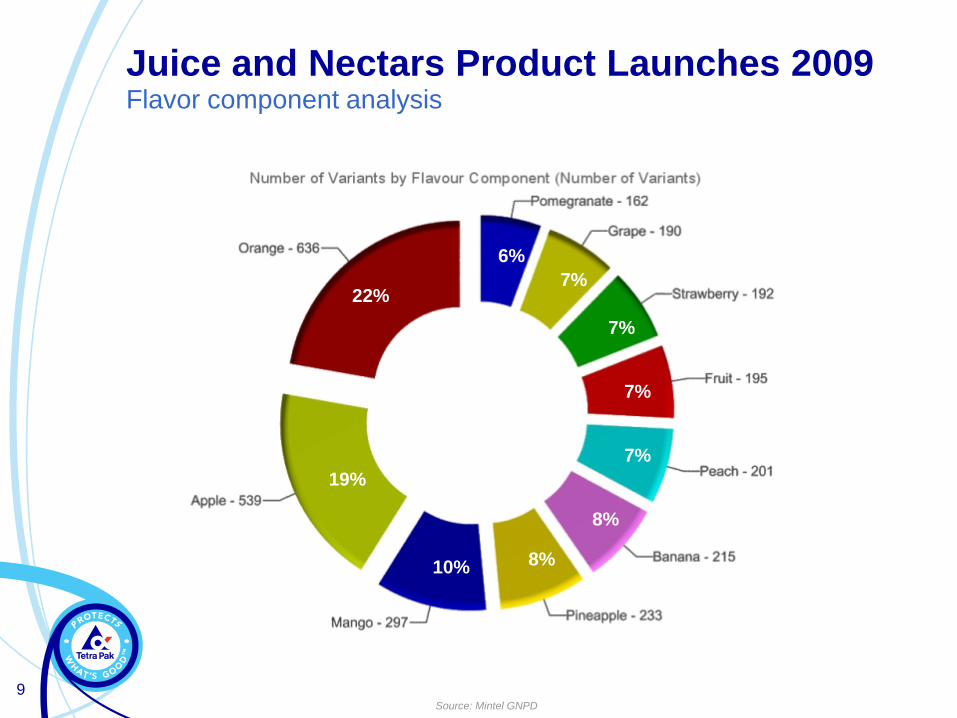
Juice and Nectars Product Launches 2009 Flavor component analysis
Source: Mintel GNPD
22%
6%
7%
7%
7%
7%
8%
8%10%
19%

Deep dive in Global Juices Market
e2010

12
2004
14 355
16 783
11 234
19 070
7 200
10 657
12 017
9 146
16 801
123 270
2005
13 842
16 240
12 724
20 612
7 776
10 531
12 362
9 872
18 143
128 219
2006
14 074
16 496
14 011
22 671
8 543
10 326
12 620
10 961
19 934
135 930
2007
14 119
17 162
15 595
25 341
9 048
10 000
12 728
12 094
22 151
144 708
2008
14 152
17 634
16 231
27 133
9 780
9 752
12 412
12 748
23 945
150 457
2009
14 473
18 324
16 235
29 594
10 544
9 744
11 909
12 818
25 814
156 192
E2010
14 841
19 268
16 939
32 317
11 427
10 384
11 709
13 092
27 976
165 122
Tea Based Drinks
Juice 100% Orange
Juice 100% Non-Orange
Coffee Based Drinks
Sports & Energy Drinks
FFSD Concentrate
FFSD Powder
Juice Drinks RTD Orange
Juice Drinks RTD Non-Orange
Nectar Orange
Nectar Non-Orange
CAGR
04x10
-0.4%
-0.4%
6.2%
5.0%
8.9%
8.0%
2.3 %
0.6%
7.1%
1.6%
9.2%
Packed Juice and Others – Volume Trends Orange decreases in volume, other flavors and other beverages are growing faster
Volumes in MM LITERS
Source: Compass e2010 Products & Packages and Industry Estimated
Reported Countries only. * only commercially traded volumes
CAGR 04 x 10
5.0%
CAGR 04 x 10
5.5%CAGR 07 x 10
4.5%
13
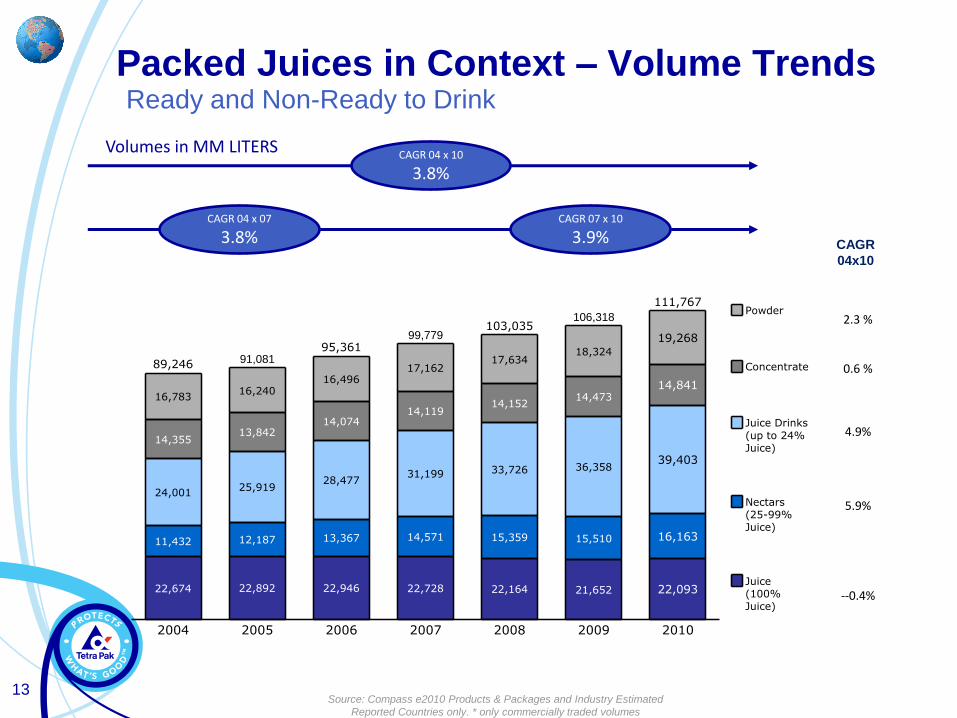
Packed Juices in Context – Volume TrendsReady and Non-Ready to Drink
2004
11,432
22,674
24,001
16,783
14,355
89,246
2005
12,187
22,892
25,919
16,240
13,842
91,081
2006
13,367
22,946
28,477
16,496
14,074
95,361
2007
14,571
22,728
31,199
17,162
14,119
99,779
2008
15,359
22,164
33,726
17,634
14,152
103,035
2009
15,510
21,652
36,358
18,324
14,473
106,318
2010
16,163
22,093
39,403
19,268
14,841
111,767
Juice(100%Juice)
Nectars(25-99%Juice)
Juice Drinks
(up to 24%Juice)
Concentrate
Powder
CAGR 04 x 10
3.8%
CAGR 04 x 07
3.8%CAGR 07 x 10
3.9% CAGR
04x10
2.3 %
0.6 %
4.9%
5.9%
--0.4%
Volumes in MM LITERS
Source: Compass e2010 Products & Packages and Industry Estimated
Reported Countries only. * only commercially traded volumes
14
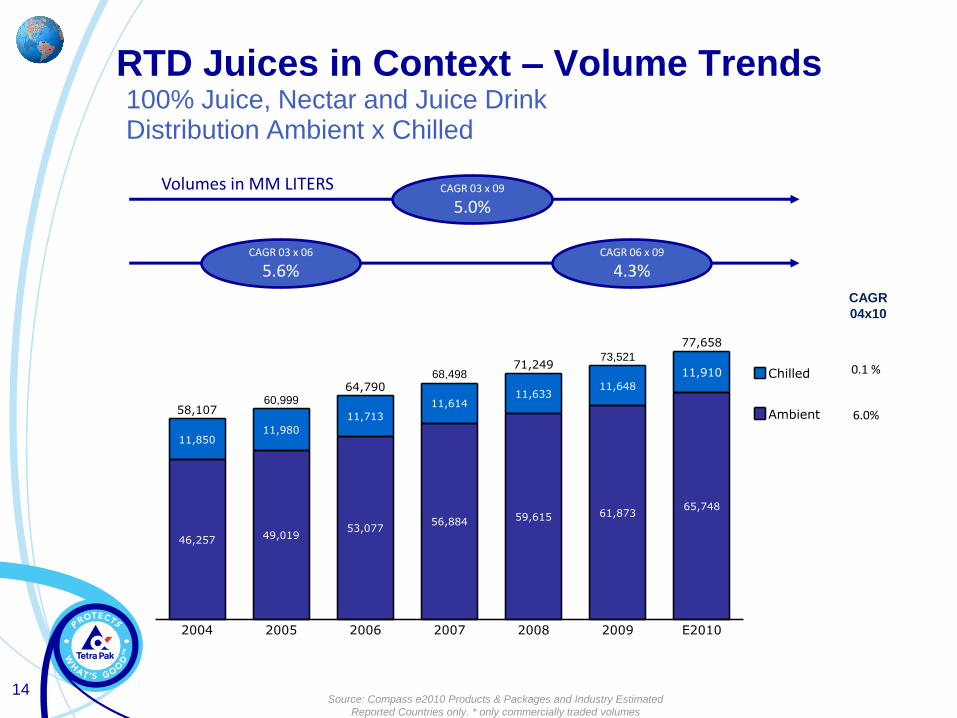
RTD Juices in Context – Volume Trends100% Juice, Nectar and Juice DrinkDistribution Ambient x Chilled
2004
46,257
11,850
58,107
2005
49,019
11,980
60,999
2006
53,077
11,713
64,790
2007
56,884
11,614
68,498
2008
59,615
11,633
71,249
2009
61,873
11,648
73,521
E2010
65,748
11,910
77,658
Ambient
Chilled
CAGR 03 x 09
5.0%
CAGR 03 x 06
5.6%CAGR 06 x 09
4.3%
CAGR
04x10
0.1 %
6.0%
Volumes in MM LITERS
Source: Compass e2010 Products & Packages and Industry Estimated
Reported Countries only. * only commercially traded volumes
Juice Category40 markets with largest
volume contribution

16
100% Juice Nectars Juice Drinks
AUSTRALIA $55,643 CHILE $11,834 ARGENTINA $9,067
AUSTRIA $44,728 ITALY $33,959 BRAZIL $10,810
BELGIUM $43,095 RUSSIA $10,437 CHINA $4,443
CANADA $46,354 SOUTH AFRICA $7,288 COLOMBIA $6,202
DENMARK $56,090 UKRAINE $3,012 FINLAND $44,622
FRANCE $41,086 INDIA $1,359
GERMANY $40,494 INDONESIA $3,040
GREECE $27,000 ISRAEL $28,991
IRELAND $45,751 MEXICO $9,543
JAPAN $42,872 MORROCO $2,848
NETHERLANDS $47,650 PHILIPPINES $2,009
NEW ZEALAND $32,789 POLAND $12,278
NORWAY $85,322 ROMANIA $7,564
SOUTH KOREA $20,748 SAUDI ARABIA $16,883
SPAIN $30,640 TAIWAN $18,619
SWEDEN $49,031 TURKEY $10,119
SWITZERLAND $67,285
UK $36,236
USA $47,457
MethodologyDeep analysis of 40 main consumer markets$ figures = 2010 Disposable Income per Capita
17
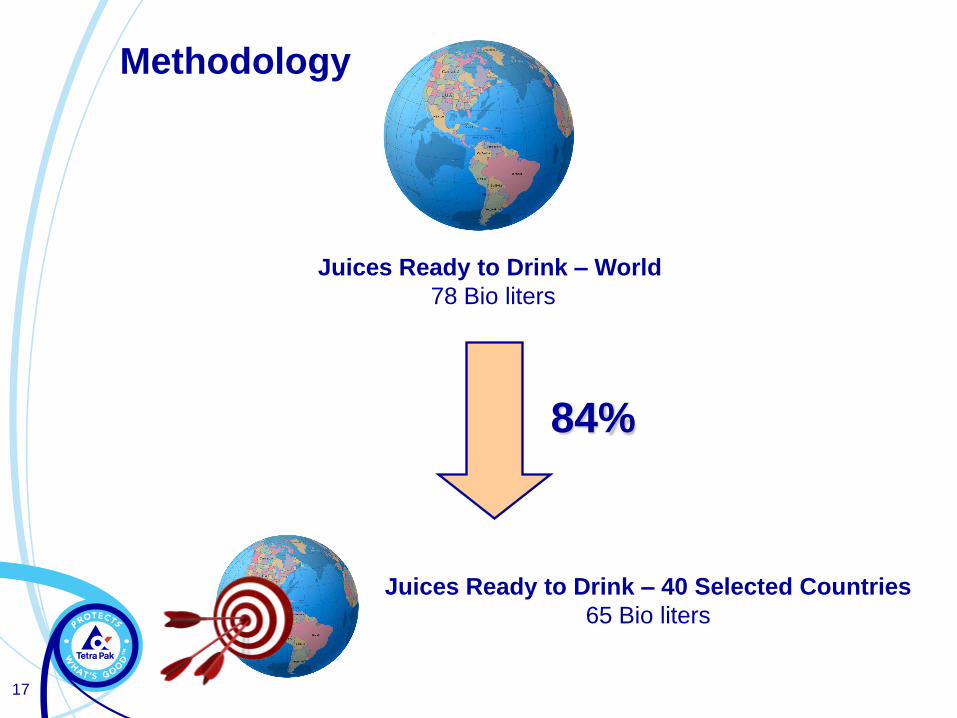
Juices Ready to Drink – World
78 Bio liters
Juices Ready to Drink – 40 Selected Countries
65 Bio liters
84%
Methodology

18
Juices Ready to Drink - Volume
2004
54,770
2005
56,397
2006
58,323
2007
59,730
2008
59,939
2009
63,146
E2010
65,129
CAGR 04 x 10
2.9%
CAGR 04 x 07
2.9%CAGR 07 x 10
2.9%
40 Selected Countries, 2004-2010Volumes in MM LITERS
Source: Compass e2010 Products & Packages and Industry Estimated
Reported Countries only. * only commercially traded volumes

19
Subcategories of Juice RTDVolume Evolution
2004
21,842
9,184
23,744
54,770
2005
21,795
9,729
24,873
56,397
2006
21,793
10,706
25,824
58,323
2007
21,482
11,239
27,009
59,730
2008
20,747
11,673
27,519
59,939
2009
20,419
11,498
31,230
63,146
E2010
19,561
11,870
33,698
65,129
100%JUICES
NECTARS
JUICEDRINKS
CAGR 04 x 10
2.9%CAGR 04 x 07
2.9%CAGR 07 x 10
2.9%
40 Selected Countries, 2004-2010Volumes in MM LITERS
CAGR (%)
2004-07 2007-10 2004-10
4.4% 7.7% 6.0%
7.0% 1.8% 4.4%
-0.6% -3.1% -1.8%
3.0% 3.3% 2.4% 0.3% 5.4% 3.1%
Source: Compass 2010 Products & Packages and Industry Estimated
Reported Countries only. * only commercially traded volumes
Growth vs previous
year

20
World Regions – RTD Juices - Volume Evolution
Asia and Latin America driving the growth
2004
1,363361733
4,512
18,464
18,693
4,512
2005
1,415408727
4,755
18,539
19,213
4,755
2006
1,515517739
5,243
17,895
20,387
5,243
2007
1,587463732
5,590
17,384
20,838
5,590
2008
1,659446744
5,758
16,548
21,134
5,758
2009
1,787439758
6,491
17,211
20,447
6,491
E2010
1,950458770
7,084
16,854
20,828
7,084
NorthAmerica
Europe
Asia
LatinAmerica
Oceania
Africa
MiddleEast
CAGR 04 x 10
2.9%CAGR 04 x 07
2.9%CAGR 07 x 10
2.9%
CAGR (%)
2004-07 2007-10 2004-10
5.2% 7.1% 6.2%
8.6% -0.4% 4.0%
-0.1% 1.7% 0.8%
7.4% 8.2% 7.8%
7.6% 9.8% 8.7%
3.7% 0.0% 1.8%
-2.0% -1.5% -1.5%
Source: Compass 2009 Products & Packages and Industry Estimated
Reported Countries only. * only commercially traded volumes
Growth vs previous
year
40 Selected Countries, 2004-2010Volumes in MM LITERS
3.0% 3.3% 2.4% 0.3% 5.4% 3.1%

21
USA
14,846
China
10,882
Germany
4,502
Mexico
3,544
India
3,416
Rus
sia
3,032
Japa
n
2,777
Franc
e
2,496
UK
2,225
Can
ada
2,009
Brazil
1,713
Polan
d
1,622
Spain
1,399
Saudi A
rabia
1,077
Italy
917
Netherlands
850
Turkey
833
SouthKorea
757
Indonesia
615
Ukraine
604
Main Ready to Drink Juice MarketsUSA is the biggest, but China, Turkey and Indonesia have shown
the biggest growth Juices – TOP 20 Markets, 2010Volumes in MM LITERS
-1.9% 18.4% -1.1% 4.9% 4.4% 5.2% -1.0% 3.1% 1.4% 1.4% 8.4% 3.2% 2.1% 7.5% -0.9% 0.7% 11.0% -3.2% 13.9% 6.7%
CAGR 04x10
Source: Compass 2010 Products & Packages and Industry Estimated
Reported Countries only. * only commercially traded volumes
22
100% Juice
Nectars (>25% juice)
Fruit / Flavoured Still Drinks
Tea based drinks
Coffee based drinks
Sports & Energy Drinks
Water
Carbonated Soft Drinks
What do we mean by „Soft Drinks‟?Category definition
These sub-categories
are also grouped as
“JNSD”
Orange Juice Ready to Drink40 markets with largest volume contribution
23
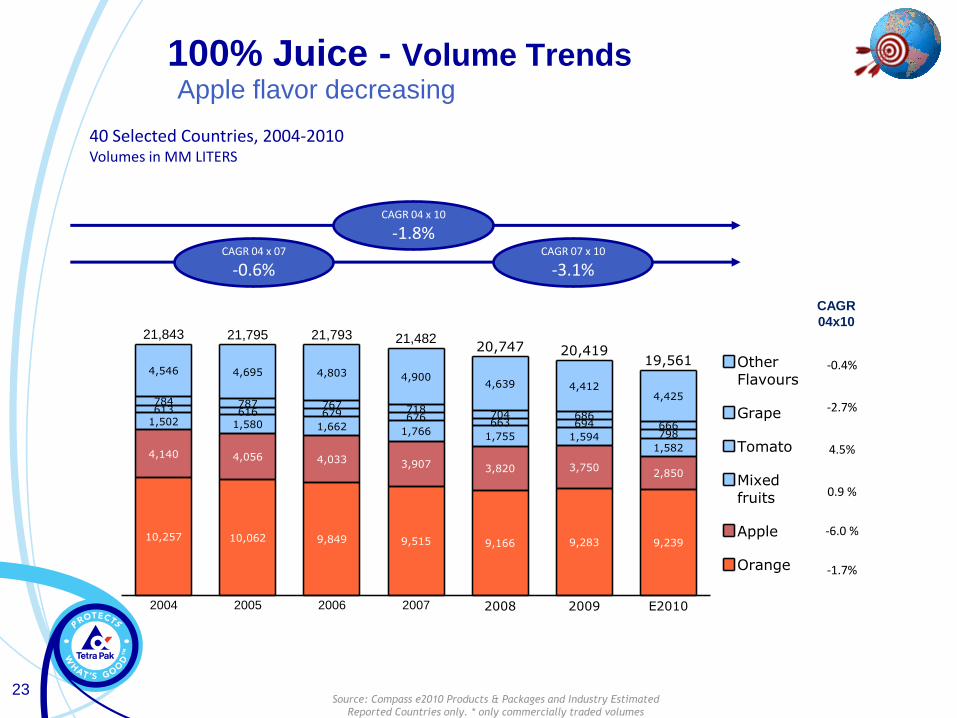
100% Juice - Volume TrendsApple flavor decreasing
2004
4,546
7846131,502
4,140
10,257
21,843
2005
4,695
787616
1,580
4,056
10,062
21,795
2006
4,803
767679
1,662
4,033
9,849
21,793
2007
4,900
718676
1,766
3,907
9,515
21,482
2008
4,639
704663
1,755
3,820
9,166
20,747
2009
4,412
686694
1,594
3,750
9,283
20,419
E2010
4,425
666798
1,582
2,850
9,239
19,561
Orange
Apple
Mixedfruits
Tomato
Grape
OtherFlavours
CAGR 04 x 10
-1.8%CAGR 04 x 07
-0.6%CAGR 07 x 10
-3.1%
40 Selected Countries, 2004-2010Volumes in MM LITERS
Source: Compass e2010 Products & Packages and Industry Estimated
Reported Countries only. * only commercially traded volumes
CAGR
04x10
-0.4%
-2.7%
4.5%
0.9 %
-6.0 %
-1.7%

24
Nectars - Volume TrendsFlavors different than Orange have the highest increase
2004
1,084
1,237
1,809
3,897
449
707
9,184
2005
1,115
1,370
1,841
4,181
450
772
9,729
2006
1,209
1,559
1,920
4,649
519
851
10,706
2007
1,331
1,606
1,932
4,869
563
939
11,239
2008
1,390
1,598
2,009
5,106
1,015
11,673
2009
1,462
1,613
1,983
4,856
1,029
11,498
E2010
1,377
1,379
2,220
5,261
1,068
11,870
Orange
Mixedfruits
Apple
Peach
Mango
OtherFlavours
CAGR 04 x 10
4.4%CAGR 04 x 07
3.4%CAGR 07 x 10
0.9%
Source: Compass e2010 Products & Packages and Industry Estimated
Reported Countries only. * only commercially traded volumes
CAGR
04x10
5.1%
3.9%
7.1 %
4.1%
1.8%
3.5%
40 Selected Countries, 2004-2010Volumes in MM LITERS
25
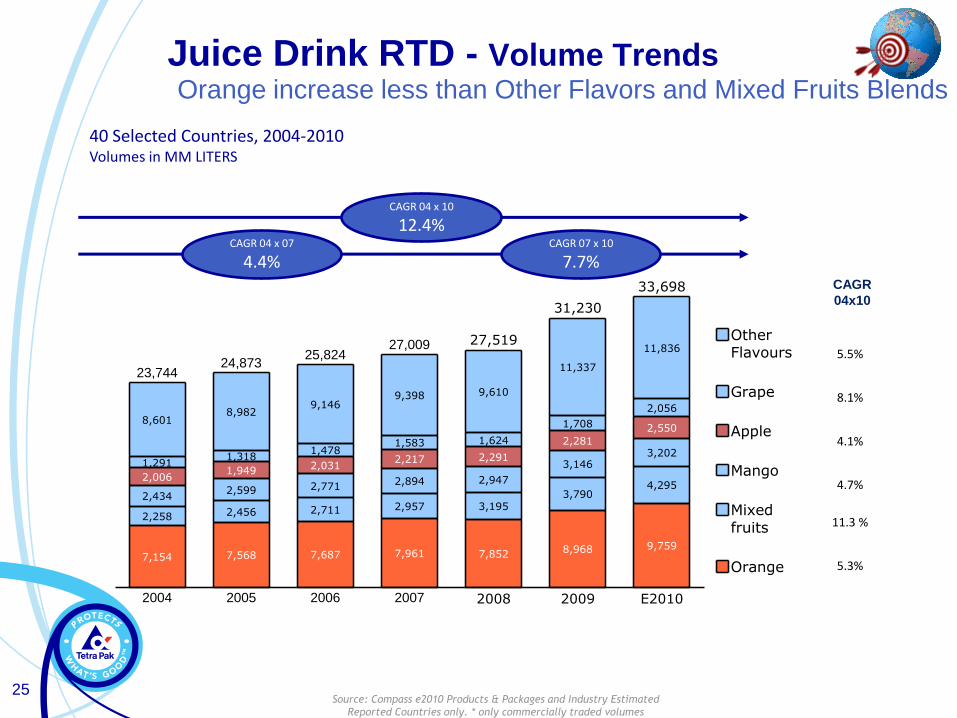
Juice Drink RTD - Volume TrendsOrange increase less than Other Flavors and Mixed Fruits Blends
2004
2,434
2,258
7,154
8,601
1,291
2,006
23,744
2005
2,599
2,456
7,568
8,982
1,318
1,949
24,873
2006
2,771
2,711
7,687
9,146
1,478
2,031
25,824
2007
2,894
2,957
7,961
9,398
1,583
2,217
27,009
2008
2,947
3,195
7,852
9,610
1,624
2,291
27,519
2009
3,146
3,790
8,968
11,337
1,708
2,281
31,230
E2010
3,202
4,295
9,759
11,836
2,056
2,550
33,698
Orange
Mixedfruits
Mango
Apple
Grape
OtherFlavours
CAGR 04 x 10
12.4%CAGR 04 x 07
4.4%CAGR 07 x 10
7.7%
40 Selected Countries, 2004-2010Volumes in MM LITERS
Source: Compass e2010 Products & Packages and Industry Estimated
Reported Countries only. * only commercially traded volumes
CAGR
04x10
5.5%
8.1%
4.1%
4.7%
11.3 %
5.3%
26
2004
7,154
1,809
10,257
19,219
2005
7,568
1,841
10,062
19,471
2006
7,687
1,920
9,849
19,455
2007
7,961
1,932
9,515
19,407
2008
7,852
2,009
9,166
19,028
2009
8,968
1,983
9,283
20,233
E2010
9,759
2,220
9,239
21,219
100%Juice
Nectar
JuiceDrinks
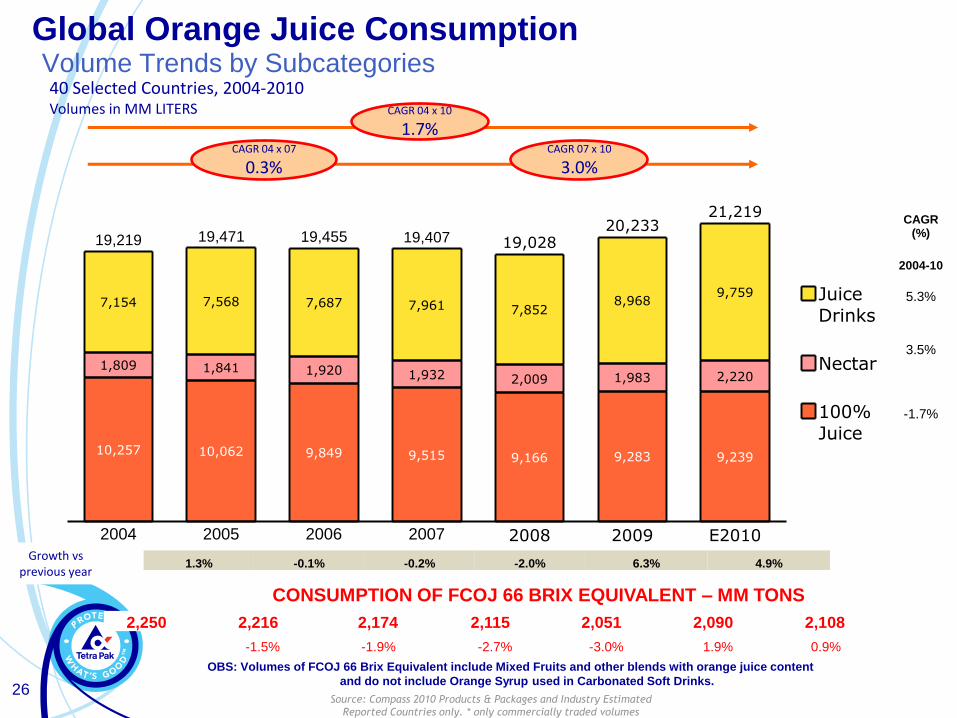
Global Orange Juice ConsumptionVolume Trends by Subcategories
CAGR 04 x 10
1.7%CAGR 04 x 07
0.3%CAGR 07 x 10
3.0%
40 Selected Countries, 2004-2010Volumes in MM LITERS
1.3% -0.1% -0.2% -2.0% 6.3% 4.9%Growth vs
previous year
Source: Compass 2010 Products & Packages and Industry Estimated
Reported Countries only. * only commercially traded volumes
OBS: Volumes of FCOJ 66 Brix Equivalent include Mixed Fruits and other blends with orange juice content
and do not include Orange Syrup used in Carbonated Soft Drinks.
2,250 2,216 2,174 2,115 2,051 2,090 2,108
CONSUMPTION OF FCOJ 66 BRIX EQUIVALENT – MM TONS
-1.5% -1.9% -2.7% -3.0% 1.9% 0.9%
CAGR (%)
2004-10
5.3%
3.5%
-1.7%
27
USA
5,341
China
4,235
Germany
1,230
France
1,155
UK
1,000
Brazil
820
Mexico
784
Japan
765
Canada
753
Russia
640
Spain
440
SaudiArabia
371
Poland
325
SouthKorea
283
Australia
280
SouthAfrica
238
India
236
Indonesia
210
Belgium
155
Italy
144
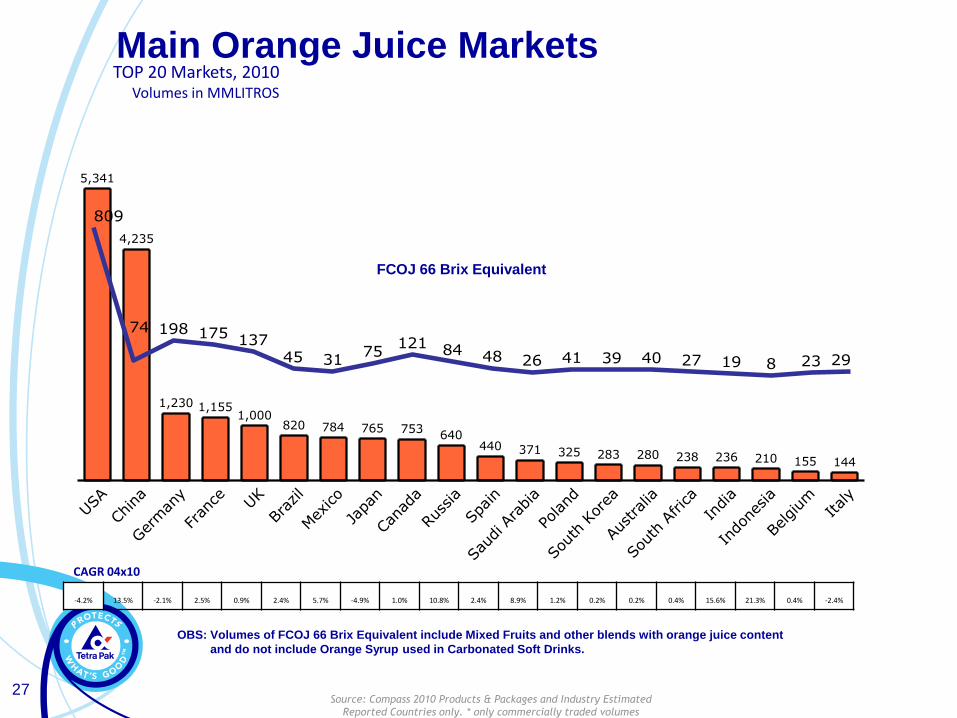
Main Orange Juice Markets TOP 20 Markets, 2010
Volumes in MMLITROS
-4.2% 13.5% -2.1% 2.5% 0.9% 2.4% 5.7% -4.9% 1.0% 10.8% 2.4% 8.9% 1.2% 0.2% 0.2% 0.4% 15.6% 21.3% 0.4% -2.4%
CAGR 04x10
Source: Compass 2010 Products & Packages and Industry Estimated
Reported Countries only. * only commercially traded volumes
809
198 175 13745 31
75121 84 48 26 41 39 40 27 19 8 23 29
74
FCOJ 66 Brix Equivalent
OBS: Volumes of FCOJ 66 Brix Equivalent include Mixed Fruits and other blends with orange juice content
and do not include Orange Syrup used in Carbonated Soft Drinks.

28
Consumption of FCOJ 66 Brix Equivalent on Top 40 Markets2004 2005 2006 2007 2008 2009 E2010
Total Consumption – MM Tons 2,414 2,392 2,361 2,309 2,245 2,275 2,288
1 USA 1,029 985 924 882 826 851 809
2 GERMANY 231 211 213 201 199 193 198
3 FRANCE 147 153 161 165 166 171 175
4 UNITED KINGDOM 136 136 138 137 140 136 137
5 CANADA 117 133 126 120 114 117 121
6 JAPAN 97 95 95 92 76 74 75
7 RUSSIA 59 63 74 79 78 73 84
8 CHINA 42 48 56 60 68 74 88
9 SPAIN 45 47 46 46 47 47 48
10 BRAZIL 37 40 41 37 38 41 45
11 MEXICO 29 29 30 32 30 32 31
12 AUSTRALIA 40 40 40 40 39 40 40
13 SOUTH KOREA 43 42 40 39 39 38 39
14 POLAND 41 40 38 36 37 39 41
15 NETHERLANDS 37 35 35 32 32 32 32
16 ITALY 33 33 31 30 29 29 29
17 SOUTH AFRICA 23 25 26 28 27 27 27
18 SAUDI ARABIA 16 17 19 21 22 23 26
19 SWEDEN 24 24 25 25 24 24 24
20 BELGIUM 22 22 24 23 23 23 23
OBS: Volumes of FCOJ 66 Brix Equivalent include Mixed Fruits and other blends with orange juice content
and do not include Orange Syrup used in Carbonated Soft Drinks.
29
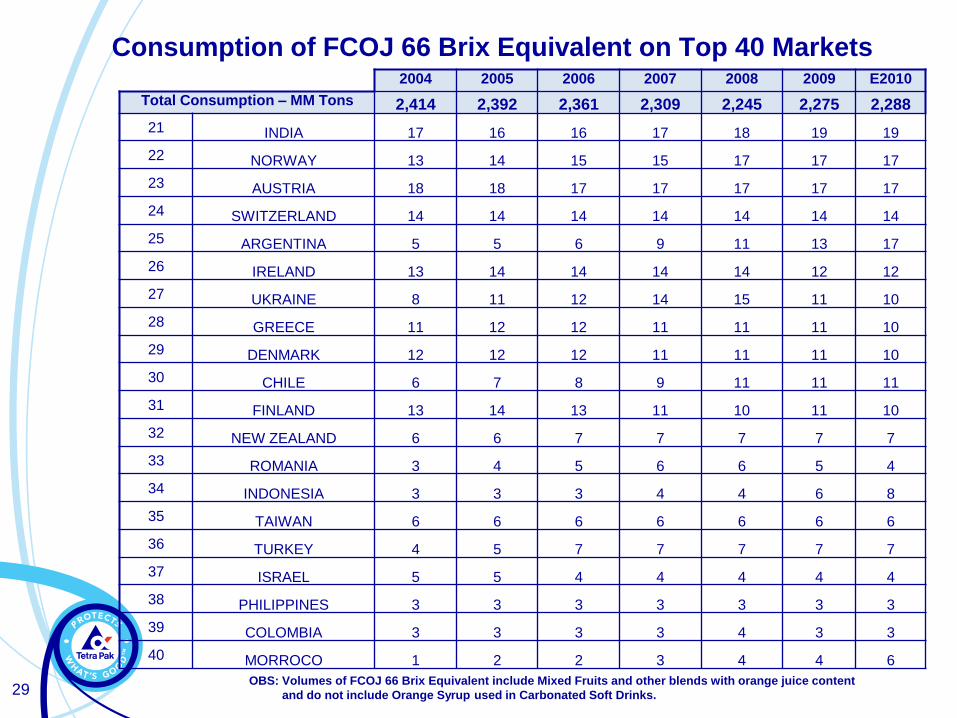
Consumption of FCOJ 66 Brix Equivalent on Top 40 Markets2004 2005 2006 2007 2008 2009 E2010
Total Consumption – MM Tons 2,414 2,392 2,361 2,309 2,245 2,275 2,288
21 INDIA 17 16 16 17 18 19 19
22 NORWAY 13 14 15 15 17 17 17
23 AUSTRIA 18 18 17 17 17 17 17
24 SWITZERLAND 14 14 14 14 14 14 14
25 ARGENTINA 5 5 6 9 11 13 17
26 IRELAND 13 14 14 14 14 12 12
27 UKRAINE 8 11 12 14 15 11 10
28 GREECE 11 12 12 11 11 11 10
29 DENMARK 12 12 12 11 11 11 10
30 CHILE 6 7 8 9 11 11 11
31 FINLAND 13 14 13 11 10 11 10
32 NEW ZEALAND 6 6 7 7 7 7 7
33 ROMANIA 3 4 5 6 6 5 4
34 INDONESIA 3 3 3 4 4 6 8
35 TAIWAN 6 6 6 6 6 6 6
36 TURKEY 4 5 7 7 7 7 7
37 ISRAEL 5 5 4 4 4 4 4
38 PHILIPPINES 3 3 3 3 3 3 3
39 COLOMBIA 3 3 3 3 4 3 3
40 MORROCO 1 2 2 3 4 4 6
OBS: Volumes of FCOJ 66 Brix Equivalent include Mixed Fruits and other blends with orange juice content
and do not include Orange Syrup used in Carbonated Soft Drinks.
30
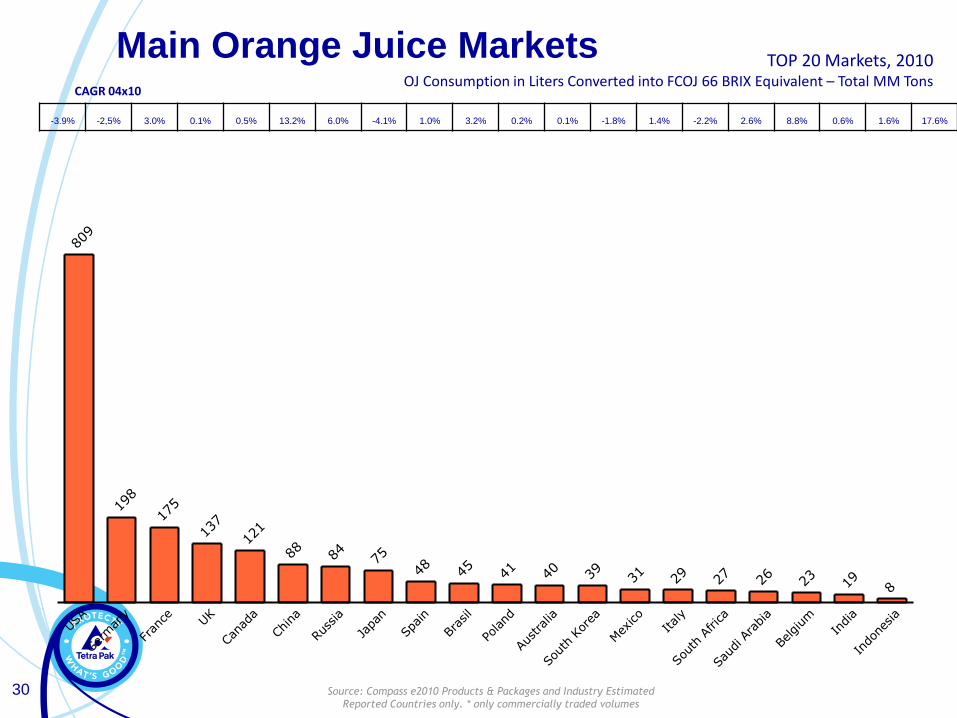
USA
809
Germany
198
France
175
UK
137
Canada
121
China
88
Russia
84
Japan
75
Spain
48
Brasil
45
Poland
41
Australia
40
SouthKorea
39
Mexico
31
Italy
29
SouthAfrica
27
Saudi Arabia
26
Belgium
23
India
19
Indonesia
8
Main Orange Juice Markets TOP 20 Markets, 2010OJ Consumption in Liters Converted into FCOJ 66 BRIX Equivalent – Total MM Tons
-3.9% -2,5% 3.0% 0.1% 0.5% 13.2% 6.0% -4.1% 1.0% 3.2% 0.2% 0.1% -1.8% 1.4% -2.2% 2.6% 8.8% 0.6% 1.6% 17.6%
CAGR 04x10
Source: Compass e2010 Products & Packages and Industry Estimated
Reported Countries only. * only commercially traded volumes
31
0
20
40
60
80
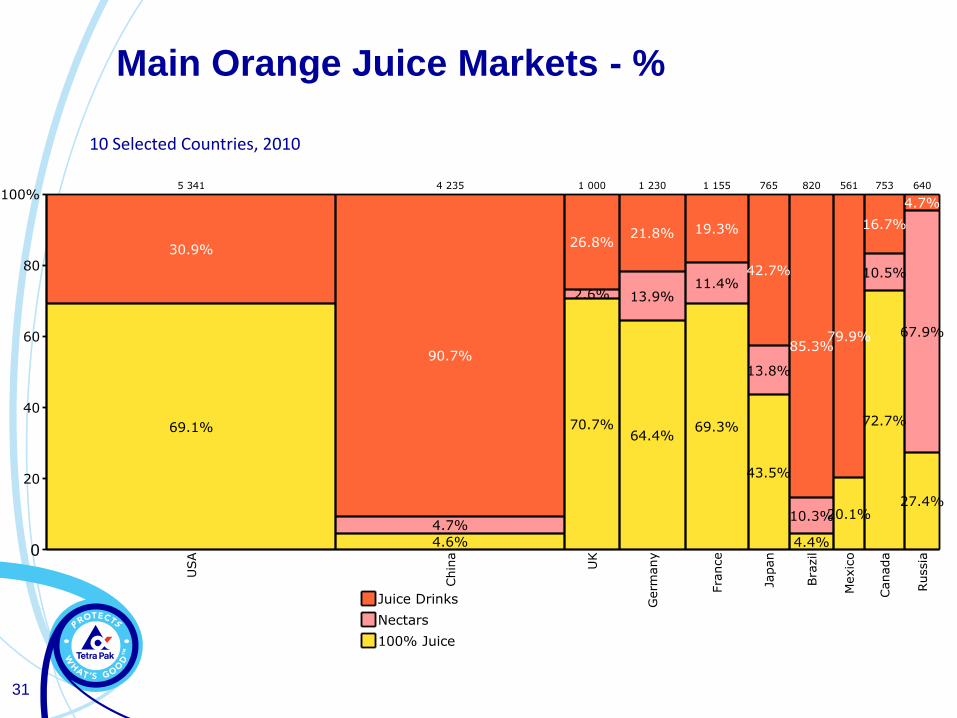
100%USA
30.9%
69.1%
5 341
China
90.7%
4.7%
4.6%
4 235
UK
26.8%
2.6%
70.7%
1 000
Germany
21.8%
13.9%
64.4%
1 230
France
19.3%
11.4%
69.3%
1 155
Japan
42.7%
13.8%
43.5%
765
Brazil
85.3%
10.3%
4.4%
820
Mexico
79.9%
20.1%
561
Canada
16.7%
10.5%
72.7%
753
Russia
4.7%
67.9%
27.4%
640
100% Juice
Nectars
Juice Drinks
Main Orange Juice Markets - %
10 Selected Countries, 2010
32
North America
North America
USA Canadá

33
Orange Juice Consumption
Volume Trends by Subcategories
North America, 2004-2010Volumes in MM LITERS – Selected Countries
2004
5,289
137
2,207
7,633
2005
5,115
167
2,168
7,450
2006
4,813
130
1,967
6,909
2007
4,579
124
1,697
6,400
2008
4,341
1,276
5,687
2009
4,430
1,899
6,402
E2010
4,238
1,776
6,132
Juice100%
Nectar
JuiceDrinks
CAGR 04 x 10
-3.6%CAGR 04 x 07
-5.7%CAGR 07 x 10
-1.4%
-2.4% -7.3% -7.4% -11.1% 12.6% -4.2%Growth vs previous year
1,147 1,118 1,050 1,002 939 968 930
CONSUMPTION OF FCOJ 66 BRIX EQUIVALENT – MM TONS
-3% -6% -5% -6% 3% -4%
CAGR (%)
2004-10
-3.6%
-2.5%
-3.6%
Source: Compass 2010 Products & Packages and Industry Estimated
Reported Countries only. * only commercially traded volumes
OBS: Volumes of FCOJ 66 Brix Equivalent include Mixed Fruits and other blends with orange juice
content and do not include Orange Syrup used in Carbonated Soft Drinks.

34
United States
2004 2005 2006 2007 2008 2009 2010
OJ liters Mio Liters 6,922 6,633 6,151 5,679 5,012 5,673 5,341FCOJ 66 Brix
EquivalentMM Tons 1,029 985 924 882 826 851 809
Population: National Estimates at January
1st'000 292,892 295,561 298,363 301,290 304,060 306,600 308,862
GDP per capita US$ $40,519 $42,761 $44,908 $46,725 $47,495 $46,504 $47,457
Unemployment Rate % 5.5% 5.1% 4.6% 4.6% 5.8% 9.3% 9.6%
Total Disposable Income
US$ Billion
$8,561,900 $8,944,300 $9,435,621 $9,932,805 $10,211,625 $10,091,869 $10.471.546
Per Capita Annual Disposable Income
US$ $29,232 $30,262 $31,625 $32,968 $33,584 $32,915 $33,904
Inflation % 2.7% 3.4% 3.2% 2.9% 3.8% -0.3% 1.6%
Source: indexmundi / European Central Bank
OBS: Volumes of FCOJ 66 Brix Equivalent include Mixed Fruits and other blends with orange juice content
and do not include Orange Syrup used in Carbonated Soft Drinks.
Source: Compass 2010 Products & Packages and Industry Estimated
Reported Countries only. * only commercially traded volumes
35
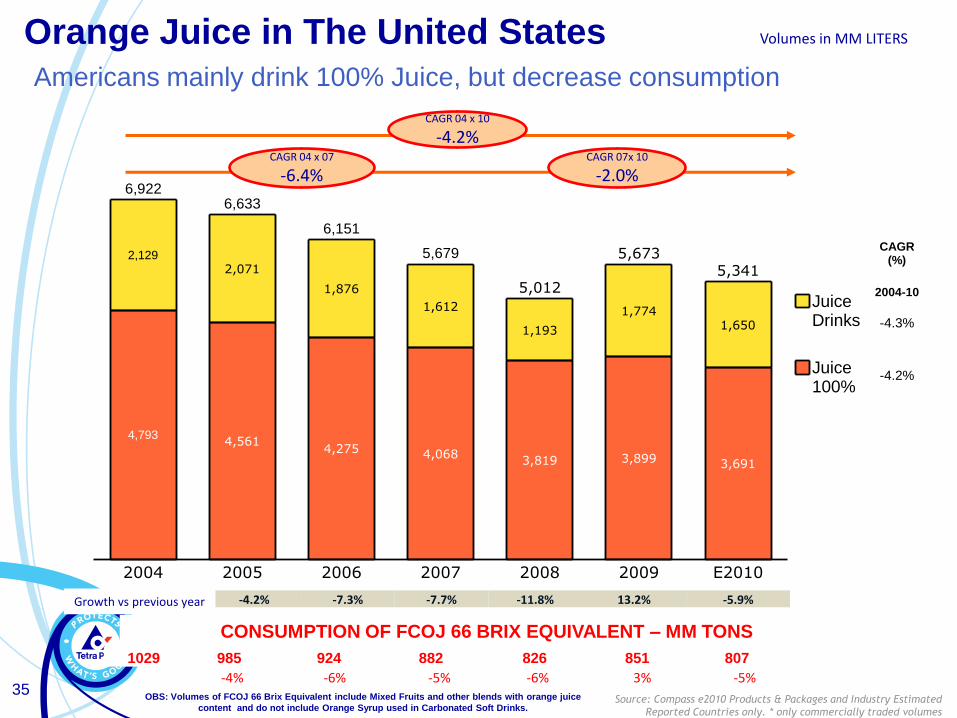
Orange Juice in The United States
Americans mainly drink 100% Juice, but decrease consumption
2004
2,129
4,793
6,922
2005
2,071
4,561
6,633
2006
1,876
4,275
6,151
2007
1,612
4,068
5,679
2008
1,193
3,819
5,012
2009
1,774
3,899
5,673
E2010
1,650
3,691
5,341
Juice100%
JuiceDrinks
CAGR 04 x 10
-4.2%CAGR 04 x 07
-6.4%CAGR 07x 10
-2.0%
Volumes in MM LITERS
CAGR (%)
2004-10
-4.3%
-4.2%
-4.2% -7.3% -7.7% -11.8% 13.2% -5.9%Growth vs previous year
1029 985 924 882 826 851 807
CONSUMPTION OF FCOJ 66 BRIX EQUIVALENT – MM TONS
-4% -6% -5% -6% 3% -5%
Source: Compass e2010 Products & Packages and Industry Estimated
Reported Countries only. * only commercially traded volumes
OBS: Volumes of FCOJ 66 Brix Equivalent include Mixed Fruits and other blends with orange juice
content and do not include Orange Syrup used in Carbonated Soft Drinks.

36
Europe
Europe
Germany Spain
UK Romania
France Sweden
Italy Belgium
Turkey Norway
Russia Austria
Denmark Switzerland
Poland Ireland
Netherlands Ukraine
Finland Greece
Source: Compass e2010 Products & Packages and Industry Estimated
Reported Countries only. * only commercially traded volumes

37
2004
3,656
968
1,193
5,818
2005
3,638
929
1,212
5,779
2006
3,703
976
1,263
5,942
2007
3,609
1,024
1,296
5,929
2008
3,585
1,045
1,325
5,955
2009
3,569
1,064
1,320
5,953
E2010
3,648
1,174
1,344
6,167
Juice100%
Nectar
JuiceDrinks
CAGR 04 x 10
1.8%CAGR 04 x 10
3.7%CAGR 067x 10
0.0%
-3.2% -0.7% 2.8% -0.2% 0.0% 3.6%Growth vs previous year
Europe, 2004-2010Volumes in MM LITERS - Selected Countries
Orange Juice Consumption
Volume Trends by Subcategories
889 883 906 896 896 883 903
CONSUMPTION OF FCOJ 66 BRIX EQUIVALENT – MM TONS
-1% 3% -1% 0% -1% 2%
CAGR (%)
2004-10
2.0%
3.3%
0.0%
Source: Compass e2010 Products & Packages and Industry Estimated
Reported Countries only. * only commercially traded volumes
OBS: Volumes of FCOJ 66 Brix Equivalent include Mixed Fruits and other blends with orange juice
content and do not include Orange Syrup used in Carbonated Soft Drinks.
38
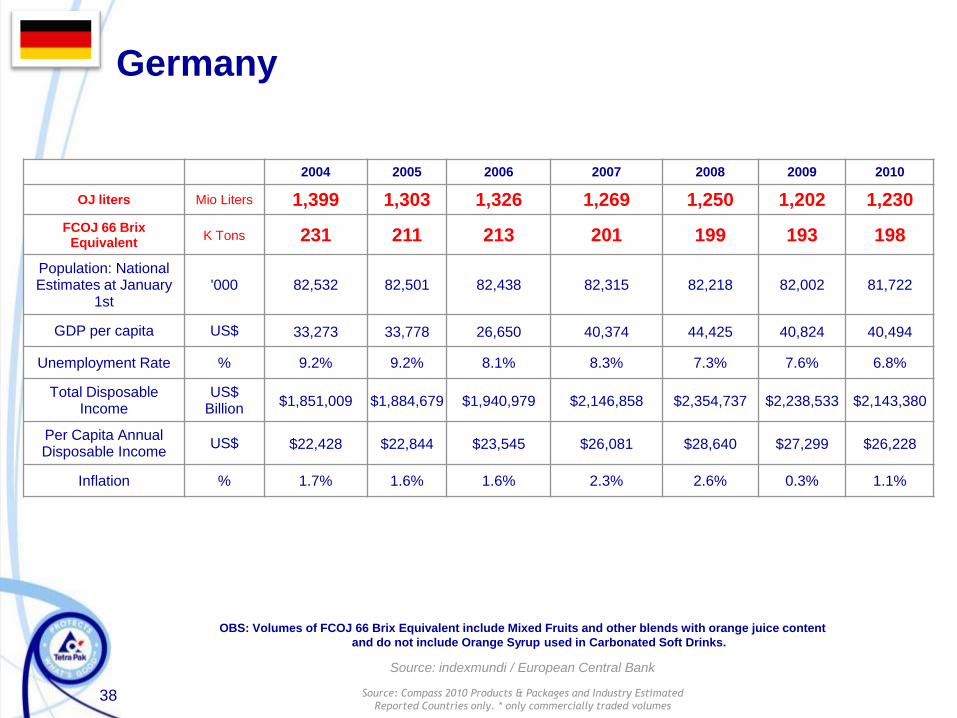
Germany
2004 2005 2006 2007 2008 2009 2010
OJ liters Mio Liters 1,399 1,303 1,326 1,269 1,250 1,202 1,230
FCOJ 66 Brix Equivalent
K Tons 231 211 213 201 199 193 198
Population: National Estimates at January
1st'000 82,532 82,501 82,438 82,315 82,218 82,002 81,722
GDP per capita US$ 33,273 33,778 26,650 40,374 44,425 40,824 40,494
Unemployment Rate % 9.2% 9.2% 8.1% 8.3% 7.3% 7.6% 6.8%
Total Disposable Income
US$ Billion
$1,851,009 $1,884,679 $1,940,979 $2,146,858 $2,354,737 $2,238,533 $2,143,380
Per Capita Annual Disposable Income
US$ $22,428 $22,844 $23,545 $26,081 $28,640 $27,299 $26,228
Inflation % 1.7% 1.6% 1.6% 2.3% 2.6% 0.3% 1.1%
Source: indexmundi / European Central Bank
OBS: Volumes of FCOJ 66 Brix Equivalent include Mixed Fruits and other blends with orange juice content
and do not include Orange Syrup used in Carbonated Soft Drinks.
Source: Compass 2010 Products & Packages and Industry Estimated
Reported Countries only. * only commercially traded volumes

39
Orange Juice in Germany Germans mainly drink 100% Juice, but decrease consumption
2004
284
200
915
1,399
2005
299
174
830
1,303
2006
315
176
836
1,327
2007
307
178
784
1,268
2008
293
185
773
1,251
2009
266
176
760
1,202
E2010
268
170
792
1,230
Juice100%
Nectar
JuiceDrinks
CAGR 04 x 10
-2.1%CAGR 04 x 07
-3.2%CAGR 07 x 10
-1.0%
Volumes in MM LITERS
CAGR (%)
2004-10
-1.0%
-2.6%
-2.4%
-6.8% 1.8% -4.3% -1.5% -3.9% 2.4%Growth vs previous year
Source: Compass e2010 Products & Packages and Industry Estimated
Reported Countries only. * only commercially traded volumes
OBS: Volumes of FCOJ 66 Brix Equivalent include Mixed Fruits and other blends with orange juice
content and do not include Orange Syrup used in Carbonated Soft Drinks.
231 211 213 201 199 193 198CONSUMPTION OF FCOJ 66 BRIX EQUIVALENT – MM TONS
-9% 1% -5% -1% -3% -2%

40
Asia
Asia
Japan South Korea
China Indonesia
India Philippines
Taiwan
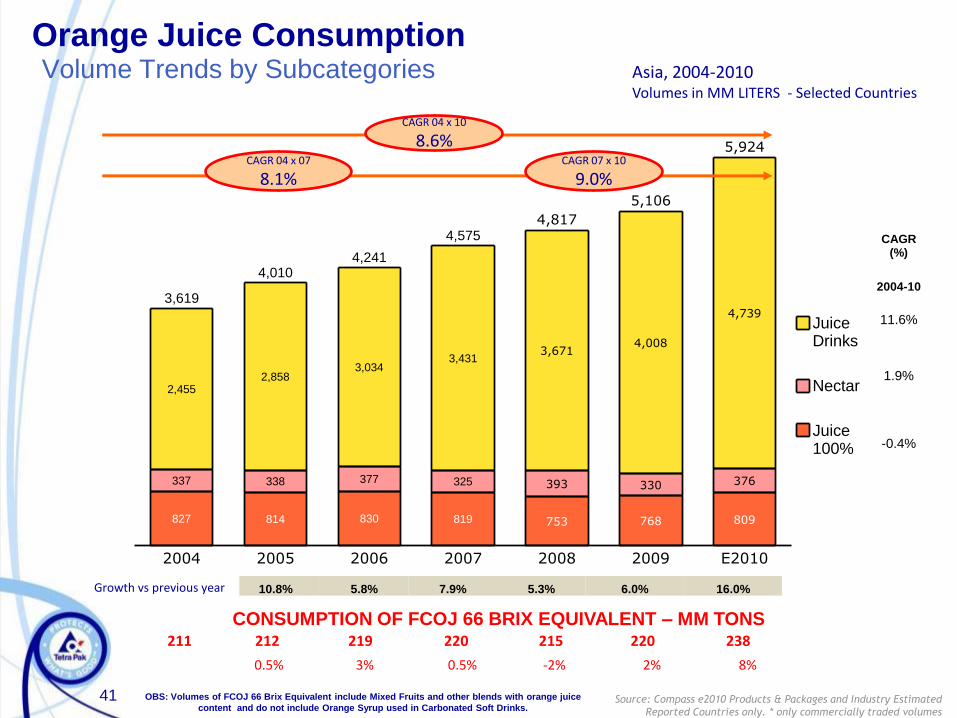
41
2004
827
337
2,455
3,619
2005
814
338
2,858
4,010
2006
830
377
3,034
4,241
2007
819
325
3,431
4,575
2008
753
393
3,671
4,817
2009
768
330
4,008
5,106
E2010
809
376
4,739
5,924
Juice100%
Nectar
JuiceDrinks
CAGR 04 x 10
8.6%CAGR 04 x 07
8.1%CAGR 07 x 10
9.0%
10.8% 5.8% 7.9% 5.3% 6.0% 16.0%Growth vs previous year
Asia, 2004-2010Volumes in MM LITERS - Selected Countries
Orange Juice ConsumptionVolume Trends by Subcategories
211 212 219 220 215 220 238
CONSUMPTION OF FCOJ 66 BRIX EQUIVALENT – MM TONS
0.5% 3% 0.5% -2% 2% 8%
CAGR (%)
2004-10
11.6%
1.9%
-0.4%
Source: Compass e2010 Products & Packages and Industry Estimated
Reported Countries only. * only commercially traded volumes
OBS: Volumes of FCOJ 66 Brix Equivalent include Mixed Fruits and other blends with orange juice
content and do not include Orange Syrup used in Carbonated Soft Drinks.

42
BRIC + Mexico
BRIC
Brasil Mexico
Russia
India
China
43
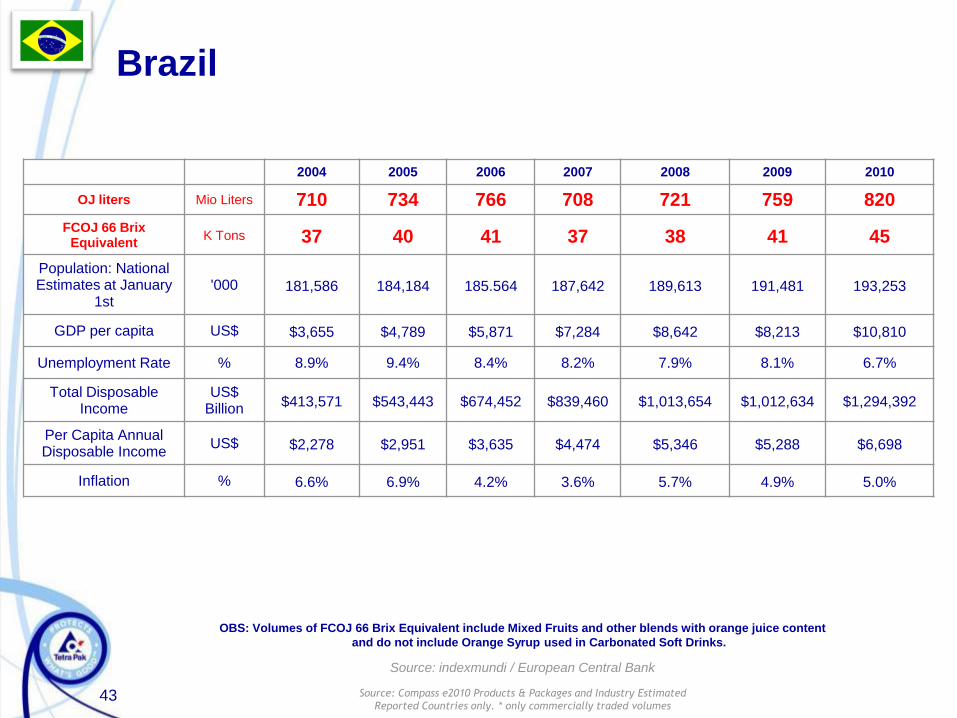
Brazil
2004 2005 2006 2007 2008 2009 2010
OJ liters Mio Liters 710 734 766 708 721 759 820
FCOJ 66 Brix Equivalent
K Tons 37 40 41 37 38 41 45
Population: National Estimates at January
1st'000 181,586 184,184 185.564 187,642 189,613 191,481 193,253
GDP per capita US$ $3,655 $4,789 $5,871 $7,284 $8,642 $8,213 $10,810
Unemployment Rate % 8.9% 9.4% 8.4% 8.2% 7.9% 8.1% 6.7%
Total Disposable Income
US$ Billion
$413,571 $543,443 $674,452 $839,460 $1,013,654 $1,012,634 $1,294,392
Per Capita Annual Disposable Income
US$ $2,278 $2,951 $3,635 $4,474 $5,346 $5,288 $6,698
Inflation % 6.6% 6.9% 4.2% 3.6% 5.7% 4.9% 5.0%
Source: indexmundi / European Central Bank
OBS: Volumes of FCOJ 66 Brix Equivalent include Mixed Fruits and other blends with orange juice content
and do not include Orange Syrup used in Carbonated Soft Drinks.
Source: Compass e2010 Products & Packages and Industry Estimated
Reported Countries only. * only commercially traded volumes

44
Orange Juice in BrazilBrazilians attracted by Juice drinks, total consumption increasing
2004
40
44
626
710
2005
41
60
633
734
2006
32
72
662
766
2007
25
61
622
708
2008
28
62
630
720
2009
33
72
654
759
E2010
36
84
699
819
Juice100%
Nectar
JuiceDrinks
CAGR 04 x 10
2.4%CAGR 04 x 07
-0.1%CAGR 07 x 10
5.0%
Volumes in MM LITERS
CAGR (%)
2004-10
1.9%
11.2%
-1.6%
3.4% 4.4% -7.6% 1.7% 5.4% 7.9%Growth vs previous year
37 40 41 37 38 41 45
CONSUMPTION OF FCOJ 66 BRIX EQUIVALENT – MM TONS
8% 2% -10% 3% 8% 10%
Source: Compass 2010 Products & Packages and Industry Estimated
Reported Countries only. * only commercially traded volumes
OBS: Volumes of FCOJ 66 Brix Equivalent include Mixed Fruits and other blends with orange juice
content and do not include Orange Syrup used in Carbonated Soft Drinks.
45
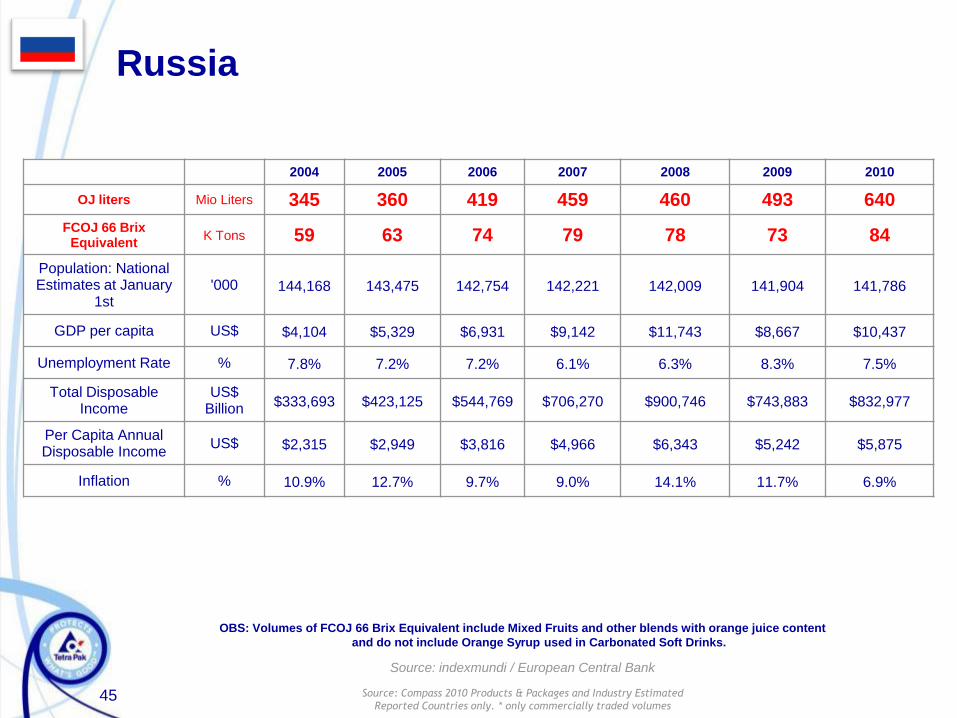
Russia
2004 2005 2006 2007 2008 2009 2010
OJ liters Mio Liters 345 360 419 459 460 493 640
FCOJ 66 Brix Equivalent
K Tons 59 63 74 79 78 73 84
Population: National Estimates at January
1st'000 144,168 143,475 142,754 142,221 142,009 141,904 141,786
GDP per capita US$ $4,104 $5,329 $6,931 $9,142 $11,743 $8,667 $10,437
Unemployment Rate % 7.8% 7.2% 7.2% 6.1% 6.3% 8.3% 7.5%
Total Disposable Income
US$ Billion
$333,693 $423,125 $544,769 $706,270 $900,746 $743,883 $832,977
Per Capita Annual Disposable Income
US$ $2,315 $2,949 $3,816 $4,966 $6,343 $5,242 $5,875
Inflation % 10.9% 12.7% 9.7% 9.0% 14.1% 11.7% 6.9%
Source: indexmundi / European Central Bank
OBS: Volumes of FCOJ 66 Brix Equivalent include Mixed Fruits and other blends with orange juice content
and do not include Orange Syrup used in Carbonated Soft Drinks.
Source: Compass 2010 Products & Packages and Industry Estimated
Reported Countries only. * only commercially traded volumes

46
Orange Juice in Russia Russians mainly drink Nectar, market growing fast
2004
128
199
18
345
2005
135
208
17
360
2006
159
240
20
419
2007
163
273
24
460
2008
154
279
27
460
2009
149
318
26
493
E2010
175
435
30
640
Juice100%
Nectar
JuiceDrinks
CAGR 04 x 10
10.8%CAGR 04 x 07
10.1%CAGR 07 x 10
11.6%
Volumes in MM LITERS
CAGR (%)
2004-10
8.4%
14.0%
5.3%
4.3% 16.4% 9.8% 0.0% 7.2% 29.8%Growth vs previous year
59 63 74 79 78 73 84
CONSUMPTION OF FCOJ 66 BRIX EQUIVALENT – MM TONS
7% 18% 7% -1% -7% 15%
Source: Compass 2010 Products & Packages and Industry Estimated
Reported Countries only. * only commercially traded volumes
OBS: Volumes of FCOJ 66 Brix Equivalent include Mixed Fruits and other blends with orange juice
content and do not include Orange Syrup used in Carbonated Soft Drinks.
47
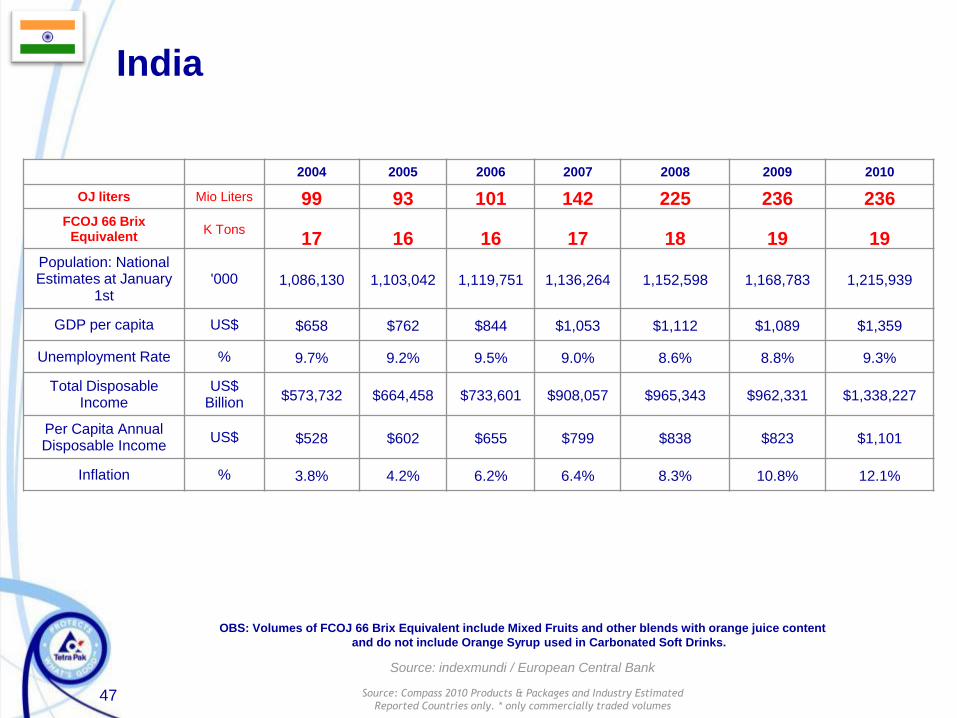
India
2004 2005 2006 2007 2008 2009 2010
OJ liters Mio Liters 99 93 101 142 225 236 236FCOJ 66 Brix
EquivalentK Tons
17 16 16 17 18 19 19
Population: National Estimates at January
1st'000 1,086,130 1,103,042 1,119,751 1,136,264 1,152,598 1,168,783 1,215,939
GDP per capita US$ $658 $762 $844 $1,053 $1,112 $1,089 $1,359
Unemployment Rate % 9.7% 9.2% 9.5% 9.0% 8.6% 8.8% 9.3%
Total Disposable Income
US$ Billion
$573,732 $664,458 $733,601 $908,057 $965,343 $962,331 $1,338,227
Per Capita Annual Disposable Income
US$ $528 $602 $655 $799 $838 $823 $1,101
Inflation % 3.8% 4.2% 6.2% 6.4% 8.3% 10.8% 12.1%
Source: indexmundi / European Central Bank
OBS: Volumes of FCOJ 66 Brix Equivalent include Mixed Fruits and other blends with orange juice content
and do not include Orange Syrup used in Carbonated Soft Drinks.
Source: Compass 2010 Products & Packages and Industry Estimated
Reported Countries only. * only commercially traded volumes
48
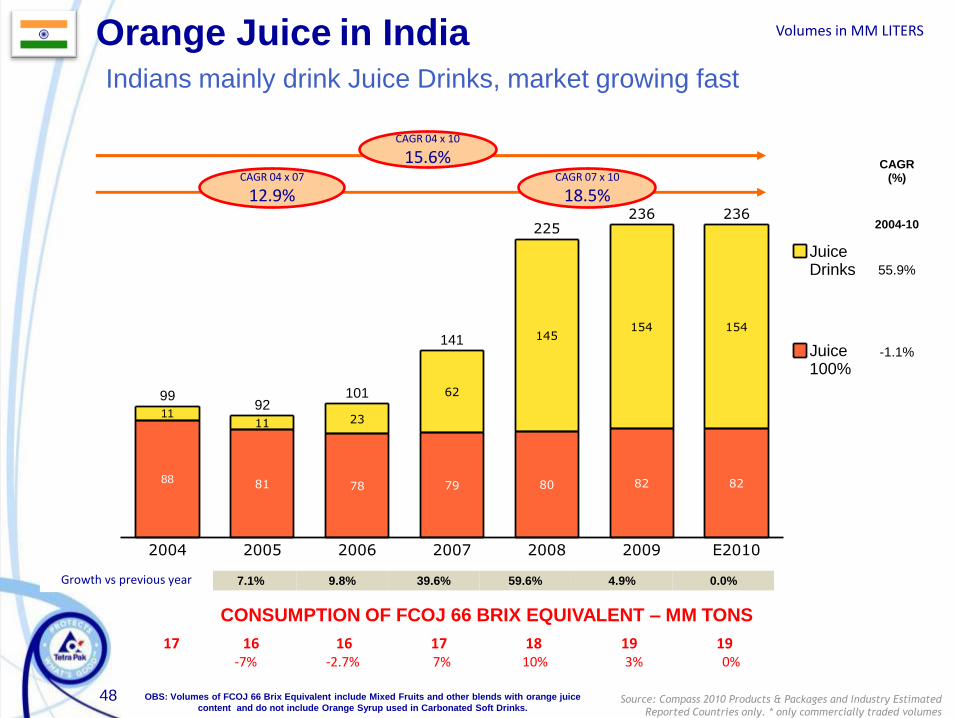
Orange Juice in IndiaIndians mainly drink Juice Drinks, market growing fast
2004
88
11
99
2005
81
11
92
2006
78
23
101
2007
79
62
141
2008
80
145
225
2009
82
154
236
E2010
82
154
236
Juice100%
JuiceDrinks
CAGR 04 x 10
15.6%CAGR 04 x 07
12.9%CAGR 07 x 10
18.5%
Volumes in MM LITERS
CAGR (%)
2004-10
55.9%
-1.1%
7.1% 9.8% 39.6% 59.6% 4.9% 0.0%Growth vs previous year
17 16 16 17 18 19 19
CONSUMPTION OF FCOJ 66 BRIX EQUIVALENT – MM TONS
-7% -2.7% 7% 10% 3% 0%
Source: Compass 2010 Products & Packages and Industry Estimated
Reported Countries only. * only commercially traded volumes
OBS: Volumes of FCOJ 66 Brix Equivalent include Mixed Fruits and other blends with orange juice
content and do not include Orange Syrup used in Carbonated Soft Drinks.
49
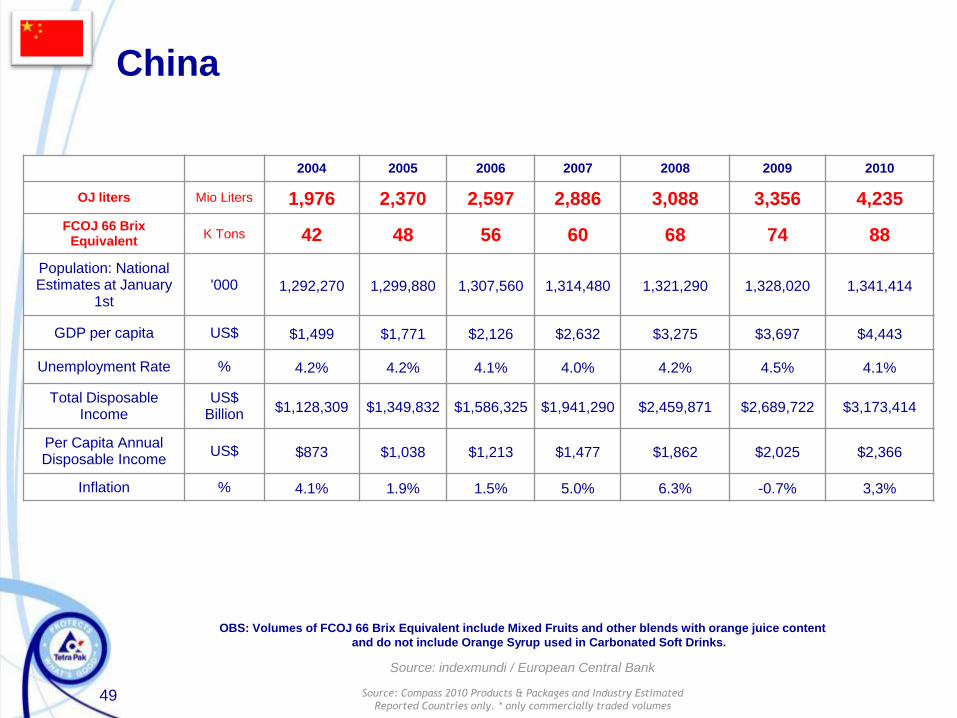
China
2004 2005 2006 2007 2008 2009 2010
OJ liters Mio Liters 1,976 2,370 2,597 2,886 3,088 3,356 4,235
FCOJ 66 Brix Equivalent
K Tons 42 48 56 60 68 74 88
Population: National Estimates at January
1st'000 1,292,270 1,299,880 1,307,560 1,314,480 1,321,290 1,328,020 1,341,414
GDP per capita US$ $1,499 $1,771 $2,126 $2,632 $3,275 $3,697 $4,443
Unemployment Rate % 4.2% 4.2% 4.1% 4.0% 4.2% 4.5% 4.1%
Total Disposable Income
US$ Billion
$1,128,309 $1,349,832 $1,586,325 $1,941,290 $2,459,871 $2,689,722 $3,173,414
Per Capita Annual Disposable Income
US$ $873 $1,038 $1,213 $1,477 $1,862 $2,025 $2,366
Inflation % 4.1% 1.9% 1.5% 5.0% 6.3% -0.7% 3,3%
Source: indexmundi / European Central Bank
OBS: Volumes of FCOJ 66 Brix Equivalent include Mixed Fruits and other blends with orange juice content
and do not include Orange Syrup used in Carbonated Soft Drinks.
Source: Compass 2010 Products & Packages and Industry Estimated
Reported Countries only. * only commercially traded volumes
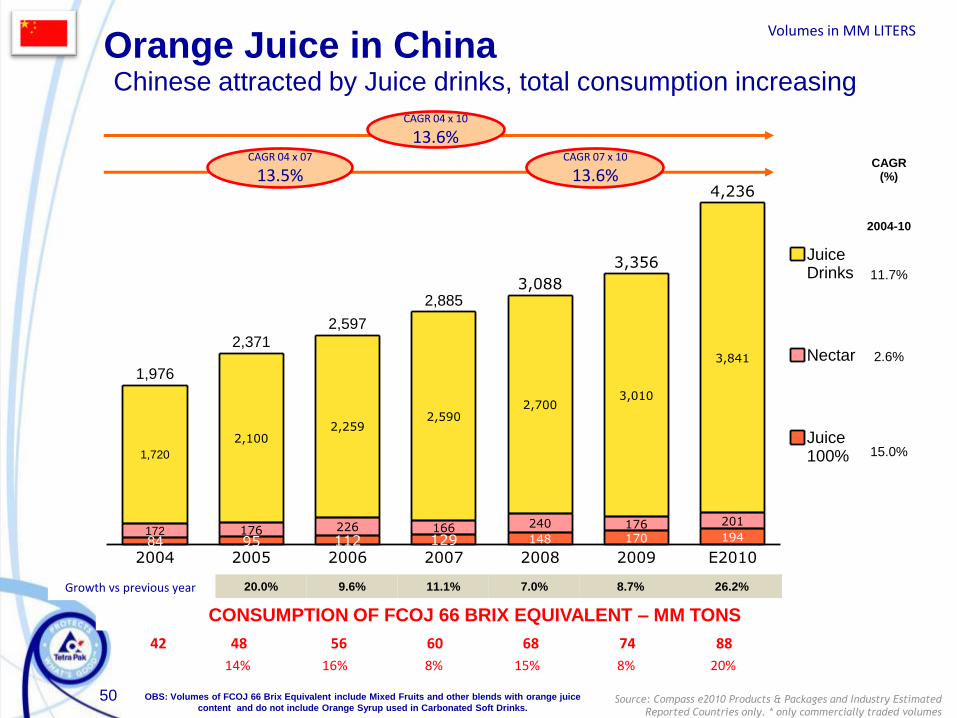
50
Orange Juice in China Chinese attracted by Juice drinks, total consumption increasing
200484172
1,720
1,976
200595176
2,100
2,371
2006112226
2,259
2,597
2007129166
2,590
2,885
2008
148
240
2,700
3,088
2009
170176
3,010
3,356
E2010
194
201
3,841
4,236
Juice100%
Nectar
JuiceDrinks
CAGR 04 x 10
13.6%CAGR 04 x 07
13.5%CAGR 07 x 10
13.6%
Volumes in MM LITERS
CAGR (%)
2004-10
11.7%
2.6%
15.0%
20.0% 9.6% 11.1% 7.0% 8.7% 26.2%Growth vs previous year
42 48 56 60 68 74 88
CONSUMPTION OF FCOJ 66 BRIX EQUIVALENT – MM TONS
14% 16% 8% 15% 8% 20%
Source: Compass e2010 Products & Packages and Industry Estimated
Reported Countries only. * only commercially traded volumes
OBS: Volumes of FCOJ 66 Brix Equivalent include Mixed Fruits and other blends with orange juice
content and do not include Orange Syrup used in Carbonated Soft Drinks.
51
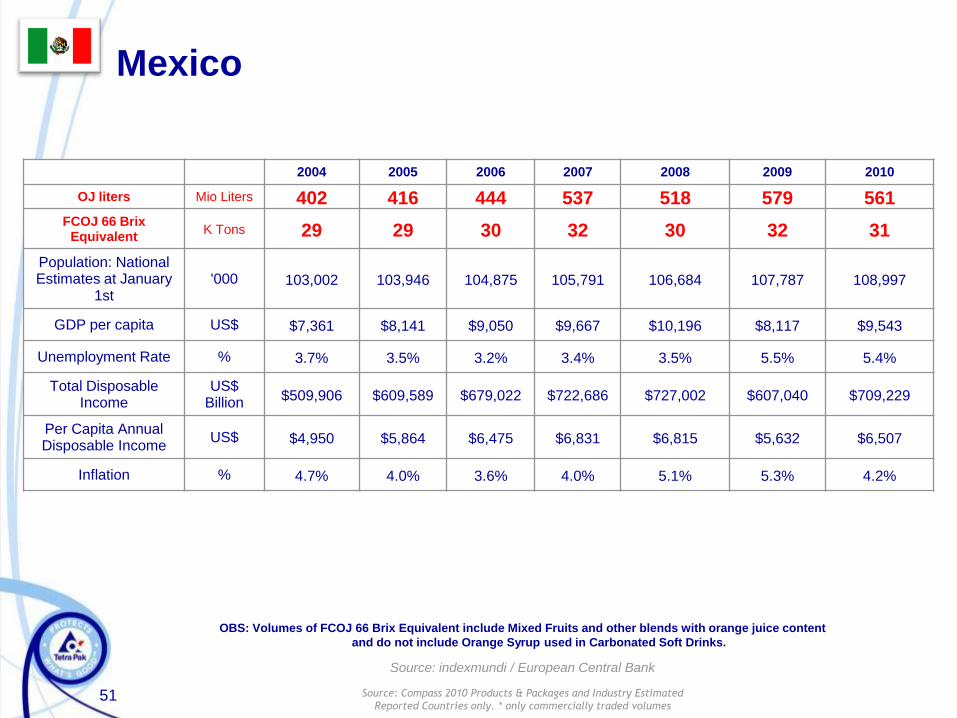
Mexico
2004 2005 2006 2007 2008 2009 2010
OJ liters Mio Liters 402 416 444 537 518 579 561FCOJ 66 Brix
EquivalentK Tons 29 29 30 32 30 32 31
Population: National Estimates at January
1st'000 103,002 103,946 104,875 105,791 106,684 107,787 108,997
GDP per capita US$ $7,361 $8,141 $9,050 $9,667 $10,196 $8,117 $9,543
Unemployment Rate % 3.7% 3.5% 3.2% 3.4% 3.5% 5.5% 5.4%
Total Disposable Income
US$ Billion
$509,906 $609,589 $679,022 $722,686 $727,002 $607,040 $709,229
Per Capita Annual Disposable Income
US$ $4,950 $5,864 $6,475 $6,831 $6,815 $5,632 $6,507
Inflation % 4.7% 4.0% 3.6% 4.0% 5.1% 5.3% 4.2%
Source: indexmundi / European Central Bank
OBS: Volumes of FCOJ 66 Brix Equivalent include Mixed Fruits and other blends with orange juice content
and do not include Orange Syrup used in Carbonated Soft Drinks.
Source: Compass 2010 Products & Packages and Industry Estimated
Reported Countries only. * only commercially traded volumes
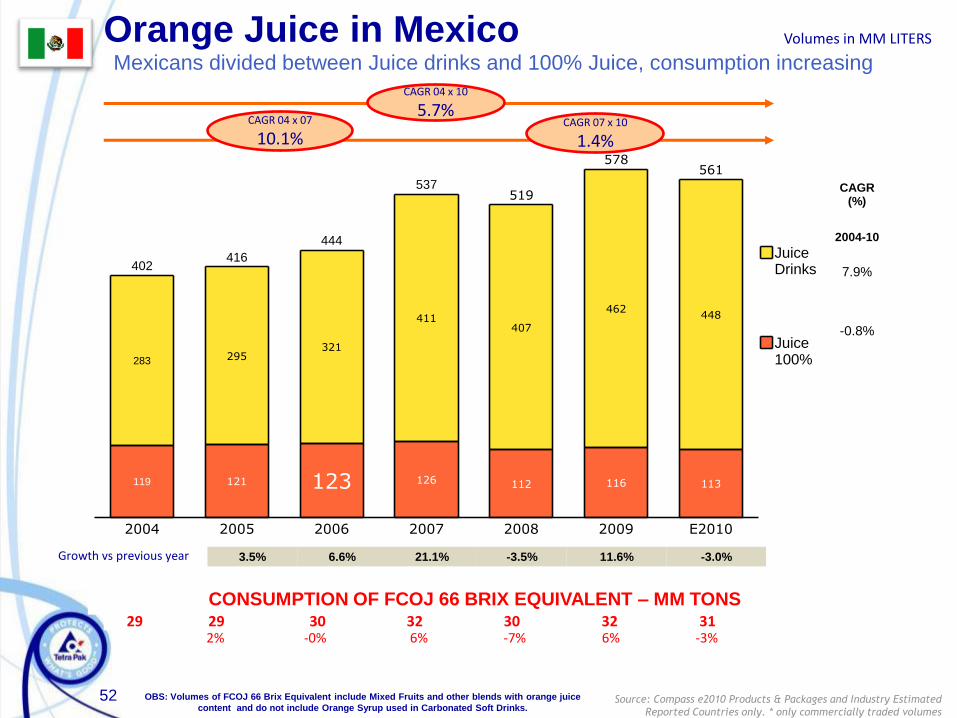
52
Orange Juice in MexicoMexicans divided between Juice drinks and 100% Juice, consumption increasing
2004
119
283
402
2005
121
295
416
2006
123
321
444
2007
126
411
537
2008
112
407
519
2009
116
462
578
E2010
113
448
561
Juice100%
JuiceDrinks
CAGR 04 x 10
5.7%CAGR 04 x 07
10.1%CAGR 07 x 10
1.4%
Volumes in MM LITERS
CAGR (%)
2004-10
7.9%
-0.8%
3.5% 6.6% 21.1% -3.5% 11.6% -3.0%Growth vs previous year
29 29 30 32 30 32 31
CONSUMPTION OF FCOJ 66 BRIX EQUIVALENT – MM TONS
2% -0% 6% -7% 6% -3%
Source: Compass e2010 Products & Packages and Industry Estimated
Reported Countries only. * only commercially traded volumes
OBS: Volumes of FCOJ 66 Brix Equivalent include Mixed Fruits and other blends with orange juice
content and do not include Orange Syrup used in Carbonated Soft Drinks.
53
100% Juice
Nectars (>25% juice)
Fruit / Flavoured Still Drinks
Tea based drinks
Coffee based drinks
Sports & Energy Drinks
Water
Carbonated Soft Drinks
What do we mean by „Soft Drinks‟?Category definition
These sub-categories
are also grouped as
“JNSD”
BRIC + MEXICO -Volume Impact Analysis
54
COUNTRY
GDP
PER
CAPITA
DISPOSABLE
INCOME
PER CAPITA
JUICE CONTENT
DILUTION FACTOR
ORANGE JUICE
CONSUMPTION IN
2009
NECTARSJUICE
DRINKSLiters ‘000
TONS FCOJ
66 BRIX
EQUIVALENT
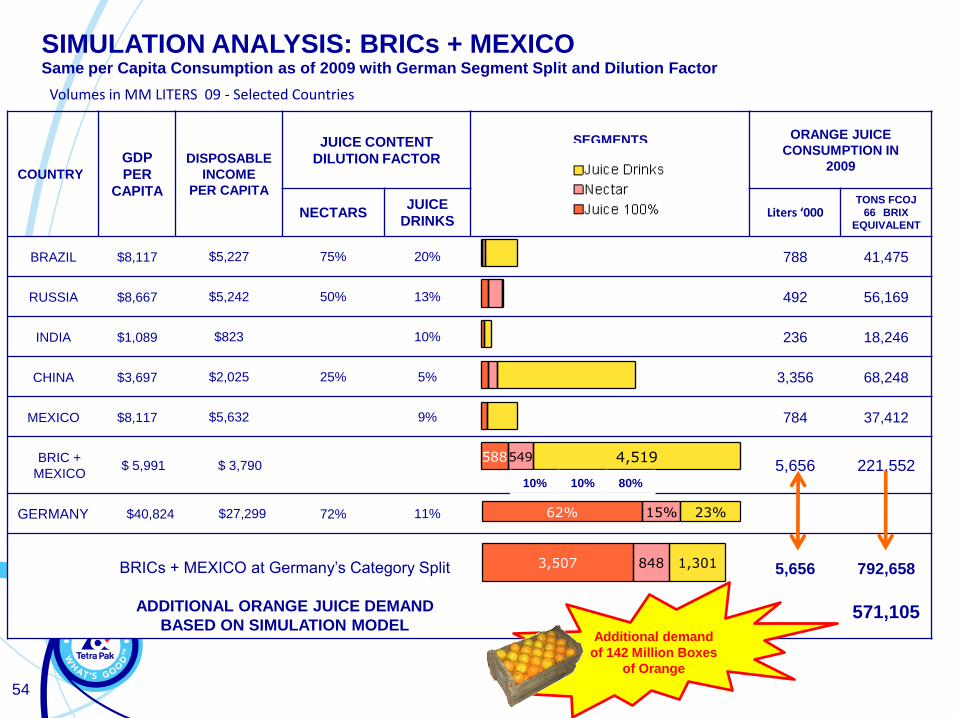
BRAZIL $8,117 $5,227 75% 20% 788 41,475
RUSSIA $8,667 $5,242 50% 13% 492 56,169
INDIA $1,089 $823 10% 236 18,246
CHINA $3,697 $2,025 25% 5% 3,356 68,248
MEXICO $8,117 $5,632 9% 784 37,412
BRIC +
MEXICO$ 5,991 $ 3,790 5,656 221,552
GERMANY $40,824 $27,299 72% 11%
BRICs + MEXICO at Germany’s Category Split
ADDITIONAL ORANGE JUICE DEMAND
BASED ON SIMULATION MODEL
5,656 792,658
571,105
588549 4,519
1,3018483,507
23%15%62%
Volumes in MM LITERS 09 - Selected Countries
SIMULATION ANALYSIS: BRICs + MEXICOSame per Capita Consumption as of 2009 with German Segment Split and Dilution Factor
SEGMENTS
10% 10% 80%
Additional demand
of 142 Million Boxes
of Orange

55
Thank you!