beyond cash: venture capital, firm dynamics, and economic ... · this role of venture capital...
TRANSCRIPT

Beyond Cash:
Venture Capital, Firm Dynamics, and Economic Growth*
Sînâ T. Ates†
University of Pennsylvania
Job Market Paper
Abstract
This paper presents a new dynamic general equilibrium model of innovation with heterogeneous
firms that incorporates an explicit venture capital (VC) market. The data show that VC financing accounts
for a disproportionate share of sales and employment in the US compared with its limited share of total
investment. VC firms invest heavily in young and innovative firms, bringing operational knowledge, together
with financing, to their portfolio companies. The goal of this paper is twofold. First, I measure the par-
ticular channels through which VC firms influence their undertakings, using a structural model. Second,
I explore the implications of VC investments for aggregate productivity and innovation policy. To address
these goals, I combine and structurally estimate an endogenous technical change model with a VC setting
that includes (i) the new feature of expertise, and (ii) the endogenous matching market where firms and
VCs meet. In this model, firms improve the quality of their innovative product through risky R&D. VC
expertise raises the efficiency of product development, and firms obtain VC financing at the cost of selling
an endogenously determined share of the company. The entry cost that VC companies face also introduces
a selection margin: VCs invest in firms that present a high potential for growth. The estimated model
captures certain features of the VC matches and innovation observed in the US data. Counterfactual ex-
periments imply that operational knowledge accounts for about 1/3 of VCs’ impact on aggregate growth.
Policy experiments suggest that changes affecting the VC market could result in a 7 basis point gain in the
long-run growth rate of the economy.
*This version: November 2014. For the latest version, see: https://tinyurl. om/sina-ates.
I am deeply indebted to my advisors Jesús Fernández-Villaverde, Ufuk Akcigit, and Harold Cole for their insightful
guidance and encouragement. I am very grateful to Bilge Yilmaz, Fatih Karahan, Olga Itenberg, Daniel Neuhann, Diego
Amador, Felipe Saffie, Harun Alp, and Tzuo Hann Law for very helpful comments, and to Murat Alp Celik and Ekim
Cem Muyan for all their time and constant support. I would also like to thank seminar participants at the Board of
Governors of the Federal Reserve System, Bilkent University, Penn Macro Club, and Penn Growth Reading Group. All
errors are my own.†University of Pennsylvania, Department of Economics, 3718 Locust Walk, Philadelphia, PA 19104. E-mail:
sinaatessas.upenn.edu

VENTURE CAPITAL, FIRM DYNAMICS, AND ECONOMIC GROWTH Sina T. Ates (UPenn)
“... We were cash positive. We didn’t have a year where we lost money... We eventually
... sold 5% of the company for a million dollars ... just to get a venture capital company
to join our board and give us some adult advice... That money sat in the bank.”
Bill Gates, ex-chairman and co-founder of Microsoft
1 Introduction
Investments by venture capital (VC) companies have a disproportionate impact on the US economy.
In 2010, the revenues of firms that had ever received VC support accounted for 21% of GDP, and
their employment share was 11% of total private sector employment, although VC investments to
their portfolio companies amount to less than 0.2% of GDP.1 VC financing is of particular relevance
for firm creation and innovation because VC firms strive to find young and innovative firms that
lack market experience. VC firms are unique in that they do not only provide financing: They also
actively engage in management by bringing their operational knowledge to bear in their investments.2
Despite this distinctive structure, the contribution of operational knowledge to firm productivity
and its implications for aggregate economic growth lack a thorough investigation. This paper
presents a rigorous quantitative framework to explore the distinct mechanisms by which VC firms
influence innovative firms and, through them, aggregate productivity.
Investing in a young company that needs to develop an innovative business idea entails
considerable uncertainty and is subject to pervasive moral hazard problems (Gompers, 1995). In
such environments, Casamatta (2003) shows that the optimal contract specifies a “dual role” for the
VC firm. The optimal contract bundles financing and advice so that a VC firm’s financial stake
in the company motivates it to provide valuable advice. By contrast, consulting firms are not
preferred by young and innovative firms because they do not acquire stakes in the latter.3 As a
consequence of this lack of “skin in the game,” entrepreneurs have to pay a very high price in
order to obtain valuable advice from the consultant. Therefore, young and innovative companies
prefer VC advising to consulting advice.
Taking the structure of the optimal contract as given, I develop a structural model containing
an explicit VC market. This model serves two main purposes: Firstly, I use the model to measure
1National Venture Capital Association (NVCA, 2013). Well-known examples include Amazon, Google, Starbucks,and FedEx.
2By operational knowledge, I refer to a general body of expertises concerning organizational structure, marketing,product development, and other business domains. This role of venture capital financing reflects the idea “that thetypical founder is an incomplete businessman, with gaps in experience in matters such as financial management andmarketing. An active board of directors, staffed by representatives of the [venture capital] investors, is expected to helpfill these gaps” (Bartlett, 1995). For evidence on different methods, see Gorman and Sahlman (1989), Sahlman (1990),Gompers (1995), and Hellmann and Puri (2000), among others. Da Rin et al. (2011) provide an extensive survey.
3The result assumes that the entrepreneurial effort is cheaper and is key for the success of the project.
2

VENTURE CAPITAL, FIRM DYNAMICS, AND ECONOMIC GROWTH Sina T. Ates (UPenn)
the importance of the VCs’ operational expertise to firm growth. To identify this channel, it is
fundamental to separate it from the provision of financing and the overall selection of “portfolio”
firms by VCs. Establishing a unified structure that accounts explicitly for different aspects of
the VC market, the structural model is an effective tool to accomplish this task. Quantifying the
operational knowledge channel is useful for evaluating the advantages commonly attributed to VC
finance in fostering firm productivity and growth. To the extent that VC companies add valuable
knowledge to their undertakings, they become a more efficient option for financing innovation than
more traditional financing sources such as bank loans. Secondly, the model provides a suitable
ground to shed light on various policy discussions such as the relationship between an active
public equity market and VC financing.
To address these issues, I propose a new dynamic general equilibrium model of innovation
with heterogeneous firms, in the tradition of Romer (1990), Grossman and Helpman (1991), and
Acemoglu et al. (2013), among others.4 In this model, entrepreneurs/private firms produce dif-
ferentiated goods of heterogeneous quality which they can improve through risky research and
development. The efficiency of this development process can only be increased with the help of a
VC and is otherwise fixed. I introduce to this model a detailed venture capital market through (i)
the feature of VC expertise and (ii) the endogenous matching market for firms and VCs. Every pri-
vate firm that is not in a relationship with a VC can search for VCs and meet them in the matching
market. VCs improve the efficiency of product development through their operational knowledge.
They also provide financing and relax the cost of inputs into the production of goods. This finan-
cial support to a priori unconstrained firms reflects the dual structure of the optimal contract for
VC investment. The heterogeneity in the quality level of private firms determines the magnitude
of the improvement that VC firms can potentially create. VC firms are subject to entry costs, which
induce them to select firms for investment that present more room for growth. Thus, in addition to
financing and operational knowledge channels, the VC setting also accounts for the effects of selec-
tion by VC firms. Because the preferred option for VC firms to exit their portfolio companies is to
sell them via initial public offerings, the model also includes a public equity market. To complete
the general equilibrium framework, the rest of the structure builds on the shoulders of endogenous
technical change models in which entrepreneurs own intermediate product lines. Entrepreneurs
enter the market with a new product line while intermediate good producers who cannot develop
the quality of their good sufficiently exit the economy. Together with entry and exit margins, the
innovations generated by these intermediate good firms determine the endogenous rate of growth
of the aggregate economy.
4The model shares features such as product variety expansion with Romer (1990), quality latter structure with Gross-man and Helpman (1991), and innovation by incumbent firms with Acemoglu et al. (2013), whose details are explainedbelow.
3

VENTURE CAPITAL, FIRM DYNAMICS, AND ECONOMIC GROWTH Sina T. Ates (UPenn)
The main identification problem in this model is to distinguish the financing channel from
operational knowledge in their relative influence on firms receiving VC investment. The assump-
tion that disentangles these two channels is that the former mainly affects the level of the profits
while the latter changes its growth rate. The financial help of VC decreases the cost of inputs in the
intermediate good production. Therefore, the entrepreneur earns higher profits for a given quality
level of the intermediate good that the firm produces. Operational knowledge, on the other hand,
directly affects the efficiency of the entrepreneur’s effort in generating innovations that increase
the product quality.5 To discipline the size of the financial impact in the model, I target the ratio
of VC investment to GDP. Determining the size of VCs’ contribution to efficiency in the data is
a more delicate task. A well-known concern is selection: VCs might be “cherry-picking” already
good firms instead of improving them in some other way. I address this issue by applying the
method of indirect inference in my estimation. To do so, I utilize the findings of Puri and Zarut-
skie (2012). In their empirical study, Puri and Zarutskie (2012) provide statistics on growth rates
of VC-backed and non-VC-backed private firms, controlling for selection on observable character-
istics. In a nutshell, Puri and Zarutskie (2012) create samples of private firms with and without
VC support that are matched on some measurable features. Following similar steps, I create the
analogues of such samples from the stationary firm distribution of my model. Finally, I use the
model-generated samples to match the regression statistics on VCs’ effect on firm growth provided
in the same paper.
I estimate this model by the method of moments, using US data on the venture capital
market, public equity issuances, and research and development expenditures. The model does a
successful job in matching moments that pertain to venture capital and innovation aspects of the
model, such as the duration of VC matches, firm age at the issuance of initial public equity, and
aggregate share of R&D. Moreover, the model-generated regression results accurately predict the
coefficient estimate found in Puri and Zarutskie (2012). Successfully hitting this target via indirect
inference is crucial because it determines the scope of the influence of the operational knowledge
channel. Before using the estimated model for counterfactual analyses, I compare its auxiliary
predictions to data moments in order to obtain out-of-sample validation. This comparison reveals
that the model is very precise in capturing the high IPO frequency among VC-backed firms and
the share of IPOs issued by VC-backed companies, both of which are definitive characteristics of
the VC market in the US.
5Gonzalez-Uribe (2014) is a recent empirical work that points towards the efficiency enhancing role of VC. By usingthe introduction of the Prudent Investor Rule (PIR) across states as a source of exogenous variation in VC financing, shefirst documents a 50% rise in the annual citations of patents of a firm after it obtains VC financing. More interestingly,she shows that the probability of receiving a citation from a company in the portfolio of the same VC firm increasestwice as much as from a company outside the VC’s portfolio. This result indicates that VCs facilitate the diffusion ofknowledge among their portfolio companies. Similarly, Lindsey (2008) argues that by mitigating informational and con-tractual problems, VC firms increase the probability of strategic alliances among their portfolio companies. The empiricalestimates imply a 70% increase in the probability of R&D alliances, a significant constituent of strategic cooperations.
4

VENTURE CAPITAL, FIRM DYNAMICS, AND ECONOMIC GROWTH Sina T. Ates (UPenn)
The first set of counterfacual experiments determines the relevance of VCs’ operational
knowledge to firm and aggregate growth. I create hypothetical economies in which I strengthen
particular channels of VC finance in each experiment. Comparing the responses of the aggregate
growth rate to these changes demonstrates that the knowledge channel accounts for 1/3 of VCs’
impact. Hence, the conclusion is that VC support matters significantly beyond financing. Then
I consider a 15% increase in the fixed cost of IPO to capture the average level of underwriting
spreads in the US before their secular decline after the 1980s.6 As a result, fewer private firms is-
sue IPOs, and the equilibrium probability of a match with a VC firm decreases. Thus, the increase
in the fixed IPO cost results in a smaller share of VC-backed private firms in the economy. This
leads to a 1.5 basis point loss in the long-run growth rate.
As an example for the policy implications of the model, I consider a recent regulation that
the European Union introduced in 2013 regarding European VC firms. In order to decrease the
fundraising costs of VC firms, this policy aims to harmonize the legislative environment these
firms face when investing across the borders of European countries. I map this change into the
model as lower entry costs for VC firms through lump-sum subsidies. I find that this policy
can increase the long-run growth rate by 7 basis points at a cost of subsidies that corresponds to
approximately 8% of the VC investment in the model. This increase in the growth rate hinges on
the reallocation of private firms towards the VC market. Moreover, a rise in the median duration of
the VC-firm relationship amplifies the effect of the operational knowledge. These results highlight
the significance of the general equilibrium effects for the policy evaluation.
Related Literature. This paper draws on several strands of the literature. First, by embedding
the VC market into the endogenous technical change environment, it contributes to the literature
that concentrates on innovation and firm dynamics (Klette and Kortum, 2004; Akcigit, 2010; Akcigit
and Kerr, 2010; Lentz and Mortensen, 2008; Acemoglu et al., 2013).7 Lentz and Mortensen (2008)
and Acemoglu et al. (2013) are recent examples that particularly focus on allocation of resources
across firms with heterogeneous capacities to innovate. This paper contributes to the analysis by
introducing a link between this heterogeneity and the financing decisions of innovative firms. In
that regard, this paper also relates to work on finance of innovation (Aghion and Tirole, 1994;
Aghion et al., 2004; Kortum and Lerner, 2000; Lerner et al., 2011; Brown et al., 2009; Amore et al.,
2013).8 As an example in the setting of endogenous growth, Itenberg (2014) explores the effect of
developments in the US public equity market on R&D decisions of small firms. By contrast, the
6An underwriting spread, also known as gross spread, measures the fees paid to the underwriter of the issue incompensation for expenses such as legal expenses, management fees, etc. as a fraction of the total proceeds raised. Thisspread is a direct cost associated with the issue, which I model as a fixed cost.
7For a detailed discussion of innovation and firm dynamics in the context of Schumpeterian growth theory, seeAghion et al. (2013).
8Hall and Lerner (2009) is a seminal survey on this topic.
5

VENTURE CAPITAL, FIRM DYNAMICS, AND ECONOMIC GROWTH Sina T. Ates (UPenn)
focus of this paper is the venture capital market.
This study extends the venture capital literature by analyzing VC financing in a dynamic
quantitative framework. The theoretical work in this area uncovers the conditions in a static setting
that leaves room for the use of venture capital in the existence of alternative financing or in advising
agents such as banks and consultants (Amit et al., 1998; Casamatta, 2003; Ueda, 2004; de Bettignies
and Brander, 2007).9 While my work acknowledges these theoretical foundations, and borrows
the features of the optimal VC contract from this literature, it focuses on quantitative analysis
of the VC market. In particular, my model improves the understanding of VC financing in a
dynamic general equilibrium setting that enables the measurement of the distinct channels through
which VC firms affect firm dynamics. A realistic structure for the VC market in a model of
endogenous firm dynamics also allows the analysis of venture capital from the perspective of
innovation policy. Due to these characteristics, this work also contributes to answering empirical
questions in VC literature.10 In particular, Kortum and Lerner (2000) show the significant effect
of VC finance on firm-level innovation in terms of both patent counts and citations, whereas
papers such as Hellmann and Puri (2000, 2002) examine the effectiveness of particular management
practices applied by VC firms using hand-collected data. My paper advances these exercises to
quantify VCs’ impact by using a new structural model as a measurement tool that takes into
account important margins such as selection and reallocation. Furthermore, the setting should
also be helpful in shedding light on various policy debates, such as the relationship between
public equity and VC markets (Black and Gilson, 1998; Bottazzi and Rin, 2002).
Finally, a related literature focuses on the role of the financial system in evaluating and
selecting investment projects. For instance, Jayaratne and Strahan (1996) show empirically that
interstate branch reform in the US banking system has led to a tighter selection in lending through
increased competition. This in turn has resulted in higher lending quality and growth rates in
liberalized states. In the context of VC, Casamatta and Haritchabalet (2007) provide evidence on
how VC firms use syndication practices to obtain a second opinion when deciding on early rounds
of investment. By estimating a theoretical framework using Bayesian methods, Sørensen (2007)
finds important effects of assortative matching in the VC market. In relation to this literature,
my paper formalizes the idea that VC firms search for high growth potential by embedding an
endogenous search and matching market that accounts for selection. This aspect is integral to
identifying the effect of “value-adding” practices of VC firms in the model. Furthermore, building
9There are a few recent papers that include venture capital in a dynamic setting. Silveira and Wright (2013) modelVC firms in a search and matching environment and analyze its theoretical predictions for the life cycle of VC firms.Pinheiro (2012) examines the theoretical underpinnings of the optimal duration in matches between VC firms and theirundertakings. Opp (2014) analyzes the cycles in the venture capital market. None of these studies consider the effects onfirm-level innovation and economic growth.
10For a recent survey, see Da Rin et al. (2011).
6

VENTURE CAPITAL, FIRM DYNAMICS, AND ECONOMIC GROWTH Sina T. Ates (UPenn)
on the endogenous growth framework, this paper relates to the literature that analyzes the effects
of selection on economic growth (King and Levine, 1993; Jaimovich and Rebelo, 2012).11 A recent
paper in this strand, Ates and Saffie (2014), argue that financial selection introduces a trade-off
between the mass and the quality in firm entry, and analyzes its impact on aggregate productivity
growth in the context of sudden stops.12 In comparison to this literature, my work focuses on a
specific, but one that is more relevant to innovation and growth, namely venture capital finance.
The next section introduces the main ingredients of my model. Section 3 explains the data
used in the estimation, and discusses identification. Section 4 presents counterfactual and policy
experiments, and Section 5 concludes.
2 Model
In this section, I present the components of the model economy. Entrepreneurs produce differenti-
ated intermediate goods and sell them to a representative final good producer that combines these
intermediate goods into a final output. The entrepreneurs enter the business with an innovative
product, the quality of which they can improve over time by investing in risky research and de-
velopment (R&D) activities. The efficiency of the R&D process is a firm characteristic that is fixed
unless the firm uses the additional business expertise of a VC. VC support also entails a reduction
in the cost of intermediate good production. An intermediate good producer can search for and
match with a VC firm in the endogenous search and matching market. The contribution of the
VC to firm growth stems from increased R&D efficiency that makes product developments likelier.
However, it comes at the cost of firm dilution, and carries an exogenous risk of running the project
idle. Any private firm can issue public equity to expand the size of its enterprise, but there is an
associated fixed cost. By improving the efficiency of product development, VC firms help their
undertakings raise adequate resources faster to afford the IPO cost.
2.1 Preferences
Consider the following closed economy in discrete time. The representative household maximizes
the expected discounted sum of the period utility from consumption with the following preferences
Ut =∞
∑τ=t
βτ C1−ετ − 1
1 − ε
11Levine (2005) provides an excellent survey on this topic, and on the relationship between finance and growth, ingeneral.
12In a related paper, Ates and Saffie (2013) provide a theoretical characterization of the nexus between financialselection and the long-run productivity growth by analyzing the mass-quality trade-off in a closed economy setting.
7

VENTURE CAPITAL, FIRM DYNAMICS, AND ECONOMIC GROWTH Sina T. Ates (UPenn)
where Ct denotes consumption at time t. β is the discount factor and ε is the coefficient of relative
risk aversion. The household consumes a final good, and supplies labor inelastically to the final
good producer, which I normalize to 1 without loss of generality. Households own all the firms in
the economy, and their budget constraint is
Ct ≤∫
j∈JΠjtdj + wt (1)
where Πjt is the flow profit of the intermediate firm j in the interval J of actively operating firms,
and wt is the wage level at time t.
2.2 Final Good Production
The final good, which is used for consumption, R&D, and intermediate good production, is pro-
duced in a perfectly competitive market. The production technology combines labor and differen-
tiated intermediate varieties in the following structure:
Yt =1
1 − αLα
t
∫
j∈Jqα
jtk1−αjt dj. (2)
Here, Lt denotes the labor input, kjt refers to intermediate good j ∈ J at time t, and qjt is the
associated quality of product j. (1 − α) stands for the physical factor share. Yt is the numeraire
good in the economy.
The representative final good producer chooses a bundle of intermediate goods and labor
in order to maximize its profits. Taking the price of the intermediate product, pjt, as given, the
problem of the final good producer reads as:
ΠY,t = maxLt,k jtj∈J
1
1 − αLα∫
j∈Jqα
jtk1−αjt dj −
∫
j∈Jpjtkjtdj − wtLt
. (3)
The solution of this maximization problem yields in equilibrium the following inverse demand for
intermediate good j:
pjt = qαjt
(
kdjt
)−α(4)
where kdjt is the optimal amount of good j demanded by the final good producer.
2.3 Intermediate Good Firms
Intermediate firms are distributed across product lines whose measure, Jt, is determined endoge-
nously. There are three types of intermediate good firms: private firms that are not matched with a
VC, private firms that are matched with a VC, and public firms. Each firm is characterized mainly
8

VENTURE CAPITAL, FIRM DYNAMICS, AND ECONOMIC GROWTH Sina T. Ates (UPenn)
by two state variables which are the product quality and the R&D efficiency. An entrepreneur that
has an innovative project enters a product line as a private firm without a VC. First I introduce
decisions that are common to all intermediate good firms, and then I go into the specific choices
of different types of firms.
2.3.1 Production
Each intermediate good is a monopolist in producing its differentiated good kjt. To maximize the
operating profits, the monopolist solves the following problem
Πjt
(
qjt
)
= maxk jt
pjtkjt − Ck
(
kjt
)
subject to
pjt = qαjt
(
kdjt
)−α
where Ck
(
kjt
)
denotes the cost of inputs to produce kjt amount of intermediate good in terms of
the final good and has the following form:
Ck
(
kjt
)
= ηjkjt.
In this specification, ηj ∈ ηH, η denotes the marginal cost of production with ηH> η. For any
firm that does not have VC support, this parameter has the higher value. Therefore, this structure
captures the financial contribution of VC firms to their undertakings. An interpretation for this
structure is that it reflects cash-in-hand constraints in a reduced form way. In line with reality, VC
relaxes this financial constraint with its monetary commitment.
In equilibrium, the optimal level of intermediate good production becomes
kjt = α
[
1 − α
ηj
]1−α
α
qjt. (5)
With a constant mark-up over price, this optimal quantity generates profits that are linear in
product quality qjt. Thus, Πjt = πjqjt where
πj =
πL if Ck
(
kjt
)
= ηHkjt
πH if Ck
(
kjt
)
= ηLkjt
is a constant depending on the marginal cost ηj. Hence, the operational profits are higher if the
marginal cost of intermediate good production is lower due to VC support.
9

VENTURE CAPITAL, FIRM DYNAMICS, AND ECONOMIC GROWTH Sina T. Ates (UPenn)
2.3.2 Research and Development
Each firm invests in R&D to improve the quality of its product and hence to increase its operating
profits. Let ijt and Z(
ijt
)
denote the (process) innovation rate and the R&D effort required to
generate this rate, respectively. The R&D cost function in terms of the final good has the following
form:
Z(
ijt
)
=h(
ijt
)
θjqjt
where h (·) is a convex, strictly increasing function. In this specification, θj denotes the efficiency
in developing the product quality.
In order to analyze the effect of VC firms’ operational knowledge, the parameter θ can take
three different values:
θj =
θL for private firms without VC
θH for private firms with VC
θpbj ∈
θL, θM
for public firms
In this economy, the private firms conduct R&D with low efficiency, θL, unless they receive help
from a VC firm. Once matched, a VC firm raises the efficiency level of its portfolio company to θH
thanks to its expertise. In turn, a higher efficiency in generating innovations increases the expected
growth rate of the private firm. In addition to this direct effect, I allow for the possibility that
VC firms also cause a permanent effect. Product development efficiency after IPO, θpbj , depends
on whether the firm used VC finance or not. The underlying motivation is that, although the
entrepreneur separates from the VC, she retains some of the operational skills brought to the
firm by the venture capitalist. Therefore, for a firm that becomes public under the supervision
of a VC, I assume that θpbj = θM. Although determined by the data through estimation, it is
expected that θH> θM
> θL, as validated in Section 3.4. The ordering θH> θM reflects the loss
of VC supervision, whereas θM> θL reflects the VC’s permanent impact on the firm’s operational
knowledge stock. The product development efficiency remains constant unless the firm changes
its type due to a financial decision.
A successful process innovation improves the product quality of the firm by an amount that
is taken to be proportional to the average quality of the firm, qt:
qjt+1 = qjt + λqt.
where qt ≡∫
j∈J qjtdj. If the R&D is unsuccessful, qjt remains the same. These additive increments
in product quality introduce decreasing returns to innovation, and imply smaller incentives to
10
VENTURE CAPITAL, FIRM DYNAMICS, AND ECONOMIC GROWTH Sina T. Ates (UPenn)
innovate for larger firms. Limiting the growth potential of larger firms, this structure enables the
model to generate a stationary size distribution in equilibrium.
2.3.3 Free Exit
Every intermediate firm has an outside option χot = χo qt which is proportional to the average
quality qt. If the value of the firm goes below this level, the firm exits the economy. Notice that
the option value grows at the rate of the aggregate economy. Therefore, if a firm fails to innovate
for a long period of time, it will necessarily exit the market. Therefore, in addition to the profit
enhancing motive, there is another incentive to motivate, namely to survive in the business.
2.3.4 Free Entry
The economy has a unit measure of potential entrants. These outside firms need to generate
an innovation to enter the market. An entering firm observes the initial quality of its product
upon successful innovation. This initial quality is drawn from the stationary distribution of the
previous period, but from a range that is small enough such that the entrant does not go public
immediately.13 An entrant opens a new intermediate product line and starts with the low level of
product development efficiency θL.14
The cost of generating a product innovation for entry is quadratic in probability of innova-
tion, xt:
Ce(x) = χeqt f (Jt−1)x2t
where χe denotes the scale of the cost function. There are two important features in this cost
structure. First, it is proportional to aggregate productivity level qt. Since the expected value of an
innovation also shares this proportionality the optimal innovation rate becomes independent of qt.
Second, the cost depends on the previous measure of the intermediate firms through a convex and
increasing function.15 This structure relates the measure of firms to the size of entry, and enables
the economy to reach a stable size.
13Given the median age of US firms at the IPO stage, this assumption is a plausible one. Moreover, the average size ofentry firms in the US are drastically smaller than the average size of incumbent firms (Scarpetta et al., 2004; Bartelsmanet al., 2009).
14The fact that entrants open new product lines introduces a source for growth due to expanding product markets,à la Romer (1990). However, as explained below, the measure of intermediate product lines, J, remains constant in abalanced growth path equilibrium.
15In the estimation, f (·) is assumed to have a quadratic form. This type of relationship has the interpretation that theresources to innovate are scarce, and the costlier it is for entrants to use these resources, the larger the share of incumbentfirms becomes.
11

VENTURE CAPITAL, FIRM DYNAMICS, AND ECONOMIC GROWTH Sina T. Ates (UPenn)
2.3.5 Timing of Events
The timing of events is summarized in Figure 1. The period starts with the entrants’ decision to pay
the entry fee and draw their productivity. Then, the private intermediate good producers make
their financial decisions, which are searching for VC and going public. Then, the final good pro-
ducer and intermediate good producers decide on production. Intermediate good producers also
determine their innovation intensities. Lastly, the R&D outcomes are realized, and intermediate
producers make their exit decisions.
Figure 1: Flow of Events
t + 1t
Entrantsdraw qjt
start w/ θL
IPO decisionf or
private
VC decisionf or
single private
i) Productionkjt, Yt
ii) R&D, ijt
R&Doutcome
qj,t+1
Exitdecision
Next, I explain the different types of intermediate firms and their specific financial choices.
In particular, a public firm will consider only the decisions introduced above. Every private firm
considers going public at the onset of a period, in addition to the aforementioned common deci-
sions. Lastly, a private firm that is not matched with a VC can search for a VC if it has already
chosen to remain private.
2.3.6 Firm Types and Financial Decisions
Public Firm. A private firm can choose to go public by issuing an initial public offering (IPO)
and raise public funds to expand its operations.16 I assume that a firm cannot look for a VC and
cannot raise any public funds once it is public. Therefore, the only decisions that a public firm
needs to consider are production, R&D, and exit decisions. Specifically, let Vpb
t denote the value of
a public company. Then the problem of the public firm becomes
Vpb
t
(
qjt, θpbj
)
= maxijt
πLqjt − h(
ijt
)
/θpbj · qjt +
11+rt+1
×[
ijtWpbt
(
qjt + λqt, θpbj
)
+(
1 − ijt
)
Wpbt
(
qjt, θpbj
)]
(6)
where rt+1 denotes the interest rate. The continuation value is defined as
Wpbt
(
qjt+1, θj
)
= max
χo qt, EVpb
t+1
(
qjt+1, θpbj
)
. (7)
16This type of modelling IPO is in line with the investment financing explanation of equity finance. Using extensivedata on initial and seasoned equity offerings across 38 countries during the period 1990-2003, Kim and Weisbach (2008)show that firms subsequently use proceeds from selling equity for R&D and CAPEX investments. When I explain thedecision to do an IPO below, it will be clear that going public also provides an exit channel for the VC.
12

VENTURE CAPITAL, FIRM DYNAMICS, AND ECONOMIC GROWTH Sina T. Ates (UPenn)
Every period, the public firm collects flow profits and decides on the optimal size of process
innovation.17 In case of successful R&D, it increases its product quality with which it starts the
next period, unless it chooses to use the outside option and exits. If R&D efforts do not result in an
incremental innovation, the product quality remains the same. In this regard, product development
enables the firm to decrease the likelihood of exiting the market, besides increasing the profits.
Note that the product development efficiency remains constant in any case.
VC decision. A private firm without VC backing can search for a VC in every time period.
To understand the benefit of becoming matched with a VC, first consider the problem of a private
firm with a VC that decided not to go public. This post-IPO-decision value is the one that a private
firm without VC obtains when it is matched with a VC firm, because the process of searching for
a VC follows the IPO decision. It is defined as
Vpr
t
(
qjt, θH, Ivcj = 1
)
= maxijt
πqjt − h(
ijt
)
/θH · qjt +1
1+rt+1×
ijtWprt
(
qjt + λqt, θH, 1)
+(
1 − ijt
)
Wprt
(
qjt, θH, 1)
. (8)
where Ivcj is an indicator function that takes the value 1 if the firm is matched to a VC. This
problem is very similar to the one of the public firm, with three exceptions. First, as the firm gets
the expertise of VC, its efficiency increases to level θH> θL, and this is the operational knowledge
channel through which a VC adds value to the firm. Second, due to its financial support, VC
increases the profits of the firm to π > πL for a given quality level. The third difference reflects
the fact that many relationships between the VC and the firm end up unsuccessfully, i.e. they do
not lead to any IPO or acquisition by another firm where VC can have a profitable exit. To capture
this, I assume that the VC and the firm can separate with an exogenous probability σvc in which
case the firm exits the market. The continuation value Wprt (·, 1) incorporates these differences.
A private firm meets with VCs in a random matching environment.18 The endogenous
probability that a private firm matches with a VC firm is defined by
m f (Λ) = ρΛ
1 + Λ
where nvc and n f denote the number of VC firms and available private firms, respectively, Λ ≡
nvc/n f is the market tightness, and ρ refers to the efficiency parameter (Shi, 2009).19 Then the
17Notice the low level of profits because public firms do not have VC support.18The main friction in this market is the process of evaluation by the VC. It is a cumbersome process in which only
one out of a hundred applicants gets funded on average, according to NVCA figures. A directed search on the firm sideis also unlikely given the low probability of acceptance. Moreover, this would require the applicant to gain informationabout other companies in the portfolio the VC firm of interest, their financing stages, the human capital constraints ofthe VC firm, etc., which is probably not the case with most of the applications in reality.
19Correspondingly, the total number of matches is given by the so-called telegraph matching function.
13

VENTURE CAPITAL, FIRM DYNAMICS, AND ECONOMIC GROWTH Sina T. Ates (UPenn)
value of a private firm without a VC, after deciding not to issue an IPO, becomes:20
Vpr
t
(
qjt, θL, Ivcj = 0
)
= m f
(
nvc
n f
)
Isvc>0 × Vpr
t
(
qjt, θH, 1)
+
[(
1 − m f
(
nvc
n f
))
+ m f
(
nvc
n f
)
(1 − Isvc>0)
]
×
maxijt
πLqjt − h(
ijt
)
/θL · qjt +1
1+rt+1×
[
ijtWprt
(
qjt + λqt, θL, 0)
+(
1 − ijt
)
Wprt
(
qjt, θL, 0)
]
. (9)
Here, m f (·) denotes the probability that the firm will meet with a VC. The share of the firm to
be left to VC, svc, is determined endogenously via Nash bargaining. The first line of this value
simply tells that, if there is a match that generates a positive surplus the firm, matches with a
VC. Otherwise, it moves on to make production, R&D and exit decisions where its R&D efficiency
remains constant.
Private firms and IPO decision. Any private firm, with or without a VC, can issue an IPO in
any period. The upside of IPO is an increase in the size of operations. Moreover, it enables the VC
firm sell its share in the company and collect the return.21 Let Vprt refer to the value of a private
firm that considers going public or remaining private. Then the IPO decision is determined by the
following maximization
Vprt
(
qjt, θj, Ivcj
)
= max
Vpr
t
(
qjt, θj, Ivcj
)
, (1 − ∆)Vpb
t
(
κqjt, θpbj
)
− χipo qt
.
The first part of this maximization is the value of the firm if it remains private. Vpb
t
(
κqjt, θpbj
)
in
the second part denotes the value of the public firm with larger size of operations, where κ > 1
denotes the increase. Firms that issue an IPO without any previous relationship with a VC do not
experience any change in the efficiency of product development.
At last, the firm incurs various costs of issuing an IPO, which are captured by χipoqt. More-
over, a ∆ share of the firm value is sold at IPO. The firm finances its investment in improving its
product quality with the proceeds from this transaction. In addition, if the firm that goes public
is matched with a VC, IPO allows the VC to liquidate its stocks in the company in order to obtain
the return on its initial investment, svcj .
20No search costs are assumed in this setting.21IPO is considered as the most profitable exit option and a measure of success for VC funds (Brander et al., 2002;
Sørensen, 2007). According to the 2013 Yearbook of National Venture Capital Association, 16% of portfolio companiesend up going public.
14

VENTURE CAPITAL, FIRM DYNAMICS, AND ECONOMIC GROWTH Sina T. Ates (UPenn)
2.4 Venture Capital Firms
Venture capital firms are agents that provide operational knowledge and finance to private firms.
There is an outside pool of VC firms. To enter the matching market, a VC firm has to pay an entry
cost. The entry cost is given by χvct ≡ χvcqt, and is proportional to the average productivity in
the economy. At any point in time, a VC firm can be matched with only one firm. When the VC
exits its investment, it is assumed to exit the economy. The value of a VC that is not matched to a
private firm is
At = mvc
(
nvc
n f
)
∫
svct
(
q, θL; ·)
Ψq (dq) +
[
1 − mvc
(
nvc
n f
)]
At+1
1 + rt+1(10)
where Ψq denotes the distributions over q of the private firms that are in the matching market. The
first part of equation (10) explains that, with probability mvc (·), the VC meets a private firm and
gets a share svc. Otherwise it continues to search next period.
The share of the firm that the VC gains, svct (q, θ) , is the solution of the following Nash
bargaining problem
svct (q, θ) = arg max
s
[
Vpr
t
(
q, θH , 1)
− Vpr
t
(
q, θL, 0)
− s]1−φ
[
s −At+1 (·)
1 + rt+1
]φ
(11)
where φ is the bargaining power of the VC. Notice that, for a match to form between a VC firm and
a private company, the payment to the VC firm needs to be a positive amount because the VC firm
is subject to an entry cost. This implies that the VC firms invest in companies only if the expected
surplus is larger than zero. This selection margin is integral for the identification purposes.22
2.5 Equilibrium
Throughout this paper, I will focus on the Markov Perfect Equilibrium. In particular, the analysis
will be based on the balanced growth equilibrium where aggregate variables grow at a constant
rate. To this end, it will be necessary to transform the economy into a stationary one by normal-
izing the growing variables by the aggregate productivity qt. First, I denote qjt ≡ qjt/qt as the
normalized quality. Next, I define the Markov Perfect Equilibrium where the asterisk refers to
equilibrium values.
Definition 1 (Equilibrium) Let ξdj ∈ 0, 1, d ∈ exit,vc,ipo, denote the decisions of firm j regard-
ing exit, VC search, and going public, respectively. A Markov Perfect Equilibrium consists of aggregate
prices r∗t , w∗t ; aggregate output, consumption, R&D expenditure, and intermediate input expenditure
22See Section 3.2 for details.
15

VENTURE CAPITAL, FIRM DYNAMICS, AND ECONOMIC GROWTH Sina T. Ates (UPenn)
Y∗t , C∗
t , Z∗t , K∗
t ; intermediate prices and quantities k∗jt, p∗jt; R&D, exit, search, and floating decisions
i∗jt, ξd∗
j d∈exit,vc,ipo; firm value functions Vf ∗
t , Wf ∗
t f∈pb,pr and VC value A∗t ; VC pricing function
svc∗t ; the normalized quality distribution and the mass of firms Ψ∗
t (q), J∗t where t ∈ [0, ∞), j ∈ J∗t such
that
1. k∗jt, p∗jt are given by (5) and (4), and maximize the operating profits,
2. Vf ∗
t , Wf ∗
t f∈pb,pr satisfy (6), (7), (9), and (8),
3. i∗jt maximize the expected profits, and ξd∗
j d∈exit,vc,ipo solves the value functions,
4. Ψ∗t (q) is consistent with R&D, entry, exit, VC, and IPO decisions of the firms,
5. J∗t supports the free entry condition to hold with equality,
6. A∗t is given by (10),
7. svc∗t as in (11) is determined by Nash bargaining;
8. Y∗t , C∗
t are given by (2) and (1),
9. and aggregate prices r∗t , w∗t clear the market.
Accordingly, a balanced growth equilibrium is defined as follows:
Definition 2 (Balanced Growth Path) A Balanced Growth Path (BGP) is an equilibrium where Ψ∗(q)
defines an invariant distribution, the measure of firms, J∗, has a fixed value, and the average quality q and
the aggregate variables grow at a constant rate g.
Given the invariant distribution of normalized quality levels and the stationary R&D deci-
sions, I can now derive the constant growth rate of the economy in a BGP:23
g =∫
j∈J∗
(
1 − ξexitj
)
ijλ + ξipoj (κ − 1)
(
qj + ijλ)
dj
−∫
j∈J∗
ξexitj + I
vcj σvc
(
1 − ξexitj
)
qjdj +∫
j∈Jentryqjdj. (12)
There are several factors that contribute to the balanced growth rate. The first integral on the right-
hand side of equation (12) captures the effect of surviving firms. Conditional on remaining in the
business, intermediate firm j adds the step size λ if it generates an innovation, which happens
at rate ij. Moreover, if firm j issues public equity in the beginning of the next period, its quality
23See Appendix A for the derivation.
16
VENTURE CAPITAL, FIRM DYNAMICS, AND ECONOMIC GROWTH Sina T. Ates (UPenn)
increases by a factor κ − 1. The second integral captures the loss due to exiting firms. Notice
that exit happens due to both the optimal decision of the firm and the attrition rate if the firm is
matched with a VC. The last component of equation (12) denotes the contribution of entry.24
Finally, the following condition holds for the representative household.
Proposition 1 (Euler Equation) In BGP, the household maximization implies the equilibrium interest rate
r = (1 + g)ε /β − 1.
3 Estimation
In order to measure the specific effects of different channels through which VC financing affects
firm-level innovation and aggregate growth, I estimate the parameters of the model via the simu-
lated method of moments (SMM). In this section, I first describe the identification and computa-
tion procedures. Then, I present the estimation results and discuss the goodness of fit. As a brief
overview, the model successfully captures the duration of firm-VC matches and the firm age at the
time of initial public offering as well as the aggregate patterns of R&D and growth. The model
also replicates the difference in firm growth patterns between VC-backed and non-VC-backed
firms observed in the data. I start by describing the parameters that are determined outside the
model.
3.1 Pre-determined Parameters
Because the model at hand is a fairly rich one with a large number of parameters, assigning some
of them a priori mitigates the burden of estimation. There are 10 parameters that are chosen
externally. The time period in the model corresponds to 1 year in the data. On the household
side, the period utility function is assumed to have logarithmic form such that the curvature of
the CRRA utility function, ε, equals 1, the midpoint between various estimates surveyed in Mehra
and Prescott (1985). The discount rate, β, is picked to imply a reasonable long run interest rate
level, given the targeted rate of growth of 2%. Setting β = 0.98 implies approximately a 4% real
interest rate. On the final good production, the share of intermediate goods, α, is set to 0.825. This
is in the ballpark of Akcigit et al. (2014), who find a calibrated share of 0.9 for tangible factors of
production using US data on firm profitability. Akcigit et al. (2013) also assign a value of 0.85 to
physical factors in their final good production function. Without loss of generality, the marginal
cost of producing intermediate goods is normalized to (1 − α) for private firms that do not have
24Note that the entrant firms do not contribute through IPO because the support of the distribution from which theydraw the initial product quality does not extend over values that lead to IPO.
17

VENTURE CAPITAL, FIRM DYNAMICS, AND ECONOMIC GROWTH Sina T. Ates (UPenn)
VC support.25
The function h(·) that defines the cost of doing R&D is assumed to have the form γ0xγ1 .
The curvature parameter, γ1, is set to 2 so that the function has quadratic shape. This in turn
implies that the R&D elasticity in the innovation production function is 0.5, a value in line with
the empirical literature.26 The lowest product development efficiency, θL, is normalized to 1.
The parameter that governs the exogenous separation of matches between firms and VC
funds, σvc, is set as follows. In NVCA (2013), the National Venture Capital Association (NVCA)
reports that, among VC-backed firms that received their first round of funding between 1991-2000,
about 16% made it to the IPO stage. Another 18% are reported to fail. The rest of the matches end
in ways that I do not include in my model.27 The exogenous separation parameter, σvc, captures
the yearly attrition rate due to these external reasons.28 For the average share sold at IPO, ∆, Ritter
(1998) reports a range of 20%-40%. The telegraph matching function introduces a single scale
parameter that is normalized to 1. Lastly, the bargaining power of the VC, φ, is assumed to be 0.5.
Table (1) summarizes the predetermined values.
Table 1: Parameters Fixed A Priori
Value Description Source
β = 0.98 Discount Rate Real Interest Rate
ε = 1 CRRA curvature Mehra and Prescott (1985)
α = 0.825 Share of physical factor Akcigit et al. (2014)
ηH = 1 − α Cost of capital, high normalized
γ1 = 2 R&D cost elasticity Blundell et al. (2002)
θL = 1 Product development efficiency, low normalized
ρ = 1 Scale of telegraph matching imposed
φ = 0.5 Bargaining power imposed
σvc = 8.7% Attrition rate of VC-firm matches Unsuccessful separations
∆ = .28 Share sold at IPO Ritter (1998)
25This normalization simplifies the derivation of the profit function. The corresponding value for VC-backed andpublic firms, η, is determined in the estimation.
26Measuring innovations by patents, the empirical literature on patents and R&D provides estimates for this elasticity.Griliches (1990) gives a range from 0.3 to 0.6 while Blundell et al. (2002) find 0.5.
27Among these remaining matches, half of them resulted in acquisition of the private firm by another one. The otherhalf is counted as “still private or not known”, and most of them are believed to have failed. Because the success of a VCfirm is generally measured by its IPO performance, I focus on IPOs.
28The total attrition rate is assumed to be the cumulative hazard rate over 7.5 years. This length of time represents themedian tenure of VC investments, which is estimated to vary from 7 to 10 years in the data.
18

VENTURE CAPITAL, FIRM DYNAMICS, AND ECONOMIC GROWTH Sina T. Ates (UPenn)
3.2 Identification of the Estimated Parameters
There are 10 parameters to be estimated. Perhaps the most crucial parameters are θL, θH because
they determine the magnitude of the impact on firm growth of the operational knowledge provided
by VCs. Having normalized θL to 1, I make use of Puri and Zarutskie (2012) in estimating θH. Puri
and Zarutskie (2012) make a fundamental contribution to the empirical literature that investigates
the effect of venture capital on firm dynamics by employing survey data on firms. In particular,
they combine the VentureXpert and Longitudinal Business Database of US Census Bureau so that
they are able to determine the firms that received VC financing. Controlling for the number
of employees, age, geographical location, and the industry at four-digit SIC level, they create
a matched sample of non-VC-backed firms and firms that are at the first round of getting VC
funding.29 The authors observe the firms in these two categories until they exit in some form (exit
the data, become public, etc.) for a maximum of 10 years. Then, using these samples, they regress
the logarithm of firm sales on a number of covariates and, in particular, provide the OLS estimate
on the interaction term between a dummy for VC use and the time elapsed after matching.30 This
estimate determines the differential impact of VC financing on firm growth. To determine θH, I
create analogous samples from the stationary distribution of my model. I simulate firms in these
samples for 10 years, and conduct the same regression analysis. The estimation procedure tries to
match the model counterpart of the OLS estimate with the one provided Puri and Zarutskie (2012).
The size of VC firms’ financial impact is governed by the difference between η and ηH, the
marginal costs of production for private firms with and without VC backing, respectively. To
discipline this difference, I assume that the decline in the cost of capital due to VC investment
reflects all the pecuniary support of VC companies. Then, including the ratio of VC investment to
GDP as one of the data moments determines the size of this financial support in my model.31
In order to complete the estimation of the VC market, the entry cost for VC firms needs to be
determined. The entry cost of the venture capitalist, χvc, creates a threshold for the intermediate
good qualities above which VC firms would not agree to form a match with a firm, because they
could not generate a great deal of improvement on already high quality levels due to decreasing
returns to innovations. Moreover, this entry cost determines the ex-ante value of a venture capi-
talist before entering the market. Therefore, once the other parameters that describe the matching
function and Nash bargaining are fixed, χvc is closely correlated with the probability of firms ob-
29It should be emphasized that Puri and Zarutskie (2012) do not control for the amount of VC investment received,and do not uncover particular mechanisms through which VC affects firm dynamics. One contribution of my paper is toestablish this.
30The OLS regression results are presented in Appendix B.31Venture capital investments do not only include funding of early- and growth-stage companies, but also buyouts,
later-stage investments, etc. not relevant to the point of this paper. Therefore, when calculating the ratio of VC investmentto GDP, I take into account only the early- and expansionary-stage investments by VC.
19

VENTURE CAPITAL, FIRM DYNAMICS, AND ECONOMIC GROWTH Sina T. Ates (UPenn)
taining VC financing. Hence, to discipline χvc, I include as a target the NVCA (2013) estimate that,
roughly, only one out of a hundred applications succeeds in securing VC financing. One caveat: in
my model, every meeting in the matching market results in a match. This happens both because
there is no search cost for the firms, and because VC firms are identical. Any firm that knows that
a match would create a positive surplus goes into the market, and the ones with the expectation
of a negative surplus stay out. To map the NVCA statistic to my model, I interpret the 1% success
on applications as the chance of meeting a VC company that would accept the firm. When solving
the model, I fix the probability of matching with a VC at this level, and solve for the level of entry
cost that supports the equilibrium by looping over χvc.
To complete the cost structure of an IPO, the fixed cost of IPO, χIPO, needs to be determined.
This parameter maps to direct costs of IPO observed in the data, such as registration fee and
underwriting costs. The statistics provided by Ritter (1998) indicate that, on average, these costs
amount to 11% of the total proceeds raised by IPO. Using this figure, I can directly estimate χIPO.
The benefits of an IPO are determined by two parameters: κ, the abrupt increase in quality
level, and θM, the permanent product development efficiency that VC-backed firms retain after
becoming public. Determining the gains from IPO, these parameters are crucial for the decision
of the optimal time to go public. To pin down κ and θM, I therefore use the median age across all
private firms at the time of IPO, together with the median length of firm-VC matches that lead to
an IPO. Because product development efficiency is assumed to remain fixed for non-VC-funded
private firms after going public, κ is the only parameter that determines the gains from going
public for these type of firms. Then, the median time to IPO for VC-backed companies is helpful
primarily in identifying θM. Both κ and θM are negatively related to these age moments.
The rest of the parameters are λ, γ0, χo, and χe. The first one determines the quality gain
due to process innovations and is mostly tied to the average growth, for which the target value
is the average US post-war annual growth rate of 2%. The scale parameter of R&D cost function
γ0 is used to match the R&D share of GDP. The outside option for intermediate firms, χo, is
estimated by targeting a 5.5% equilibrium exit rate. I take this value from Lee and Mukoyama
(2012), who calculate estimates using US plant-level data from 1972-1997. I set the entry cost,
χe, that the potential entrepreneurs face, such that the equilibrium measure of intermediate good
firms is equal to unity. As a result, the set of 11 parameters to be estimated within the feasible set
Ω is
ω ≡[
η, γ0, χvc, ρ, χIPO, κ, θM, θH, λ, χe, χo
]T∈ Ω.
20

VENTURE CAPITAL, FIRM DYNAMICS, AND ECONOMIC GROWTH Sina T. Ates (UPenn)
3.3 Algorithm
The computation of general equilibrium given a parameter set ωgiven ∈ Ω consists of two nested
fixed point problems. The outer loop searches for convergence on the growth rate. Given the
growth rate, the inner loop computes the value functions. Computation of the value function for
non-VC-backed firms requires another nested fixed point solution in the sense that the equilibrium
matching rate and the value functions needs to be solved jointly. At this point, I modify the
problem so that I fix the matching rate at the targeted moment, and solve for the corresponding
VC entry cost instead. This step requires calculation of the endogenous (normalized) quality
distribution across firms. The reason is that, given the fixed matching rate, I use the value of
the VC firm to update the guess for χvc, and the value function of the VC firm depends on the
endogenous distribution of firms searching for VC. To yield a smooth distribution, I discretize
the possible values of the normalized quality levels into 1200 points for each firm type. Once I
obtain the general equilibrium, I simulate samples from the stationary distribution to calculate the
moments regarding the age of IPO for private firms, median duration to IPO in firm-VC matches,
and the regression statistic that determines χvc. Given a set of parameters ωguess the solution
routine continues as follows:
1. Guess a growth rate gguess.
2. Solve for the value functions of
2.i) Public firms
2.ii) VC-backed private firms
3. Solve for the value function of non-VC-backed private firms.
3.i) Guess a candidate entry cost, χguess, for VC firms.
3.ii) Compute the value function of non-VC-backed private firms.
3.iii) With all value functions at hand, compute the stationary distribution.
3.iv) Compute the implied χnew using the problem of the VC firm. Update until ‖χguess −
χnew‖ < ǫ.
4. Compute the implied gnew. Update until ‖gguess − gnew‖ < ǫ.
21

VENTURE CAPITAL, FIRM DYNAMICS, AND ECONOMIC GROWTH Sina T. Ates (UPenn)
3.4 Estimation Results
Parameter Estimates
Table 2 reports the values for the parameter estimates obtained via the computation algorithm
introduced above.
Table 2: Estimated Parameters
Value Description Identification
η = 0.94 · ηH Cost of capital ratio VC investment/GDP
γ0 = 50 R&D cost scale R&D investment/GDP
χvc = 0.435 VC entry cost Success in due diligence
χipo = 0.20 IPO fixed cost Direct cost of IPO
κ = 1.60 Quality jump, IPO Median duration with VC
θM = 4 Efficiency, after VC Median age at IPO
θH = 5 Efficiency, with VC Puri&Zarutskie (2012)
λ = 0.275 Innovation size Growth rate
χe = 2.43∗10−4 Entry cost Fixing measure to unity
χo = 6.06 Outside option Exit rate
A number of parameter estimates in Table 2 merit special attention. The first variable in
the table, η, determines the magnitude of the financial help of VC firms. The estimated value
implies that VC firms decrease the marginal cost of intermediate good production by 6%. The
economic meaning of this estimate is better reflected in the resulting difference in operation profit
levels. A back-of-the-envelope calculation shows that the estimated reduction in marginal costs
translates into 30% higher operational profits for a VC-backed company compared to a non-VC-
backed counterpart with the same product quality.
Two other important parameters are θH and θM, which, respectively, measure the direct
and permanent (post-IPO) efficiency gains in product development due to VC firms’ operational
knowledge. The former implies that a VC-backed firm is five times more efficient than its non-
VC-backed counterpart in improving a certain quality level with innovation intensity. Moreover,
the estimate for θM implies that the VC-backed firm retains 80% of this efficiency gain after going
public. As the counterfactual experiments reveal below, this limited loss of efficiency even after
separation from the VC firm has important implications for the effect of VC financing on long-run
economic growth.
22

VENTURE CAPITAL, FIRM DYNAMICS, AND ECONOMIC GROWTH Sina T. Ates (UPenn)
Goodness of Fit
Table 3 summarizes the moment targets and their counterparts in the model. First of all, the model
is successful in matching the aggregate growth rate and the ratio of R&D investment to GDP.
Because innovation and aggregate growth are integral parts of the analysis, it is critical that the
model reflects these aspects of the data well.
Looking at the data moments that largely define the VC market, the first result is that the
model accounts for a fair amount of VC investment in the data. Notice that the implied param-
eter estimate results in a sizable improvement in operational profits of VC-backed companies, as
explained above. Thus, it is fair to conclude that the estimation allows the monetary aspect of VC
financing to have a significant impact on firm dynamics. The other channel, operational knowl-
edge, has both a direct and a permanent effect on the firms that receive VC support. The direct
effect is disciplined by the regression statistic obtained from the analysis of Puri and Zarutskie
(2012), and the model proves to be successful in matching this crucial target.32 Moreover, the
median duration of VC-backed firms until IPO in the model mirrors the data target very closely.
Matching this target is important because it disciplines the permanent effect of VC’s operational
knowledge as well as the IPO cost for VC-backed firms in this regard.
Table 3: Model Fit
Target Data Model
VC investment/GDP 0.17% 0.12%
IPO direct costs 11% 6.26%
Match probability 1% 1%
R&D investment/GDP 2.8% 2.89%
Median duration with VC 5.5yrs 6yrs
Median age at IPO 12yrs 11yrs
Regression statistic 0.212 0.242
Growth rate 2.0% 1.95%
Exit rate 5.5% 2.75%
1 The regression statistic provided by Puri and Zarutskie (2012)
is highly significant with a t-statistic 11.23.
Non-targeted Moments
Table 4 reports statistics observed in the data and not targeted in the estimation of the model,
together with their data counterparts.
32I discuss the implications for firm growth below.
23

VENTURE CAPITAL, FIRM DYNAMICS, AND ECONOMIC GROWTH Sina T. Ates (UPenn)
Table 4: Non-targeted Moments
Data Model
IPO probability of VC-backed firms 16% 20%
VC-backed IPOs 50% 51%
Output share of private firms 46% 48%
Relative firm growth 0.75 0.22
First of all, the model captures the IPO patterns in the data accurately. The model simulations
based on samples of 50,000 firms imply that about 16% of VC-firm matches end up with an IPO.
This number is the ballpark of the value found in the 2013 report of the National Venture Capital
Association (NVCA, 2013). For the private firms without VC support, the corresponding value is
1.7% in the model. This is well below the value for VC-backed companies, a pattern also observed
in the data. Similarly, the fraction of IPOs involving VC-backed firms is also closely reflected in the
model. The recent IPO report by WilmerHale (2014), a widely recognized law company in the US,
documents that in 2013, VC-backed IPOs constituted half of all IPOs, whereas the data statistics in
Ritter (2014) indicate that an average of 38% of IPOs were VC-backed between 2006-2013.
A closer look at the firm type composition of the model economy shows that 48% of output
is produced by privately held firms. The most recent figures from the U.S. Small Business Ad-
ministration data similarly show that a little less than 50% of the US GDP is produced by firms
with fewer than 500 employees of which almost all are private firms (Kobe, 2012).33,34 Regarding
the growth rates of private firms, the estimated model predicts that the yearly average growth rate
of VC-backed firms is 22% higher than the rate of the non-VC-backed sample.35 The correspond-
ing figure in the data is obtained from Puri and Zarutskie (2012). As explained in detail, Puri
and Zarutskie (2012) explore growth rates of different samples of private firms with and with-
out VC backing that are matched based on observable characteristics. They document that, over
the first 10 years after the time of matching, the average growth rate of the VC-backed sample is
75% higher. Although at a smaller magnitude, the model captures this pattern qualitatively. This
smaller magnitude indicates that the model provides a lower bound for the VC impact observed
in the data.36
33It is true that a small fraction of firms in the economy are public, and most of the large firms with more than 500employees are private. However, given that my focus is on the dynamics of young and innovative firms as opposed tovery large private firms, matching the output share of firms with less than 500 employees is a reasonable comparison.
34Asker et al. (2014) report that all private firms account for 59% of sales.35In this exercise, firm growth is defined as sales growth, in line with Puri and Zarutskie (2012).36This smaller magnitude can be partially attributed to the exogenous attrition process that hits every VC match
with the same probability,i.e., it destroys successful matches at the same rate as it does relatively unsuccessful ones.However, in reality, an important share of the exits that the attrition rate accounts for in the model are unsuccessfulfirms. Therefore, the figure of 22% generated by the model can be considered as an attenuated value for the growth ratedifferential between VC-backed and non-VC-backed samples.
24

VENTURE CAPITAL, FIRM DYNAMICS, AND ECONOMIC GROWTH Sina T. Ates (UPenn)
Figure 2: Evolution of Matched Samples in the Model
0.5 0.75 1 1.25 1.5 0
1
2
3
4
5
6
7
Normalized quality
Sim
ulat
ed d
ensi
ty fu
nctio
n, m
odel
without VCwith VCinitial
Figure 2 shows the impact of VC on firm distribution over a 10-year period. Following Puri
and Zarutskie (2012) I create a model sample of private firms from the stationary distribution that
defines new matches with VC firms. The thin solid line shows this initial distribution. I then
simulate two versions of this sample across 10 years. In one version, firms are assumed to receive
VC financing whereas in the other, firms continue without VCs and are observed until they obtain
VC, issue public equity or exit the market. Starting the simulation with the identical group of
firms replicates the matching exercise of firms in te data based on their sales, as done by Puri and
Zarutskie (2012). The resulting difference between VC-backed and non-VC-backed samples after
10 years is illustrated by the dashed and thick solid lines, respectively. Among the VC-backed
firms that remain after 10 years, there is a population of firms that survive with lower sales and
profits. Notice that, in the model, the value of the outside option, χo qt, is the same for any firm
type. This shows that financial support from VCs through lower intermediate production costs
helps some firms with a lower productive capacity remain in the economy. However, as the last
row of Table 4 shows, the yearly average growth rate of the VC-backed sample is 22% higher in
the model. This impact is reflected by the fatter right tail of the resulting distribution of the VC-
backed sample. VC firms’ operational knowledge enables a larger subgroup of firms to achieve
higher levels of production compared to the non-VC-backed sample. This outcome is in line with
the reality that many portfolio companies of VC funds are relatively unsuccessful, while a few
perform exceptionally.
Regarding VC impact on firm growth, one caveat is worth mentioning. Despite the fact that
Puri and Zarutskie (2012) controlled for observable characteristics when creating matched sam-
25

VENTURE CAPITAL, FIRM DYNAMICS, AND ECONOMIC GROWTH Sina T. Ates (UPenn)
ples, this procedure did not account for a possible selection of firms by VC companies according
to unobservable features. Suppose that there was sorting of firms that are superior on some un-
observable quality towards VC investment. If the matching procedure does not account for this
type of sorting, and if that affects firm growth positively, then this would inflate the apparent ef-
fect of VC investment through operational knowledge in my model, since the contribution of this
unobserved quality would be inaccurately assigned to that channel. It is fundamentally important
to notice that this would not bias my estimation because it proceeds on the method of indirect
inference, replicating the same empirical experiment as in Puri and Zarutskie (2012). Nonethe-
less, when interpreting the impact of operational knowledge in both the model and in the data,
the potential effect of selection on unobservables can be included, using the findings of Sørensen
(2007). Using data on IPO rates of VC-backed companies, Sørensen (2007) shows that the portfolio
companies of more experienced VCs are more likely to go public. Then, he structurally estimates
a two-sided matching model to find that sorting, defined as the fact that more experienced VCs
invest in better firms, accounts for 50% to 60% of the higher IPO rate in companies backed by more
experienced VCs. In other words, the direct influence of VC on the firm is 40-50%. This estimate,
however, reflects the differential effect of VCs’ expertise only across VC-backed firms, and does not
account for its significance in comparison to firms that completely lack VC backing. This means
that it attenuates the relevance of VCs’ direct influence on firms. Nevertheless, if a conservative
path were followed based on Sørensen (2007), the estimate of 22% that my model implies for VCs’
impact on firm growth would still translate into 10%.
4 Quantitative Exploration
Having estimated the parameters of the model and analyzed the model fit, I use this framework
for two purposes. First, I measure the significance of VCs’ operational knowledge relative to the
financing channel, in terms of the aggregate growth of the economy. To do so, I run counter-
factual experiments in which I marginally increase the parameters that govern financing and the
operational knowledge channels. I then compare the resulting changes in the growth rates of the
economy. Next, I replicate a recent policy measure that the European Union has adopted to make
the investment environment more hospitable for venture capital firms. In the model, I capture the
essence of the policy by decreasing the entry cost of VC firms, and explore the impact on long-run
economic growth.
26

VENTURE CAPITAL, FIRM DYNAMICS, AND ECONOMIC GROWTH Sina T. Ates (UPenn)
4.1 Counterfactual Analysis: Strength of Operational Knowledge
To measure the relative impact of the operational knowledge channel in aggregate growth terms, I
first consider a hypothetical economy in which I increase the parameters
θM, θH
by 5% without
changing θL.37 I then run a similar experiment where I increase the size of the marginal cost
reduction due to VC help by the same amount, keeping the other parameters at the estimated
levels. These experiments allow me to compare the elasticity of the growth rate to the distinct
channels through which VC firms affect firm dynamics.
Table 5: Counterfactual Experiments
Benchmark
θM, θH
5% higher
(
ηH − η)
5% higherNo VC
IPO fixed cost
15% higher
VC entry cost
3.5% lower
Growth 1.95% 2.01% 2.06% 1.39% 1.93% 2.02%
Measure of firms 1 1 1.16 0.99 1 1.01
The first three columns of Table 5 summarize the response of the economy to marginal
changes in different aspects of VC support in comparison to the estimated economy. The table
also reports the equilibrium measure of intermediate firms because the changes also affect the
endogenously determined size of the economy. Comparing the growth rates in the second and
third columns shows that the marginal increase in the strength of the operational channel leads
to a 0.06% gain in the growth rate, whereas this number is around 11% when the change in the
financial channel is considered. Therefore, the main message of this comparison is that, in terms
of long-run growth, the operational channel is about half as effective as the financial channel. In
other words, the influence of the operational knowledge channel on growth through its impact on
firms accounts for about 1/3 of VCs’ total contribution to aggregate growth through its impact on
firms. The increase in financial impact also expands the equilibrium measure of products by 16%,
in addition to its effect on long-run growth.
A deeper look into the hypothetical model economies reveals that, in the case of stronger
financial support, most of the impact is generated through the changing composition of private
firms. In the hypothetical world with increased financial impact, the ratio of output produced by
VC-backed firms to the amount produced by all private firms is about 50%, whereas this number
is about 4% in the estimated actual economy.38 One reason for this result is that, due to the higher
37One alternative approach to measure the impact of operational knowledge is to consider its absence by removingthe increase in product development efficiency due to VC support. The reason I do not use this approach is that in thiscase no private firm searches for VC. Nevertheless, this endogenous shutting down of the market happens even whenthere are small efficiency gains from VC help. In that case, removing the efficiency gain completely does not measurethe exact impact of operational knowledge on aggregate growth.
38Notice that the 5% additional reduction in marginal cost translates into more than 25% additional profits per unitof product quality. The huge responses in the hypothetical economy stem from this fact. Thus, it is plausible to think
27

VENTURE CAPITAL, FIRM DYNAMICS, AND ECONOMIC GROWTH Sina T. Ates (UPenn)
aggregate growth rate, the fixed cost of IPO, which is proportional to aggregate productivity,
increases faster. This leads to longer durations of VC matches before VC-backed firms go public.39
In the case of stronger operational knowledge influence, however, these fluctuations are much
more limited. Instead, the impact on long-run growth of the economy stems from the increased
efficiency of development, both for the VC-backed firms and for the public firms that received VC
support.
Lastly, the fourth column in Table 5 implies that, in a hypothetical world without a market
for venture capital, the growth rate would go down to 1.40%. Here, I assume that all firms operate
with low efficiency, and there is no means to affect it. This lower efficiency, in turn, leads to a drastic
fall in the growth rate. Regarding this experiment, one caveat is that all firms operate at the higher
marginal cost of production because the only financial intermediary in the model is removed.
This has an indirect growth impact because higher profits due to VCs’ financial support create an
indirect incentive for innovation due to a larger return per unit of product quality. The drastic fall
in the aggregate growth rate would potentially be smaller if there were an alternative intermediary
with a similar financial impact. Therefore, this result should be interpreted cautiously.
4.2 Counterfactual Analysis: Higher Cost of IPO
A widely held belief is that there are strong complementarities between VC finance and an active
public equity market (Black and Gilson, 1998; Michelacci and Suarez, 2004).40 The intuition is
the following: on the one hand, VC firms accelerate new ventures towards issuing IPO, through
the aforementioned influences. On the other hand, liquid stock markets provide an attractive
and affordable IPO option for private firms, and a profitable way for VC firms to separate from
portfolio companies.
To analyze the linkages between public equity issuance and VC financing in my model, I
now consider an economy in which the fixed cost of IPO is 15% higher. I obtain this value from
Kim et al. (2003). In their study of equity and debt issues from 1970s to 2000s, Kim et al. (2003)
document that average underwriting spreads for IPOs in the US were 8.5% and 7.4% over the
periods 1976-1985 and 1996-2005, respectively.41 Having used data from the latter period in my
estimation, I now analyze the counterfactual setting where I set the fixed cost of IPO to its earlier
value. As shown in the fifth column of Table 5, the growth rate falls by about 1.5 basis points.
that these counterfactual comparisons provide lower bounds for the relative importance of the operational knowledgechannel.
39The resulting median age is around 9 years, whereas in the benchmark economy this was 6 years.40Bottazzi and Rin (2002) report supporting evidence on the positive impact of Euro.nm, the European counterpart of
Nasdaq, on European VC activity in 1990s. Euro.nm, opened in 1997, is the alliance of new European stock markets thatfocuses on growth companies.
41The underwriting costs are one of the main determinants of the fixed costs associated with IPOs.
28

VENTURE CAPITAL, FIRM DYNAMICS, AND ECONOMIC GROWTH Sina T. Ates (UPenn)
Figure 3: IPO decisions
0.8 1 1.2 1.4 1.60
1
Normalized Quality
IPO
dec
isio
n
Counterf., w/ VCBenchm., w/ VCCounterf., w/o VCBench., w/o VC
Figure 3 shows the resulting changes in the IPO decisions. The increase in the fixed cost
affects the IPO threshold on the firm size negligibly for VC-backed firms whereas the threshold
for non-VC-backed firms rises discernibly. The difference stems from the higher profit levels that
VC-backed firms generate with the same quality level due to VCs’ financing support. The higher
threshold in turn implies a 3% fall in the non-VC-backed equity issuances. Therefore, it expands
the group of private firms available to match with a VC. Together with the VC firms’ willingness
to search longer due to the higher equilibrium discount factor, this change means a 10% lower
probability that a private firm will match with a VC..42 In turn, the share of VC-backed firms in
the economy decreases by 11%, which also lowers the share of public firms that had received VC
support when they were private. In combination, all these responses result in a 1.5 basis point loss
in the long-run growth rate of the economy.
4.3 Policy Analysis: VC Entry Cost
In 2013, the European Union adopted a new regulation on venture capital funds to enhance fund-
ing to small and medium businesses through venture capital financing.43 As a main obstacle to
adequate VC funding, the European Commission recognized the lack of a harmonized VC market
across the Union. According to the Commission, the fragmented structure of the VC market across
national borders increases VC firms’ costs due to changing national regulatory environments, es-
42A lower growth rate implies a lower interest rate; therefore, VC firms discount the future value less.43The legislative act by the European Commission (2013) explicitly recognizes that “venture capital funds provide
undertakings with valuable expertise and knowledge, business contacts, brand equity and strategic advice”.
29
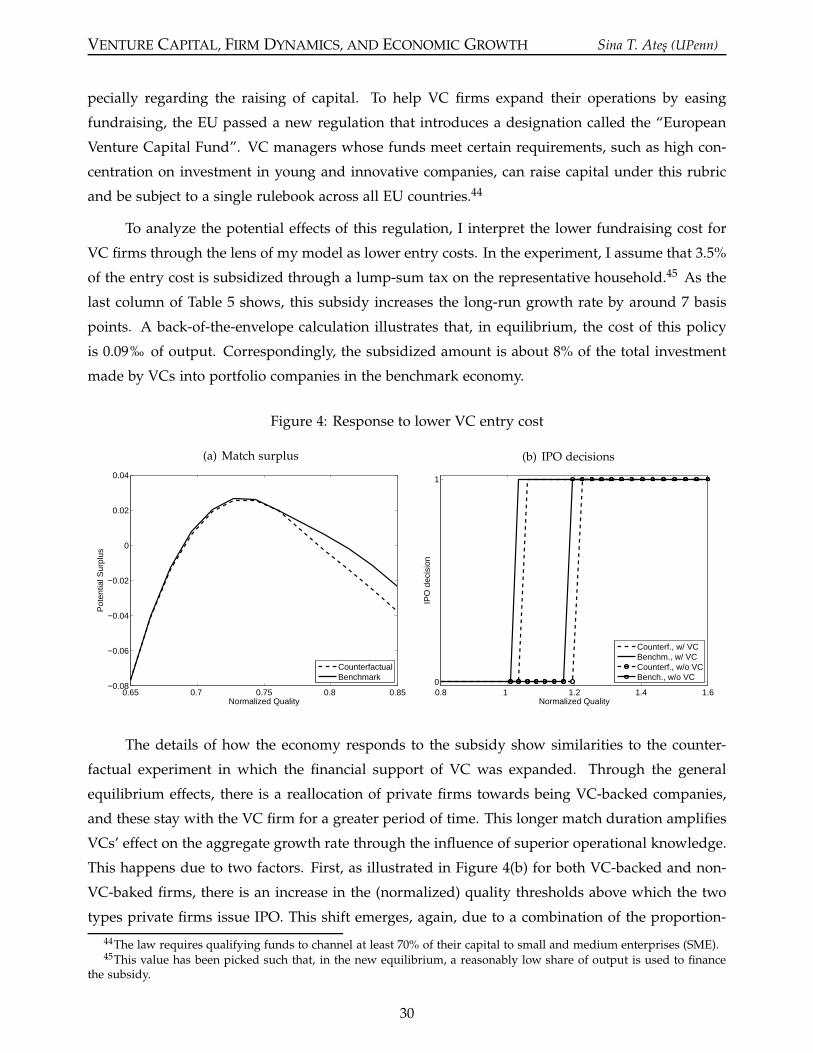
VENTURE CAPITAL, FIRM DYNAMICS, AND ECONOMIC GROWTH Sina T. Ates (UPenn)
pecially regarding the raising of capital. To help VC firms expand their operations by easing
fundraising, the EU passed a new regulation that introduces a designation called the “European
Venture Capital Fund”. VC managers whose funds meet certain requirements, such as high con-
centration on investment in young and innovative companies, can raise capital under this rubric
and be subject to a single rulebook across all EU countries.44
To analyze the potential effects of this regulation, I interpret the lower fundraising cost for
VC firms through the lens of my model as lower entry costs. In the experiment, I assume that 3.5%
of the entry cost is subsidized through a lump-sum tax on the representative household.45 As the
last column of Table 5 shows, this subsidy increases the long-run growth rate by around 7 basis
points. A back-of-the-envelope calculation illustrates that, in equilibrium, the cost of this policy
is 0.09‰ of output. Correspondingly, the subsidized amount is about 8% of the total investment
made by VCs into portfolio companies in the benchmark economy.
Figure 4: Response to lower VC entry cost
(a) Match surplus
0.65 0.7 0.75 0.8 0.85−0.08
−0.06
−0.04
−0.02
0
0.02
0.04
Normalized Quality
Pot
entia
l Sur
plus
CounterfactualBenchmark
(b) IPO decisions
0.8 1 1.2 1.4 1.60
1
Normalized Quality
IPO
dec
isio
n
Counterf., w/ VCBenchm., w/ VCCounterf., w/o VCBench., w/o VC
The details of how the economy responds to the subsidy show similarities to the counter-
factual experiment in which the financial support of VC was expanded. Through the general
equilibrium effects, there is a reallocation of private firms towards being VC-backed companies,
and these stay with the VC firm for a greater period of time. This longer match duration amplifies
VCs’ effect on the aggregate growth rate through the influence of superior operational knowledge.
This happens due to two factors. First, as illustrated in Figure 4(b) for both VC-backed and non-
VC-baked firms, there is an increase in the (normalized) quality thresholds above which the two
types private firms issue IPO. This shift emerges, again, due to a combination of the proportion-
44The law requires qualifying funds to channel at least 70% of their capital to small and medium enterprises (SME).45This value has been picked such that, in the new equilibrium, a reasonably low share of output is used to finance
the subsidy.
30

VENTURE CAPITAL, FIRM DYNAMICS, AND ECONOMIC GROWTH Sina T. Ates (UPenn)
ality of the fixed IPO cost to average productivity, and the higher resulting equilibrium aggregate
growth rate. As a result, firms need to develop their product quality further to afford IPO issuance
costs. The second factor for increased match durations is that VC firms match with companies
of smaller quality levels, which have larger potential for growth. For a given IPO threshold, this
implies that, on average VC-backed firms have to innovate more to reach the IPO stage. Figure 4(a)
delineates this point. The curves show the present discounted value of the surplus of a potential
match between a VC firm and private firms with quality qj. In this economy with subsidies, this
curve shifts towards the left so that a positive surplus, and thus a profitable match, is possible with
firms of smaller size. These combined changes result in a 7 basis point higher long-run growth
rate of the economy.46
5 Conclusion
Motivated by the disproportionate investment of venture capital finance in young and innovative
businesses, I study in this paper the quantitative impact of VC financing on firm dynamics and
economic growth. I propose a new dynamic general equilibrium model of innovation with het-
erogeneous firms by introducing an explicit venture capital (VC) market. The model allows me
to conduct counterfactual experiments which I use to quantify the impact of VC financing and
examine relevant policies. I pay particular attention to a unique feature of VC firms that is largely
overlooked by current macroeconomic analysis: the operational knowledge that VC firms bundle
with their cash investment. In the model, technologically heterogeneous firms engage in innova-
tive activities to improve their product quality and increase their profits. The efficiency of this
product development process can be enhanced through the operational knowledge of VC firms.
The model also includes an endogenous search and matching setting where VC companies and
firms meet. In this way, the model accounts for the selection aspect of the VC market in addition to
the cash investment and the operational knowledge. This is crucial to capture general equilibrium
effects.
I structurally estimate this model using US data on VC finance, public equity issuances, and
research and development expenditures. I identify the operational knowledge channel through
its distinct impact on firm growth. Out-of-sample tests demonstrate that the estimated model
successfully captures the non-targeted data moments such as IPO frequency of VC-backed firms,
46In this economy, all private firms available for VC matches have a certain identical efficiency level. A heterogeneity inthis margin could dampen the effect of the policy change because some of the new VC firms had to meet with firms thatalready have higher efficiency. A parallel impact could arise if there were heterogeneity across VC firms in their potentialto affect product development efficiency (Hsu, 2004; Bottazzi et al., 2008). A similar concept of heterogeneous firm entryand its aggregate productivity implications is investigated by Ates and Saffie (2014). Incorporating these margins ofheterogeneity by deriving the relevant empirical distributions in the data and deploying them in the estimation procedureis an attractive area for future research.
31
VENTURE CAPITAL, FIRM DYNAMICS, AND ECONOMIC GROWTH Sina T. Ates (UPenn)
and the differences in growth rates of VC-backed and non-VC-backed firms, among others.
I then use the estimated model to conduct counterfactual and policy analyses. First, I mea-
sure the impact of the operational knowledge channel in terms of aggregate economic growth. The
analysis indicates that a sizeable fraction, 1/3, of VCs’ impact on economic growth is generated
through operational knowledge channel. This result implies that, for financing innovation, VC has
significant value beyond capital investment alone. Next, I evaluate a recent policy adopted by the
European Union. The regulation aims to decrease fundraising costs for VC firms and expand VC
investment across borders by harmonizing the relevant regulatory environment throughout the
Union. I examine effects of a subsidy on VC entry cost that simulates the policy and find that this
change can generate a 7 basis point gain in the long-run growth rate of the economy.
This paper provides fruitful ground for several directions of future research. One immediate
step could be to explore the implications of heterogeneity across VC firms and the sensitivity of VC
impact on firm growth to this aspect. A broader research question would be how the VC market
arises endogenously. The optimal provision of operational expertise by VC requires managers who
possess both sufficient operational knowledge and financial wealth. Explaining the reasons why
and how venture capitalists emerge could help us understand the vast differences in the size of
VC markets across different regions, such as the US and continental Europe.
32

VENTURE CAPITAL, FIRM DYNAMICS, AND ECONOMIC GROWTH Sina T. Ates (UPenn)
References
Acemoglu, D., U. Akcigit, N. Bloom, and W. R. Kerr (2013). “Innovation, Reallocation and
Growth”. Working Paper 18993, National Bureau of Economic Research.
Aghion, P., U. Akcigit, and P. Howitt (2013). “What Do We Learn From Schumpeterian Growth
Theory?”. Working Paper 18824, National Bureau of Economic Research.
Aghion, P., S. Bond, A. Klemm, and I. Marinescu (2004). “Technology and Financial Structure:
Are Innovative Firms Different?”. Journal of the European Economic Association 2(2-3), 277–288.
Aghion, P. and J. Tirole (1994). “The Management of Innovation”. The Quarterly Journal of Eco-
nomics 109(4), 1185–1209.
Akcigit, U. (2010). “Firm Size, Innovation Dynamics and Growth”. mimeo. University of Penn-
sylvania.
Akcigit, U., S. Ates, and G. Impullitti (2014). “Technology Dynamics, Innovation Policy and the
Gains from Globalization”. mimeo. University of Pennsylvania.
Akcigit, U., M. A. Celik, and J. Greenwood (2013). “Buy, Keep or Sell: Economic Growth and the
Market for Ideas”. Working Paper 19763, National Bureau of Economic Research.
Akcigit, U. and W. R. Kerr (2010). “Growth Through Heterogeneous Innovations”. Working
Paper 16443, National Bureau of Economic Research.
Amit, R., J. A. Brander, and C. Zott (1998). “Why Do Venture Capital Firms Exist? Theory and
Canadian Evidence”. Journal of Business Venturing 13(6), 441–466.
Amore, M. D., C. Schneider, and A. Zaldokas (2013). “Credit Supply and Corporate Innovation”.
Journal of Financial Economics 109(3), 835 – 855.
Asker, J., J. Farre-Mensa, and A. Ljungqvist (2014). “Corporate Investment and Stock Market
Listing: A Puzzle?”. Review of Financial Studies.
Ates, S. T. and F. E. Saffie (2013). “Project Heterogeneity and Growth: The Impact of Selection”.
PIER Working Paper Archive 13-011, Penn Institute for Economic Research, Department of
Economics, University of Pennsylvania.
Ates, S. T. and F. E. Saffie (2014). “Fewer but Better: Sudden Stops, Firm Entry, and Finan-
cial Selection”. PIER Working Paper Archive 14-043, Penn Institute for Economic Research,
Department of Economics, University of Pennsylvania.
Bartelsman, E., J. Haltiwanger, and S. Scarpetta (2009). “Measuring and Analyzing Cross-country
Differences in Firm Dynamics”, pp. 15–76. University of Chicago Press.
33

VENTURE CAPITAL, FIRM DYNAMICS, AND ECONOMIC GROWTH Sina T. Ates (UPenn)
Bartlett, J. (1995). “Equity Finance: Venture Capital, Buyouts, Restructurings and Reorganizations”.
Business practice library. Wolters Kluwer Law & Business.
Black, B. S. and R. J. Gilson (1998). “Venture Capital and the Structure of Capital Markets: Banks
versus Stock Markets”. Journal of Financial Economics 47(3), 243–277.
Blundell, R., R. Griffith, and F. Windmeijer (2002). “Individual effects and dynamics in count
data models”. Journal of Econometrics 108(1), 113–131.
Bottazzi, L., M. Da Rin, and T. Hellmann (2008). “Who are the active investors?: Evidence from
venture capital”. Journal of Financial Economics 89(3), 488–512.
Bottazzi, L. and M. D. Rin (2002). “Venture Capital in Europe and the Financing of Innovative
Companies”. Economic Policy 17(34), 229–270.
Brander, J. A., R. Amit, and W. Antweiler (2002). “Venture-Capital Syndication: Improved Ven-
ture Selection vs. The Value-Added Hypothesis”. Journal of Economics & Management Strat-
egy 11(3), 423–452.
Brown, J. R., S. M. Fazzari, and B. C. Peters (2009). “Financing Innovation and Growth: Cash
Flow, External Equity, and the 1990s R&D Boom”. The Journal of Finance 64(1), 151–185.
Casamatta, C. (2003). “Financing and Advising: Optimal Financial Contracts with Venture Cap-
italists”. The Journal of Finance 58(5), 2059–2086.
Casamatta, C. and C. Haritchabalet (2007). “Experience, screening and syndication in venture
capital investments”. Journal of Financial Intermediation 16(3), 368–398.
Da Rin, M., T. Hellmann, and M. Puri (2011). “A Survey of Venture Capital Research”. NBER
Working Papers 17523, National Bureau of Economic Research, Inc.
de Bettignies, J.-E. and J. A. Brander (2007). “Financing Entrepreneurship: Bank Finance versus
Venture Capital”. Journal of Business Venturing 22(6), 808–832.
European Commission (2013). “Regulation (EU) No 345/2013 of the European Parliament and
of the Council of on European venture capital funds”.
Gompers, P. A. (1995). “Optimal Investment, Monitoring, and the Staging of Venture Capital”.
The Journal of Finance 50(5), 1461–1489.
Gonzalez-Uribe, J. (2014). “Venture Capital and the Appropriation of Innovation Externalities”.
mimeo. London School of Economics.
Gorman, M. and W. A. Sahlman (1989). “What do venture capitalists do?”. Journal of Business
Venturing 4(4), 231 – 248.
34

VENTURE CAPITAL, FIRM DYNAMICS, AND ECONOMIC GROWTH Sina T. Ates (UPenn)
Griliches, Z. (1990). “Patent Statistics as Economic Indicators: A Survey”. Journal of Economic
Literature 28(4), 1661–1707.
Grossman, G. M. and E. Helpman (1991). “Quality Ladders in the Theory of Growth”. The Review
of Economic Studies 58(1), pp. 43–61.
Hall, B. H. and J. Lerner (2009). “The Financing of R&D and Innovation”. NBER Working Papers
15325, National Bureau of Economic Research, Inc.
Hellmann, T. and M. Puri (2000). “The Interaction between Product Market and Financing Strat-
egy: The Role of Venture Capital”. Review of Financial Studies 13(4), 959–84.
Hellmann, T. and M. Puri (2002). “Venture Capital and the Professionalization of Start-Up Firms:
Empirical Evidence”. Journal of Finance 57(1), 169–197.
Hsu, D. H. (2004). “What Do Entrepreneurs Pay for Venture Capital Affiliation?”. The Journal of
Finance 59(4), 1805–1844.
Itenberg, O. (2014). “Firm Size, Equity Financing and Innovation Activity”. mimeo. University of
Pennsylvania.
Jaimovich, N. and S. Rebelo (2012). “Non-linear Effects of Taxation on Growth”. Working Paper
18473, National Bureau of Economic Research.
Jayaratne, J. and P. E. Strahan (1996). “The Finance-Growth Nexus: Evidence from Bank Branch
Deregulation”. The Quarterly Journal of Economics 111(3), 639–70.
Kim, D., D. Palia, and A. Saunders (2003). “The Long-Run Behavior of Debt and Equity Under-
writing Spreads”. mimeo. Stern School of Business, NYU.
Kim, W. and M. S. Weisbach (2008). “Motivations For Public Equity Offers: An International
Perspective”. Journal of Financial Economics 87(2), 281–307.
King, R. G. and R. Levine (1993). “Finance, Entrepreneurship and Growth: Theory and Evi-
dence”. Journal of Monetary Economics 32(3), 513–542.
Klette, T. J. and S. Kortum (2004). “Innovating Firms and Aggregate Innovation”. Journal of
Political Economy 112(5), 986–1018.
Kobe, K. (2012). “Small Business GDP: Update 2002-2010”. Economic Consulting Services, LLC
UC Berkeley. Washington, D.C.: Office of Advocacy, United States Small Business Administra-
tion.
Kortum, S. and J. Lerner (2000). “Assessing the Contribution of Venture Capital to Innovation”.
The RAND Journal of Economics 31(4), pp. 674–692.
35

VENTURE CAPITAL, FIRM DYNAMICS, AND ECONOMIC GROWTH Sina T. Ates (UPenn)
Lentz, R. and D. T. Mortensen (2008). “An Empirical Model of Growth Through Product Innova-
tion”. Econometrica 76(6), 1317–1373.
Lerner, J., M. Sørensen, and P. Strömberg (2011). “Private Equity and Long-Run Investment: The
Case of Innovation”. The Journal of Finance 66(2), 445–477.
Levine, R. (2005). “Finance and Growth: Theory and Evidence”. In P. Aghion and S. Durlauf
(Eds.), Handbook of Economic Growth, Volume 1 of Handbook of Economic Growth, Chapter 12, pp.
865–934. Elsevier.
Lindsey, L. (2008). “Blurring Firm Boundaries: The Role of Venture Capital in Strategic Al-
liances”. The Journal of Finance 63(3), 1137–1168.
Mehra, R. and E. C. Prescott (1985). “The Equity Premium: A Puzzle”. Journal of Monetary
Economics 15(2), 145–161.
Michelacci, C. and J. Suarez (2004). “Business Creation and the Stock Market”. Review of Economic
Studies 71(2), 459–481.
NVCA (2013). “National Venture Capital Association Yearbook”.
Opp, C. (2014). “Venture Capital Cycles”. mimeo. The Wharton School, University of Pennsylva-
nia.
Pinheiro, R. (2012). “Venture Capital and Underpricing: Capacity Constraints and Early Sales”.
mimeo. Leeds School of Business, University of Colorado at Boulder.
Puri, M. and R. Zarutskie (2012). “On the Life Cycle Dynamics of Venture-Capital- and Non-
Venture-Capital-Financed Firms”. The Journal of Finance 67(6), 2247–2293.
Ritter, J. (1998). “Initial Public Offerings”. Contemporary Finance Digest 2(1), 5–30.
Ritter, J. R. (2014). “Initial Public Offerings: Updated Statistics”. Retrieved on 10/4/2014
http://bear.warrington.ufl.edu/ritter/IPOs2013Statisti s.pdf.
Romer, P. M. (1990). “Endogenous Technological Change”. Journal of Political Economy 98(5),
S71–102.
Sahlman, W. A. (1990). “The Structure and Governance of Venture-capital Organizations”. Journal
of Financial Economics 27(2), 473–521.
Scarpetta, S., E. Bartelsman, and J. C. Haltiwanger (2004). “Microeconomic Evidence of Creative
Destruction in Industrial and Developing Countries”. The World Bank.
36

VENTURE CAPITAL, FIRM DYNAMICS, AND ECONOMIC GROWTH Sina T. Ates (UPenn)
Shi, S. (2009). “Directed Search for Equilibrium Wage-Tenure Contracts”. Econometrica 77(2),
561–584.
Silveira, R. and R. Wright (2013). “The Venture Capital Cycle: A Model of Search and Bargain-
ing”. Unpublished working paper.
Sørensen, M. (2007). “How Smart Is Smart Money? A Two-Sided Matching Model of Venture
Capital”. The Journal of Finance 62(6), 2725–2762.
Ueda, M. (2004). “Banks versus Venture Capital: Project Evaluation, Screening, and Expropria-
tion”. The Journal of Finance 59(2), 601–621.
WilmerHale (2014). “IPO Report”.
37

VENTURE CAPITAL, FIRM DYNAMICS, AND ECONOMIC GROWTH Sina T. Ates (UPenn)
Appendices
A Derivation of the Growth Rate
The average growth rate in the economy is equal to the growth rate of the average quality level
qt whose value in (t + 1) becomes:
∫
j∈Jt+1
qjt+1dj = qt+1 =∫
j∈Jt
(
1 − ξexitj
)
(
qjt + ijλqjt
)
+ ξipoj (κ − 1)
(
qjt + ijλqjt
)
dj+∫
j∈Jentryqjtdj
The components of this expression take into account the changes due to innovation, IPO, exit,
and entry, as explained in detail in Section 2.5. Dividing both sides of this expression by qt and
dropping time subscripts in BGP, we obtain
1 + g =∫
j∈J∗
(
1 − ξexitj
)
(
qj + ijλ)
+ ξipoj (κ − 1)
(
qj + ijλ)
dj +∫
j∈Jentryqjdj
=∫
j∈J∗
(
1 − ξexitj
)
qj + ξipoj (κ − 1) qj
dj+
∫
j∈J∗
(
1 − ξexitj
)
ijλ + ξipoj (κ − 1) ijλ
dj +∫
j∈Jentryqjdj
=∫
j∈J∗qjdj +
∫
j∈J∗
ξipoj (κ − 1) qj − ξexit
j
[
qj + ξipoj (κ − 1) qj
]
dj+
∫
j∈J∗
(
1 − ξexitj
)
ijλ + ξipoj (κ − 1) ijλ
dj +∫
j∈Jentryqjdj.
The second equality above collects the normalized quality levels into the first integral. The third
equality separates∫
qjdj which, by definition of normalized quality, equals 1. Hence, we arrive
at
g =∫
j∈J∗
(
1 − ξexitj
)
δipoj (κ − 1) qjdj −
∫
j∈J∗δexit
j qjdj+
∫
j∈J∗
(
1 − ξexitj
)
ijλ + ξipoj (κ − 1) ijλ
dj +∫
j∈Jentryqjdj
=∫
j∈J∗
(
1 − ξexitj
)
ijλ + ξipoj (κ − 1)
(
qj + ijλ)
dj −∫
j∈J∗ξexit
j qjdj +∫
j∈Jentryqjdj.
38

VENTURE CAPITAL, FIRM DYNAMICS, AND ECONOMIC GROWTH Sina T. Ates (UPenn)
B Firm Growth in Data
Table 6: Regression Results, Puri and Zarutskie (2012)
Log(Sales)
VC0.502∗∗∗
(11.03)
VC*TimefromMatch0.211∗∗∗
(11.23)
VC*TimefromMatch2 -0.012∗∗∗
(-8.73)
TimefromMatch0.121∗∗∗
(10.11)
TimefromMatch2 -0.003∗∗∗
(-4.12)
Industry FE Yes
Year FE Yes
N 17,885
R2 0.18
Table 6 summarizes the OLS regression results obtained Puri and Zarutskie (2012) with t-statistics
given in parentheses. The logarithm of sales of matched VC-backed and non-VC-backed samples
is regressed on a number of independent variables and controls. The variable of interest that
captures the effect of VC firms over time is “VC*TimefromMatch”. It is highly significant with a
t-statistics of 11.23.
39

VENTURE CAPITAL, FIRM DYNAMICS, AND ECONOMIC GROWTH Sina T. Ates (UPenn)
C Firm Size Distributions
Figure 5: Firm Size Distributions by Firm Types
(a) Private Firms, decomposed
0 0.5 1 1.5 2 0 0.5 1 1.50
0.5
1
1.5
2
2.5
3
3.5
Normalized quality (firm size)
Sim
ulat
ed d
ensi
ty fu
nctio
n, m
odel
private w/o VCprivate w/ VC
(b) Public Firms, decomposed
0 0.5 1 1.5 2 2.5 3 0
0.2
0.4
0.6
0.8
1
1.2
1.4
Normalized quality (firm size)
Sim
ulat
ed d
ensi
ty fu
nctio
n, m
odel
public, had VCpublic, had no VC
(c) Private vs. Public firms, aggregated
0 0.5 1 1.5 2 2.5 3 0
0.5
1
1.5
2
2.5
3
3.5
Normalized quality (firm size)
Sim
ulat
ed d
ensi
ty fu
nctio
n, m
odel
privatepublic
(d) All firms
0 0.5 1 1.5 2 2.5 3 0
0.2
0.4
0.6
0.8
1
1.2
1.4
1.6
1.8
2
Normalized quality (firm size)
Sim
ulat
ed d
ensi
ty fu
nctio
n, m
odel
all firms
Figure 5(a) illustrates the stationary distributions of VC- and non-VC-backed private firms.
The distribution of VC-backed firms has a larger mass of smaller companies compared to non-
VC-backed counterparts. Although it may look counter-intuitive at first sight, this is a natural
result of three factors.47 First, VC firms select smaller companies to for their higher growth
potential. Second, the increased profit level per unit of quality due to VC’s financial support
helps firms with smaller capacities survive in the business. And third, as demonstrated in Figure
4(b), VC firms go public at smaller sizes as they can afford its cost due to higher profits. This
47Notice that this is a static comparison. The comparison of growth rates in Section 3.4 has already explained thepositive growth impact of VC financing on firms that they invest in.
40

VENTURE CAPITAL, FIRM DYNAMICS, AND ECONOMIC GROWTH Sina T. Ates (UPenn)
implies that companies that are smaller than a relatively lower threshold remain in the VC-backed
distribution.
The lower IPO threshold for VC-backed firms also implies that, every period, smaller firms
enter the distribution of public firms via VC-backed IPOs. Therefore, as shown in Figure 5(b),
the distribution that defines public firms that had VC backing has a thinner tail compared to the
stationary distribution of public firms that never received VC support. Figure 5(c) compares the
stationary distributions of all private and public firms. As expected, the latter has a fatter right
tail because larger firms issue an IPO. Lastly, Figure 5(d) shows the stationary distribution of all
firms in the economy.
41