beyond! - greenlam industries industries... · balance sheet cash flow statement statement ......
TRANSCRIPT

BEYOND!GREENLAM INDUSTRIES LIMITED Annual Report 2016-17
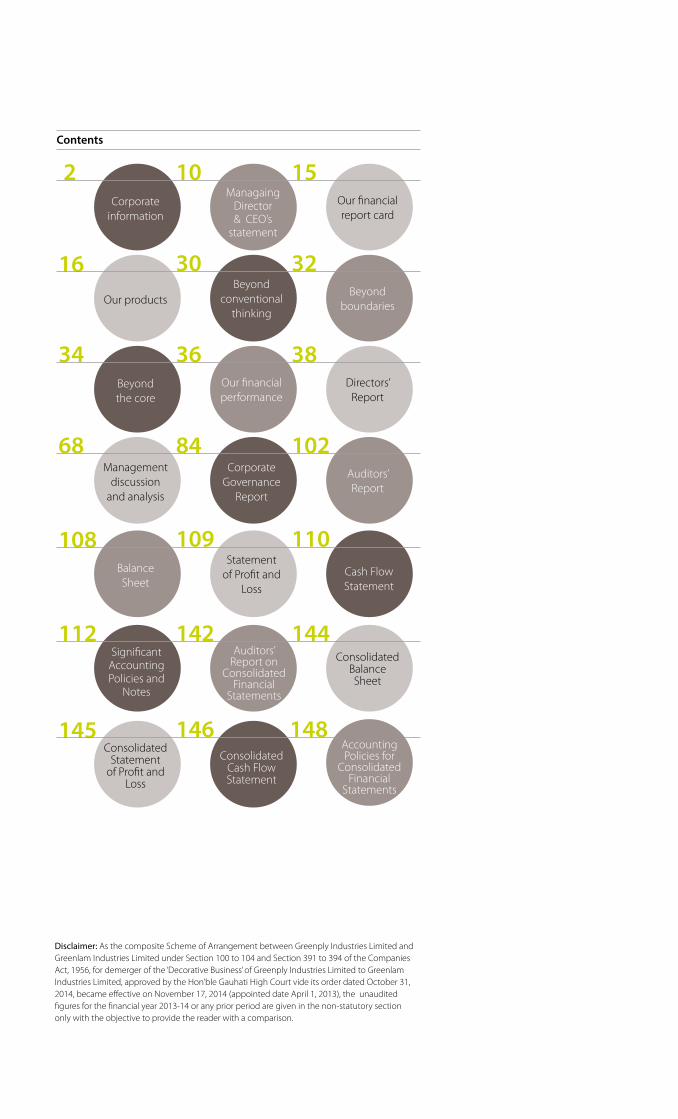
Contents
Corporate information
Our financial report card
Managaing Director & CEO’s
statement
2 10 15
16Our products
Beyond boundaries
Beyond conventional
thinking
30 32
145Consolidated
Statement of Profit and
Loss
Consolidated Cash Flow Statement
146
108Balance Sheet
Cash Flow Statement
Statement of Profit and
Loss
109 110
Beyond the core
Directors’ Report
Our financial performance
34 36 38
Significant Accounting Policies and
Notes
Consolidated Balance Sheet
Auditors’ Report on
Consolidated Financial
Statements
112 142 144
Accounting Policies for
Consolidated Financial
Statements
Management discussion
and analysis
Auditors’ Report
Corporate Governance
Report
68 84 102
Disclaimer: As the composite Scheme of Arrangement between Greenply Industries Limited and Greenlam Industries Limited under Section 100 to 104 and Section 391 to 394 of the Companies Act, 1956, for demerger of the ‘Decorative Business’ of Greenply Industries Limited to Greenlam Industries Limited, approved by the Hon’ble Gauhati High Court vide its order dated October 31, 2014, became effective on November 17, 2014 (appointed date April 1, 2013), the unaudited figures for the financial year 2013-14 or any prior period are given in the non-statutory section only with the objective to provide the reader with a comparison.
148
At Greenlam Industries, the spirit of going beyond is manifested in a culture that is anchored around unconventional thinking. Take a story that best displays this attitude. During the period of demonetisation, when most players focused on loosening their terms of trade channel to tide over the difficult period – we did the opposite! We tightened the credit cycle. The counter-pressure from the trade was enormous. Some questioned that our timing; others anticipated our decision would be reversed. We remained steadfast. We felt that this period would be the most strategic to re-center our terms of trade, which slackened over the years. It is times like these that test a company’s character; eventually, the trade channel accepted this new norm. The result was that during 2016-17, we shrunk our receivables cycle by nine days, enhancing our liquidity. We did not test the limit; we extended beyond.
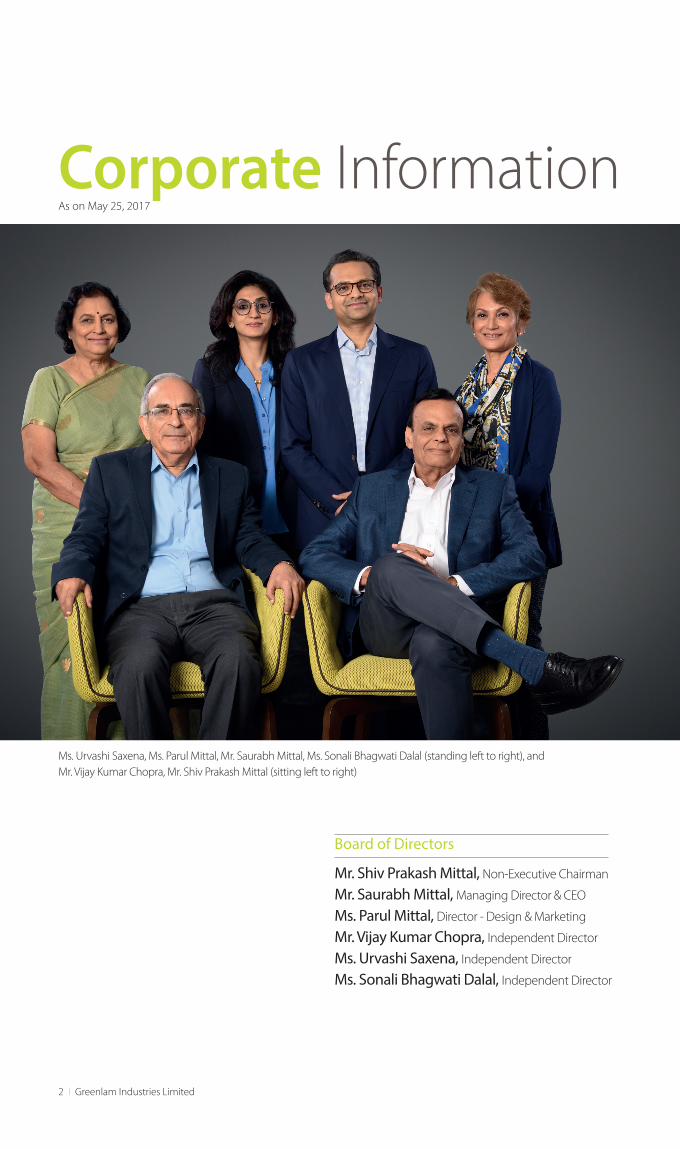
Corporate Information
Mr. Shiv Prakash Mittal, Non-Executive Chairman
Mr. Saurabh Mittal, Managing Director & CEO
Ms. Parul Mittal, Director - Design & Marketing
Mr. Vijay Kumar Chopra, Independent Director
Ms. Urvashi Saxena, Independent Director
Ms. Sonali Bhagwati Dalal, Independent Director
Ms. Urvashi Saxena, Ms. Parul Mittal, Mr. Saurabh Mittal, Ms. Sonali Bhagwati Dalal (standing left to right), and Mr. Vijay Kumar Chopra, Mr. Shiv Prakash Mittal (sitting left to right)
As on May 25, 2017
Board of Directors
2 l Greenlam Industries Limited
Mr. Vijay Kumar Chopra, Chairman
Ms. Urvashi Saxena
Ms. Sonali Bhagwati Dalal
Mr. Saurabh Mittal
Audit Committee
Mr. Saurabh Mittal, Chairman
Mr. Shiv Prakash Mittal
Ms. Parul Mittal
Ms. Sonali Bhagwati Dalal
Corporate Social Responsibility Committee
Mr. Vijay Kumar Chopra, Chairman
Mr. Shiv Prakash Mittal
Ms. Urvashi Saxena
Nomination & Remuneration Committee
Mr. Shiv Prakash Mittal
Mr. Saurabh Mittal
Ms. Parul Mittal
Operational & Finance Committee
IDBI Bank LimitedState Bank of IndiaHDFC Bank LimitedICICI Bank LimitedIDFC Bank LimitedCitibank, NA.Standard Chartered BankThe Hongkong and Shanghai Banking Corporation Limited
Bankers/Financial Institutions
1501-05, Narain Manzil,
23, Barakhamba Road,
New Delhi-110001, India.
Phone No.: +91 11 42791399,
Fax No.: +91 11 42791330
Email:[email protected]
Website: www.greenlamindustries.com
Corporate Office
Mr. Shiv Prakash Mittal, Chairman
Mr. Saurabh Mittal
Stakeholders Relationship Committee
• Behror, Rajasthan
• Nalagarh, Himachal Pradesh
Manufacturing facility
Mr. Ashok Kumar SharmaChief Financial Officer
Mr. Prakash Kumar BiswalCompany Secretary
M/s. D. Dhandaria & Company
Thana Road, P.O. Tinsukia,
Assam -786125
Statutory Auditors
Makum Road, Tinsukia,
Assam - 786 125
CIN: L21016AS2013PLC011624
Registered Office
Link Intime India Private Limited
44, Community Centre, 2nd floor
Naraina Industrial Area, Phase-1
Near PVR Naraina,
New Delhi-110028
Phone No.: +91 11 41410592
Fax No.: +91 11 41410591
Registrar & Share Transfer Agent
Annual Report 2016-17 l 3
Greenlam sold 12.72 mn laminate sheets in 2016-17. Stacked, this pile would scale Burj Khalifa, the world’s tallest building – 15 times over!
4 l Greenlam Industries Limited
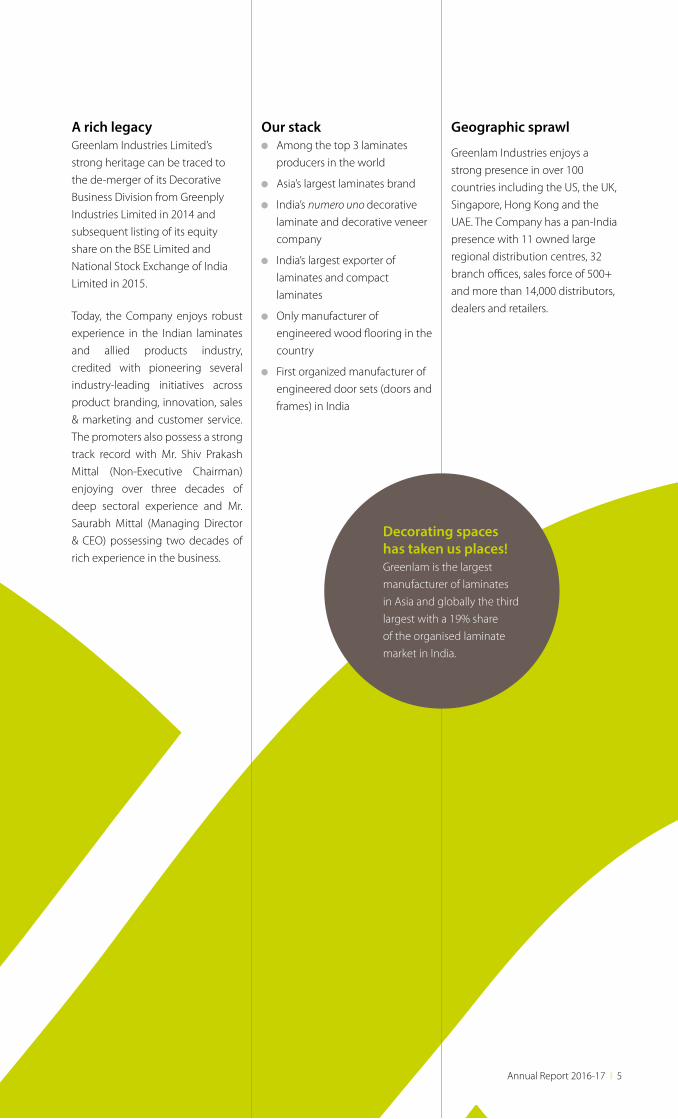
A rich legacy Greenlam Industries Limited’s
strong heritage can be traced to
the de-merger of its Decorative
Business Division from Greenply
Industries Limited in 2014 and
subsequent listing of its equity
share on the BSE Limited and
National Stock Exchange of India
Limited in 2015.
Today, the Company enjoys robust
experience in the Indian laminates
and allied products industry,
credited with pioneering several
industry-leading initiatives across
product branding, innovation, sales
& marketing and customer service.
The promoters also possess a strong
track record with Mr. Shiv Prakash
Mittal (Non-Executive Chairman)
enjoying over three decades of
deep sectoral experience and Mr.
Saurabh Mittal (Managing Director
& CEO) possessing two decades of
rich experience in the business.
Our stack Among the top 3 laminates
producers in the world
Asia’s largest laminates brand
India’s numero uno decorative
laminate and decorative veneer
company
India’s largest exporter of
laminates and compact
laminates
Only manufacturer of
engineered wood flooring in the
country
First organized manufacturer of
engineered door sets (doors and
frames) in India
Geographic sprawl
Greenlam Industries enjoys a
strong presence in over 100
countries including the US, the UK,
Singapore, Hong Kong and the
UAE. The Company has a pan-India
presence with 11 owned large
regional distribution centres, 32
branch offices, sales force of 500+
and more than 14,000 distributors,
dealers and retailers.
Decorating spaces has taken us places!Greenlam is the largest
manufacturer of laminates
in Asia and globally the third
largest with a 19% share
of the organised laminate
market in India.
Annual Report 2016-17 l 5
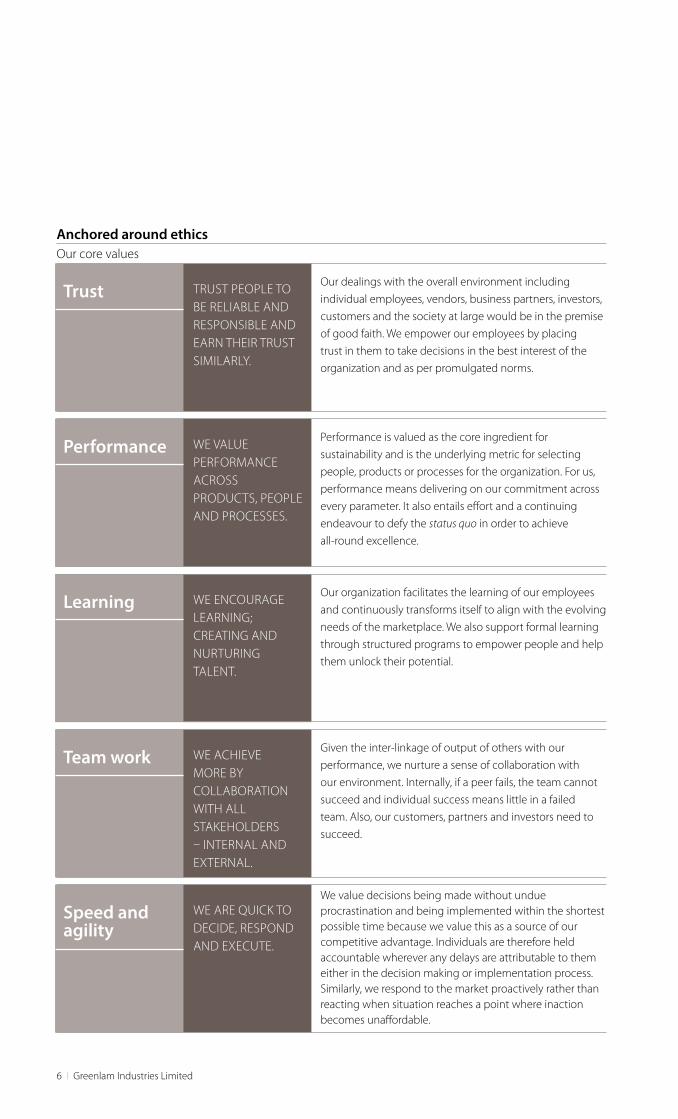
Anchored around ethics Our core values
Our dealings with the overall environment including
individual employees, vendors, business partners, investors,
customers and the society at large would be in the premise
of good faith. We empower our employees by placing
trust in them to take decisions in the best interest of the
organization and as per promulgated norms.
Trust TRUST PEOPLE TO BE RELIABLE AND RESPONSIBLE AND EARN THEIR TRUST SIMILARLY.
Performance is valued as the core ingredient for
sustainability and is the underlying metric for selecting
people, products or processes for the organization. For us,
performance means delivering on our commitment across
every parameter. It also entails effort and a continuing
endeavour to defy the status quo in order to achieve
all-round excellence.
Performance WE VALUE PERFORMANCE ACROSS PRODUCTS, PEOPLE AND PROCESSES.
Our organization facilitates the learning of our employees
and continuously transforms itself to align with the evolving
needs of the marketplace. We also support formal learning
through structured programs to empower people and help
them unlock their potential.
Learning WE ENCOURAGE LEARNING; CREATING AND NURTURING TALENT.
Given the inter-linkage of output of others with our
performance, we nurture a sense of collaboration with
our environment. Internally, if a peer fails, the team cannot
succeed and individual success means little in a failed
team. Also, our customers, partners and investors need to
succeed.
Team work WE ACHIEVE MORE BY COLLABORATION WITH ALL STAKEHOLDERS – INTERNAL AND EXTERNAL.
We value decisions being made without undue procrastination and being implemented within the shortest possible time because we value this as a source of our competitive advantage. Individuals are therefore held accountable wherever any delays are attributable to them either in the decision making or implementation process. Similarly, we respond to the market proactively rather than reacting when situation reaches a point where inaction becomes unaffordable.
Speed and agility
WE ARE QUICK TO DECIDE, RESPOND AND EXECUTE.
6 l Greenlam Industries Limited
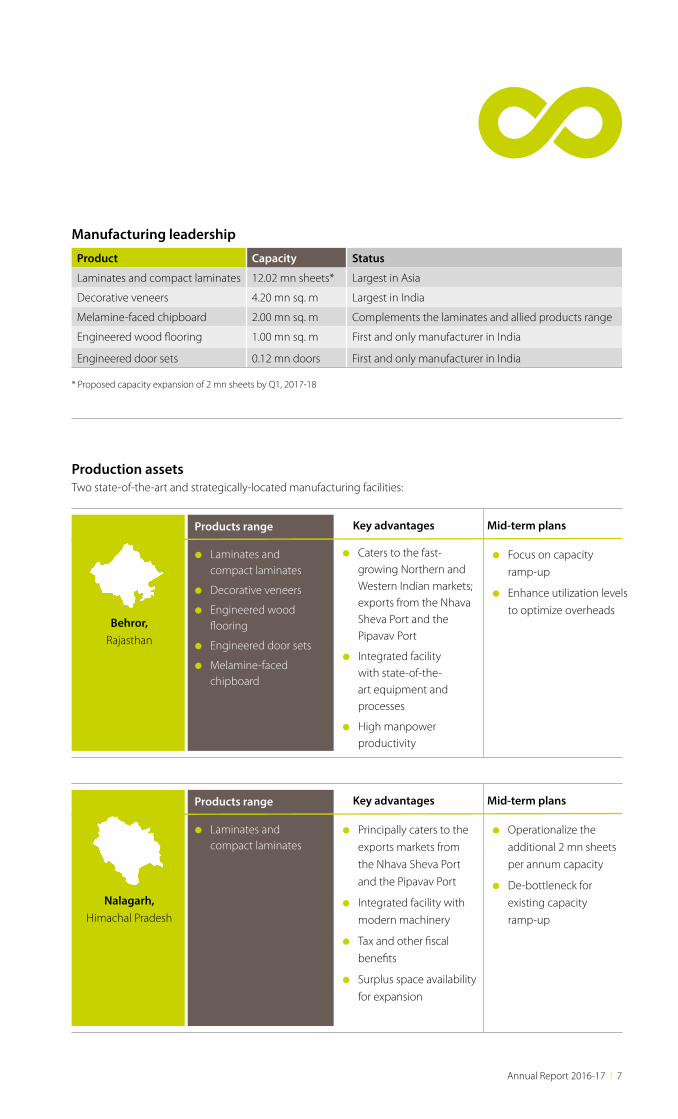
Manufacturing leadership
Production assets Two state-of-the-art and strategically-located manufacturing facilities:
Product Capacity Status
Laminates and compact laminates 12.02 mn sheets* Largest in Asia
Decorative veneers 4.20 mn sq. m Largest in India
Melamine-faced chipboard 2.00 mn sq. m Complements the laminates and allied products range
Engineered wood flooring 1.00 mn sq. m First and only manufacturer in India
Engineered door sets 0.12 mn doors First and only manufacturer in India
* Proposed capacity expansion of 2 mn sheets by Q1, 2017-18
Products range Key advantages
Behror, Rajasthan
Mid-term plans
Laminates and compact laminates
Decorative veneers
Engineered wood flooring
Engineered door sets
Melamine-faced chipboard
Caters to the fast-growing Northern and Western Indian markets; exports from the Nhava Sheva Port and the Pipavav Port
Integrated facility with state-of-the-art equipment and processes
High manpower productivity
Focus on capacity
ramp-up
Enhance utilization levels
to optimize overheads
Products range Key advantages
Nalagarh, Himachal Pradesh
Mid-term plans
Laminates and compact laminates
Principally caters to the
exports markets from
the Nhava Sheva Port
and the Pipavav Port
Integrated facility with
modern machinery
Tax and other fiscal
benefits
Surplus space availability
for expansion
Operationalize the
additional 2 mn sheets
per annum capacity
De-bottleneck for
existing capacity
ramp-up
Annual Report 2016-17 l 7
Greenlam – Laminates Decowood – Premium veneers
Brands portfolio
Greenlam Industries is India’s only integrated and largest manufacturer of
decorative surfacing and wood panel products. Over the time, the Company’s
Greenlam brand has become synonymous with trust and a proven expertise
in laminates that straddles various sizes and price points. The Company’s other
product brands have also been able to carve out their niches with strong retail
and institutional recall.
Key numbers, 2016-17
9.16%Turnover CAGR (past four years)
54.74%Promoters’
holding, March 31, 2017
6.78%FII/FPI holding, March 31, 2017
1,700+Team size,
March 31, 2017
14,000+Trade partner
network, March 31, 2017
1,588.17 Market capitalization,
March 31, 2017 (H in crore) (based on
NSE closing price)
8 l Greenlam Industries Limited
Mikasa – Real wood floors Mikasa – Doors and frames
Green credentials
First to receive the prestigious ‘Green Guard’ certification in
India
Certified by world’s
leading forest certification organisation
Member of Indian Green
Building Council
First Indian brand to be certified by
Green Label, Singapore
First Indian Brand to trade in FSC® chain
of Custody Certification
Annual Report 2016-17 l 9
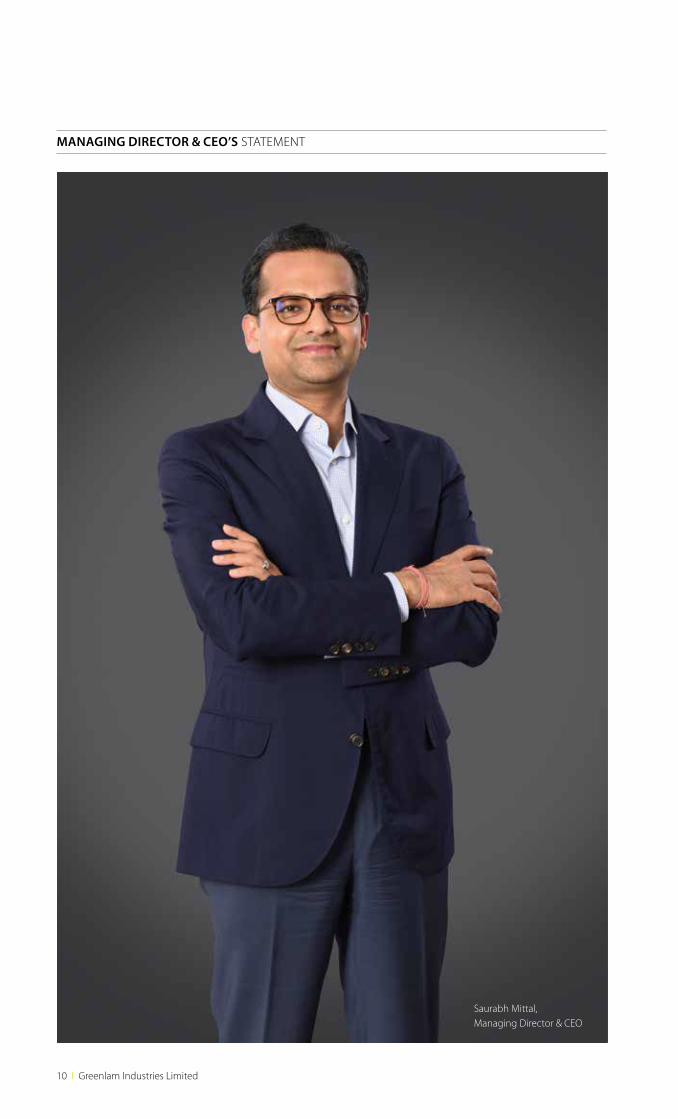
MANAGING DIRECTOR & CEO’S STATEMENT
Saurabh Mittal,Managing Director & CEO
10 l Greenlam Industries Limited
If there were two words that faithfully encapsulated the year 2016-17, they would be ‘disruptive unpredictability.’
If there was one reality that enabled us to counter disruptive unpredictability, it would be the spirit of ‘beyond’.
The year was marked by a number of unexpected developments comprising one of the biggest
upsets in US electoral history, Britain voting to exit the European Union and the largest currency demonetisation attempted in the history of humankind.
For a company that markets 43.9% of its consolidated revenues outside India, the year under review should hypothetically have been devastating. The reality is that Greenlam reported a 4.5% growth
in revenues and 32.1% in profit after tax (at consolidated level). The ability of the Companyto report profitable growth in a challenging year represents its spirit of ‘beyond’ – the ability to extend beyond the usual, commitment to enhance value beyond the ordinary and a focus to extend the impact of our performance from the immediate to the sustainable.
The spirit of ‘beyond’
At Greenlam Industries, we have always believed that sustainable success is derived from the ability to look, plan and implement beyond the immediate.
Over the years, this was reflected in our ability to invest in manufacturing facilities for the future, build more capacity than would be immediately needed, invest in the ability to scale capacity with speed by investing in additional infrastructure and completing the product mix in preparation for the markets of the future.
A number of people questioned
this approach on the grounds that during the aggressive phase of capacity building, such an approach would not be value-accretive, that quarterly earnings would be affected and there could be a gestation between investment and returns. We believed that this would be the case in the short time during the phase of gestation; we also believed that when demand strengthened and our capacities were better utilized, the pass-through of increased revenues to RoCE would be quicker.
I am pleased to report that our performance in 2016-17 reflected
precisely this conviction. We reported an increase in margins and overall business viability in the face of only a modest increase in revenues, which only validates the robustness of our business model to be able to scale margins as our capacity utilisation increases and revenues strengthen.
The big message that I wish to communicate is that we demonstrated the strength of our business model through the laboratory of last year’s challenging business environment; as business conditions strengthen, we expect to do even better.
New directional initiatives
“Our ability to report profitable growth in a challenging year represents our spirit of ‘beyond’ – the ability to extend beyond the usual, commitment to enhance value beyond the ordinary and focus to extend the impact of our performance from the immediate to the sustainable.”
Annual Report 2016-17 l 11
At the heart of our company’s out-
performance in a challenging year
was our prudent capital allocation.
As I indicated earlier, we had
consistently emphasized that we
preferred to be fully invested across
interior infrastructure products
at the outset, which would
translate into an upturn in the
demand of our products as soon
as economic realities improved.
The result was that we started with
low percentage asset utilisation;
however, we were convinced that
as we consumed our extensive
operating leverage with no
corresponding increase in capital
investments, we would report
improved profitability.
I am pleased to report that this
is the very reality that transpired
during the year under review.
As we strengthened offtake that
increased our capacity utilisation,
we strengthened our consolidated
ROCE: from 14.8% in 2015-16 to
19.1% in 2016-17; correspondingly,
our consolidated ROE grew from
15.4% in the previous year to 17.1%
in 2016-17.
At Greenlam, we believe that the heart of a successful company lies in its working capital efficiency. As business conditions became increasingly challenging, Greenlam continued to emphasise the importance of liquidity with the objective to generate enhanced surpluses through increased operating efficiencies.
One of the most courageous initiatives that we embarked upon was in selecting to counter demonetization through a resetting of our receivables cycle. Normally during a period of sectoral slowdown and cash crunch (as we saw during the demonetisation), it would have been reasonable to extend the debtors’ cycle. During the year under review, we did just the reverse: we tightened our credit period and called our money in faster. The result is that our consolidated debtors’ cycle declined from 65 days of turnover equivalent in 2015-16 to 49 days in 2016-17. I am pleased to report that this, among other decisions, kick-started a stronger virtuous cycle: enhanced liquidity,
declining interest costs and a stronger Balance Sheet. Besides, we strengthened our inventory management of finished products; our consolidated inventory-to-turnover days declined from 88 days in 2105-16 to 77 days in 2016-17. Our stronger working capital management sent a serious signal of our trade discipline to the market while we reinvested in products, capacities and brand to help our dealer-partners sell quicker and higher.
We reinforced our Consolidated
Balance Sheet through debt
optimization (that reduced by 38%
to H225 crore as on 31 March 2017)
and through an increased plough-
back into our reserves (by H46 crore
in 2016-17 to a cumulative H279
crore), thereby creating a stronger
financial pool. On the Consolidated
P&L front, our interest cost
optimized by 12% to H28 crore in
2016-17 with a strong profitability
implication even as our net profit
margins rose 90 bps to 4.6% during
the year under report. This cycle – with greater benefits – is expected
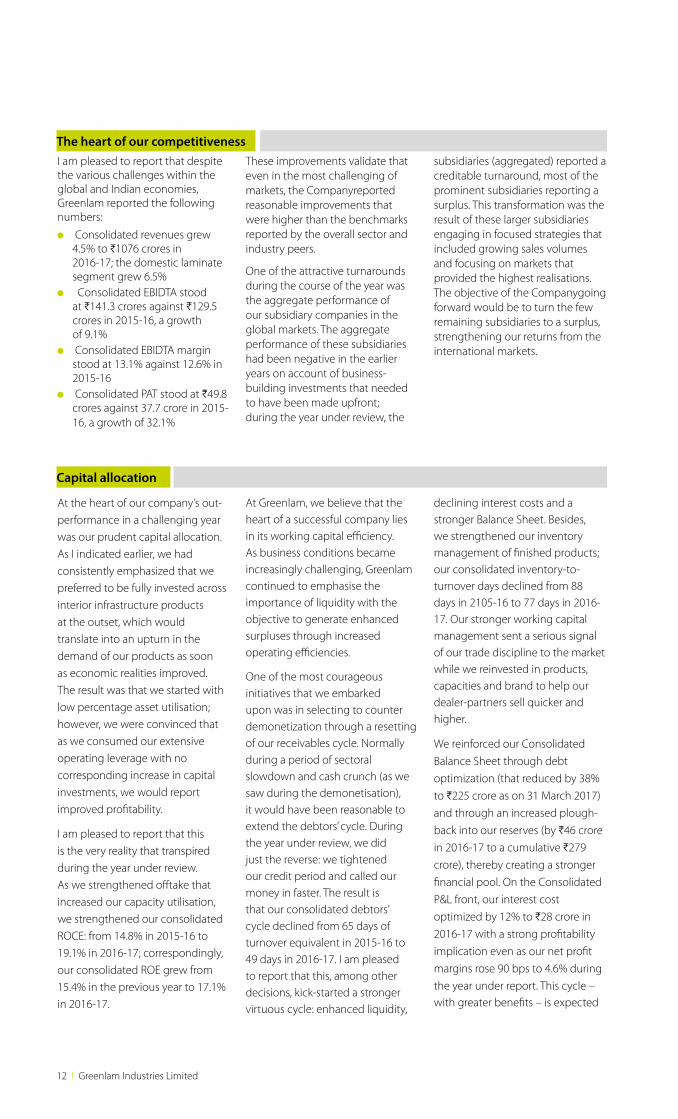
Capital allocation
I am pleased to report that despite the various challenges within the global and Indian economies, Greenlam reported the following numbers:
Consolidated revenues grew 4.5% to H1076 crores in 2016-17; the domestic laminate segment grew 6.5%
Consolidated EBIDTA stood at H141.3 crores against H129.5 crores in 2015-16, a growth of 9.1%
Consolidated EBIDTA margin stood at 13.1% against 12.6% in 2015-16
Consolidated PAT stood at H49.8 crores against 37.7 crore in 2015-16, a growth of 32.1%
These improvements validate that even in the most challenging of markets, the Companyreported reasonable improvements that were higher than the benchmarks reported by the overall sector and industry peers.
One of the attractive turnarounds during the course of the year was the aggregate performance of our subsidiary companies in the global markets. The aggregate performance of these subsidiaries had been negative in the earlier years on account of business-building investments that needed to have been made upfront; during the year under review, the
subsidiaries (aggregated) reported a creditable turnaround, most of the prominent subsidiaries reporting a surplus. This transformation was the result of these larger subsidiaries engaging in focused strategies that included growing sales volumes and focusing on markets that provided the highest realisations. The objective of the Companygoing forward would be to turn the few remaining subsidiaries to a surplus, strengthening our returns from the international markets.
The heart of our competitiveness
12 l Greenlam Industries Limited
to play out further over the years.
The fact that we could liquidate our debt faster than we could add to our reserves indicates that we are progressing to creating a stronger and smaller Balance Sheet against a larger revenue base – an ideal value-accretive business.
At Greenlam, we consistently invested in our marketing and branding platforms; we now enjoy a 360-degree market approach through the print, digital, events and activations, exhibitions, PR and brand stores. With almost 26 engaging and interactive websites that help our customers/influencers seamlessly make a purchase decision, we opened a low-cost and high-visibility omni-channel sales architecture (including Facebook and Twitter)
I am pleased to report that we could leverage gains made in the Profit & Loss account to strengthen our Balance Sheet. During the year under review, we reinvested the resources we liberated from the business to invest in our laminates capacity expansion at Nalagarh. Our 2 mn sheet lines at Nalagarh (which will be brought on-stream in the first quarter of 2017-18), was set up at a capex of about H28 crore,
which is inexpensive by about 30% compared with a similar greenfield facility. We believe that this expansion will capitalise on pent-up demand and a pick-up in real estate offtake following the introduction of the landmark the Real Estate (Regulation and Development) Act, 2016 (RERA). Besides, our complement of 13 international offices and six overseas subsidiaries with 100+ overseas employees will help catalyse our global offtake.
Our engineered wood floorings
and engineered doors businesses
reported steady growth in 2016-
17. These product categories are
maturing and could enhance
profitability going forward. Besides,
thanks to our positioning as India’s
only and largest manufacturer of
engineered wooden flooring and
engineered doors and frames,
strong import replacement
opportunity (for engineered
wooden flooring), growing inroads
into institutional sales (engineered
door sets), rising brand credibility
and high-quality technology
invested in product manufacture
could enable us to generate
increased revenues .
OUR CORE STRENGTHS
STRONG AND PROTECTED BRAND PRESENCE IN INDIA AND OVER 100 COUNTRIES
PAN-INDIA DISTRIBUTION NETWORK WITH 11 OWNED LARGE REGIONAL DISTRIBUTION CENTRES, 32 BRANCH OFFICES, SALES STAFF STRENGTH OF MORE THAN 500 AND MORE THAN 14,000 DISTRIBUTORS, DEALERS AND RETAILERS
STRATEGICALLY-LOCATED PLANTS IN RAJASTHAN AND HIMACHAL PRADESH ENSURING ACCESS TO RESOURCES AND MARKETS OFFERING FISCAL AND EXPANSION BENEFITS
YOUNG, MOTIVATED AND PROFESSIONALIZED TEAMS
STRONG MARKETING AND BRAND INITIATIVES UNDERTAKEN THROUGH VARIOUS SOCIAL MEDIA PLATFORMS ENSURING STRONG CUSTOMER ENGAGEMENT
AT GREENLAM INDUSTRIES, WE HAVE ALWAYS BELIEVED THAT SUSTAINABLE SUCCESS IS DERIVED FROM THE ABILITY TO LOOK, PLAN AND IMPLEMENT BEYOND THE IMMEDIATE.
Annual Report 2016-17 l 13
Proactive and prepared
A special case in point in terms of our readiness is our ability to capture demand without any significant capex. Our 2 mn sheets of additional laminates capacity represents almost 17% of our pre-expansion capacity of 12.02 mn sheets. Besides, an operating leverage of 33% of pre-expansion capacity within the existing infrastructure gives us a leverage of 50% incremental capacity that can be made use of.
On the international front, the global laminates market is represented by a size of US$7 billion, which is growing by 2-3% every year. With Greenlam’s presence in 100+ countries and an exports growth at a substantial 15% CAGR over the past five years, there exists a good opportunity in consolidating and improving depth in our existing markets, both in terms of volume and value, going forward.
I hope you, our shareholder, continue to stay invested in our story, which is really the story of a transforming consumption-driven industry and our deeply-entrenched positioning within.
With my best wishes,
Saurabh Mittal Managing Director & CEO
Building for the future
During FY2016-17, the Companyaddressed unforeseen challenges like the demonetization-induced cash crunch and stricter enforcement of the Real Estate (Regulation and Development) Act, 2016 that staggered apartments launches leading to a slower offtake of interior infrastructure products.
We believe that the biggest game-changer is something that will transpire during the course of the current financial year. After considerable opposition, the Goods and Services Tax (GST) Act was launched in July 2017. This has marked the biggest tax reform in Indian history, potentially bringing all indirect taxes under a uniform tax structure. This, coupled with
the government’s decision to demonetize high value currency notes, are seen as bold reforms expected to reset the economy towards a higher growth trajectory with several structural long-term benefits. The implementation of the Goods and Services Tax is expected to benefit our Company at two levels: a seamless flow of products from one state to another; a narrowing of the differential between organized and unorganized products will make our brands more competitive, providing them with a platform for sustainable and profitable growth across the foreseeable future.
Our prospects appear to be strong and protected, driven by the government’s policy initiatives. For
one, RERA will lead to increasing consolidation and strengthening of the real estate sector. Swachh Bharat and Smart Cities programs will prove positive for us. The Pradhan Mantri Avas Yojana (PMAY) is an ambitious initiative by the government to build over 2 crore affordable houses by 2022, largely addressing the needs of low income groups and economically weaker sections. We believe that over time, this increased housing stock will translate into a growing offtake of our products. We also believe that the Smart City programme will open up large opportunities to market our products, a reality for which we are attractively prepared through brand visibility, distribution spread and capacity growth.
AFTER CONSIDERABLE OPPOSITION, THE GOODS AND SERVICES TAX (GST) ACT WAS LAUNCHED IN JULY 2017. THIS HAS MARKED THE BIGGEST TAX REFORM IN INDIAN HISTORY, POTENTIALLY BRINGING ALL INDIRECT TAXES UNDER A UNIFORM TAX STRUCTURE.
14 l Greenlam Industries Limited
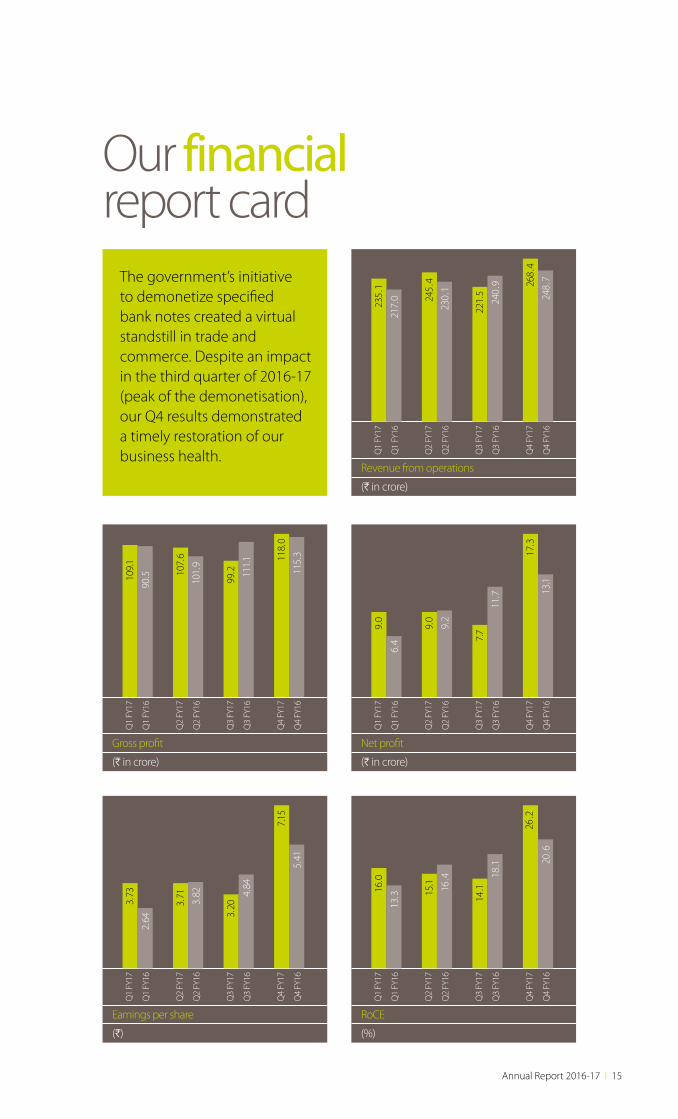
The government’s initiative to demonetize specified bank notes created a virtual standstill in trade and commerce. Despite an impact in the third quarter of 2016-17 (peak of the demonetisation), our Q4 results demonstrated a timely restoration of our business health.
Our financial report card
Revenue from operations
(H in crore)
Q1
FY17
Q1
FY16
217.
0
235.
1
Q2
FY17
Q2
FY16
230.
1
245.
4
Q3
FY17
Q3
FY16
240.
9
221.
5
Q4
FY17
Q4
FY16
248.
7268.
4
Gross profit
(H in crore)
Q1
FY17
Q1
FY16
90.510
9.1
Q2
FY17
Q2
FY16
101.
9
107.
6
Q3
FY17
Q3
FY16
111.
1
99.2
Q4
FY17
Q4
FY16
115.
3118.
0
RoCE
(%)
Q1
FY17
Q1
FY16
13.3
16.0
Q2
FY17
Q2
FY16
16.4
15.1
Q3
FY17
Q3
FY16
18.1
14.1
Q4
FY17
Q4
FY16
20.6
26.2
Earnings per share
(H)
Q1
FY17
Q1
FY16
2.64
3.73
Q2
FY17
Q2
FY16
3.82
3.71
Q3
FY17
Q3
FY16
4.84
3.20
Q4
FY17
Q4
FY16
5.41
7.15
Net profit
(H in crore)
Q1
FY17
Q1
FY16
6.4
9.0
Q2
FY17
Q2
FY16
9.2
9.0
Q3
FY17
Q3
FY16
11.7
7.7
Q4
FY17
Q4
FY16
13.1
17.3
Annual Report 2016-17 l 15
productsOur
16 l Greenlam Industries Limited

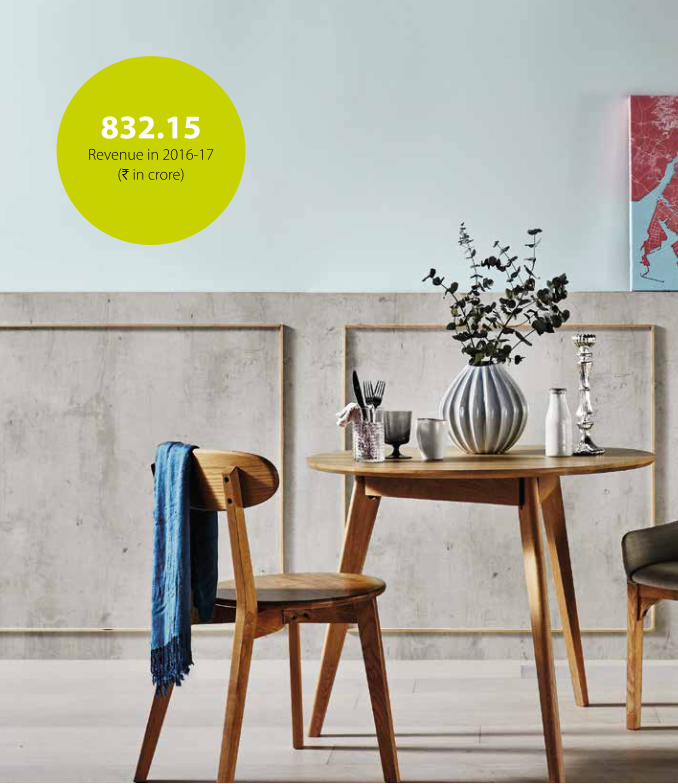
832.15Revenue in 2016-17
(H in crore)
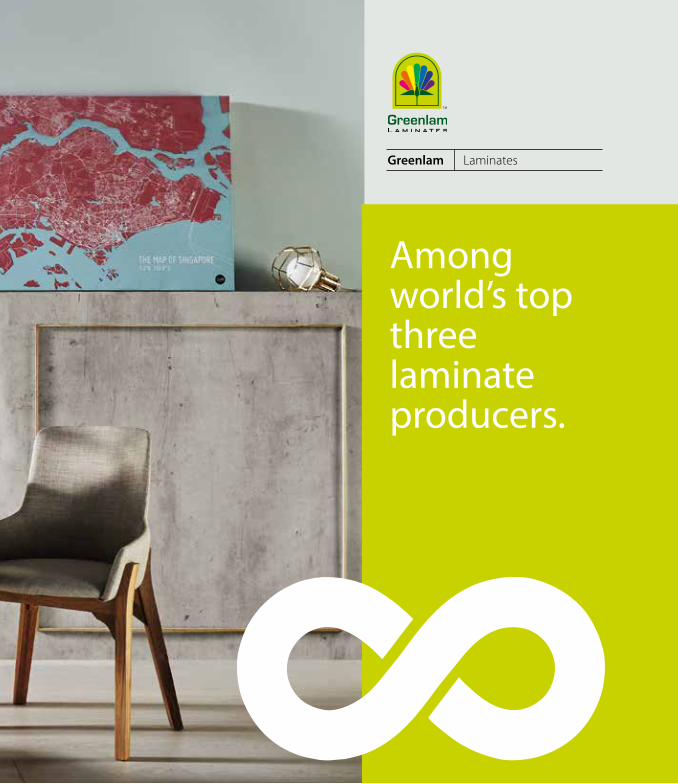
Greenlam Laminates
Among world’s top three laminate producers.
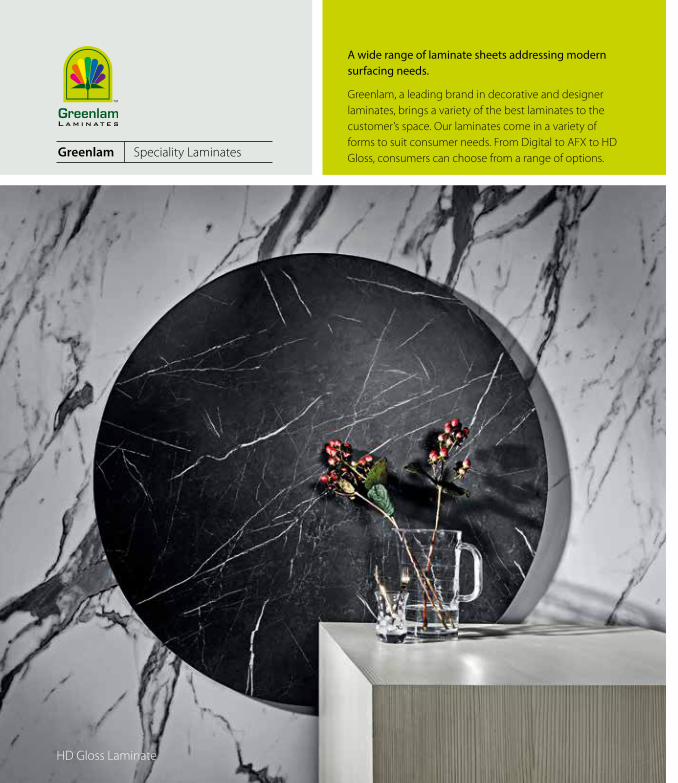
Greenlam Speciality Laminates
A wide range of laminate sheets addressing modern surfacing needs.
Greenlam, a leading brand in decorative and designer laminates, brings a variety of the best laminates to the customer’s space. Our laminates come in a variety of forms to suit consumer needs. From Digital to AFX to HD Gloss, consumers can choose from a range of options.
HD Gloss Laminate
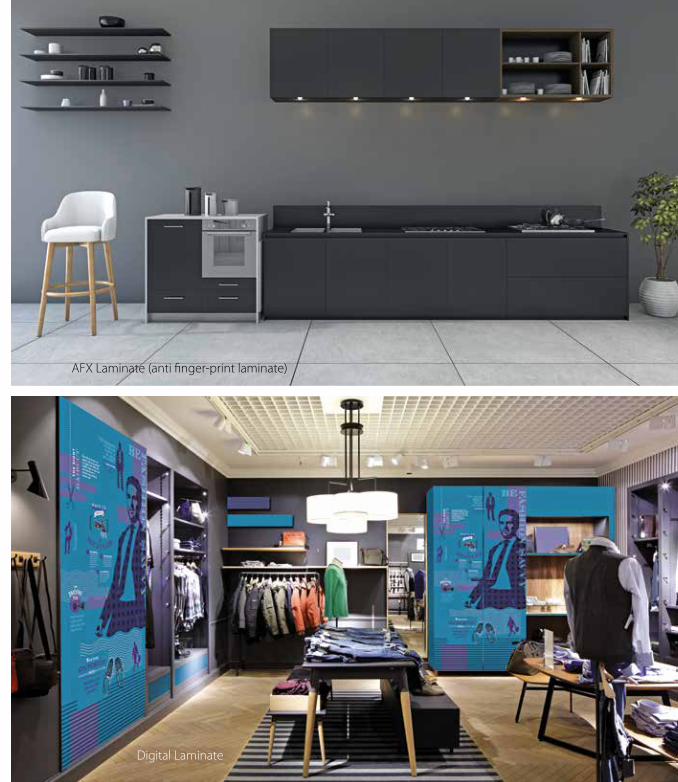
Digital Laminate
AFX Laminate (anti finger-print laminate)
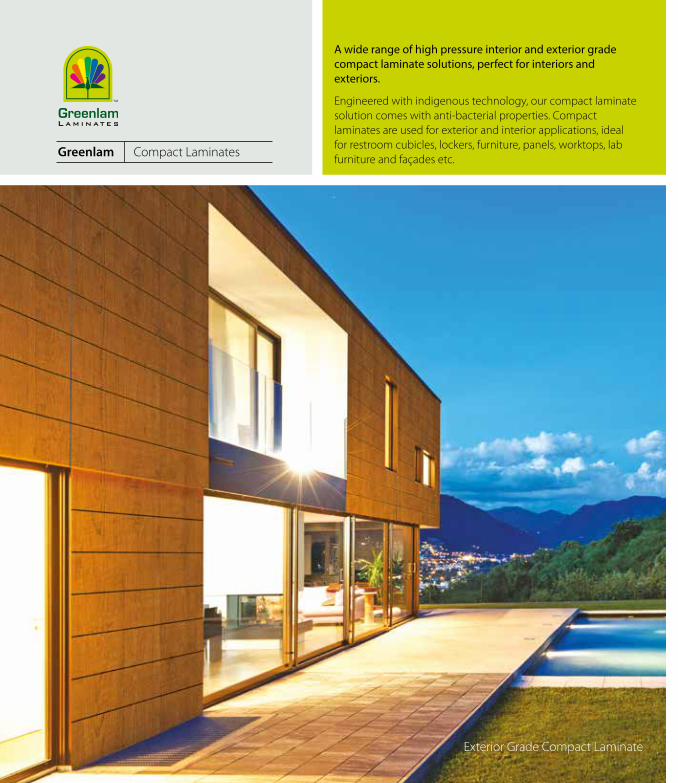
Exterior Grade Compact Laminate
Greenlam Compact Laminates
A wide range of high pressure interior and exterior grade compact laminate solutions, perfect for interiors and exteriors.
Engineered with indigenous technology, our compact laminate solution comes with anti-bacterial properties. Compact laminates are used for exterior and interior applications, ideal for restroom cubicles, lockers, furniture, panels, worktops, lab furniture and façades etc.
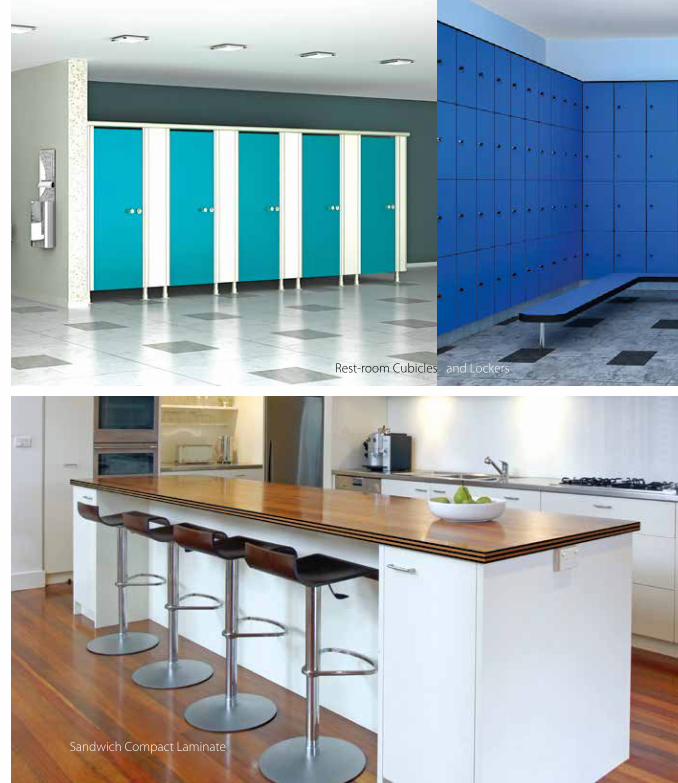
Exterior Grade Compact Laminate Sandwich Compact Laminate
Rest-room Cubicles and Lockers

107.96Revenue in 2016-17
(H in crore)
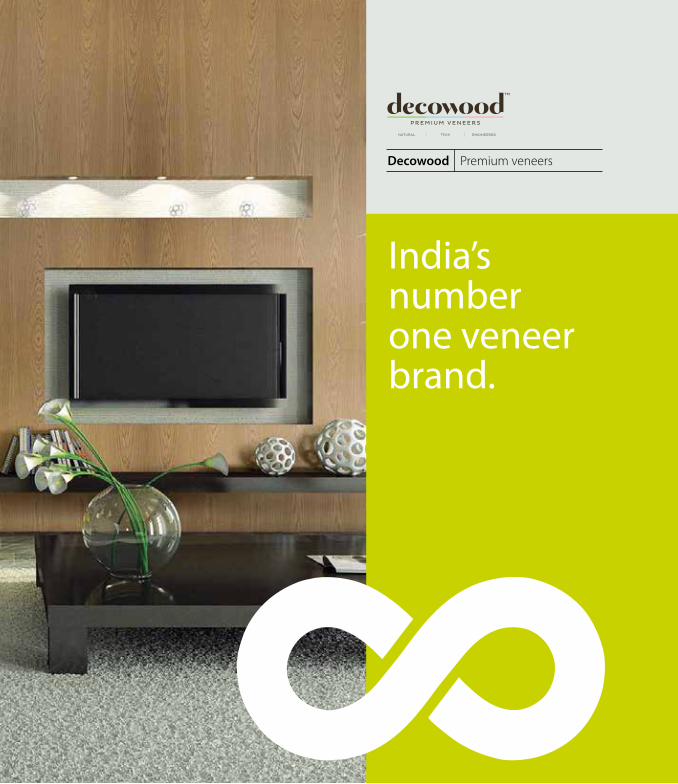
Decowood Premium veneers
India’s number one veneer brand.
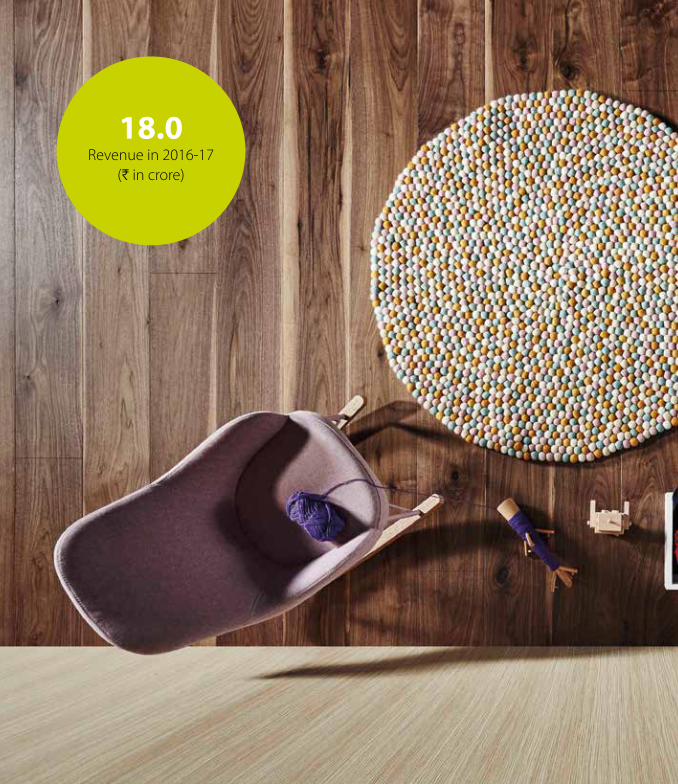
18.0Revenue in 2016-17
(H in crore)

Mikasa Real wood floors
India’s only manufacturer of engineered wood flooring.
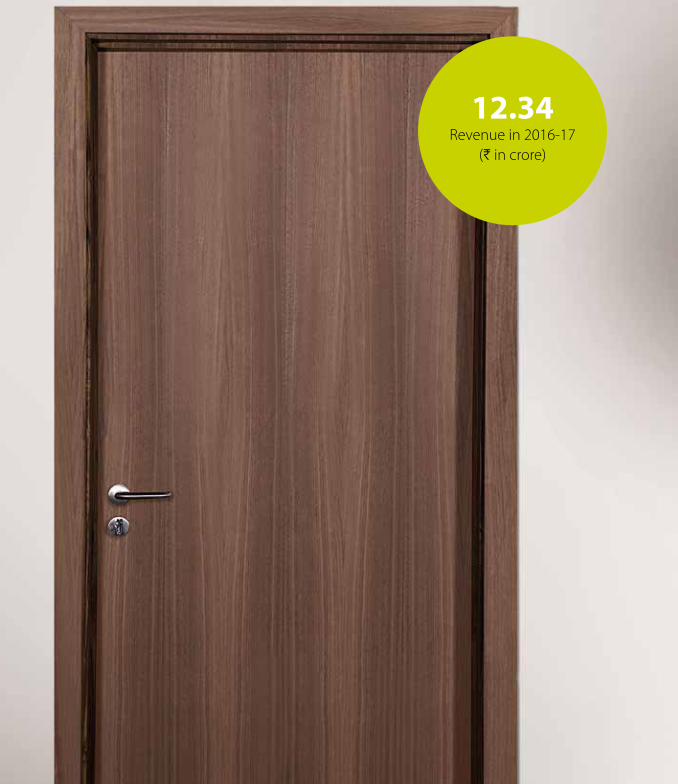
12.34Revenue in 2016-17
(H in crore)

Mikasa Doors and frames
India’s first organized manufacturer of engineered door sets.
Annual Report 2016-17 l 29
BEYONDCONVENTIONAL THINKING!
30 l Greenlam Industries Limited
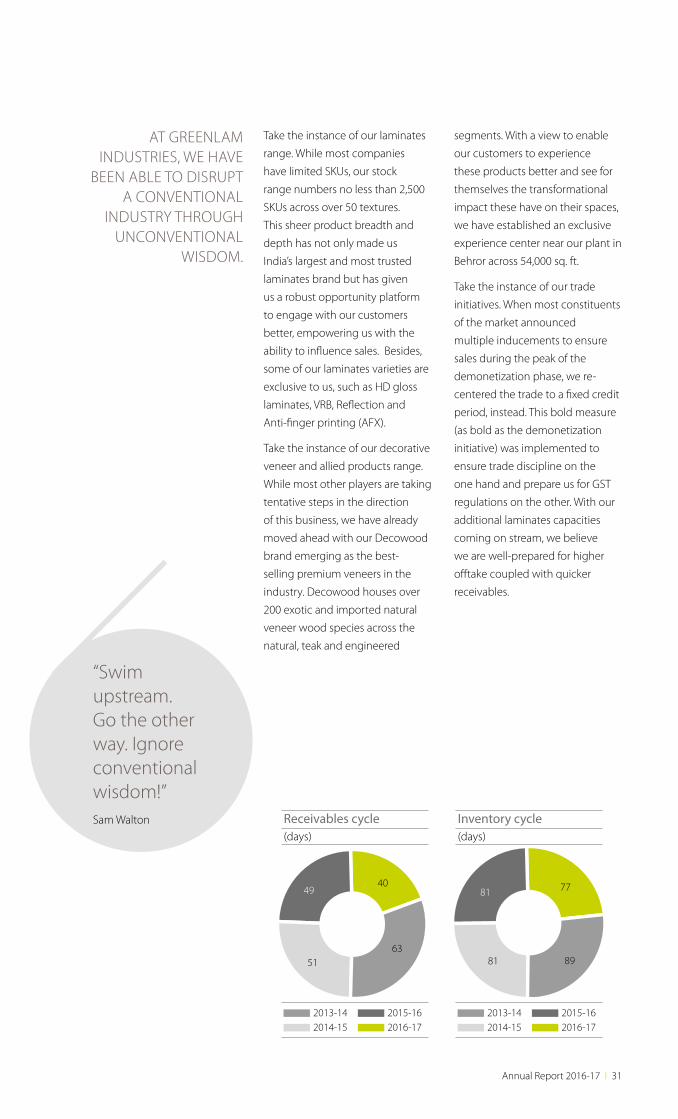
8981
81 77
Take the instance of our laminates
range. While most companies
have limited SKUs, our stock
range numbers no less than 2,500
SKUs across over 50 textures.
This sheer product breadth and
depth has not only made us
India’s largest and most trusted
laminates brand but has given
us a robust opportunity platform
to engage with our customers
better, empowering us with the
ability to influence sales. Besides,
some of our laminates varieties are
exclusive to us, such as HD gloss
laminates, VRB, Reflection and
Anti-finger printing (AFX).
Take the instance of our decorative
veneer and allied products range.
While most other players are taking
tentative steps in the direction
of this business, we have already
moved ahead with our Decowood
brand emerging as the best-
selling premium veneers in the
industry. Decowood houses over
200 exotic and imported natural
veneer wood species across the
natural, teak and engineered
segments. With a view to enable
our customers to experience
these products better and see for
themselves the transformational
impact these have on their spaces,
we have established an exclusive
experience center near our plant in
Behror across 54,000 sq. ft.
Take the instance of our trade
initiatives. When most constituents
of the market announced
multiple inducements to ensure
sales during the peak of the
demonetization phase, we re-
centered the trade to a fixed credit
period, instead. This bold measure
(as bold as the demonetization
initiative) was implemented to
ensure trade discipline on the
one hand and prepare us for GST
regulations on the other. With our
additional laminates capacities
coming on stream, we believe
we are well-prepared for higher
offtake coupled with quicker
receivables.
AT GREENLAM INDUSTRIES, WE HAVE
BEEN ABLE TO DISRUPT A CONVENTIONAL
INDUSTRY THROUGH UNCONVENTIONAL
WISDOM.
“Swim upstream. Go the other way. Ignore conventional wisdom!”Sam Walton Receivables cycle
(days)
2013-14 2015-162014-15 2016-17
6351
4940
Inventory cycle (days)
2013-14 2015-162014-15 2016-17
Annual Report 2016-17 l 31
BEYONDBOUNDARIES!
32 l Greenlam Industries Limited
Our global ambitions are best
manifest in the fact that we are
among the world’s top 3 laminates
producers, Asia’s largest laminates
brand and India’s largest exporter
of laminates and compact
laminates. With a 100+ countries
exports presence, Greenlam
laminates are available in almost all
major continents including North
America, South America, Africa,
Europe, Asia and Australia. Our
international business is executed
through six overseas subsidiaries,
13 international offices and over
100 overseas employees.
Going forward, the Company is
primed for enhancing laminates
exports, considering capacity
leverage on the one hand and the
fact that 2 mn sheets per annum
capacity will come on stream at
Nalagarh during the first quarter of
2016-17. Besides, the international
laminates industry, valued at about
US$7 billion, is well-positioned to
clock better growth, rising from
the existing 2-3%. This acceleration
is estimated to be primarily a result
of a growing demand for ready-to-
assemble (RTA) furniture. Moreover,
conducive macroeconomic factors
like cost-performance benefits,
increased market penetration
and brightening prospects in the
e-commerce space bode well for
the sector.
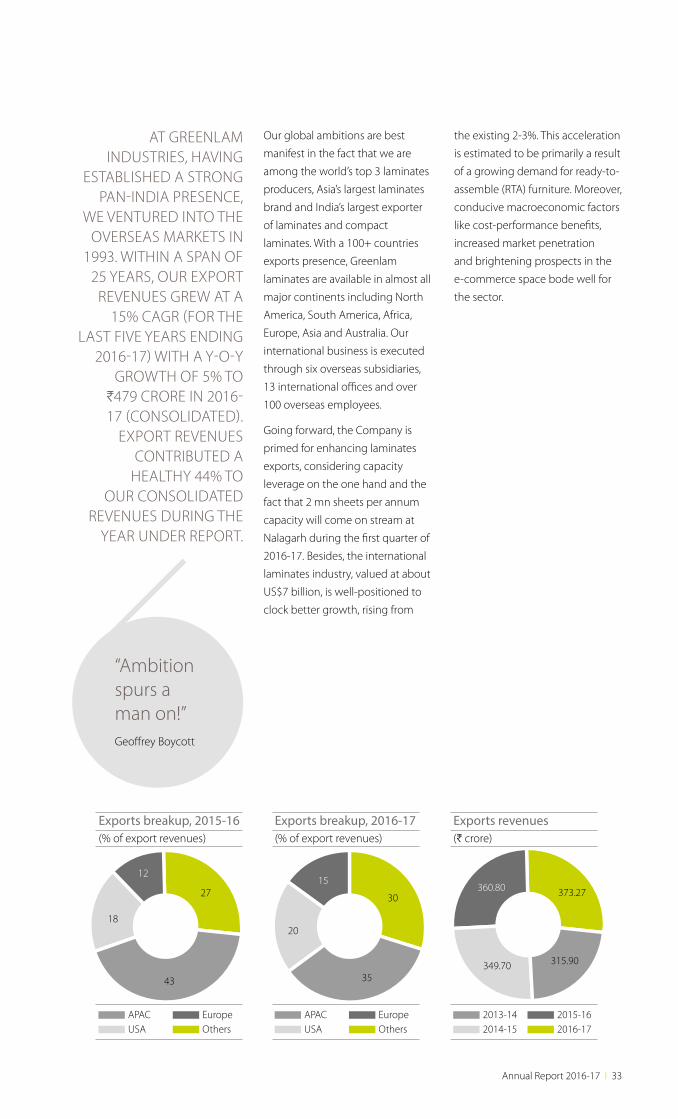
AT GREENLAM INDUSTRIES, HAVING
ESTABLISHED A STRONG PAN-INDIA PRESENCE,
WE VENTURED INTO THE OVERSEAS MARKETS IN
1993. WITHIN A SPAN OF 25 YEARS, OUR EXPORT
REVENUES GREW AT A 15% CAGR (FOR THE
LAST FIVE YEARS ENDING 2016-17) WITH A Y-O-Y
GROWTH OF 5% TO H479 CRORE IN 2016-17 (CONSOLIDATED).
EXPORT REVENUES CONTRIBUTED A
HEALTHY 44% TO OUR CONSOLIDATED
REVENUES DURING THE YEAR UNDER REPORT.
“Ambition spurs a man on!”Geoffrey Boycott
315.90349.70
360.80 373.27
35
20
15
30
43
18
12
27
Exports breakup, 2015-16 (% of export revenues)
APAC Europe USA Others
Exports breakup, 2016-17 (% of export revenues)
APAC Europe USA Others
Exports revenues (H crore)
2013-14 2015-162014-15 2016-17
Annual Report 2016-17 l 33
BEYONDTHE CORE!
34 l Greenlam Industries Limited
Our core branding capability is
evident in ‘Mikasa’ emerging as
the first and only Indian brand of
engineered wood floorings. With
the highest industry range of as
many as 111 SKUs, Mikasa wood
flooring is manufactured with
the latest European technology
with raw materials (including
hardwood) imported from the
best global sources. Convenient
to install and durable in use,
our quality confidence in these
products stems from a 30-year
warranty support. On the demand
front, Mikasa is strongly placed,
considering the size of the market
pegged at 2 mn sq. m annually
and growing at 20-25% every
year. With no other domestic
manufacturer and a majority of
the demand met from imports,
we will play a strong role in import
substitution, especially with our
B2B outreach, increasing retail
footprint through exclusive retail
display centers and enhancing
reach within the designer/architect
communities.
Our Mikasa range of engineered
doors and frames makes us the
first organized Company to launch
engineered, factory-finished door
solutions in the country. With a
capacity of 120,000 door units per
annum, this range is integrated
with the existing decorative
veneer and engineered wood
flooring categories, thereby
generating greater synergies and
complementing our broader
product range. Our door range
also conforms with the fire rating
of FD30 and FD60, which opens
up a vast range of applications
in the hospitality, healthcare,
retail and high-end residential
markets. Besides, we offer
options of laminated, veneered
or painted doors and frames. It
must be mentioned that the door
(including flush door) market is
estimated at 24 million units per
annum; the engineered finished
door category is witnessing
a substantial 20-25% growth
every year. With no organized
player in the industry providing
comprehensive door solutions
coupled with the advantage of
our extensive B2B and influencer
outreach programs and tie-ups
with real estate developers,
prospects are brightening for this
business, going forward.
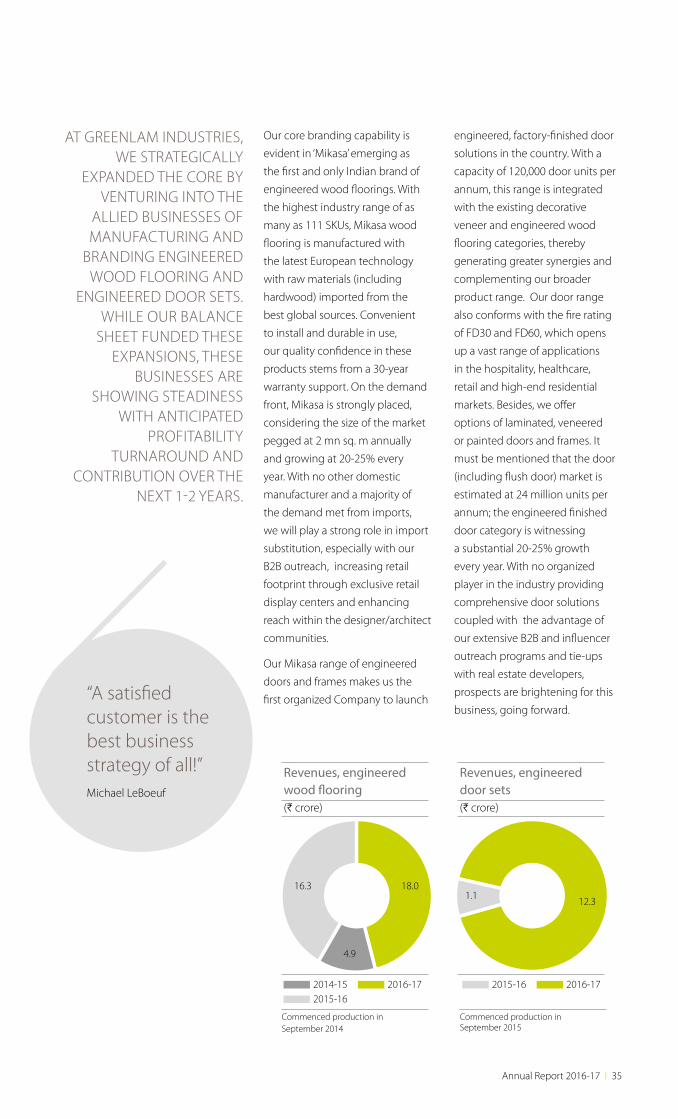
AT GREENLAM INDUSTRIES, WE STRATEGICALLY
EXPANDED THE CORE BY VENTURING INTO THE
ALLIED BUSINESSES OF MANUFACTURING AND
BRANDING ENGINEERED WOOD FLOORING AND
ENGINEERED DOOR SETS. WHILE OUR BALANCE
SHEET FUNDED THESE EXPANSIONS, THESE
BUSINESSES ARE SHOWING STEADINESS
WITH ANTICIPATED PROFITABILITY
TURNAROUND AND CONTRIBUTION OVER THE
NEXT 1-2 YEARS.
“A satisfied customer is the best business strategy of all!”Michael LeBoeuf
16.3 18.0
4.9
Revenues, engineered wood flooring (H crore)
2014-15 2016-172015-16
Commenced production in September 2014
1.112.3
Revenues, engineered door sets (H crore)
2015-16 2016-17
Commenced production in September 2015
Annual Report 2016-17 l 35
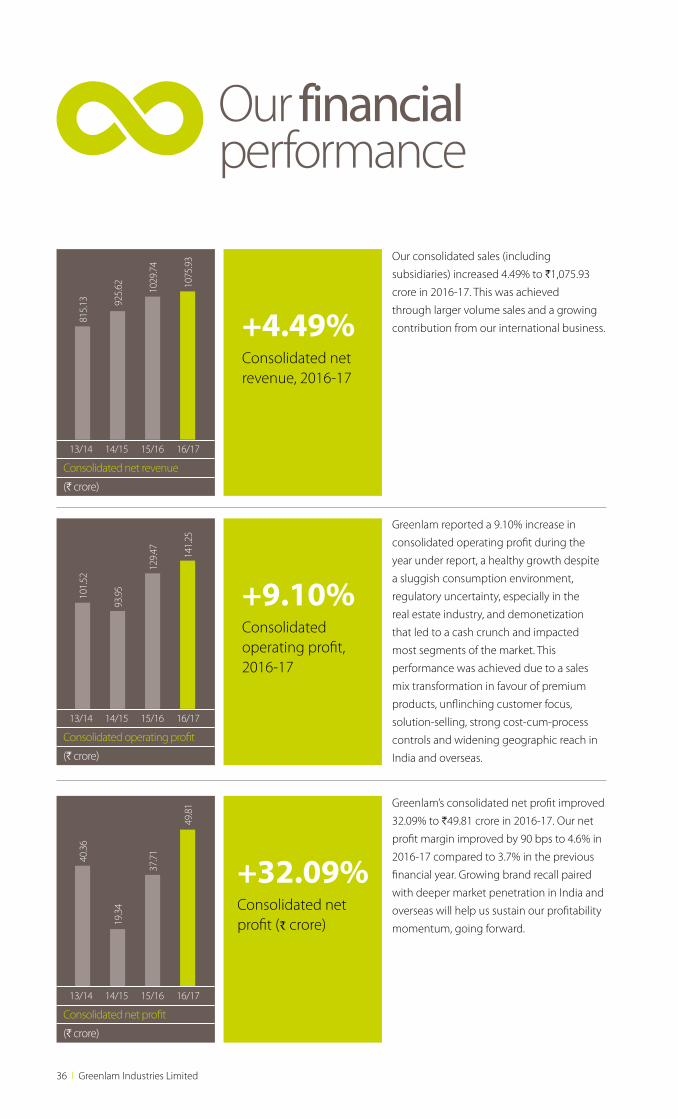
Our financial performance
+4.49% Consolidated net revenue, 2016-17
Our consolidated sales (including
subsidiaries) increased 4.49% to H1,075.93
crore in 2016-17. This was achieved
through larger volume sales and a growing
contribution from our international business.
Consolidated net revenue
(H crore)
815.
13 925.
62 1029
.74
1075
.93
13/14 14/15 15/16 16/17
+9.10% Consolidated operating profit, 2016-17
Greenlam reported a 9.10% increase in
consolidated operating profit during the
year under report, a healthy growth despite
a sluggish consumption environment,
regulatory uncertainty, especially in the
real estate industry, and demonetization
that led to a cash crunch and impacted
most segments of the market. This
performance was achieved due to a sales
mix transformation in favour of premium
products, unflinching customer focus,
solution-selling, strong cost-cum-process
controls and widening geographic reach in
India and overseas.
Consolidated operating profit
(H crore)
101.
52
93.9
5
129.
47 141.
25
13/14 14/15 15/16 16/17
+32.09% Consolidated net profit (R crore)
Greenlam’s consolidated net profit improved
32.09% to H49.81 crore in 2016-17. Our net
profit margin improved by 90 bps to 4.6% in
2016-17 compared to 3.7% in the previous
financial year. Growing brand recall paired
with deeper market penetration in India and
overseas will help us sustain our profitability
momentum, going forward.
Consolidated net profit
(H crore)
40.3
6
19.3
4
37.7
1
49.8
1
13/14 14/15 15/16 16/17
36 l Greenlam Industries Limited
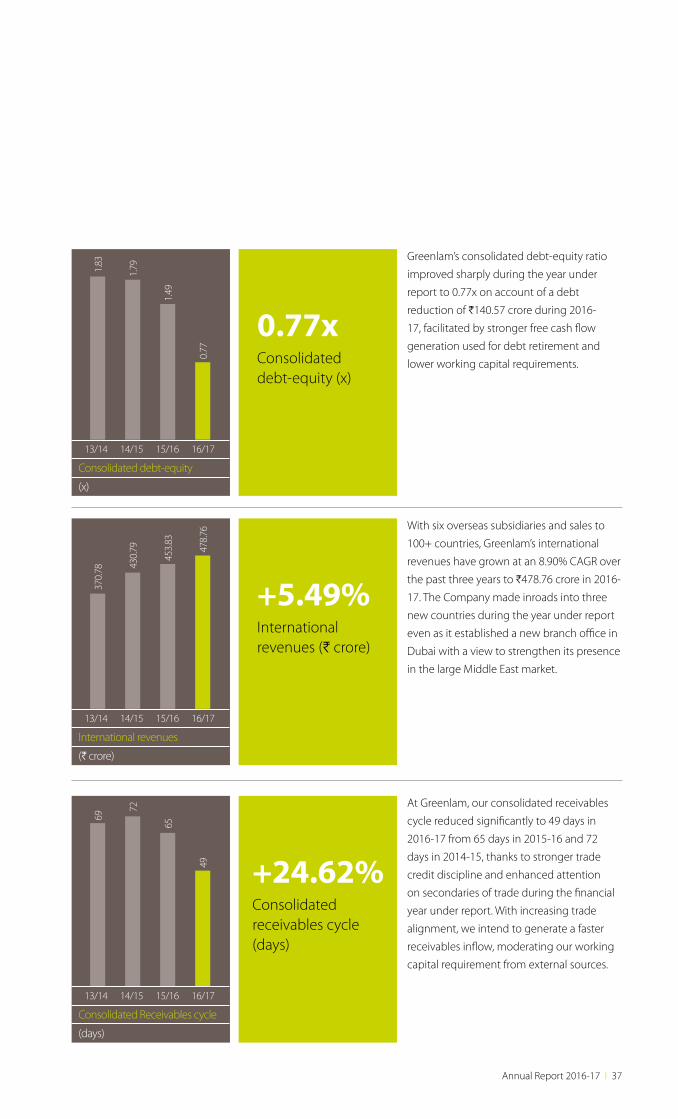
0.77x Consolidated debt-equity (x)
Greenlam’s consolidated debt-equity ratio
improved sharply during the year under
report to 0.77x on account of a debt
reduction of H140.57 crore during 2016-
17, facilitated by stronger free cash flow
generation used for debt retirement and
lower working capital requirements.
Consolidated debt-equity
(x)
1.83
1.79
1.49
0.77
13/14 14/15 15/16 16/17
+5.49% International revenues (H crore)
With six overseas subsidiaries and sales to
100+ countries, Greenlam’s international
revenues have grown at an 8.90% CAGR over
the past three years to H478.76 crore in 2016-
17. The Company made inroads into three
new countries during the year under report
even as it established a new branch office in
Dubai with a view to strengthen its presence
in the large Middle East market.
International revenues
(H crore)
370.
78 430.
79
453.
83
478.
76
13/14 14/15 15/16 16/17
+24.62% Consolidated receivables cycle (days)
At Greenlam, our consolidated receivables
cycle reduced significantly to 49 days in
2016-17 from 65 days in 2015-16 and 72
days in 2014-15, thanks to stronger trade
credit discipline and enhanced attention
on secondaries of trade during the financial
year under report. With increasing trade
alignment, we intend to generate a faster
receivables inflow, moderating our working
capital requirement from external sources.
Consolidated Receivables cycle
(days)
69
72
65
49
13/14 14/15 15/16 16/17
Annual Report 2016-17 l 37
Directors’ ReportFOR THE FINANCIAL YEAR 2016-17
Dear Shareholders,Your Directors have the pleasure in presenting the 4th Annual Report on the business and operations of the Company
along with the Audited Financial Statements of the Company for the financial year ended March 31, 2017.
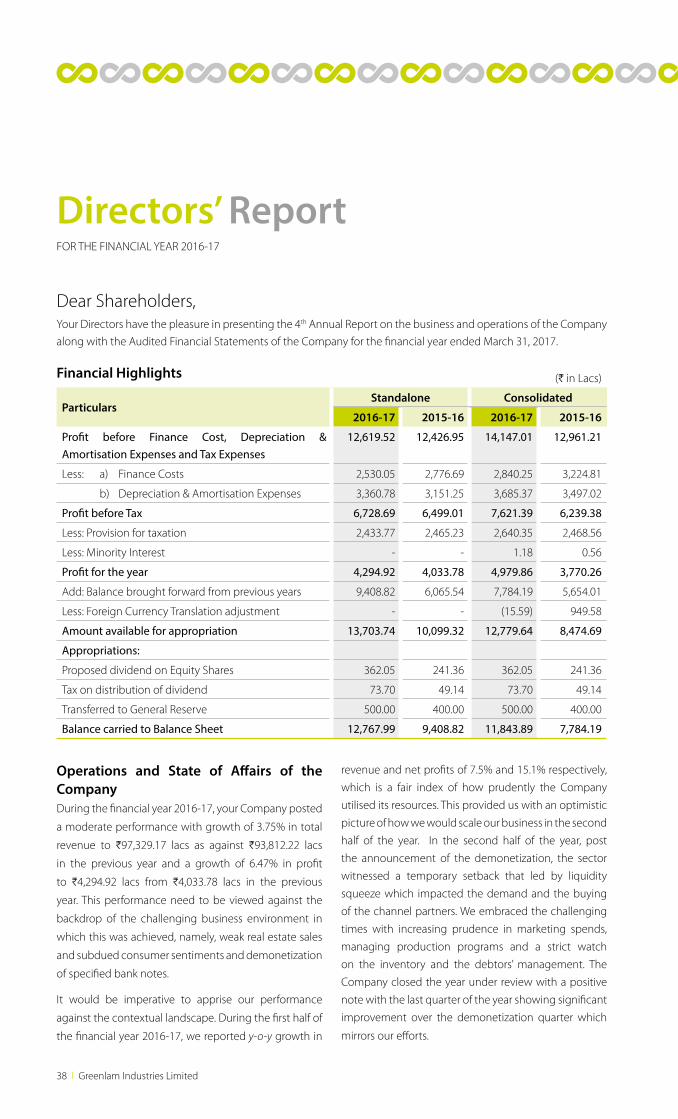
Financial Highlights
Operations and State of Affairs of the CompanyDuring the financial year 2016-17, your Company posted
a moderate performance with growth of 3.75% in total
revenue to H97,329.17 lacs as against H93,812.22 lacs
in the previous year and a growth of 6.47% in profit
to H4,294.92 lacs from H4,033.78 lacs in the previous
year. This performance need to be viewed against the
backdrop of the challenging business environment in
which this was achieved, namely, weak real estate sales
and subdued consumer sentiments and demonetization
of specified bank notes.
It would be imperative to apprise our performance
against the contextual landscape. During the first half of
the financial year 2016-17, we reported y-o-y growth in
revenue and net profits of 7.5% and 15.1% respectively,
which is a fair index of how prudently the Company
utilised its resources. This provided us with an optimistic
picture of how we would scale our business in the second
half of the year. In the second half of the year, post
the announcement of the demonetization, the sector
witnessed a temporary setback that led by liquidity
squeeze which impacted the demand and the buying
of the channel partners. We embraced the challenging
times with increasing prudence in marketing spends,
managing production programs and a strict watch
on the inventory and the debtors’ management. The
Company closed the year under review with a positive
note with the last quarter of the year showing significant
improvement over the demonetization quarter which
mirrors our efforts.
(H in Lacs)
ParticularsStandalone Consolidated
2016-17 2015-16 2016-17 2015-16
Profit before Finance Cost, Depreciation & Amortisation Expenses and Tax Expenses
12,619.52 12,426.95 14,147.01 12,961.21
Less: a) Finance Costs 2,530.05 2,776.69 2,840.25 3,224.81
b) Depreciation & Amortisation Expenses 3,360.78 3,151.25 3,685.37 3,497.02
Profit before Tax 6,728.69 6,499.01 7,621.39 6,239.38
Less: Provision for taxation 2,433.77 2,465.23 2,640.35 2,468.56
Less: Minority Interest - - 1.18 0.56
Profit for the year 4,294.92 4,033.78 4,979.86 3,770.26
Add: Balance brought forward from previous years 9,408.82 6,065.54 7,784.19 5,654.01
Less: Foreign Currency Translation adjustment - - (15.59) 949.58
Amount available for appropriation 13,703.74 10,099.32 12,779.64 8,474.69
Appropriations:
Proposed dividend on Equity Shares 362.05 241.36 362.05 241.36
Tax on distribution of dividend 73.70 49.14 73.70 49.14
Transferred to General Reserve 500.00 400.00 500.00 400.00
Balance carried to Balance Sheet 12,767.99 9,408.82 11,843.89 7,784.19
38 l Greenlam Industries Limited
During the financial year 2016-17, your Company
recorded a growth of 3.57% in export turnover from
H32,624.17 lacs to H33,790.29 lacs and export incentive
increased from H3,454.81 lacs to H3,537.11 lacs.
As per the consolidated financial statements, total
revenue and the profit after tax for the financial year
2016-17 stood at H1,07,956.27 lacs and H4,979.86 lacs
respectively.
During the financial year 2016-17, your Company
intensified its efforts in the area of product integration
and market penetration. Your Company continued
to expand its export markets for Laminates, Veneers,
Engineered Wood flooring and Engineered Door Sets.
The overall performance of the Company during
financial year 2016-17, amid a challenging economic
scenario, vindicates the effectiveness of the initiatives
undertaken by the Greenlam Management so as to
better exploit business opportunities.
DividendYour Directors recommend a final dividend of H1.50 per
equity share (previous year H1.00 per equity share) on
the Company’s 2,41,36,374 equity shares of H5.00 each
for 2016-17. The final dividend on the equity shares, if
declared as above, would entail an outflow of H362.05
lacs towards dividend and H73.70 lacs towards dividend
tax, resulting in a total outflow of H435.75 lacs.
Outlook and ExpansionThe Company’s outlook remains favourable on
account of its product integration capabilities, growing
brand popularity and the continuous support from
its employees, shareholders, creditors, consumers,
distributors, dealers and lenders. The Company’s vision
is to be a one-stop solution for all decorative surface
products (in its field of operation). The Company’s pan-
India distribution network ensures easy availability of
products in almost every part of India. The Company
has a presence in over 100 countries, either directly or
through its overseas subsidiaries.
The Goods and Services Tax Act (“GST”) appears to be
primed for launch from July, 2017, the biggest tax reform
in Indian history, potentially bringing all indirect taxes
under a uniform tax structure that will create a level
playing field boosting the competitiveness and build
a strong case in favour of organized and tax-compliant
players like us. This, coupled with the government’s
decision to demonetize high value currency notes are
seen as bold reforms expected to reset the economy
towards a higher growth trajectory with several
structural long-term benefits.
During the financial year 2016-17, the Company
has decided to further expand the capacity for
manufacturing Laminates at the unit of the Company
situated at Nalagarh, Himachal Pradesh to manufacture
an additional 2 million laminate sheets per annum.
With this addition to the existing manufacturing
capacity, the total installed capacity for laminate will
become 14.02 million laminate sheets per annum.
The revised estimated capital cost for this brownfield
expansion would be approximately H28.00 crores.
With respect to the said expansion, the delivery of
key plant and equipment, required for augmenting
laminate manufacturing capacity, have completed and
civil works for its foundation are in completion stage.
The delivery of ancillary machinery and other required
support equipment are under progress. The key plant
and equipment are being erected and in the final stage
of completion. The progress is as per the schedule.
Further your Company has established a branch office
in Dubai, UAE under the name ‘Greenlam Industries
Limited (DMCC Branch)’ with a view to strengthen its
presence in the Large Middle East markets.
In view of the above, your Directors are confident of
achieving significantly better results in the coming year.
Credit RatingCredit Analysis and Research Limited (CARE) has
upgraded the credit rating for the long term bank
facilities of H246.20 crores to “CARE A+; stable” (Revised
from “CARE A”) and reaffirmed the credit rating “CARE
A1” in respect of its short term bank facilities of H260.00
crores.
Subsidiaries and its PerformanceYour Company has six overseas subsidiaries viz. Greenlam
Asia Pacific Pte. Ltd., Singapore, Greenlam America, Inc.,
USA, Greenlam Asia Pacific (Thailand) Co., Ltd., Thailand,
Greenlam Holding Co., Ltd., Thailand, PT. Greenlam Asia
Pacific, Indonesia and Greenlam Europe (UK) Ltd., UK.
Greenlam Asia Pacific Pte. Ltd., Singapore, is engaged
in the business of trading of high-pressure decorative
laminates and allied products. Greenlam America,
Inc., USA, is engaged in the marketing and distribution
of high-pressure laminates in North America and
South America.
Annual Report 2016-17 l 39
Further, two Thai step-down subsidiaries Greenlam
Asia Pacific (Thailand) Co., Ltd. and Greenlam Holding
Co., Ltd. are engaged in the business of marketing and
distribution of high-pressure laminates in Thailand while
the Indonesian step-down subsidiary PT. Greenlam Asia
Pacific is engaged in the manufacture of promotional
material i.e. catalogues, sample folders, chain sets,
wall hooks and A4 size samples. Further, UK step-down
subsidiary Greenlam Europe (UK) Limited is engaged
in the business of marketing and distribution of
high-pressure laminates and allied products in
United Kingdom.
On April 05, 2016, the Company received the approval
from Registrar of Companies on its application dated
February 26, 2016 for striking off the name of its wholly
owned Indian Subsidiary “Greenlam VT Industries Private
Limited” from the Register of Registrar of Companies,
pursuant to the provisions of Section 560 of the
Companies Act, 1956. The said subsidiary has been
struck off and dissolved effective from that date.
Pursuant to Section 129(3) of the Companies Act,
2013 read with Rule 5 of the Companies (Accounts)
Rules, 2014, Statement containing salient features of
standalone financial statements of subsidiaries in Form
AOC-I is attached as “Annexure-I”.
As required under Rule 8(1) of the Companies (Accounts)
Rules, 2014, the Board’s Report has been prepared based
on Standalone Financial Statements. During the financial
year 2016-17, the net contribution of all the subsidiaries
to the Company’s consolidated turnover, profit before
tax (PBT) and profit after tax (PAT) is 9.84%, 11.72% and
13.75%, respectively. The standalone turnover, PBT and
PAT of each subsidiary are given in Form AOC-I.
In accordance with third proviso of Section 136(1)
of the Companies Act, 2013, the Annual Report of
the Company, containing therein its Standalone
and the Consolidated Financial Statements would
be placed on the website of the Company at www.
greenlamindustries.com. Further, as per fourth proviso
of the said Section, audited Annual Accounts of each of
the subsidiary companies would also be placed on the
website of the Company at www.greenlamindustries.
com. Shareholders interested in obtaining a copy of
the Annual Accounts of the subsidiary companies may
write to the Company Secretary at the Company’s
corporate office or may drop a mail at investor.relations@
greenlam.com.
In terms of the Regulation 46(2)(h) of the SEBI (Listing
Obligations and Disclosure Requirements) Regulations,
2015, the policy for determining material subsidiaries
is placed on the website of the Company at www.
greenlamindustries.com.
Consolidated Financial StatementsPursuant to Section 129(3) of the Companies Act, 2013,
the Consolidated Financial Statements of the Company
prepared in accordance with the Section 133 of the
Companies Act, 2013 read with Rule 7 of the Companies
(Accounts) Rules, 2014 and Accounting Standard (AS)-21
on Consolidated Financial Statements is provided in the
Annual Report.
Transfer to General Reserve The Directors in their meeting held on May 25, 2017
proposed to transfer H500.00 lacs to the General Reserve.
Directors Your Company has received declarations from all the
Independent Directors viz. Mr. Vijay Kumar Chopra [DIN:
02103940], Ms. Urvashi Saxena [DIN: 02021303] and
Ms. Sonali Bhagwati Dalal [DIN: 01105028] confirming
that they meet the criteria of independence as
prescribed under sub-section (6) of Section 149 of the
Companies Act, 2013 and Regulation 16 of the SEBI
(Listing Obligations and Disclosure Requirements)
Regulations, 2015.
In accordance with the provisions of the Companies Act,
2013 and the Articles of Association of the Company,
Ms. Parul Mittal [DIN: 00348783], Director-Design &
Marketing of the Company, will retire by rotation at the
ensuing Annual General Meeting and being eligible
offers herself for re-appointment.
During the financial year 2016-17, there was no change
in the composition of Board of Directors of the Company.
None of the Directors of your Company is disqualified
under the provisions of Section 164(2)(a) & (b) of the
Companies Act, 2013.
Changes in Share CapitalDuring the year under review, there was no change in
the Share Capital of the Company.
Key Managerial PersonnelThe details of the Key Managerial Personnel of the
Company are provided as under:
Sl. No.
Name Designation
1. Mr. Saurabh
Mittal
Managing Director
& CEO
2. Ms. Parul Mittal Director-Design &
Marketing
40 l Greenlam Industries Limited
3. Mr. Ashok
Kumar Sharma
Chief Financial Officer
4. Mr. Prakash
Kumar Biswal
Company Secretary & Asst.
Vice President - Legal
During the financial year 2016-17, there was no change
in the Key Managerial Personnel of the Company.
Meetings of the BoardFour (4) Board Meetings were held during the financial
year ended March 31, 2017. The details of the Board
Meetings with regard to their dates and attendance of
each of the Directors thereat have been provided in the
Corporate Governance Report.
Performance EvaluationPursuant to the provisions of the Companies Act,
2013 and Regulation 25(3) & (4) of the SEBI (Listing
Obligations and Disclosure Requirements) Regulations,
2015, the Independent Directors in their meeting held
on February 07, 2017 have evaluated the Performance
of Non-Independent Directors, Chairperson of the
Company after considering the views of the Executive
and Non-Executive Directors, Board as a whole and
assessed the quality, quantity and timeliness of flow
of information between the Company’s Management
and the Board. The Nomination and Remuneration
Committee has also carried out evaluation of
performance of every Director of the Company. On the
basis of evaluation made by the Independent Directors
and the Nomination and Remuneration Committee and
by way of individual and collective feedback from the
Non-Independent Directors, the Board has carried out
the Annual Performance Evaluation of the Directors
individually as well as evaluation of the working of the
Board as a whole and Committees of the Board.
The criteria for evaluation are outlined below:
a. For Independent Directors:
- Knowledge and Skills
- Professional conduct
- Duties, role and functions
- Compliance with Code of Business Ethics
and Code of Conduct of the Company
- Rendering independent and unbiased
opinion and judgements
- Attendance and active participation in
meetings of Board and Committees of the
Board and Members of the Company
- Assistance in implementing corporate
governance practices
- Updation of skills and knowledge
- Information regarding external environment
- Raising of concerns, if any, to the Board
- Study of agenda in depth prior to Meeting
- Contribution towards the formulation and
implementation of strategy for achieving
the goals of the Company
b. For Executive & Non-Executive Directors:
- Performance as Team Leader/Member
- Evaluating Business Opportunity and
analysis of Risk Reward Scenarios
- Professional Conduct and Integrity
- Sharing of Information with the Board
- Attendance and active participation in the
Board and Committee of the Board and
Meetings of Members of the Company
- Whether difference of opinion was voiced in
the meeting
- Whether Executive Directors were able to
answer the queries raised by Independent
Directors
- Compliance with Code of Business Ethics
and Code of Conduct of the Company
- Assistance in implementing corporate
governance practices
- Independent view on key appointments
and strategy formulation
- Review of integrity of financial information
and risk management
- Updation of skills and knowledge
- Information regarding external environment
- Raising of concerns, if any, to the Board
- Assistance in formulation of statutory and
non-statutory policies for the Company
- Ensures implementation of decisions of
the Board
- Ensures compliance with applicable legal
and regulatory requirements
- Alignment of Company’s resources and
budgets to the implementation of the
organization’s strategic plan
- Creativity and innovations in creating new
products
- Understanding of the business and products
of the Company
c. For Committees of the Board:
- Adequate and appropriate written terms of
reference
Annual Report 2016-17 l 41
- Volume of business handled by the
committee set at the right level?
- Whether the committees work in an
‘inclusive’ manner
- Effectiveness of the Board’s Committees
with respect to their role, composition and
their interaction with the Board
- Are the committees used to the best
advantage in terms of management
development, effective decision, etc.
- Attendance and active participation of each
member in the meetings
- Review of the action taken reports and
follows up thereon
d. For Board of Directors as a whole:
- Setting of clear performance objectives and
how well it has performed against them
- Contribution to the testing and
development and strategy
- Contribution to ensuring robust and
effective risk management
- Composition of the board and its
committees appropriate with the right
mix of knowledge and skills sufficient to
maximize performance in the light of future
strategy
- Effectiveness of inside and outside Board
relationship
- Responding to the problems or crises that
have emerged
- Relationship between Board and its
Committees and between committees
themselves
- Communication with employees and others
- Updation with latest developments in
regulatory environments and the market in
which the Company operates
- Role and functioning of the Board on the
matters pertaining to financial reporting
and internal controls
- Contribution of the Board for ensuring that
the Company adheres to the statutory and
regulatory compliances as applicable to the
Company
The Directors expressed their satisfaction with the
evaluation process.
Audit CommitteeAs on March 31, 2017, the Audit Committee of the
Company comprises of three Independent Directors
with Mr. Vijay Kumar Chopra as Chairman and Ms. Urvashi
Saxena and Ms. Sonali Bhagwati Dalal as members and
one promoter Director Mr. Saurabh Mittal, Managing
Director & CEO of the Company. The Committee,
inter alia, reviews the Internal Control System and
Reports of Internal Auditors and Compliance of
various Regulations. The brief terms of reference of the
Committee and the details of the Committee meetings
are provided in the Corporate Governance Report. The
Committee also reviews the Financial Statements before
they are placed before the Board.
Nomination and Remuneration CommitteeAs on March 31, 2017, the Nomination and Remuneration
Committee comprises of two Independent Directors
with Mr. Vijay Kumar Chopra as Chairman and Ms. Urvashi
Saxena as member and also one Non-Executive Director
Mr. Shiv Prakash Mittal as member. The Committee,
inter alia, identifies persons who are qualified to
become directors and who may be appointed in
senior management. The brief terms of reference of the
Committee and the details of the Committee meetings
are provided in the Corporate Governance Report.
Stakeholders’ Relationship CommitteeAs on March 31, 2017, the Stakeholders’ Relationship
Committee comprises of one Non-Executive Director
Mr. Shiv Prakash Mittal as Chairman and one Executive
Director Mr. Saurabh Mittal as member. The Committee,
inter alia, reviews the grievance of the security holders
of the Company and redressal thereof. The brief terms
of reference of the Committee and the details of the
Committee meetings are provided in the Corporate
Governance Report.
Vigil MechanismPursuant to the provisions of Section 177(9) & (10) of the
Companies Act, 2013 and the SEBI (Listing Obligations
and Disclosure Requirements) Regulations, 2015, a
‘Whistle Blower Policy’ to establish Vigil Mechanism for
directors and employees to report genuine concerns
has been framed. The policy is revised from time to time
to realign it with applicable regulations or organisations
suitability. The latest policy is available on the website of
the Company. This policy provides a platform to disclose
information, confidentially and without fear of reprisal or
victimization, where there is reason to believe that there
has been serious malpractice, fraud, impropriety, abuse
or wrong doing within the Company. The Company
ensures that no personnel have been denied access to
the Audit Committee.
Risk Management During the financial year 2015-16, your Company
42 l Greenlam Industries Limited
appointed an Independent Agency to identify the
various risks pertaining different businesses and
functions of the Company and to assist the Company
in framing and implementing the Risk Mitigation
Programme.
Your Company has adopted a mechanism to identify,
assess, monitor and mitigate various risks to key
business objectives. Major risks elements associated
with the businesses and functions of the Company have
been identified and are being addressed systematically
through mitigating actions on a continuing basis. In
the meetings of Audit Committee held during the
financial year 2016-17, the Committee members have
reviewed the various risk elements and have expressed
their satisfaction over the risk mitigation measures of
the Company.
Statement in respect of adequacy of Internal Financial Controls with reference to the Financial Statements The Directors had laid down Internal Financial Controls
procedures to be followed by the Company which
ensure compliance with various policies, practices
and statutes in keeping with the organization’s pace
of growth and increasing complexity of operations for
orderly and efficient conduct of its business. The Audit
Committee of the Board, from time to time, evaluated
the adequacy and effectiveness of internal financial
control of the Company with regard to:-
1. Systems have been laid to ensure that all transactions
are executed in accordance with management’s
general and specific authorization. There are well-laid
manuals for such general or specific authorization.
2. Systems and procedures exist to ensure that all
transactions are recorded as necessary to permit
preparation of Financial Statements in conformity
with Generally Accepted Accounting Principles or
any other criteria applicable to such statements,
and to maintain accountability for aspects and the
timely preparation of reliable financial information.
3. Access to assets is permitted only in accordance with
management’s general and specific authorization.
No assets of the Company are allowed to be used for
personal purposes, except in accordance with terms
of employment or except as specifically permitted.
4. The existing assets of the Company are verified/
checked at reasonable intervals and appropriate
action is taken with respect to differences, if any.
5. Proper systems are in place for prevention and
detection of frauds and errors and for ensuring
adherence to the Company’s policies.
Corporate Social ResponsibilityThe Corporate Social Responsibility Committee (CSR
Committee) has formulated and recommended to the
Board, a Corporate Social Responsibility Policy (CSR
Policy) indicating the activities to be undertaken by the
Company, which has been approved by the Board. The
CSR Policy may be accessed on the Company’s website
at the link http://www.greenlamindustries.com/pdf-file/
CorporateSocialResponsibilityPolicy.pdf.
The composition of the CSR Committee is provided in
the Annual Report on CSR Activities. The Average Net
Profit of the Company for the last three financial years
is H33,73,60,569.67 and accordingly the prescribed CSR
expenditure during the year under review shall not be
less than H67,47,211.39 (i.e. 2% of the Average Net Profits
of the Company for the last three financial years). The
Annual Report on CSR activities is annexed as “Annexure
II” to this Report.
Policy on Nomination and RemunerationThe summary of Remuneration Policy of the Company
prepared in accordance with the provisions of Section
178 of the Companies Act, 2013 read with Part D of
Schedule II of the SEBI (Listing Obligations and Disclosure
Requirements) Regulations, 2015 are provided in the
Corporate Governance Report.
Particulars of contracts or arrangements with related partiesRelated party transactions that were entered into during
the financial year 2016-17, were on arm’s length basis and
were in ordinary course of business. The particulars of
material related party transactions which were entered
into on arm’s length basis are provided in Form AOC-2
as required under Section 134(3)(h) of the Companies
Act, 2013 read with Rule 8(2) of the Companies
(Accounts) Rules, 2014 which is annexed herewith as
“Annexure-III”. There are no materially significant related
party transactions made by the Company which
may have potential conflict with the interest of the
Company. The Board has approved a policy for material
related party transactions which has been uploaded on
the Company’s website. The web-link to the Policy on
Related Party Transactions as required under the SEBI
(Listing Obligations and Disclosure Requirements)
Regulations, 2015 is as under: https://www.
greenlamindustries.com/pdf-file/Related_Party_
Transaction_Policy.pdf
Directors’ Responsibility StatementIn terms of the provisions of Section 134(3)(c) read with
Section 134(5) of the Companies Act, 2013, the Directors
state that:
Annual Report 2016-17 l 43
a) In preparation of the annual accounts for the
financial year ended March 31, 2017, the applicable
Accounting Standards have been followed along
with proper explanation relating to material
departures;
b) The Directors have selected such Accounting Policies
as listed in Note 1 to the Financial Statements and
applied them consistently and made judgments
and estimates that are reasonable and prudent so
as to give true and fair view of the state of affairs of
the Company at the end of the financial year as on
March 31, 2017 and of the profit of the Company for
that period;
c) The Directors have taken proper and sufficient care
for maintenance of adequate accounting records in
accordance with the provisions of the Companies
Act, 2013 for safeguarding the assets of the
Company and for preventing and detecting fraud
and other irregularities;
d) The Directors have prepared the annual accounts on
a going concern basis;
e) The Directors have laid down internal financial
controls to be followed by the Company and that
such internal financial controls are adequate and are
operating effectively;
f ) The Directors have devised proper systems to ensure
compliance with the provisions of all applicable laws
and that such systems were adequate and operating
effectively.
Material Changes There have been no material changes and commitments
affecting the financial position of the Company since
the close of financial year i.e. since March 31, 2017 and
the date of this report. Further, it is hereby confirmed
that there has been no change in the nature of business
of the Company.
InsuranceOur Company’s properties, including building, plant,
machineries and stocks, among others, are adequately
insured against risks.
Public depositsDuring the period under review, the Company did not
invite or accept any deposits from the public in terms of
Chapter V of the Companies Act, 2013.
Listing of sharesThe Equity Shares of the Company are listed on the
BSE Limited (BSE) with scrip code No. 538979 and on
National Stock Exchange of India Limited (NSE) with
scrip symbol GREENLAM. The Company confirms that
the annual listing fees to both the stock exchanges for
the financial year 2017-18 have been duly paid.
Loans, Guarantees or Investments under Section 186 of the Companies Act, 2013Details of Loans granted, Guarantees given and
Investments made during the year under review, covered
under the provisions of Section 186 of the Companies
Act, 2013 are given in the Financial Statements of the
Company forms part of this Annual Report.
Auditors and their Report (a) Statutory Auditors: In compliance with the Companies (Audit and Auditors)
Rules, 2014, M/s. D. Dhandaria & Company, Chartered
Accountants, has been appointed as Statutory Auditors
of the Company till the conclusion of 6th Annual General
Meeting (AGM), as approved by the members at their
1st Annual General Meeting held on October 30, 2014.
Further, pursuant to the requirement of Section 139 of
the Companies Act, 2013, the appointment of Statutory
Auditors is to be ratified by the members at every
Annual General Meeting. Based on their declaration and
eligibility letter received by the Company under Section
139 and 141 of the Companies Act, 2013, they are
eligible for the appointment. Members are requested to
ratify their appointment for the financial year 2017-18.
The Statutory Auditors’ Report on the Standalone and
Consolidated Financial Statements of the Company for
the financial year ended March 31, 2017 form part of this
Annual report.
(b) Secretarial Auditors:The Board of Directors of the Company at their meeting
held on October 18, 2016 appointed Mr. Manoj Kumar
Verma, Practicing Company Secretary of M/s. L. G.
Corp Law having office at D-12 LGF, Lajpat Nagar, New
Delhi-110024 for conducting the Secretarial Audit of The
Companyfor the financial year 2016-17. The Secretarial
Audit Report in Form MR-3 for the financial year ended
March 31, 2017, is annexed herewith as “Annexure-IV”.
(c) Cost Auditors: Your Company was not required to appoint Cost Auditor
for the financial year ended March 31, 2017.
(d) Internal Auditor: Mr. Rakesh Kumar Budhiraja, President-Internal Audit of the
Company, had been appointed as Internal Auditor of the
Company to carry out internal audit of Branches, offices
and manufacturing Units of the Company. The Audit
Committee quarterly reviews the Internal Audit report.
Response to Auditors’ Remarks
44 l Greenlam Industries Limited
There is no qualification, reservation, adverse remark or
disclaimer by the Statutory Auditors or by the Secretarial
Auditor in their Statutory Audit Report and Secretarial
Audit Report, respectively and hence, no explanation or
comments of the Board is required in this matter.
Extract of Annual ReturnThe extract of Annual Return required under Section
134(3)(a) of the Companies Act, 2013 read with Rule 12(1)
of the Companies (Management and Administration)
Rules, 2014, is provided in Form MGT-9 as “Annexure-V”
to this report.
Corporate Governance ReportA detailed Report on Corporate Governance pursuant
to the SEBI (Listing Obligations and Disclosure
Requirements) Regulations, 2015 along with an Auditors’
Certificate on compliance with the conditions of
Corporate Governance is annexed to this report.
Management Discussion and Analysis ReportThe Management Discussion and Analysis Report for
the financial year 2016-17, pursuant to the SEBI (Listing
Obligations and Disclosure Requirements) Regulations,
2015 is given as a separate statement in the Annual
Report.
CEO and CFO CertificationPursuant to Regulation 17(8) of the SEBI (Listing
Obligations and Disclosure Requirements) Regulations,
2015, the CEO and CFO certification as specified in Part
B of Schedule II thereof is attached with the Annual
Report. The Managing Director & CEO and the Chief
Financial Officer also provide quarterly certification on
Financial Results while placing the Financial Results
before the Board in terms of Regulation 33 of the SEBI
(Listing Obligations and Disclosure Requirements)
Regulations, 2015.
Code of Conduct for Directors and Senior Management PersonnelThe Code of Conduct for Directors and Senior
Management Personnel is posted on the Company’s
website. The Managing Director & CEO of the
Company has given a declaration that all Directors and
Senior Management Personnel concerned affirmed
compliance with the code of conduct with reference to
the financial year ended on March 31, 2017. Declaration
is attached with the Annual Report.
Conservation of Energy, Technology Absorption, Foreign Exchange Earnings and OutgoThe information required under Section 134(3)(m) of
the Companies Act, 2013 read with Rule 8(3) of the
Companies (Accounts) Rules, 2014, is annexed herewith
as “Annexure-VI”.
Particulars of employeesThe information required under Section 197(12) of
the Companies Act, 2013 read with Rule 5 of the
Companies (Appointment and Remuneration of
Managerial Personnel) Rules, 2014, is annexed herewith
as “Annexure-VII”.
Fraud ReportingThere was no fraud reported by the Auditors of the
Company under Section 143(12) of the Companies Act,
2013, to the Audit Committee or the Board of Directors
during the year under review.
Disclosures under Sexual Harassment of Women at Workplace (Prevention, Prohibition & Redressal) Act, 2013No case was filed under the Sexual Harassment of
Women at Workplace (Prevention, Prohibition &
Redressal) Act, 2013 during the year under review.
Details of significant and material orders passed by the regulators/courts/tribunals impacting the going concern status and the Company’s operations in futureDuring the period under review, there were no
significant and material orders passed by any regulator/
court/tribunal impacting the going concern status and
the Company’s operations in future.
AcknowledgementYour Directors place on record their sincere thanks and
appreciation for the continuing support of financial
institutions, consortium of banks, vendors, clients,
investors, Central Government, State Governments and
other regulatory authorities. Directors also place on
record their heartfelt appreciation for employees of the
Company for their dedication and contribution.
For and on behalf of the Board of Directors
Shiv Prakash Mittal Place: New Delhi Non-Executive Chairman
Date: May 25, 2017 [DIN: 00237242]
Annual Report 2016-17 l 45
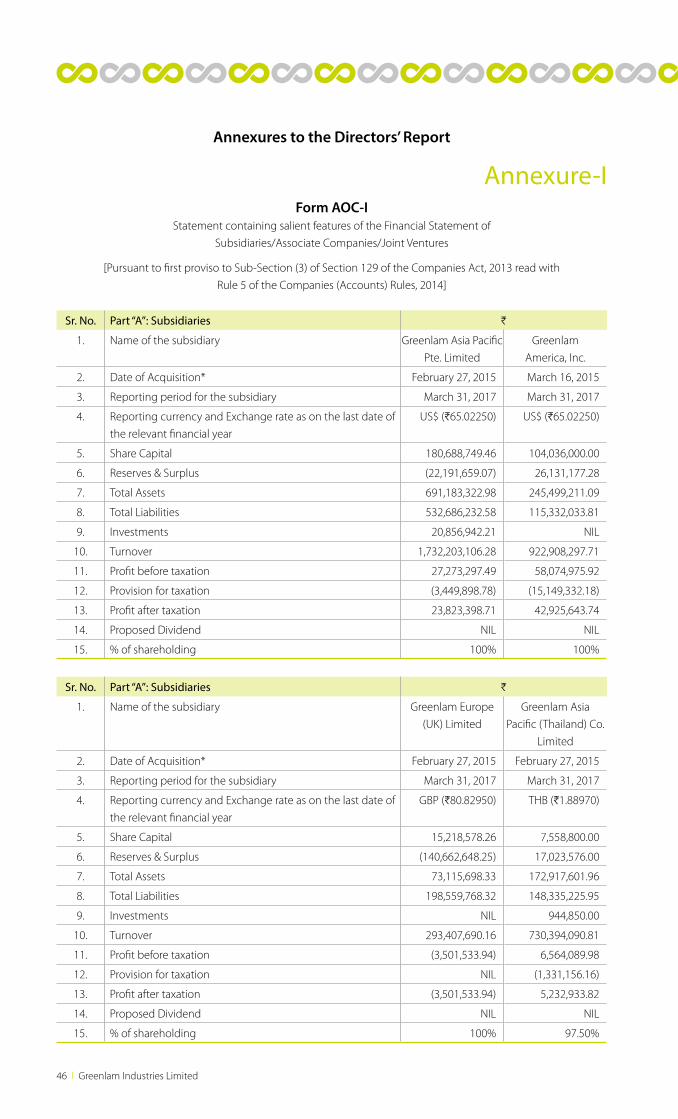
Form AOC-IStatement containing salient features of the Financial Statement of
Subsidiaries/Associate Companies/Joint Ventures
[Pursuant to first proviso to Sub-Section (3) of Section 129 of the Companies Act, 2013 read with
Rule 5 of the Companies (Accounts) Rules, 2014]
Annexure-I
Sr. No. Part “A”: Subsidiaries H
1. Name of the subsidiary Greenlam Asia Pacific
Pte. Limited
Greenlam
America, Inc.
2. Date of Acquisition* February 27, 2015 March 16, 2015
3. Reporting period for the subsidiary March 31, 2017 March 31, 2017
4. Reporting currency and Exchange rate as on the last date of
the relevant financial year
US$ (H65.02250) US$ (H65.02250)
5. Share Capital 180,688,749.46 104,036,000.00
6. Reserves & Surplus (22,191,659.07) 26,131,177.28
7. Total Assets 691,183,322.98 245,499,211.09
8. Total Liabilities 532,686,232.58 115,332,033.81
9. Investments 20,856,942.21 NIL
10. Turnover 1,732,203,106.28 922,908,297.71
11. Profit before taxation 27,273,297.49 58,074,975.92
12. Provision for taxation (3,449,898.78) (15,149,332.18)
13. Profit after taxation 23,823,398.71 42,925,643.74
14. Proposed Dividend NIL NIL
15. % of shareholding 100% 100%
Sr. No. Part “A”: Subsidiaries H
1. Name of the subsidiary Greenlam Europe
(UK) Limited
Greenlam Asia
Pacific (Thailand) Co.
Limited
2. Date of Acquisition* February 27, 2015 February 27, 2015
3. Reporting period for the subsidiary March 31, 2017 March 31, 2017
4. Reporting currency and Exchange rate as on the last date of
the relevant financial year
GBP (H80.82950) THB (H1.88970)
5. Share Capital 15,218,578.26 7,558,800.00
6. Reserves & Surplus (140,662,648.25) 17,023,576.00
7. Total Assets 73,115,698.33 172,917,601.96
8. Total Liabilities 198,559,768.32 148,335,225.95
9. Investments NIL 944,850.00
10. Turnover 293,407,690.16 730,394,090.81
11. Profit before taxation (3,501,533.94) 6,564,089.98
12. Provision for taxation NIL (1,331,156.16)
13. Profit after taxation (3,501,533.94) 5,232,933.82
14. Proposed Dividend NIL NIL
15. % of shareholding 100% 97.50%
Annexures to the Directors’ Report
46 l Greenlam Industries Limited
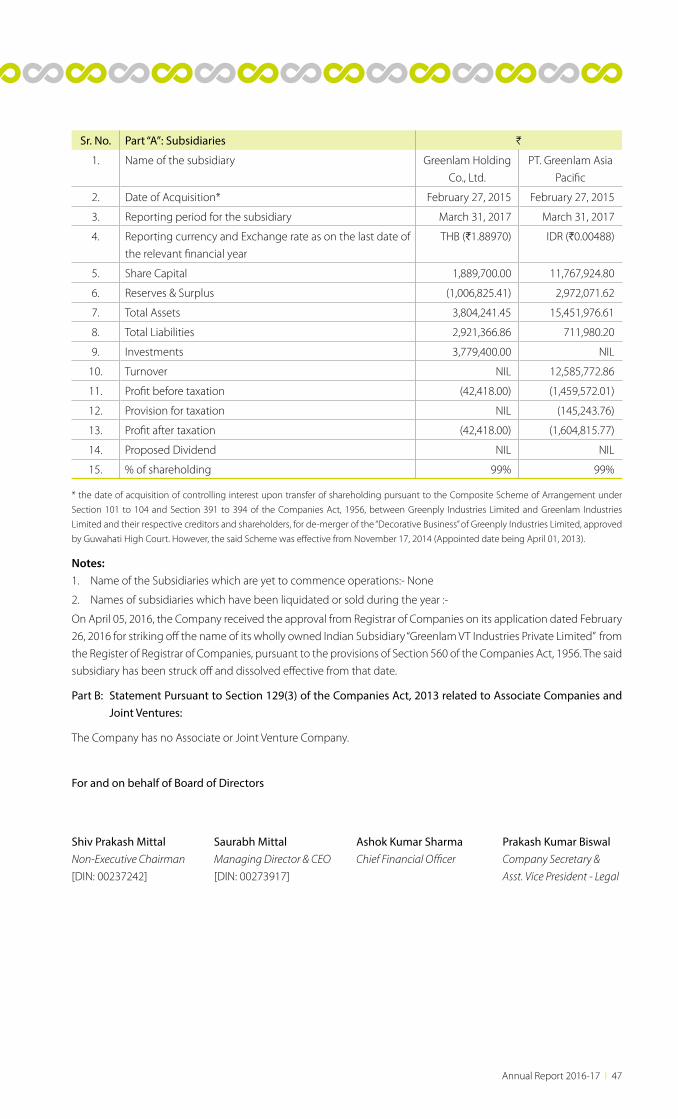
Sr. No. Part “A”: Subsidiaries H
1. Name of the subsidiary Greenlam Holding
Co., Ltd.
PT. Greenlam Asia
Pacific
2. Date of Acquisition* February 27, 2015 February 27, 2015
3. Reporting period for the subsidiary March 31, 2017 March 31, 2017
4. Reporting currency and Exchange rate as on the last date of
the relevant financial year
THB (H1.88970) IDR (H0.00488)
5. Share Capital 1,889,700.00 11,767,924.80
6. Reserves & Surplus (1,006,825.41) 2,972,071.62
7. Total Assets 3,804,241.45 15,451,976.61
8. Total Liabilities 2,921,366.86 711,980.20
9. Investments 3,779,400.00 NIL
10. Turnover NIL 12,585,772.86
11. Profit before taxation (42,418.00) (1,459,572.01)
12. Provision for taxation NIL (145,243.76)
13. Profit after taxation (42,418.00) (1,604,815.77)
14. Proposed Dividend NIL NIL
15. % of shareholding 99% 99%
* the date of acquisition of controlling interest upon transfer of shareholding pursuant to the Composite Scheme of Arrangement under
Section 101 to 104 and Section 391 to 394 of the Companies Act, 1956, between Greenply Industries Limited and Greenlam Industries
Limited and their respective creditors and shareholders, for de-merger of the “Decorative Business” of Greenply Industries Limited, approved
by Guwahati High Court. However, the said Scheme was effective from November 17, 2014 (Appointed date being April 01, 2013).
For and on behalf of Board of Directors
Shiv Prakash Mittal Saurabh Mittal Ashok Kumar Sharma Prakash Kumar BiswalNon-Executive Chairman Managing Director & CEO Chief Financial Officer Company Secretary &
[DIN: 00237242] [DIN: 00273917] Asst. Vice President - Legal
Notes:1. Name of the Subsidiaries which are yet to commence operations:- None
2. Names of subsidiaries which have been liquidated or sold during the year :-
On April 05, 2016, the Company received the approval from Registrar of Companies on its application dated February
26, 2016 for striking off the name of its wholly owned Indian Subsidiary “Greenlam VT Industries Private Limited” from
the Register of Registrar of Companies, pursuant to the provisions of Section 560 of the Companies Act, 1956. The said
subsidiary has been struck off and dissolved effective from that date.
Part B: Statement Pursuant to Section 129(3) of the Companies Act, 2013 related to Associate Companies and Joint Ventures:
The Company has no Associate or Joint Venture Company.
Annual Report 2016-17 l 47
ANNUAL REPORT ON CORPORATE SOCIAL RESPONSIBILITY (CSR) ACTIVITIES
Annexure-II
1. A brief outline of the Company’s CSR policy, including overview of projects or programs proposed to be undertaken and a reference to the web link to the CSR policy and projects or programmes.
Brief outline of the CSR Policy
Greenlam Industries Limited has always strived to make a difference, specifically to the society by contributing to
the economic development of the Country and improving the quality of life of the vulnerable communities. We
strive to strengthen our corporate citizenship through engagements with various NGOs working in the fields of
health, education, environment and vocational training.
Priority Projects
The Company has currently identified the following Priority Projects to be undertaken by the CSR Committee:
1. Promoting education including special education and employment enhancing vocation skills especially
among children, women, elderly, and the differently-abled and livelihood enhancement projects;
2. Promoting health care including preventive health care and sanitation and making available safe
drinking water;
3. Promoting gender equality, empowering women, setting-up homes and hostels for women and orphans.
CSR Policy is stated herein below:
‘http://www.greenlamindustries.com/pdf-file/CorporateSocialResponsibilityPolicy.pdf’
2. The Composition of the CSR Committee: Mr. Saurabh Mittal - Chairman (Executive Director)
Mr. Shiv Prakash Mittal - Member (Non-Executive Director)
Ms. Sonali Bhagwati Dalal - Member (Independent Director)
Ms. Parul Mittal - Member (Executive Director)
3. Average net profit of the Company for last three financial years: H33,73,60,569.67
4. Prescribed CSR Expenditure (two per cent of the amount as in item 3 above): The Company was required to spend H67,47,211.39 towards CSR during the financial year under review.
5. Details of CSR spent during the financial year: (a) Total amount spent for the financial year under review: H69,62,624.00
(b) Amount unspent, if any: Nil
48 l Greenlam Industries Limited
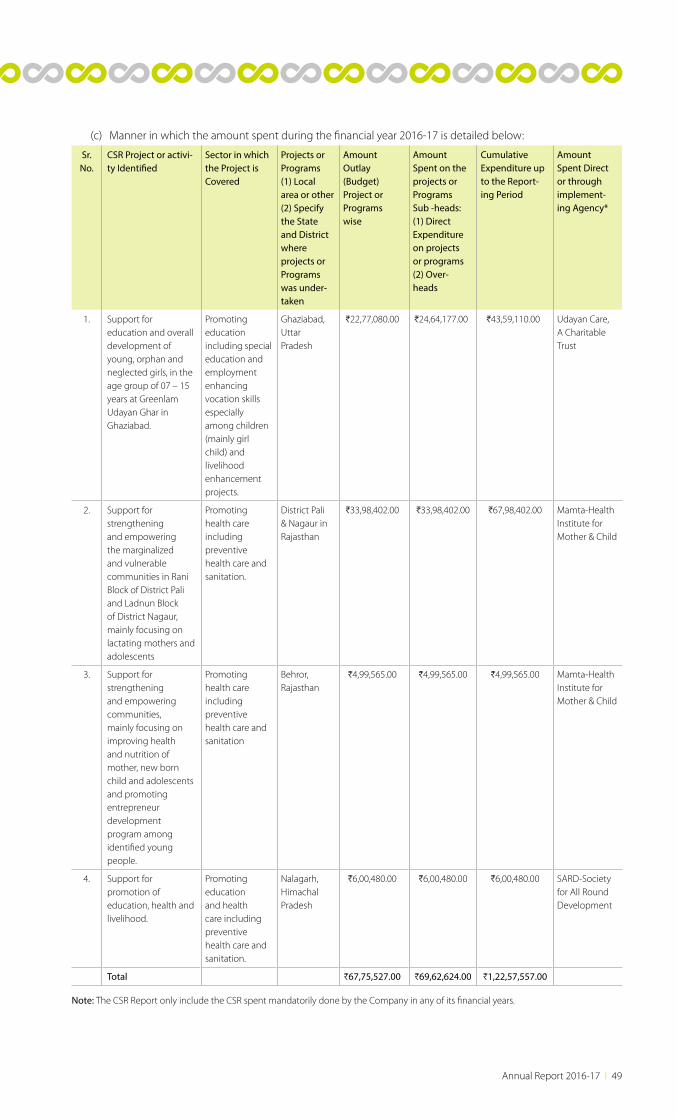
Sr. No.
CSR Project or activi-ty Identified
Sector in which the Project is Covered
Projects or Programs(1) Local area or other(2) Specify the State and District where projects or Programs was under-taken
Amount Outlay(Budget) Project or Programs wise
Amount Spent on the projects or Programs Sub -heads:(1) Direct Expenditure on projects or programs(2) Over-heads
Cumulative Expenditure up to the Report-ing Period
Amount Spent Direct or through implement-ing Agency*
1. Support for education and overall development of young, orphan and neglected girls, in the age group of 07 – 15 years at Greenlam Udayan Ghar in Ghaziabad.
Promoting education including special education and employment enhancing vocation skills especially among children (mainly girl child) and livelihood enhancement projects.
Ghaziabad, Uttar Pradesh
H22,77,080.00 H24,64,177.00 H43,59,110.00 Udayan Care, A Charitable Trust
2. Support for strengthening and empowering the marginalized and vulnerable communities in Rani Block of District Pali and Ladnun Block of District Nagaur, mainly focusing on lactating mothers and adolescents
Promoting health care including preventive health care and sanitation.
District Pali & Nagaur in Rajasthan
H33,98,402.00 H33,98,402.00 H67,98,402.00 Mamta-Health Institute for Mother & Child
3. Support for strengthening and empowering communities, mainly focusing on improving health and nutrition of mother, new born child and adolescents and promoting entrepreneur development program among identified young people.
Promoting health care including preventive health care and sanitation
Behror, Rajasthan
H4,99,565.00 H4,99,565.00 H4,99,565.00 Mamta-Health Institute for Mother & Child
4. Support for promotion of education, health and livelihood.
Promoting education and health care including preventive health care and sanitation.
Nalagarh, Himachal Pradesh
H6,00,480.00 H6,00,480.00 H6,00,480.00 SARD-Society for All Round Development
Total H67,75,527.00 H69,62,624.00 H1,22,57,557.00
Note: The CSR Report only include the CSR spent mandatorily done by the Company in any of its financial years.
(c) Manner in which the amount spent during the financial year 2016-17 is detailed below:
Annual Report 2016-17 l 49
*Details of Implementing Agency:
a) Udayan Care, A Charitable Trust Udayan Care is a registered Public Charitable Trust since 1994. Udayan Care’s initiatives are focused towards
regenerating the rhythm of life of the disadvantaged. Through the power of mentorship, it nurtures children who
are orphaned and abandoned in the warmth of a family at Udayan Ghars, its long-term foster homes; ensures
young girls higher education through our education fellowships; enables under-served youth and adults to
improve their employability skills in its IT & vocational training centres; and creates long term buddies through
Big Friend Little Friend Programme for these children.
b) MAMTA-Health Institute for Mother & Child Mamta-Health Institute for Mother & Child is a Non-Government Organisation registered under Societies
Registration Act, 1860. Mamta works for the cause of community development and is engaged, inter alia,
amongst other activities in capacity building, community action, system strengthening, research and evidence
building with a gender and rights perspectives in a cost effective and sustainable approach that empowers the
marginalised and vulnerable communities in resource-poor settings of India.
c) SARD-Society for All Round Development SARD is a Non-Government Organisation registered under Societies Registration Act, 1860 at New Delhi,
established with a mission to empower the deprived section of society, especially women, through the promotion
of education, health care, skill development and sustainable economic activities.
6. In case the Company has failed to spend the two per cent of the average net profits of the last three financial years or any part thereof, the Company shall provide the reasons for not spending the amount in its Board’s report:
The Company has spent the required amount on CSR activities.
7. A responsibility statement of the CSR Committee that the implementation and monitoring of CSR Policy, is in compliance with CSR objectives and Policy of the Company:
The implementation and monitoring of the CSR Policy is in compliance with CSR objectives and Policy of
the Company.
Saurabh MittalManaging Director & CEO
Chairman - CSR Committee
[DIN: 00273917]
50 l Greenlam Industries Limited
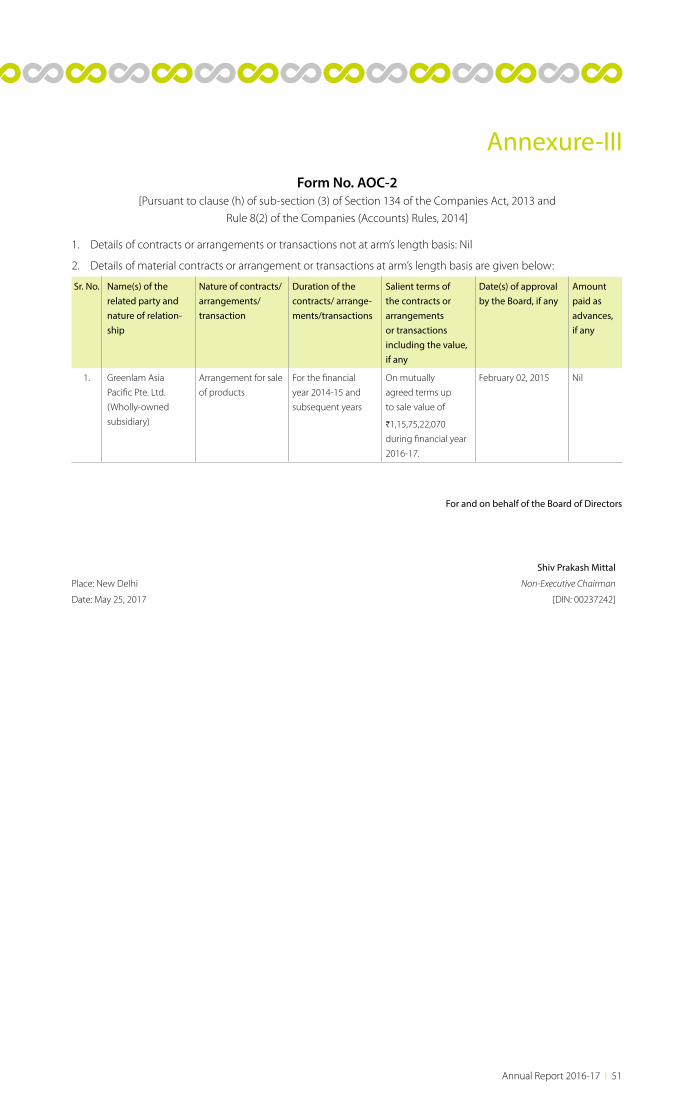
Form No. AOC-2[Pursuant to clause (h) of sub-section (3) of Section 134 of the Companies Act, 2013 and
Rule 8(2) of the Companies (Accounts) Rules, 2014]
Annexure-III
1. Details of contracts or arrangements or transactions not at arm’s length basis: Nil
2. Details of material contracts or arrangement or transactions at arm’s length basis are given below:
Sr. No. Name(s) of the related party and nature of relation-ship
Nature of contracts/ arrangements/transaction
Duration of the contracts/ arrange-ments/transactions
Salient terms of the contracts or arrangements or transactions including the value, if any
Date(s) of approval by the Board, if any
Amount paid as advances, if any
1. Greenlam Asia
Pacific Pte. Ltd.
(Wholly-owned
subsidiary)
Arrangement for sale
of products
For the financial
year 2014-15 and
subsequent years
On mutually
agreed terms up
to sale value of
H1,15,75,22,070
during financial year
2016-17.
February 02, 2015 Nil
For and on behalf of the Board of Directors
Shiv Prakash Mittal
Place: New Delhi Non-Executive Chairman
Date: May 25, 2017 [DIN: 00237242]
Annual Report 2016-17 l 51
SECRETARIAL AUDIT REPORTFOR THE FINANCIAL YEAR ENDED ON 31ST MARCH 2017
Annexure-IV
Manoj Kumar VermaPractising Company Secretary
D-12, LGF, LAJPAT NAGAR-III, NEW DELHI-24
Tel.: +91-11-4290 9910/11, +91-93130 04529, +9958865446
E-mail:lgurung @ lgcorplaw.com,[email protected]
I have conducted the Secretarial Audit of the compliance of applicable statutory provisions and the adherence to good corporate practices by Greenlam Industries Limited (hereinafter called the Company). Secretarial Audit was conducted in a manner that provided me a reasonable basis for evaluating the corporate conducts/statutory compliances and expressing my opinion thereon.
Based on my verification of the Company’s books, papers, minute books, forms and returns filed and other records maintained by the Company and also the information provided by the Company, its officers, and authorized representatives during the conduct of secretarial audit, I hereby report that in my opinion, the Company has, during the audit period covering the financial year ended on 31st March, 2017 complied with the statutory provisions listed hereunder, adhered to good corporate practices and also that the Company has proper Board-processes and compliance-mechanism in place to the extent, in the manner and subject to the reporting made hereinafter:
I have examined the books, papers, minute books, forms and returns filed and other records maintained by the Company for the financial year ended on 31st March, 2017 according to the provisions of:
(i) The Companies Act, 2013 (the Act) and the rules made thereunder;
(ii) The Securities Contracts (Regulation) Act, 1956 (‘SCRA’) and the rules made thereunder;
(iii) The Depositories Act, 1996 and the Regulations and Bye-laws framed thereunder;
(iv) Foreign Exchange Management Act, 1999 and the rules and regulations made thereunder to the extent of Foreign Direct Investment, Overseas Direct
Investment and External Commercial Borrowings made by the Company;
(v) The following Regulations and Guidelines prescribed under the Securities and Exchange Board of India Act, 1992 (‘SEBI Act’):-
(a) The Securities and Exchange Board of India (Substantial Acquisition of Shares and Takeovers) Regulations, 2011;
(b) The Securities and Exchange Board of India (Prohibition of Insider Trading) Regulations, 2015;
(c) The Securities and Exchange Board of India (Issue of Capital and Disclosure Requirements) Regulations, 2009; - Not applicable to the Company during the period under review;
(d) The Securities and Exchange Board of India (Employee Stock Option Scheme and Employee Stock Purchase Scheme) Guidelines, 1999/Securities and Exchange Board of India (Share Based Employee Benefits) Regulations 2014; - Not applicable to the Company during the period under review;
(e) The Securities and Exchange Board of India (Issue and Listing of Debt Securities) Regulations, 2008; - Not applicable to the Company during the period under review;
(f ) The Securities and Exchange Board of India (Registrars to an issue and Share Transfer Agents) Regulations, 1993 regarding the Companies Act and dealing with client to the extent of securities issued.
(g) The Securities and Exchange Board of India (De-listing of Equity Shares) Regulations, 2009; - Not
To,
The Members,
Greenlam Industries Limited,Makum Road, Tinsukia,
Assam – 786125
52 l Greenlam Industries Limited
applicable to the Company during the period under review; and
(h) The Securities and Exchange Board of India (Buyback of Securities) Regulations, 1998; - Not applicable to the Company during the period under review;
I further report that, having regard to the compliance system prevailing in the Company and relying on the representation made by the Company and its officers, the Company has complied other applicable laws, as informed and certified by the Management of the Company, which are specifically applicable to the Company;
1. Environment Protection Act, 1986
2. Water (Prevention and Control of Pollution) Act, 1974
3. Air (Prevention and Control of Pollution) Act, 1981 (“Air Act”)
4. Hazardous Waste (Management, Handling and Trans boundary Movement) Rules, 2008
5. The Indian Boilers Act, 1923 and rules and regulations thereunder
6. Legal Metrology Act, 2009 and rules and regulations thereunder
7. The Rajasthan Factories Rules, 1951 and The Himachal Pradesh Factory Rules, 1950
8. Indian Forest Act, 1927, Rajasthan Forest Act, 1953, The Rajasthan Forest Produce (Establishment and Regulations of Saw Mills) Rules 1983
I have also examined compliance with the applicable clauses of the following:
(i) Secretarial Standards issued by The Institute of Company Secretaries of India.
(ii) The Listing Agreements entered into by the Company with BSE Limited and National Stock Exchange of India Limited pursuant to the Securities and Exchange Board of India (Listing Obligations
and Disclosure Requirements) Regulations, 2015, as applicable.
During the period under review the Company has complied with the provisions of the Act, Rules, Regulations, Guidelines, Standards, etc. mentioned above.
I further report that:1. The Board of Directors of the Company is duly
constituted with proper balance of Executive Directors, Non-Executive Directors and Independent Directors. The changes, if any, in the composition of the Board of Directors and Board Committees that took place during the period under review were carried out in compliance with the provisions of the Act.
2. Adequate notice is given to all directors to schedule the Board Meetings, agenda and detailed notes on agenda were sent at least seven days in advance, and a system exists for seeking and obtaining further information and clarifications on the agenda items before the meeting and for meaningful participation at the meeting.
3. Majority decision is carried through while the dissenting members’ views are captured and recorded as part of the minutes of the meetings of the Board of Directors or Committees of the Board, as the case may be.
I further report that the Company has adequate systems and processes in the Company commensurate with the size and operations of the Company to monitor and ensure compliance with applicable laws, rules, regulations and guidelines.
I further report that during the audit period, the Company has no specific events/actions having a major bearing on the Company’s affairs in pursuance except as follows:
i. During the year 2016-17, the Company has decided to expand the manufacturing capacity for laminates at its unit Nalagarh, Himachal Pradesh, to manufacture additional 2 million laminate sheets per annum.
(Manoj Kumar Verma)Practising Company Secretary
Place: New Delhi M. No. FCS 7632Date: May 25, 2017 C P No.: 8275
This report is to be read with my letter of even date which is annexed as Annexure A and forms an integral part of this report.
Annual Report 2016-17 l 53
‘Annexure A’
To,
The Members,
Greenlam Industries Limited
My report of even date is to be read along with this letter.
1. Maintenance of secretarial record is the responsibility of the management of the Company. My responsibility is
to express an opinion on these secretarial audit reports based on the audit.
2. I have followed the audit practices and processes as were appropriate to obtain reasonable assurance about
the correctness of the contents of the Secretarial records. The verification was done on test basis to ensure that
correct facts are reflected in secretarial records. I believe that the processes and practices, I followed provide a
reasonable basis for my opinion.
3. I have not verified the correctness and appropriateness of financial records and Books of Accounts of the
Company.
4. Wherever required, I have obtained the Management representation about the compliance of laws, rules and
regulations and happening of events etc.
5. The compliance of the provisions of Corporate Laws and other applicable laws, rules, regulations, guidelines,
standards, etc. is the responsibility of management. My examination was limited to the verification of procedure
on test basis.
6. The Secretarial Audit Report is neither an assurance as to the future viability of the Company nor of the efficacy
or effectiveness with which the management has conducted the affairs of the Company.
(Manoj Kumar Verma)Practising Company Secretary
Place: New Delhi M. No. FCS 7632Date: May 25, 2017 C P No.: 8275
54 l Greenlam Industries Limited
FORM NO. MGT 9
EXTRACT OF ANNUAL RETURN
As on Financial Year ended on March 31, 2017
[Pursuant to Section 92 (3) of the Companies Act, 2013 and Rule 12 (1) of
the Companies (Management & Administration) Rules, 2014]
Annexure-V
1. CIN L21016AS2013PLC011624
2. Registration Date August 12, 2013
3. Name of the Company GREENLAM INDUSTRIES LIMITED
4. Category/Sub-category of the Company Public Company limited by shares
5. Address of the Registered office & contact details Makum Road, Tinsukia, Assam-786125
Phone No.: +91-11-42791399, Fax No.: +91-11-42791330
Email: [email protected]
Website: www.greenlamindustries.com
6. Whether listed Company Yes, listed on BSE Limited and
National Stock Exchange of India Ltd.
7. Name, Address & contact details of the
Registrar & Share Transfer Agent
Link Intime India Pvt. Ltd.
44, Community Centre, 2nd floor
Naraina Industrial Area, Phase-1,
Near PVR Naraina, New Delhi-110028
Phone No.: +91-11-41410592,
Fax No.: +91-11-41410591
Email: [email protected]
Website: www.linkintime.co.in
I. REGISTRATION & OTHER DETAILS:
II. PRINCIPAL BUSINESS ACTIVITIES OF THE COMPANY: All the business activities contributing 10% or more of the total turnover of the Company shall be stated:-
Sl. No.
Name and Description of main products/services NIC Code (2008) of the Product/service
% to total turnover of the Company*
1. Laminates & Allied Products 16219 84.16%
2. Decorative Veneer & Allied Products 16211 15.84%
* Figures have been stated on the basis of the gross turnover of the Company.
III. PARTICULARS OF HOLDING, SUBSIDIARY AND ASSOCIATE COMPANIES:
Sl. No.
Name and Address of the Company CIN/GLN Holding/Subsidiary/Associate
% of share held
Applicable Section
1. Greenlam Asia Pacific Pte. Limited Not Applicable Subsidiary 100% 2(87)(ii)
2. Greenlam America, Inc. Not Applicable Subsidiary 100% 2(87)(ii)
3. Greenlam Europe (UK) Limited Not Applicable Subsidiary 100% 2(87)(ii)
4. Greenlam Asia Pacific (Thailand)
Co., Ltd.
Not Applicable Subsidiary 97.5% 2(87)(ii)
5. Greenlam Holding Co., Limited Not Applicable Subsidiary 99% 2(87)(ii)
6. PT. Greenlam Asia Pacific Not Applicable Subsidiary 99% 2(87)(ii)
Annual Report 2016-17 l 55
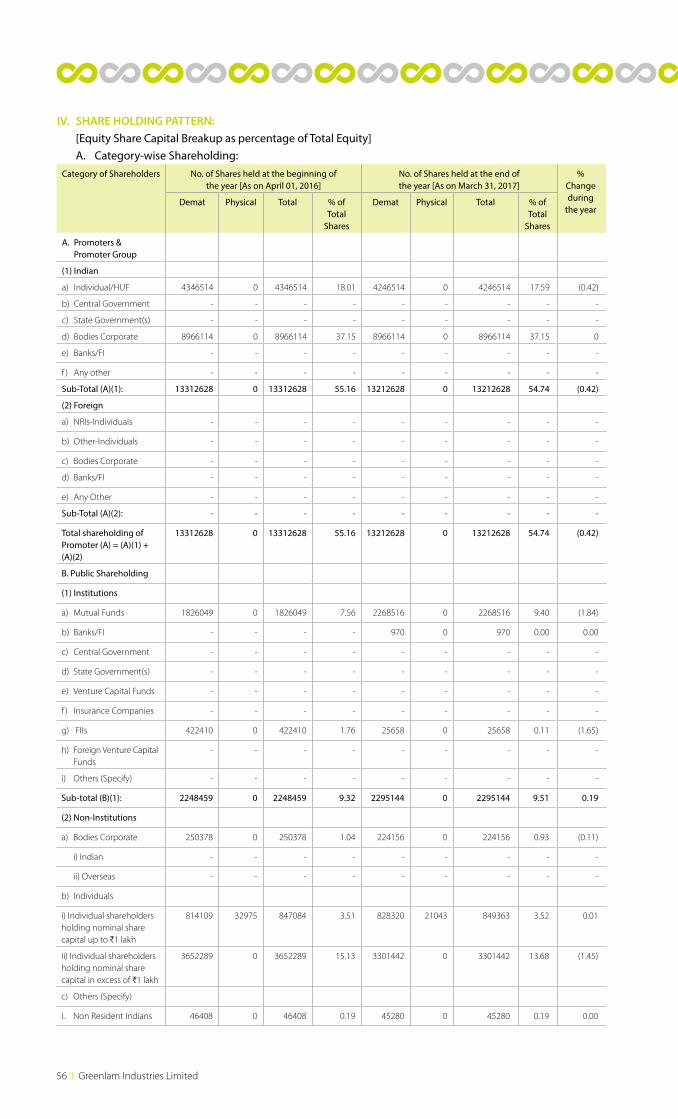
IV. SHARE HOLDING PATTERN: [Equity Share Capital Breakup as percentage of Total Equity] A. Category-wise Shareholding:
Category of Shareholders No. of Shares held at the beginning of the year [As on April 01, 2016]
No. of Shares held at the end of the year [As on March 31, 2017]
% Changeduring
the yearDemat Physical Total % of
Total Shares
Demat Physical Total % of Total
Shares
A. Promoters & Promoter Group
(1) Indian
a) Individual/HUF 4346514 0 4346514 18.01 4246514 0 4246514 17.59 (0.42)
b) Central Government - - - - - - - - -
c) State Government(s) - - - - - - - - -
d) Bodies Corporate 8966114 0 8966114 37.15 8966114 0 8966114 37.15 0
e) Banks/FI - - - - - - - - -
f ) Any other - - - - - - - - -
Sub-Total (A)(1): 13312628 0 13312628 55.16 13212628 0 13212628 54.74 (0.42)
(2) Foreign
a) NRIs-Individuals - - - - - - - - -
b) Other-Individuals - - - - - - - - -
c) Bodies Corporate - - - - - - - - -
d) Banks/FI - - - - - - - - -
e) Any Other - - - - - - - - -
Sub-Total (A)(2): - - - - - - - - -
Total shareholding of Promoter (A) = (A)(1) + (A)(2)
13312628 0 13312628 55.16 13212628 0 13212628 54.74 (0.42)
B. Public Shareholding
(1) Institutions
a) Mutual Funds 1826049 0 1826049 7.56 2268516 0 2268516 9.40 (1.84)
b) Banks/FI - - - - 970 0 970 0.00 0.00
c) Central Government - - - - - - - - -
d) State Government(s) - - - - - - - - -
e) Venture Capital Funds - - - - - - - - -
f ) Insurance Companies - - - - - - - - -
g) FIIs 422410 0 422410 1.76 25658 0 25658 0.11 (1.65)
h) Foreign Venture Capital Funds
- - - - - - - - -
i) Others (Specify) - - - - - - - - -
Sub-total (B)(1): 2248459 0 2248459 9.32 2295144 0 2295144 9.51 0.19
(2) Non-Institutions
a) Bodies Corporate 250378 0 250378 1.04 224156 0 224156 0.93 (0.11)
i) Indian - - - - - - - - -
ii) Overseas - - - - - - - - -
b) Individuals
i) Individual shareholders holding nominal share capital up to H1 lakh
814109 32975 847084 3.51 828320 21043 849363 3.52 0.01
ii) Individual shareholders holding nominal share capital in excess of H1 lakh
3652289 0 3652289 15.13 3301442 0 3301442 13.68 (1.45)
c) Others (Specify)
I. Non Resident Indians 46408 0 46408 0.19 45280 0 45280 0.19 0.00
56 l Greenlam Industries Limited
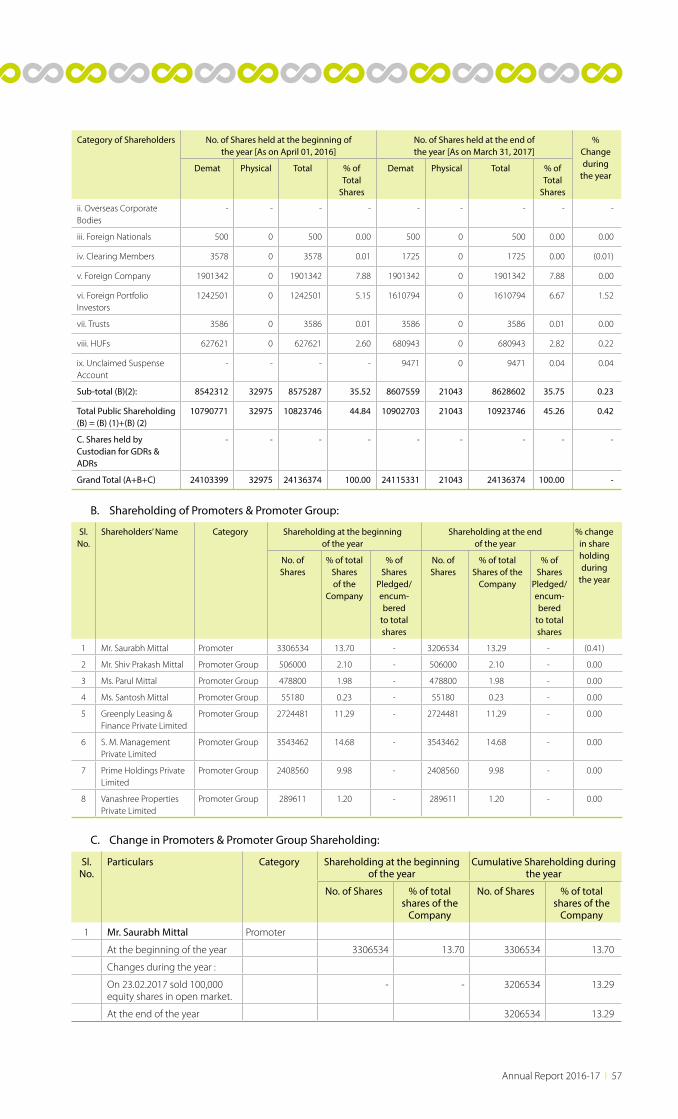
Category of Shareholders No. of Shares held at the beginning of the year [As on April 01, 2016]
No. of Shares held at the end of the year [As on March 31, 2017]
% Changeduring
the yearDemat Physical Total % of
Total Shares
Demat Physical Total % of Total
Shares
ii. Overseas Corporate Bodies
- - - - - - - - -
iii. Foreign Nationals 500 0 500 0.00 500 0 500 0.00 0.00
iv. Clearing Members 3578 0 3578 0.01 1725 0 1725 0.00 (0.01)
v. Foreign Company 1901342 0 1901342 7.88 1901342 0 1901342 7.88 0.00
vi. Foreign Portfolio Investors
1242501 0 1242501 5.15 1610794 0 1610794 6.67 1.52
vii. Trusts 3586 0 3586 0.01 3586 0 3586 0.01 0.00
viii. HUFs 627621 0 627621 2.60 680943 0 680943 2.82 0.22
ix. Unclaimed Suspense Account
- - - - 9471 0 9471 0.04 0.04
Sub-total (B)(2): 8542312 32975 8575287 35.52 8607559 21043 8628602 35.75 0.23
Total Public Shareholding(B) = (B) (1)+(B) (2)
10790771 32975 10823746 44.84 10902703 21043 10923746 45.26 0.42
C. Shares held by Custodian for GDRs & ADRs
- - - - - - - - -
Grand Total (A+B+C) 24103399 32975 24136374 100.00 24115331 21043 24136374 100.00 -
Sl. No.
Shareholders’ Name Category Shareholding at the beginning of the year
Shareholding at the end of the year
% change in shareholding during
the year
No. of Shares
% of total Shares of the
Company
% of Shares
Pledged/encum-bered
to total shares
No. of Shares
% of total Shares of the
Company
% of Shares
Pledged/encum-bered
to total shares
1 Mr. Saurabh Mittal Promoter 3306534 13.70 - 3206534 13.29 - (0.41)
2 Mr. Shiv Prakash Mittal Promoter Group 506000 2.10 - 506000 2.10 - 0.00
3 Ms. Parul Mittal Promoter Group 478800 1.98 - 478800 1.98 - 0.00
4 Ms. Santosh Mittal Promoter Group 55180 0.23 - 55180 0.23 - 0.00
5 Greenply Leasing & Finance Private Limited
Promoter Group 2724481 11.29 - 2724481 11.29 - 0.00
6 S. M. Management Private Limited
Promoter Group 3543462 14.68 - 3543462 14.68 - 0.00
7 Prime Holdings Private Limited
Promoter Group 2408560 9.98 - 2408560 9.98 - 0.00
8 Vanashree Properties Private Limited
Promoter Group 289611 1.20 - 289611 1.20 - 0.00
B. Shareholding of Promoters & Promoter Group:
Sl. No.
Particulars Category Shareholding at the beginning of the year
Cumulative Shareholding during the year
No. of Shares % of totalshares of the
Company
No. of Shares % of totalshares of the
Company
1 Mr. Saurabh Mittal Promoter
At the beginning of the year 3306534 13.70 3306534 13.70
Changes during the year :
On 23.02.2017 sold 100,000 equity shares in open market.
- - 3206534 13.29
At the end of the year 3206534 13.29
C. Change in Promoters & Promoter Group Shareholding:
Annual Report 2016-17 l 57
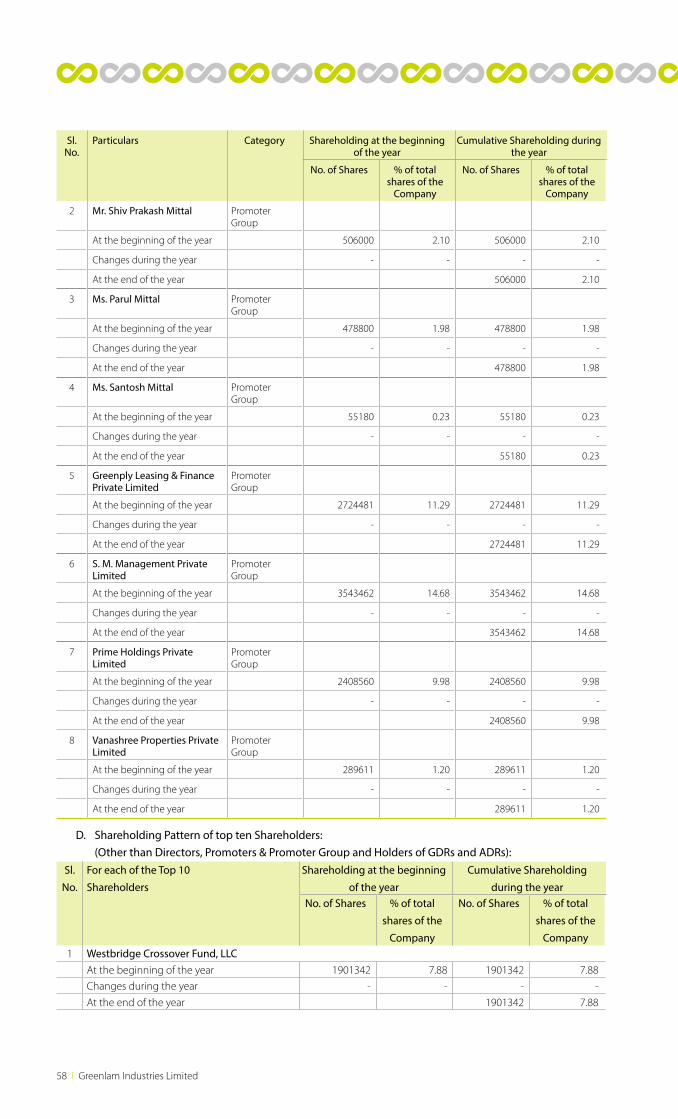
Sl. No.
Particulars Category Shareholding at the beginning of the year
Cumulative Shareholding during the year
No. of Shares % of totalshares of the
Company
No. of Shares % of totalshares of the
Company
2 Mr. Shiv Prakash Mittal Promoter Group
At the beginning of the year 506000 2.10 506000 2.10
Changes during the year - - - -
At the end of the year 506000 2.10
3 Ms. Parul Mittal Promoter Group
At the beginning of the year 478800 1.98 478800 1.98
Changes during the year - - - -
At the end of the year 478800 1.98
4 Ms. Santosh Mittal Promoter Group
At the beginning of the year 55180 0.23 55180 0.23
Changes during the year - - - -
At the end of the year 55180 0.23
5 Greenply Leasing & Finance Private Limited
Promoter Group
At the beginning of the year 2724481 11.29 2724481 11.29
Changes during the year - - - -
At the end of the year 2724481 11.29
6 S. M. Management Private Limited
Promoter Group
At the beginning of the year 3543462 14.68 3543462 14.68
Changes during the year - - - -
At the end of the year 3543462 14.68
7 Prime Holdings Private Limited
Promoter Group
At the beginning of the year 2408560 9.98 2408560 9.98
Changes during the year - - - -
At the end of the year 2408560 9.98
8 Vanashree Properties Private Limited
Promoter Group
At the beginning of the year 289611 1.20 289611 1.20
Changes during the year - - - -
At the end of the year 289611 1.20
Sl.
No.
For each of the Top 10
Shareholders
Shareholding at the beginning
of the year
Cumulative Shareholding
during the yearNo. of Shares % of total
shares of the
Company
No. of Shares % of total
shares of the
Company1 Westbridge Crossover Fund, LLC
At the beginning of the year 1901342 7.88 1901342 7.88
Changes during the year - - - -
At the end of the year 1901342 7.88
D. Shareholding Pattern of top ten Shareholders: (Other than Directors, Promoters & Promoter Group and Holders of GDRs and ADRs):
58 l Greenlam Industries Limited
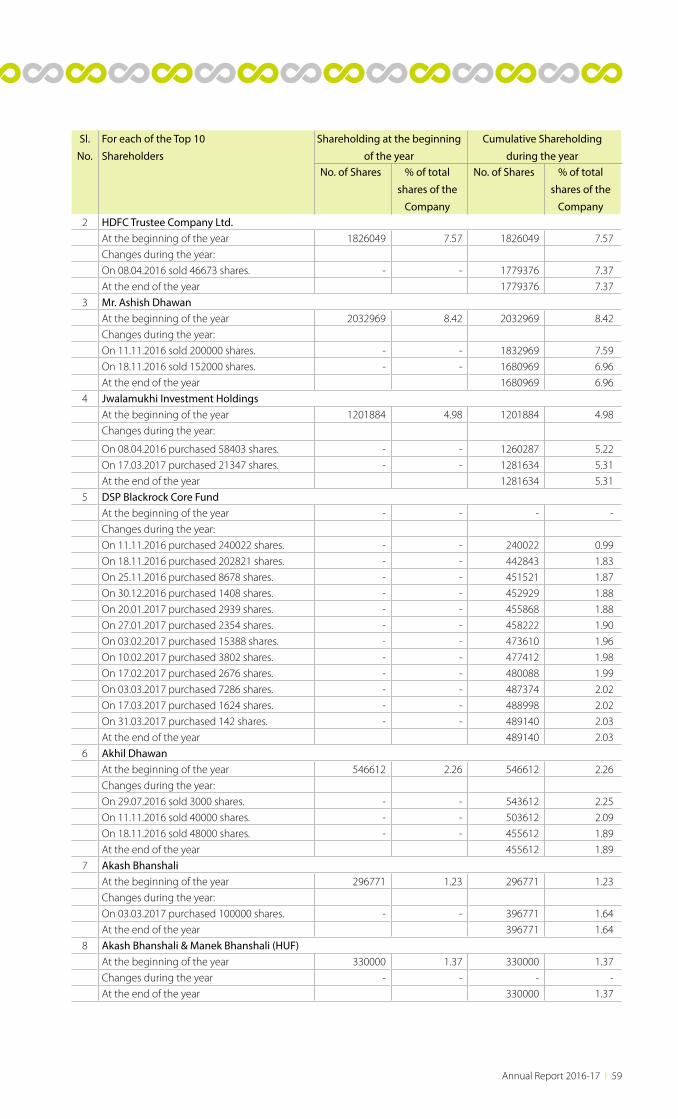
Sl.
No.
For each of the Top 10
Shareholders
Shareholding at the beginning
of the year
Cumulative Shareholding
during the yearNo. of Shares % of total
shares of the
Company
No. of Shares % of total
shares of the
Company2 HDFC Trustee Company Ltd.
At the beginning of the year 1826049 7.57 1826049 7.57
Changes during the year:
On 08.04.2016 sold 46673 shares. - - 1779376 7.37
At the end of the year 1779376 7.37
3 Mr. Ashish DhawanAt the beginning of the year 2032969 8.42 2032969 8.42
Changes during the year:
On 11.11.2016 sold 200000 shares. - - 1832969 7.59
On 18.11.2016 sold 152000 shares. - - 1680969 6.96
At the end of the year 1680969 6.96
4 Jwalamukhi Investment HoldingsAt the beginning of the year 1201884 4.98 1201884 4.98
Changes during the year:
On 08.04.2016 purchased 58403 shares. - - 1260287 5.22
On 17.03.2017 purchased 21347 shares. - - 1281634 5.31
At the end of the year 1281634 5.31
5 DSP Blackrock Core FundAt the beginning of the year - - - -
Changes during the year:
On 11.11.2016 purchased 240022 shares. - - 240022 0.99
On 18.11.2016 purchased 202821 shares. - - 442843 1.83
On 25.11.2016 purchased 8678 shares. - - 451521 1.87
On 30.12.2016 purchased 1408 shares. - - 452929 1.88
On 20.01.2017 purchased 2939 shares. - - 455868 1.88
On 27.01.2017 purchased 2354 shares. - - 458222 1.90
On 03.02.2017 purchased 15388 shares. - - 473610 1.96
On 10.02.2017 purchased 3802 shares. - - 477412 1.98
On 17.02.2017 purchased 2676 shares. - - 480088 1.99
On 03.03.2017 purchased 7286 shares. - - 487374 2.02
On 17.03.2017 purchased 1624 shares. - - 488998 2.02
On 31.03.2017 purchased 142 shares. - - 489140 2.03
At the end of the year 489140 2.03
6 Akhil DhawanAt the beginning of the year 546612 2.26 546612 2.26
Changes during the year:
On 29.07.2016 sold 3000 shares. - - 543612 2.25
On 11.11.2016 sold 40000 shares. - - 503612 2.09
On 18.11.2016 sold 48000 shares. - - 455612 1.89
At the end of the year 455612 1.89
7 Akash BhanshaliAt the beginning of the year 296771 1.23 296771 1.23
Changes during the year:
On 03.03.2017 purchased 100000 shares. - - 396771 1.64
At the end of the year 396771 1.64
8 Akash Bhanshali & Manek Bhanshali (HUF)At the beginning of the year 330000 1.37 330000 1.37
Changes during the year - - - -
At the end of the year 330000 1.37
Annual Report 2016-17 l 59
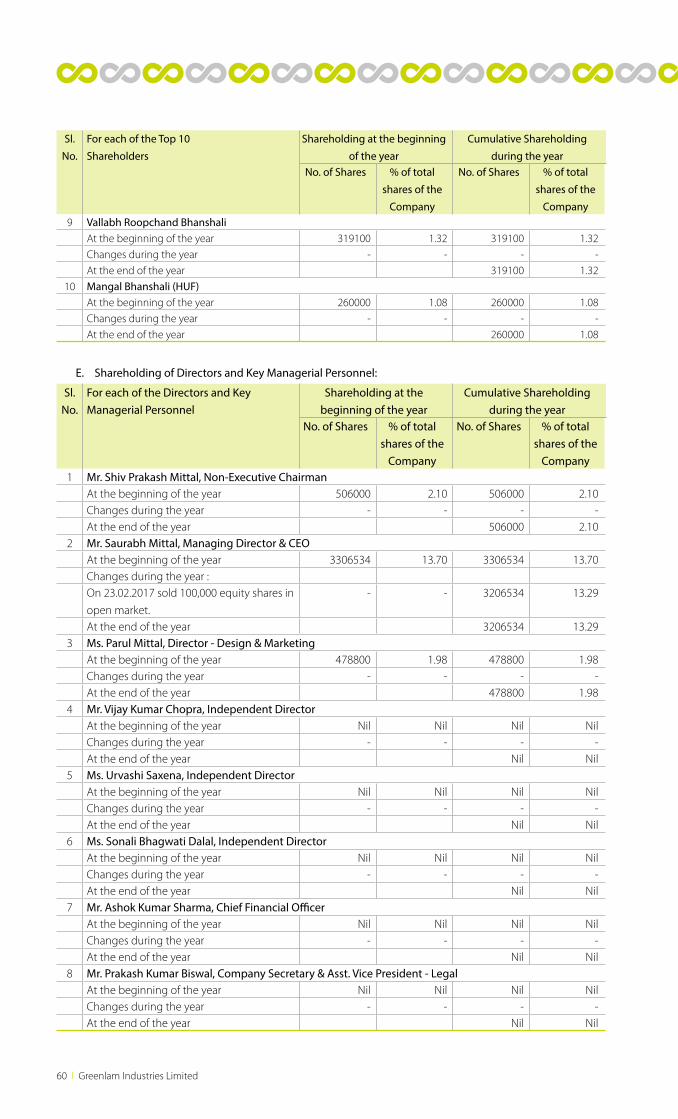
Sl.
No.
For each of the Top 10
Shareholders
Shareholding at the beginning
of the year
Cumulative Shareholding
during the yearNo. of Shares % of total
shares of the
Company
No. of Shares % of total
shares of the
Company9 Vallabh Roopchand Bhanshali
At the beginning of the year 319100 1.32 319100 1.32
Changes during the year - - - -
At the end of the year 319100 1.32
10 Mangal Bhanshali (HUF)At the beginning of the year 260000 1.08 260000 1.08
Changes during the year - - - -
At the end of the year 260000 1.08
Sl. No.
For each of the Directors and Key Managerial Personnel
Shareholding at the beginning of the year
Cumulative Shareholding during the year
No. of Shares % of totalshares of the
Company
No. of Shares % of totalshares of the
Company1 Mr. Shiv Prakash Mittal, Non-Executive Chairman
At the beginning of the year 506000 2.10 506000 2.10Changes during the year - - - -At the end of the year 506000 2.10
2 Mr. Saurabh Mittal, Managing Director & CEOAt the beginning of the year 3306534 13.70 3306534 13.70Changes during the year :On 23.02.2017 sold 100,000 equity shares in
open market.
- - 3206534 13.29
At the end of the year 3206534 13.293 Ms. Parul Mittal, Director - Design & Marketing
At the beginning of the year 478800 1.98 478800 1.98Changes during the year - - - -At the end of the year 478800 1.98
4 Mr. Vijay Kumar Chopra, Independent DirectorAt the beginning of the year Nil Nil Nil NilChanges during the year - - - -At the end of the year Nil Nil
5 Ms. Urvashi Saxena, Independent DirectorAt the beginning of the year Nil Nil Nil NilChanges during the year - - - -At the end of the year Nil Nil
6 Ms. Sonali Bhagwati Dalal, Independent DirectorAt the beginning of the year Nil Nil Nil NilChanges during the year - - - -At the end of the year Nil Nil
7 Mr. Ashok Kumar Sharma, Chief Financial OfficerAt the beginning of the year Nil Nil Nil NilChanges during the year - - - -At the end of the year Nil Nil
8 Mr. Prakash Kumar Biswal, Company Secretary & Asst. Vice President - LegalAt the beginning of the year Nil Nil Nil NilChanges during the year - - - -At the end of the year Nil Nil
E. Shareholding of Directors and Key Managerial Personnel:
60 l Greenlam Industries Limited
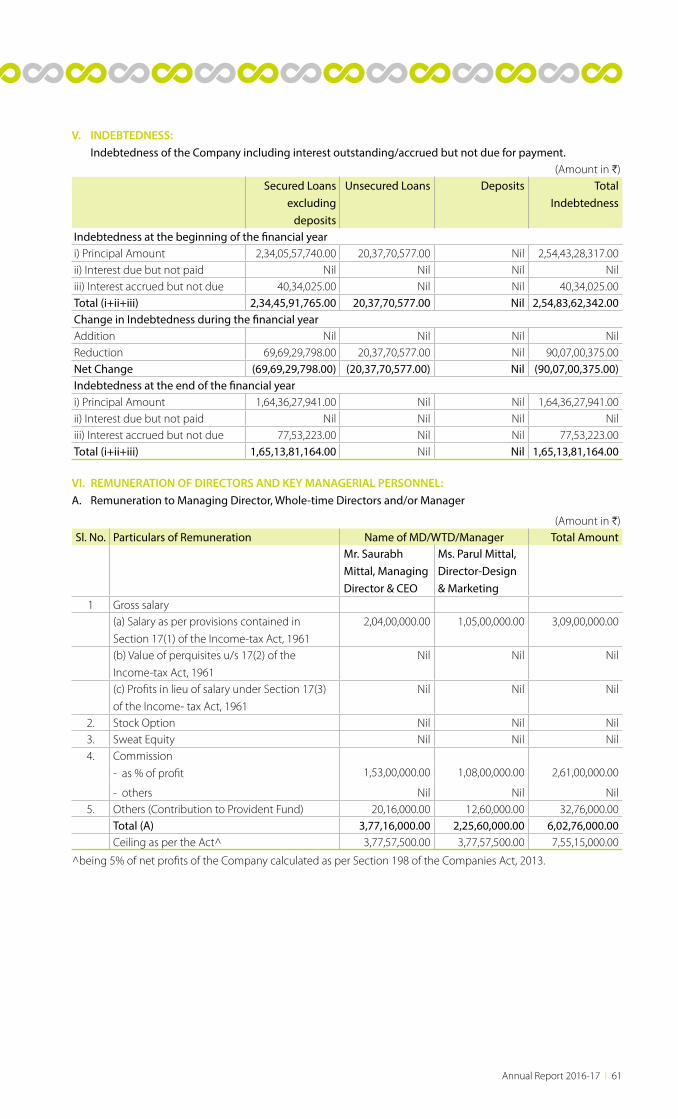
V. INDEBTEDNESS: Indebtedness of the Company including interest outstanding/accrued but not due for payment.
(Amount in H)Secured Loans
excluding deposits
Unsecured Loans Deposits Total Indebtedness
Indebtedness at the beginning of the financial yeari) Principal Amount 2,34,05,57,740.00 20,37,70,577.00 Nil 2,54,43,28,317.00ii) Interest due but not paid Nil Nil Nil Niliii) Interest accrued but not due 40,34,025.00 Nil Nil 40,34,025.00Total (i+ii+iii) 2,34,45,91,765.00 20,37,70,577.00 Nil 2,54,83,62,342.00Change in Indebtedness during the financial yearAddition Nil Nil Nil NilReduction 69,69,29,798.00 20,37,70,577.00 Nil 90,07,00,375.00Net Change (69,69,29,798.00) (20,37,70,577.00) Nil (90,07,00,375.00)Indebtedness at the end of the financial yeari) Principal Amount 1,64,36,27,941.00 Nil Nil 1,64,36,27,941.00ii) Interest due but not paid Nil Nil Nil Niliii) Interest accrued but not due 77,53,223.00 Nil Nil 77,53,223.00Total (i+ii+iii) 1,65,13,81,164.00 Nil Nil 1,65,13,81,164.00
VI. REMUNERATION OF DIRECTORS AND KEY MANAGERIAL PERSONNEL: A. Remuneration to Managing Director, Whole-time Directors and/or Manager
(Amount in H)Sl. No. Particulars of Remuneration Name of MD/WTD/Manager Total Amount
Mr. Saurabh Mittal, Managing Director & CEO
Ms. Parul Mittal, Director-Design & Marketing
1 Gross salary(a) Salary as per provisions contained in
Section 17(1) of the Income-tax Act, 1961
2,04,00,000.00 1,05,00,000.00 3,09,00,000.00
(b) Value of perquisites u/s 17(2) of the
Income-tax Act, 1961
Nil Nil Nil
(c) Profits in lieu of salary under Section 17(3)
of the Income- tax Act, 1961
Nil Nil Nil
2. Stock Option Nil Nil Nil3. Sweat Equity Nil Nil Nil4. Commission
- as % of profit 1,53,00,000.00 1,08,00,000.00 2,61,00,000.00
- others Nil Nil Nil5. Others (Contribution to Provident Fund) 20,16,000.00 12,60,000.00 32,76,000.00
Total (A) 3,77,16,000.00 2,25,60,000.00 6,02,76,000.00Ceiling as per the Act^ 3,77,57,500.00 3,77,57,500.00 7,55,15,000.00
^being 5% of net profits of the Company calculated as per Section 198 of the Companies Act, 2013.
Annual Report 2016-17 l 61
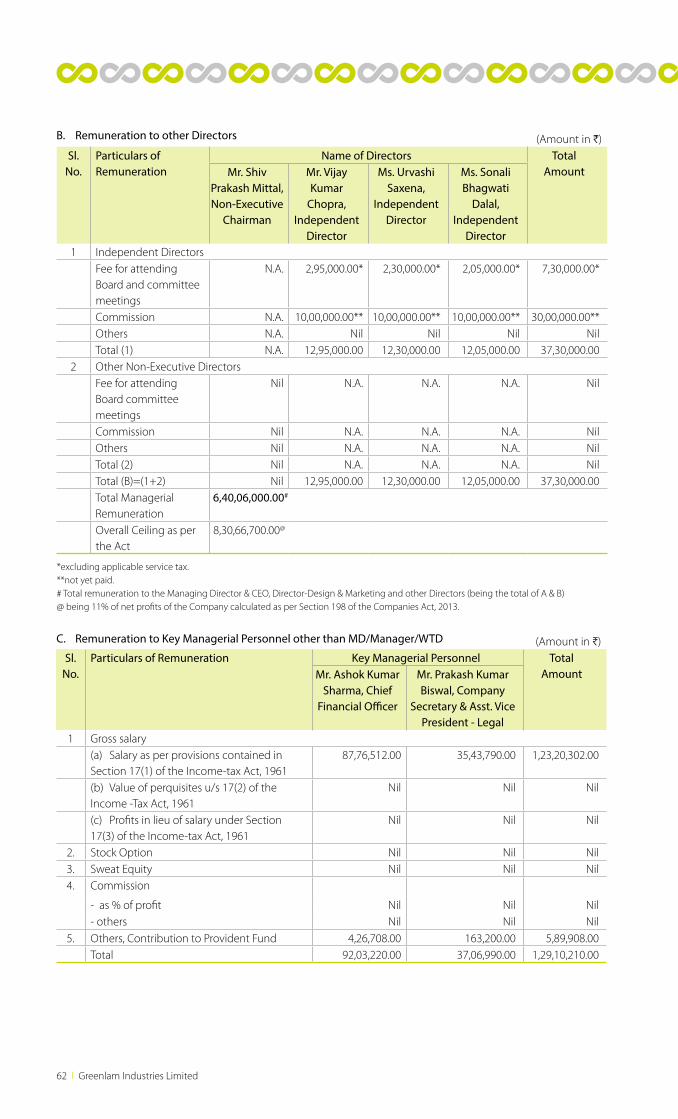
B. Remuneration to other Directors (Amount in H)Sl.
No.Particulars of Remuneration
Name of Directors Total AmountMr. Shiv
Prakash Mittal, Non-Executive
Chairman
Mr. Vijay Kumar
Chopra, Independent
Director
Ms. Urvashi Saxena,
Independent Director
Ms. Sonali Bhagwati
Dalal, Independent
Director1 Independent Directors
Fee for attending Board and committee meetings
N.A. 2,95,000.00* 2,30,000.00* 2,05,000.00* 7,30,000.00*
Commission N.A. 10,00,000.00** 10,00,000.00** 10,00,000.00** 30,00,000.00**Others N.A. Nil Nil Nil NilTotal (1) N.A. 12,95,000.00 12,30,000.00 12,05,000.00 37,30,000.00
2 Other Non-Executive DirectorsFee for attending Board committee meetings
Nil N.A. N.A. N.A. Nil
Commission Nil N.A. N.A. N.A. NilOthers Nil N.A. N.A. N.A. NilTotal (2) Nil N.A. N.A. N.A. NilTotal (B)=(1+2) Nil 12,95,000.00 12,30,000.00 12,05,000.00 37,30,000.00Total ManagerialRemuneration
6,40,06,000.00#
Overall Ceiling as per the Act
8,30,66,700.00@
*excluding applicable service tax.**not yet paid.# Total remuneration to the Managing Director & CEO, Director-Design & Marketing and other Directors (being the total of A & B)@ being 11% of net profits of the Company calculated as per Section 198 of the Companies Act, 2013.
(Amount in H)Sl.
No.Particulars of Remuneration Key Managerial Personnel Total
AmountMr. Ashok Kumar Sharma, Chief
Financial Officer
Mr. Prakash Kumar Biswal, Company
Secretary & Asst. Vice President - Legal
1 Gross salary(a) Salary as per provisions contained in Section 17(1) of the Income-tax Act, 1961
87,76,512.00 35,43,790.00 1,23,20,302.00
(b) Value of perquisites u/s 17(2) of the Income -Tax Act, 1961
Nil Nil Nil
(c) Profits in lieu of salary under Section 17(3) of the Income-tax Act, 1961
Nil Nil Nil
2. Stock Option Nil Nil Nil3. Sweat Equity Nil Nil Nil4. Commission
- as % of profit Nil Nil Nil- others Nil Nil Nil
5. Others, Contribution to Provident Fund 4,26,708.00 163,200.00 5,89,908.00Total 92,03,220.00 37,06,990.00 1,29,10,210.00
C. Remuneration to Key Managerial Personnel other than MD/Manager/WTD
62 l Greenlam Industries Limited
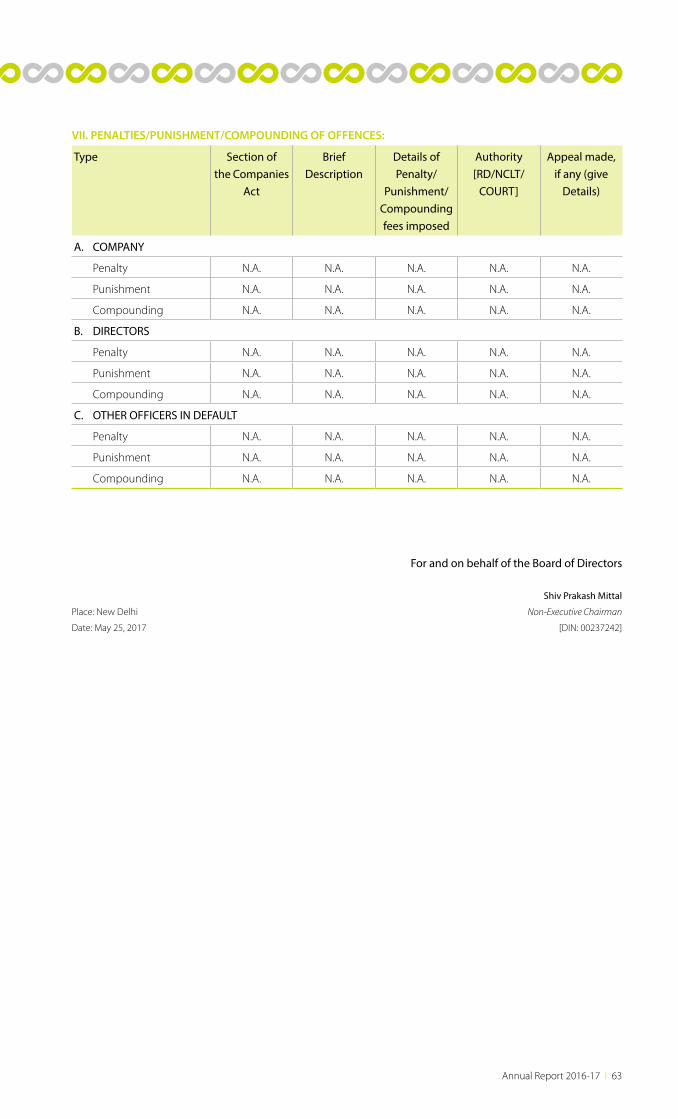
Type Section ofthe Companies
Act
BriefDescription
Details of Penalty/
Punishment/ Compoundingfees imposed
Authority[RD/NCLT/
COURT]
Appeal made, if any (give
Details)
A. COMPANY
Penalty N.A. N.A. N.A. N.A. N.A.
Punishment N.A. N.A. N.A. N.A. N.A.
Compounding N.A. N.A. N.A. N.A. N.A.
B. DIRECTORS
Penalty N.A. N.A. N.A. N.A. N.A.
Punishment N.A. N.A. N.A. N.A. N.A.
Compounding N.A. N.A. N.A. N.A. N.A.
C. OTHER OFFICERS IN DEFAULT
Penalty N.A. N.A. N.A. N.A. N.A.
Punishment N.A. N.A. N.A. N.A. N.A.
Compounding N.A. N.A. N.A. N.A. N.A.
VII. PENALTIES/PUNISHMENT/COMPOUNDING OF OFFENCES:
For and on behalf of the Board of Directors
Shiv Prakash Mittal
Place: New Delhi Non-Executive Chairman
Date: May 25, 2017 [DIN: 00237242]
Annual Report 2016-17 l 63
Information required under Section 134(3)(m) of the Companies Act, 2013 read with Rule 8(3) of the Companies (Accounts) Rules, 2014 pertaining to Conservation
of Energy, Technology Absorption, Foreign Exchange Earnings and Outgo
Annexure-VI
(A) Conservation of Energy (i) Steps taken or impact on conservation of energy: The CPF 160 boiler’s feed pump system
was modified by replacing the existing old design 30 KW pump by an 18.5 KW pumping system which resulted in an annual electrical energy saving of 37,000 KWH.
CPF 160 & QT 60 heating systems are attempted for Automation by installing Oxygen Analysers and synchronising the burner with the fuel feeding system with the analyser. The returns on the investment would be in less than a year and would result in huge energy and fuel saving.
VFDs have been installed on the IDs, FDs and Screw Feeder of the thermic fluid system as well as the High Pressure Hot water system which effectively caused auto cutoffs and resulted in a saving of 26,000 KWH of electric power per annum.
Cooling towers have been integrated with PID controllers which resulted in an energy saving of 19,396 KWH of electric power.
Veneers Press Circulating pump has been replaced by a 7.5 KW pump in place of the old designed 15 KW pump. The resultant energy savings on this account was 48,000 KWH.
Damaged insulation was replaced on the hot water and oil lines. This resulted in an annual saving of 85 MT of fuel.
Replacement of conventional street lights with LEDs continued. This has further yielded an energy saving of 15,120 KWH.
Cooling pumps on press no. 4 have been replaced by energy efficient low capacity pumps. The net energy saving envisaged is 13,406 KWH. This exercise will be carried out in a phased manned on all the presses during the current year.
Laminate and Veneer scrap/waste is fired in boiler. This is expected to yield a fuel savings and same would be summarized upon stabilization.
The manufacturing plants continue to
Reuse the RO reject waters for
flushing, cleaning, ash quenching, dust quenching and floor washing purposes
Using STP waters for gardening purposes
The water conservation from these practises are 14,600 KL per annum
(ii) Steps taken for utilising alternate sources of energy:
Exploring the feasibility of converting certain process equipment and lighting and power system in the housing colony to run on solar energy.
(iii) Capital Investment on energy conservation equipment: Nil
(B) Technology Absorption: i. Efforts made towards technology absorption: a. Newer products like AFX, ESD, HD Gloss
have been successfully launched in India and abroad. The manufacturing techniques involve adoption of modern technologies and equipment to accomplish the world class standards.
b. A new texture named “Synchronized” Olmo & Freshno have been developed and introduced and the technique used to make the product is special and different from the conventional textures.
c. The plants have improved the cutting system in order to ensure full consistency of smoothness and rectangularity in the product.
d. There have been sustained and continuous efforts in cost reduction, product presentation and customer support services. The focus is fully on customer orientation and satisfaction.
ii. Benefits derived like product improvement, cost reduction, product development or import substitution:
a. The process efficiencies have been improved by installing rotary cutters on impregnation machines whereby the productivity got enhanced apart from a further drop in process wastages by 0.2%.
64 l Greenlam Industries Limited
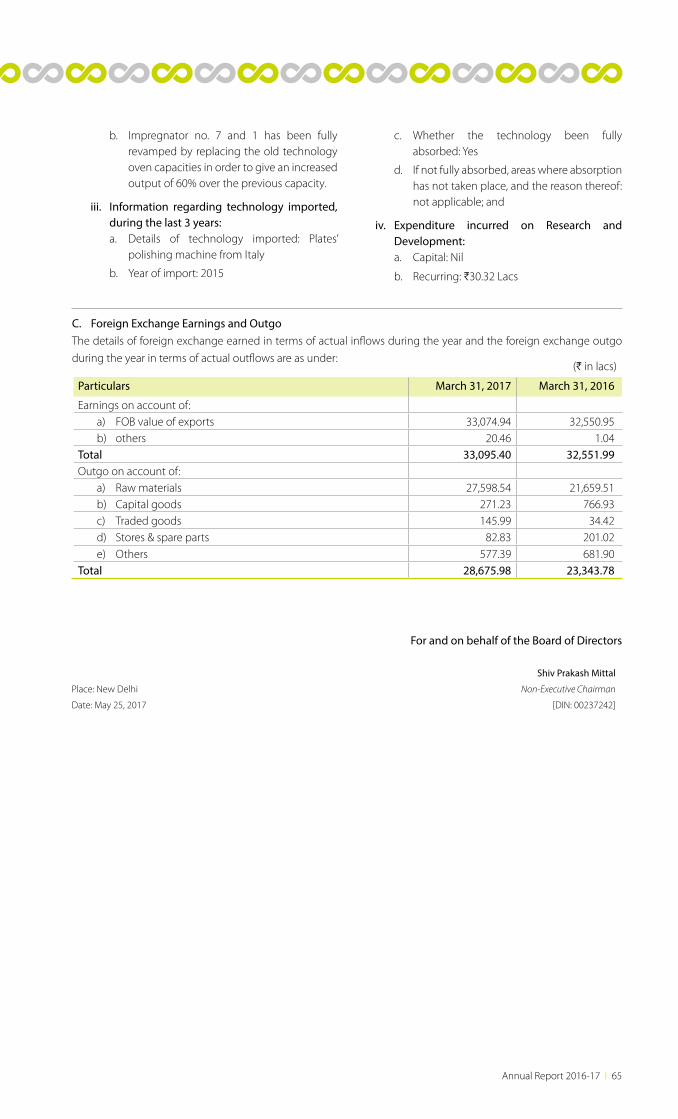
b. Impregnator no. 7 and 1 has been fully revamped by replacing the old technology oven capacities in order to give an increased output of 60% over the previous capacity.
iii. Information regarding technology imported, during the last 3 years:
a. Details of technology imported: Plates’ polishing machine from Italy
b. Year of import: 2015
c. Whether the technology been fully absorbed: Yes
d. If not fully absorbed, areas where absorption has not taken place, and the reason thereof: not applicable; and
iv. Expenditure incurred on Research and Development:
a. Capital: Nil
b. Recurring: H30.32 Lacs
(H in lacs)
Particulars March 31, 2017 March 31, 2016
Earnings on account of: a) FOB value of exports 33,074.94 32,550.95 b) others 20.46 1.04Total 33,095.40 32,551.99Outgo on account of: a) Raw materials 27,598.54 21,659.51 b) Capital goods 271.23 766.93 c) Traded goods 145.99 34.42 d) Stores & spare parts 82.83 201.02 e) Others 577.39 681.90Total 28,675.98 23,343.78
C. Foreign Exchange Earnings and Outgo The details of foreign exchange earned in terms of actual inflows during the year and the foreign exchange outgo
during the year in terms of actual outflows are as under:
For and on behalf of the Board of Directors
Shiv Prakash Mittal
Place: New Delhi Non-Executive Chairman
Date: May 25, 2017 [DIN: 00237242]
Annual Report 2016-17 l 65
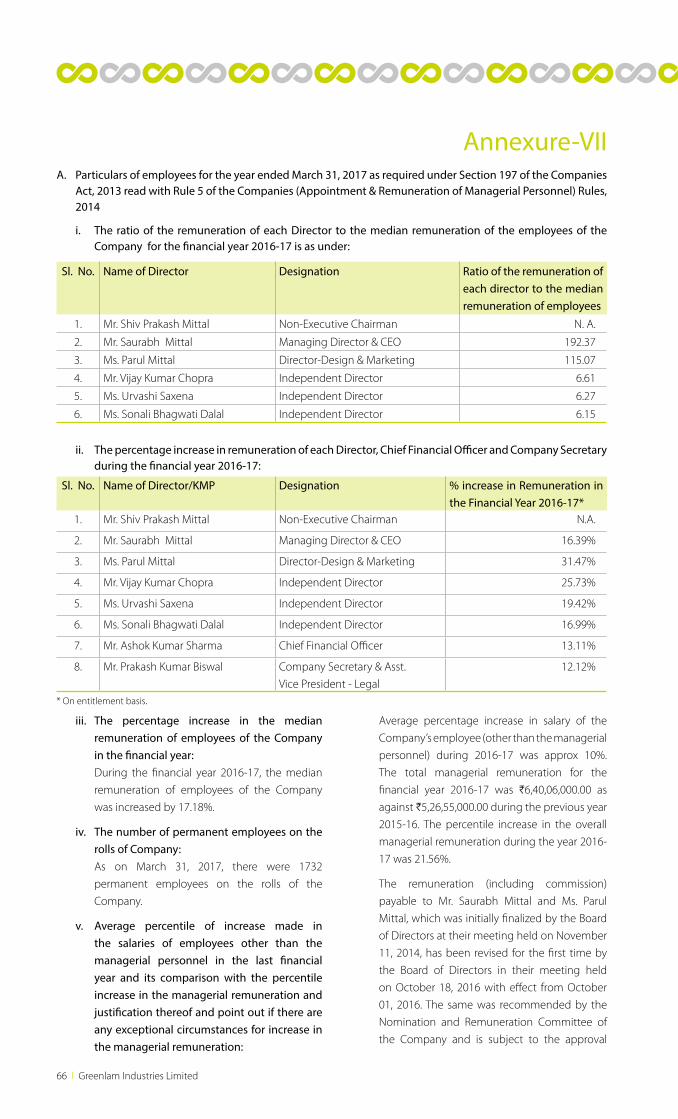
A. Particulars of employees for the year ended March 31, 2017 as required under Section 197 of the Companies Act, 2013 read with Rule 5 of the Companies (Appointment & Remuneration of Managerial Personnel) Rules, 2014
i. The ratio of the remuneration of each Director to the median remuneration of the employees of the Company for the financial year 2016-17 is as under:
ii. The percentage increase in remuneration of each Director, Chief Financial Officer and Company Secretary during the financial year 2016-17:
Annexure-VII
Sl. No. Name of Director Designation Ratio of the remuneration of each director to the median remuneration of employees
1. Mr. Shiv Prakash Mittal Non-Executive Chairman N. A.
2. Mr. Saurabh Mittal Managing Director & CEO 192.37
3. Ms. Parul Mittal Director-Design & Marketing 115.07
4. Mr. Vijay Kumar Chopra Independent Director 6.61
5. Ms. Urvashi Saxena Independent Director 6.27
6. Ms. Sonali Bhagwati Dalal Independent Director 6.15
Sl. No. Name of Director/KMP Designation % increase in Remuneration in the Financial Year 2016-17*
1. Mr. Shiv Prakash Mittal Non-Executive Chairman N.A.
2. Mr. Saurabh Mittal Managing Director & CEO 16.39%
3. Ms. Parul Mittal Director-Design & Marketing 31.47%
4. Mr. Vijay Kumar Chopra Independent Director 25.73%
5. Ms. Urvashi Saxena Independent Director 19.42%
6. Ms. Sonali Bhagwati Dalal Independent Director 16.99%
7. Mr. Ashok Kumar Sharma Chief Financial Officer 13.11%
8. Mr. Prakash Kumar Biswal Company Secretary & Asst.
Vice President - Legal
12.12%
* On entitlement basis.
iii. The percentage increase in the median remuneration of employees of the Company in the financial year:
During the financial year 2016-17, the median
remuneration of employees of the Company
was increased by 17.18%.
iv. The number of permanent employees on the rolls of Company:
As on March 31, 2017, there were 1732
permanent employees on the rolls of the
Company.
v. Average percentile of increase made in the salaries of employees other than the managerial personnel in the last financial year and its comparison with the percentile increase in the managerial remuneration and justification thereof and point out if there are any exceptional circumstances for increase in the managerial remuneration:
Average percentage increase in salary of the
Company’s employee (other than the managerial
personnel) during 2016-17 was approx 10%.
The total managerial remuneration for the
financial year 2016-17 was H6,40,06,000.00 as
against H5,26,55,000.00 during the previous year
2015-16. The percentile increase in the overall
managerial remuneration during the year 2016-
17 was 21.56%.
The remuneration (including commission)
payable to Mr. Saurabh Mittal and Ms. Parul
Mittal, which was initially finalized by the Board
of Directors at their meeting held on November
11, 2014, has been revised for the first time by
the Board of Directors in their meeting held
on October 18, 2016 with effect from October
01, 2016. The same was recommended by the
Nomination and Remuneration Committee of
the Company and is subject to the approval
66 l Greenlam Industries Limited
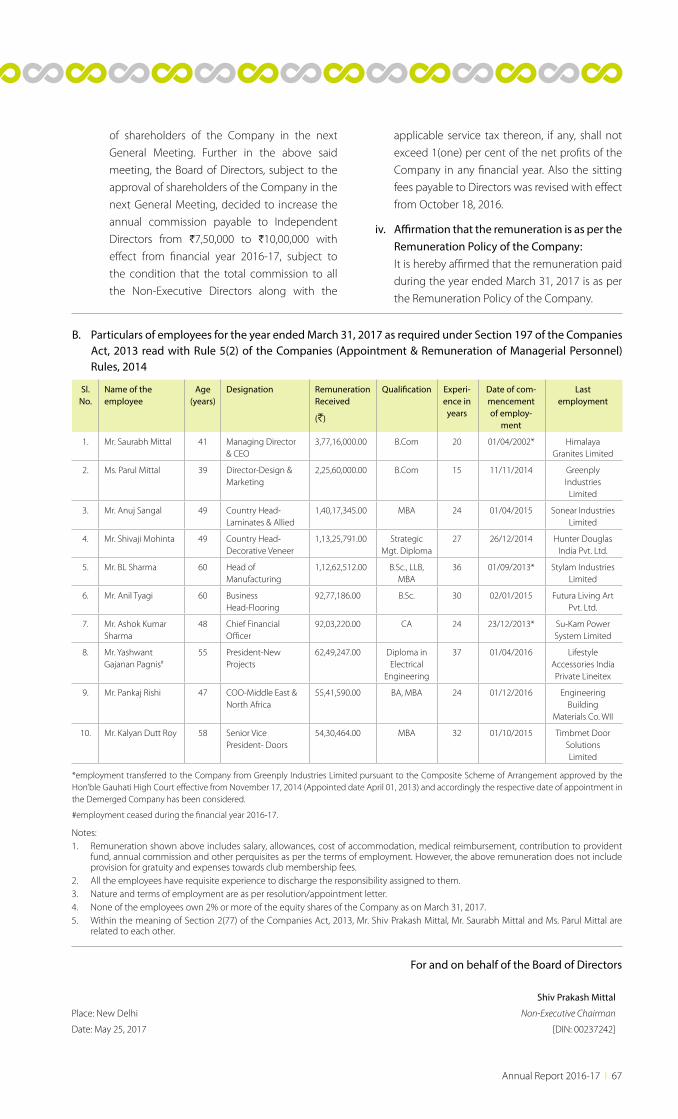
B. Particulars of employees for the year ended March 31, 2017 as required under Section 197 of the Companies Act, 2013 read with Rule 5(2) of the Companies (Appointment & Remuneration of Managerial Personnel) Rules, 2014
of shareholders of the Company in the next
General Meeting. Further in the above said
meeting, the Board of Directors, subject to the
approval of shareholders of the Company in the
next General Meeting, decided to increase the
annual commission payable to Independent
Directors from H7,50,000 to H10,00,000 with
effect from financial year 2016-17, subject to
the condition that the total commission to all
the Non-Executive Directors along with the
applicable service tax thereon, if any, shall not
exceed 1(one) per cent of the net profits of the
Company in any financial year. Also the sitting
fees payable to Directors was revised with effect
from October 18, 2016.
iv. Affirmation that the remuneration is as per the Remuneration Policy of the Company:
It is hereby affirmed that the remuneration paid
during the year ended March 31, 2017 is as per
the Remuneration Policy of the Company.
Sl. No.
Name of the employee
Age(years)
Designation Remuneration Received
(H)
Qualification Experi-ence in years
Date of com-mencement of employ-
ment
Last employment
1. Mr. Saurabh Mittal 41 Managing Director & CEO
3,77,16,000.00 B.Com 20 01/04/2002* Himalaya Granites Limited
2. Ms. Parul Mittal 39 Director-Design & Marketing
2,25,60,000.00 B.Com 15 11/11/2014 Greenply Industries Limited
3. Mr. Anuj Sangal 49 Country Head- Laminates & Allied
1,40,17,345.00 MBA 24 01/04/2015 Sonear Industries Limited
4. Mr. Shivaji Mohinta 49 Country Head-Decorative Veneer
1,13,25,791.00 Strategic Mgt. Diploma
27 26/12/2014 Hunter Douglas India Pvt. Ltd.
5. Mr. BL Sharma 60 Head of Manufacturing
1,12,62,512.00 B.Sc., LLB, MBA
36 01/09/2013* Stylam Industries Limited
6. Mr. Anil Tyagi 60 Business Head-Flooring
92,77,186.00 B.Sc. 30 02/01/2015 Futura Living Art Pvt. Ltd.
7. Mr. Ashok Kumar Sharma
48 Chief Financial Officer
92,03,220.00 CA 24 23/12/2013* Su-Kam Power System Limited
8. Mr. Yashwant Gajanan Pagnis#
55 President-New Projects
62,49,247.00 Diploma in Electrical
Engineering
37 01/04/2016 Lifestyle Accessories India Private Lineitex
9. Mr. Pankaj Rishi 47 COO-Middle East & North Africa
55,41,590.00 BA, MBA 24 01/12/2016 Engineering Building
Materials Co. WII
10. Mr. Kalyan Dutt Roy 58 Senior Vice President- Doors
54,30,464.00 MBA 32 01/10/2015 Timbmet Door Solutions Limited
*employment transferred to the Company from Greenply Industries Limited pursuant to the Composite Scheme of Arrangement approved by the Hon’ble Gauhati High Court effective from November 17, 2014 (Appointed date April 01, 2013) and accordingly the respective date of appointment in the Demerged Company has been considered.
#employment ceased during the financial year 2016-17.
Notes:1. Remuneration shown above includes salary, allowances, cost of accommodation, medical reimbursement, contribution to provident
fund, annual commission and other perquisites as per the terms of employment. However, the above remuneration does not include provision for gratuity and expenses towards club membership fees.
2. All the employees have requisite experience to discharge the responsibility assigned to them.3. Nature and terms of employment are as per resolution/appointment letter.4. None of the employees own 2% or more of the equity shares of the Company as on March 31, 2017.5. Within the meaning of Section 2(77) of the Companies Act, 2013, Mr. Shiv Prakash Mittal, Mr. Saurabh Mittal and Ms. Parul Mittal are
related to each other.
For and on behalf of the Board of Directors
Shiv Prakash Mittal
Place: New Delhi Non-Executive Chairman
Date: May 25, 2017 [DIN: 00237242]
Annual Report 2016-17 l 67
Management discussion and analysis
The pace of global economic activity was mixed in 2016
as a number of crosswinds affected re-acceleration.
Within advanced economies, comprising the US,
Europe and Japan, the lingering legacies of the recent
crisis, coupled with protracted monetary policy support
and return to fiscal neutrality, underpinned a generally-
accelerating output with falling unemployment. In
countries outside the advanced economies, the sources
of slower growth ranged from commodity price
declines to overhangs from past rapid credit growth to
political turmoil.
Resultantly, global growth was projected to slow to 3.1%
in 2016 before recovering to 3.4% in 2017. The forecast
was revised down by 0.1 percentage point for 2017
compared to the April 2016 projections. This reflected a
more subdued outlook following the Brexit referendum
and weaker-than-expected growth in the US.
The long-term prospects of emerging market
economies have improved on the back of a visible
lowering of interest rates in advanced economies and
firming of commodity prices. Asia in general and India
in particular has demonstrated robust growth while
sub-Saharan Africa has experienced a sharp slowdown.
(Sources: IMF and World Bank)
Among advanced economies, activity rebounded
strongly in the US and the economy is approaching full
employment. Long-term nominal and real interest rates
have risen in the UK and in the US since the November
2016 Presidential election. The currencies of advanced
commodity exporters have also strengthened, reflecting
the firming of commodity prices; however, several
emerging market currencies depreciated substantially.
Interestingly, with China reorienting itself into a
consumption-centric economy and Saudi Arabia
reducing its dependence on oil, the case for base metals
has strengthened, which, in turn, has propped up
commodity prices. Consequently, inflation rates have
recovered across advanced economies and commodity
prices have bottomed out in recent months.
OutlookThe global economy has entered its sixth year of
stagnation with growth estimates for 2017 continuing
to trend the historical path. A projected stabilisation
in energy and commodity prices may provide some
respite for resource-rich economies in 2017. However,
the medium-term outlook continues to be bleak with
growth weakening in terms of investments and labour
supply. Businesses will need to prepare themselves
adequately in order to address the challenges arising
from geopolitical tensions, policy uncertainties,
financial market volatilities and rapid technological
advancements.
Global economic overview
Growth
2016 (projected)
2017 (projected)
2018 (expected)
Global economy 3.1% 3.4% 3.6%
Advanced economies 1.6% 1.9% 2.0%
Emerging market and developing economies 4.1% 4.5% 4.8%
(Source: IMF)
68 l Greenlam Industries Limited
India’s GDP growth was projected at 7.1% for the fiscal
2016-17 (CSO), down from the 7.6% recorded in 2015-
16. Although demonetisation affected the GDP growth
rate by 100 bps, the governmental initiative of removing
specified bank notes from circulation is expected to have
long-term benefits. (Source: http://www.livemint.com/
Politics/RNFrr6eVDZpIyMDCRm5UdN/IMF-downgrades-
Indias-201617-GDP-growth-forecast-to-66.html)
The growth rate of the industrial sector (measured in the
index of industrial production or IIP) was estimated to
moderate to 5.2% in 2016-17, down from 7.4% in 2015-
16. The country’s IIP registered a modest growth of 0.4%
during the April-November period of 2016-17. With
Rajasthan, Madhya Pradesh and Maharashtra receiving
20% more rainfall than the usual, the agricultural sector
is expected to grow at an above-average level of 4% on
a weak base, caused by two consecutive periods of poor
monsoons. This should lift the sagging rural demand
and, by extension, the GDP growth rate. The major
impetus is expected to come from the farm sector as
non-agriculture growth is pegged to pick up by 10 bps
over the previous fiscal to 8.6%.
To boost the rural economy, the Budget 2017-18 set
aside H48,000 crore for MGNREGA (Mahatma Gandhi
National Rural Employment Guarantee Act, 2005) to
provide a shot in the arm to the skills development
sector, enhancing disposable incomes, giving a boost
to consumption and accelerating the overall rural
economic growth.
OutlookThe long-term growth outlook for India seems bright.
Nonetheless, the growth forecast for the next fiscal
has been trimmed by 40 bps. This has been primarily
due to the temporary negative consumption shock
induced by cash shortages and payment disruptions
associated with the recent currency note withdrawal
and exchange initiative. Subsequently, India’s GVA
(gross value-added) growth is likely to remain at 6.6%
as economic activity will take more time to normalise.
However, the imminent implementation of the GST
(Goods and Services Tax) is expected to boost interstate
trade by ushering in investments, reducing supply
chain-related issues, improving economies-of-scale and
cutting down overheads (Sources: IMF, ICRA).
Indian economy overview
Smart cities The Indian government launched the ‘Smart Cities’
initiative in collaboration with states and union
territories. The objective of the mission is to propel
urban growth through an infrastructure overhaul.
It intends to drive economic growth and improve
the living standards of people by enabling local area
development through harnessing technology. The
central focus of the Smart Cities mission is anchored
on city improvement (retrofitting) and city extension
(greenfield development). This initiative will cover 100
cities and is expected to be implemented as a centrally
sponsored scheme with the union government
allocating H48,000 crore over five years. In the first phase,
20 cities have been shortlisted for their transformation
into a smart city.
Make in IndiaThe ‘Make in India’ initiative was launched with the
objective of making India a global manufacturing hub.
The initiative is expected to boost entrepreneurship in
manufacturing, services and infrastructure sectors. The
Indian Government set up ‘Invest India’ as a national
investment promotion and facilitation agency under
the initiative. In addition, a full-fledged investment
facilitation cell has also been set-up primarily to support
all investment queries as well as to handhold and liaise
with various agencies on behalf of potential investors.
Ease of doing business (EoDB):
The government’s EoDB initiative is aimed at improving
the business environment in India. Under this initiative,
the government has sought to amend several laws
towards easing the process of starting and running a
business. Some of the key measures undertaken include:
online application for industrial licenses, restriction of
the documents required for export and import activities,
removal of requirements for minimum paid-up capital
for companies, granting of security clearances on an
industrial license within 12 weeks and establishment of
a facilitation cell under Invest India, among others.
Indian government initiatives to boost economic growth
Annual Report 2016-17 l 69
Overview
The Indian furniture industry is one of the fast growing
sectors in the world. Steady growth of the Indian
economy, real estate/hospitality sectors boom, increase
in spending power coupled with lifestyle changes
have fuelled the growth of the furniture market in the
country. The Indian furniture industry is characterized
by a large number of small players, accounting for
nearly 80% of the domestic production. However, with
the onset and growing popularity of the online furniture
market, the industry is likely to witness consolidation,
going forward.
The Indian furniture market, estimated at H720 billion in
2014-15, is forecast to reach H1,510 billion by 2019-20.
The country’s furniture market is primarily concentrated
in the metropolitan and Tier I and II cities with the major
user segments being residential, office, commercial and
institutional. (Source: MCG)
Over the last two decades, the evolution of the housing
furniture market has been gradual but significant; from
product offering, to formats, materials and market
structure, the market has witnessed steady growth
and change. Figures on the actual size of the furniture
market are hazy on account of the fact that a large
proportion of the industry rests in the unorganized
sector, (nearly 80%), with poor accounting standards
and reported turnover. Despite this, the industry itself
is robust and estimated to be growing at over 20% per
annum. (Source: World Bank)
Growth drivers
Fast growing Indian real estate sector:
The Indian real estate market is expected to touch
US$ 180 billion by 2020 with the housing sector alone
contributing about 6% to the country’s GDP. Retail,
hospitality and commercial real estate are also growing
significantly, providing the much-needed infrastructure
for India’s growing needs. Besides, the implementation
of the Real Estate (Regulation and Development) Act,
2016 is expected to usher in a new period for the
country’s real estate industry, bringing in transparency
and discipline and contributing to strengthening
the foundations of the sector for achieving
sustainable growth.
Growing demand for IT office and other office parks:
Sectors such as IT and ITeS, retail, consulting and
e-commerce have registered high demand for office
space in recent times. The office space absorption in
2016 across the top-eight cities amounted to 34 million
square feet (msf ) with Bengaluru recording the highest
net absorption during the year. Information technology
and business process management sectors led the total
leasing table with 52% of the total space uptake in 2016
(Source: IBEF).
Increase in per capita income:
India’s per capita income, a gauge for measuring
living standards, is estimated to cross H1 lakh in
2016-17, up from H93,293 in the previous fiscal. As
per the ‘First Advance Estimates of National Income,
2016-17’ released by the Central Statistics Office (CSO),
the per capita net national income during 2016-17 is
estimated to be H103,007, at current prices. This is over
10% higher than H93,293 reported during 2015-16.
Growth in the consumer market:
The growth in India’s consumer market would
be primarily driven by a favourable population
composition and increasing disposable incomes. The
growing purchasing power and rising influence of
social media have enabled Indian consumers to loosen
their purse strings. Resultantly, annual growth in the
Indian consumption market was estimated at 6.7%
during FY2015-20 and is expected to rise to 7.1% during
the FY2021-25 period.
Indian furniture industry
70 l Greenlam Industries Limited
Increasing demand for modern homes:
The boom in the residential real estate industry over
the last few decades has given an impetus to the home
décor market. Also driving the growth of this sector
is increased consciousness among home owners for
stylish interiors and aesthetic indoors. One of the factors
that has contributed to this growth is that people have
started taking their home as a reflection and extension
of their personalities and hence, a number of people are
now spending more on both furniture and fixtures as
also on home decor.
Growing middle-class:
In India, the middle-class consumer base is growing
rapidly. They expect quality products at cost-effective
propositions. Rising incomes and improvement in
infrastructure are enlarging consumer markets and
accelerating the convergence of consumer tastes.
Working women spending significantly on home
fashion:
In the present times, Indian women are becoming more
conscious about home fashion and decoration. They are
spending a significant part of their savings and income
on home decor. In an interesting trend, Indian women
are becoming more particular about the needs for their
home luxury and its design. This is big factor driving
demand for quality and even quirky furniture in the
country.
Increasing demand for luxury homes:
Luxury housing is emerging as one of the most vibrant
and dynamic real estate segments in India. The growing
demand for luxury housing can be attributed to a rise
in the number of High-Net Worth Individuals (HNI), the
influx of global lifestyle trends and growing aspirations.
The country’s fast-expanding services sector is
propelling many middle-income group individuals into
the HNI bracket. Improved business confidence and the
general depreciation in the value of the Indian rupee
in the global financial markets has also boosted Non-
Resident Indian (NRI) buyers’ interest in India’s luxury
housing segment.
Governmental reforms:
Government reforms, most notably demonetization,
have proved to be positive for the organized players
with transactions now being processed online or
through cheques. Furthermore, introduction of the
GST will create a level playing field, boosting the
competitiveness and prospects of the organized Indian
market.
Outlook
Home furnishing market in India is expected to witness
an 8% CAGR during 2013-18. With the increase in the
number of working women in the country, increasing
demand among consumers to design their homes and
residences is fuelling the growth of the home furnishing
industry. It is estimated that the Indian home furnishing
market will reach a size of about US$ 5 billion by 2018
due to the growth of the organized retail industry
along with higher per capita income as well as growing
population base. (Source: TechSci research)
Global context
Global demand for decorative laminates is expected to
rise 5.6% per year to reach a size of 10.7 billion square
meters in 2018. Increase in decorative interior demand
from convention centers, gymnasiums and indoor sports
clubs are likely to create room for new opportunities.
Rising trend for better lifestyle and increasing interest
in home interior and remodeling are anticipated to be
among the key driving factors to augment demand.
Domestic context
The decorative laminates accounting for a sizeable
share of the furniture industry and is expected to keep
on growing in the years to come. The market could be
segmented on the basis of distribution channels where
the unorganized market accounts for the major share.
However with changing consumer preferences the
market has seen a shift towards the organized segment
due to increased demand for good quality and branded
products. The share of organized players in the industry
Industry overview
Annual Report 2016-17 l 71
Greenlam Industries is in the business of transforming
interior spaces with rich industry experience. The
Company is among the top-3 laminates producer in
the world and the largest in Asia in terms of production
capacity at 12.02 mn sheets per annum and additional
2.00 million sheets to be operationalised by Q1 2017-18.
It enjoys an exports presence in over 100 countries and
has 13 international offices. The Company is also India’s
first and only manufacturer of engineered wooden
flooring and engineered doors and frames. Greenlam’s
product are produced in the world class state of the art
manufacturing facilities situated at Behror - Rajasthan
and Nalagarh - Himachal Pradesh.
Greenlam Industries possesses a 19% market share
in organised laminates and 11% share in organised
decorative veneers in India, thanks to a portfolio that
opens up infinite design possibilities.
About Greenlam Industries
expected to rise in the years to come. This shift is
taking place primarily due to urbanization and more
disposable income.
The market for laminates is also driven by increasing
demand from housing market. The demand has
increased due to growing significance of new
construction industry. Laminates have become an
indispensable part of big and evolving markets like real-
estate market, furniture market and modular kitchen
market, among others. The increased demand in these
markets triggers the demand in the laminates market.
Apart from this, increasing urban population, rising per
capita income and a gradual shift towards non-food
industry are other key factors driving the growth of
laminates industry in India. Further, the implementation
of Goods and services Tax (GST) in the near future will
provide an impetus to organised laminate industry.
The policy announced by the Government of India
for affordable housing would act as a major revenue
driver of laminate and allied products consumption
in the country.
72 l Greenlam Industries Limited
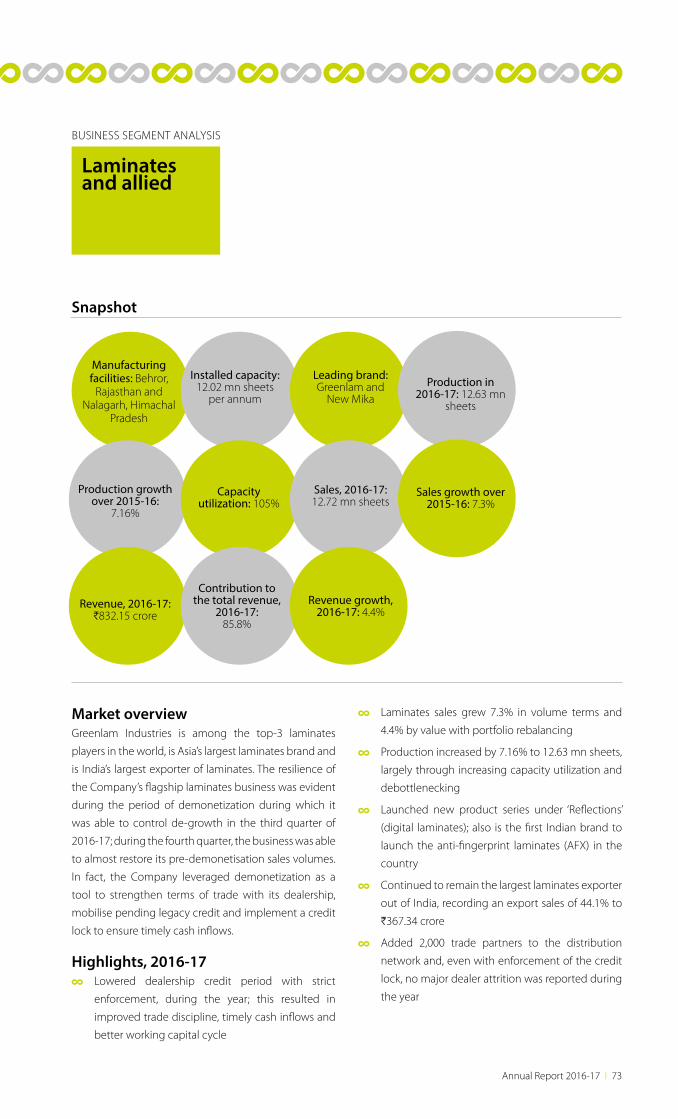
Laminates and allied
BUSINESS SEGMENT ANALYSIS
Manufacturing facilities: Behror,
Rajasthan and Nalagarh, Himachal
Pradesh
Installed capacity: 12.02 mn sheets
per annum
Leading brand: Greenlam and
New MikaProduction in
2016-17: 12.63 mn sheets
Production growth over 2015-16:
7.16%
Capacity utilization: 105%
Sales, 2016-17: 12.72 mn sheets
Sales growth over 2015-16: 7.3%
Revenue, 2016-17: H832.15 crore
Contribution to the total revenue,
2016-17: 85.8%
Revenue growth, 2016-17: 4.4%
Snapshot
Market overviewGreenlam Industries is among the top-3 laminates
players in the world, is Asia’s largest laminates brand and
is India’s largest exporter of laminates. The resilience of
the Company’s flagship laminates business was evident
during the period of demonetization during which it
was able to control de-growth in the third quarter of
2016-17; during the fourth quarter, the business was able
to almost restore its pre-demonetisation sales volumes.
In fact, the Company leveraged demonetization as a
tool to strengthen terms of trade with its dealership,
mobilise pending legacy credit and implement a credit
lock to ensure timely cash inflows.
Highlights, 2016-17 Lowered dealership credit period with strict
enforcement, during the year; this resulted in
improved trade discipline, timely cash inflows and
better working capital cycle
Laminates sales grew 7.3% in volume terms and
4.4% by value with portfolio rebalancing
Production increased by 7.16% to 12.63 mn sheets,
largely through increasing capacity utilization and
debottlenecking
Launched new product series under ‘Reflections’
(digital laminates); also is the first Indian brand to
launch the anti-fingerprint laminates (AFX) in the
country
Continued to remain the largest laminates exporter
out of India, recording an export sales of 44.1% to
H367.34 crore
Added 2,000 trade partners to the distribution
network and, even with enforcement of the credit
lock, no major dealer attrition was reported during
the year
Annual Report 2016-17 l 73
Core competencies Experience: Greenlam enjoys rich experience in the
Indian as well as global laminates industry. This helps
in a better understanding of customer aspirations and
emerging trends to proactively evolve the business and
products.
Capacity: The Company possesses the largest capacity
in the laminates industry in Asia at 12.02 mn sheets per
annum. This provides economies-of-scale, enabling
better cost absorption across a larger product volume.
Range: The Company offers the widest product range
in the laminates space at over 2,500 SKUs. Besides,
Greenlam laminates are available at price points
straddling both ends of the value chain, encompassing
the largest price range in the industry. Greenlam’s
standard-sized (4’ x 8’) and large-format laminates
(4.25’ x 10’, 5’ x 12’, 6’ x 12’ etc.) as part of its diverse
portfolio, enhances our product competency across the
international markets.
Reach: The Company possesses one of the largest
distribution networks for laminates in the country.
This facilitates in deeper penetration and faster reach
to the end-consumer, facilitating pan-India offtake. In
addition, Greenlam laminates are exported to 100+
countries around the world. As a result, the Company
is one of the fastest growing brands, globally and the
largest laminates exporter out of India.
Technology: The Company leverages cutting-edge
technology to provide superior products that enhance
customer convenience and their decors. This has
cemented a stronger recall in the minds of consumers
and has resulted in sustainable offtake.
Industry optimism With the Government’s continued focus and thrust
on infrastructure and affordable housing through
formalizing a host of initiatives and policies, the demand
for laminates is likely to remain strong, going forward.
It is expected that the interior infrastructure products
demand scenario will also remain robust on account
of the Indian real estate industry being aligned with
the standards of some of the developed countries of
the world through the establishment of RERA that will
create a more solid and sustainable platform for the
industry.
Some of the other growth drivers include the Indian
furniture market, especially with the proliferation of
online furniture marketplaces, growing middle-class
and disposable incomes and increased exposure to
global trends and patterns with the need to replicate
these across homes and offices.
Additionally, with the implementation of GST, widely
expected from July 2017, there will be a perceptible shift
towards the specialized, organized laminates market
fostered by innovation, quality commitment, product
mix, design and strong service orientation.
Business priorities, 2017-18 Focus on improving volumes and value sales both
in India and aboard; in India, the emphasis will be
on profitable market share capture
Achieve laminate capacity expansion of 2 mn sheets
at Nalagarh, Himachal Pradesh, by the first quarter
of 2017-18
Strengthen dealer-distributor network with a focus
on dealer productivity
Increase in sales of Greenlam Clads owing to
rampant urbanisation and rising aspiration
complementing development of individual homes,
bungalows in Tier II & III cities.
Greenlam Sturdo - Restroom Cubicle made of
Compact Laminate is expected to get a boost
owing to Govt.’s push towards Swachh Bharat, smart
cities, newer projects, airports and PSUs.
INNOVATION FOCUS!Greenlam introduced an anti-bacterial laminate for the first time on a pan-India basis, emerging as the only company in the industry to launch such a breakthrough product, most relevant for high footfall areas like hospitals, hotels and malls, among others.
74 l Greenlam Industries Limited
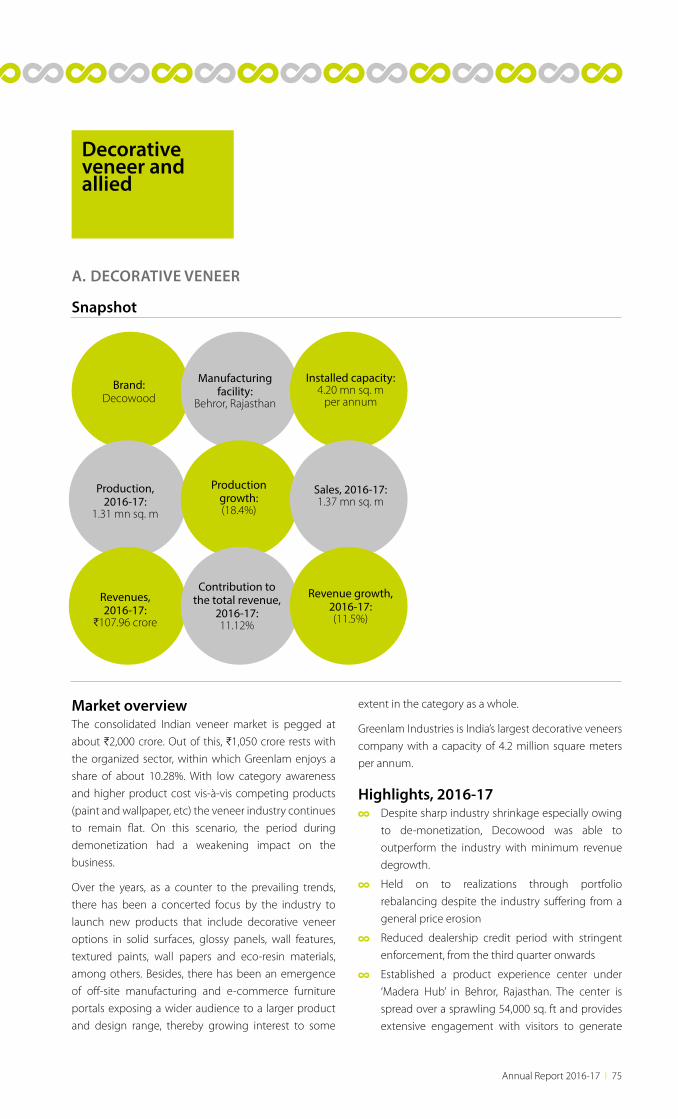
Decorative veneer and allied
A. DECORATIVE VENEER
Brand: Decowood
Manufacturing facility:
Behror, Rajasthan
Installed capacity: 4.20 mn sq. m
per annum
Production, 2016-17:
1.31 mn sq. m
Production growth: (18.4%)
Sales, 2016-17: 1.37 mn sq. m
Revenues, 2016-17:
H107.96 crore
Contribution to the total revenue,
2016-17: 11.12%
Revenue growth, 2016-17: (11.5%)
Snapshot
Market overviewThe consolidated Indian veneer market is pegged at
about H2,000 crore. Out of this, H1,050 crore rests with
the organized sector, within which Greenlam enjoys a
share of about 10.28%. With low category awareness
and higher product cost vis-à-vis competing products
(paint and wallpaper, etc) the veneer industry continues
to remain flat. On this scenario, the period during
demonetization had a weakening impact on the
business.
Over the years, as a counter to the prevailing trends,
there has been a concerted focus by the industry to
launch new products that include decorative veneer
options in solid surfaces, glossy panels, wall features,
textured paints, wall papers and eco-resin materials,
among others. Besides, there has been an emergence
of off-site manufacturing and e-commerce furniture
portals exposing a wider audience to a larger product
and design range, thereby growing interest to some
extent in the category as a whole.
Greenlam Industries is India’s largest decorative veneers
company with a capacity of 4.2 million square meters
per annum.
Highlights, 2016-17 Despite sharp industry shrinkage especially owing
to de-monetization, Decowood was able to
outperform the industry with minimum revenue
degrowth.
Held on to realizations through portfolio
rebalancing despite the industry suffering from a
general price erosion
Reduced dealership credit period with stringent
enforcement, from the third quarter onwards
Established a product experience center under
‘Madera Hub’ in Behror, Rajasthan. The center is
spread over a sprawling 54,000 sq. ft and provides
extensive engagement with visitors to generate
Annual Report 2016-17 l 75
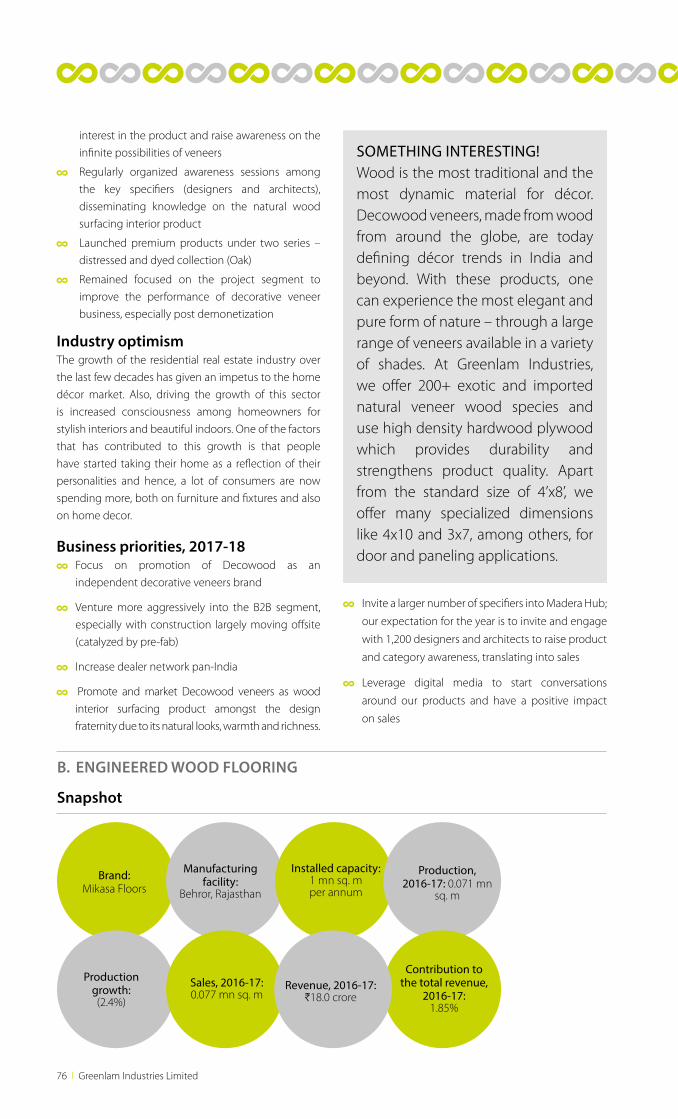
interest in the product and raise awareness on the
infinite possibilities of veneers
Regularly organized awareness sessions among
the key specifiers (designers and architects),
disseminating knowledge on the natural wood
surfacing interior product
Launched premium products under two series –
distressed and dyed collection (Oak)
Remained focused on the project segment to
improve the performance of decorative veneer
business, especially post demonetization
Industry optimismThe growth of the residential real estate industry over
the last few decades has given an impetus to the home
décor market. Also, driving the growth of this sector
is increased consciousness among homeowners for
stylish interiors and beautiful indoors. One of the factors
that has contributed to this growth is that people
have started taking their home as a reflection of their
personalities and hence, a lot of consumers are now
spending more, both on furniture and fixtures and also
on home decor.
Business priorities, 2017-18 Focus on promotion of Decowood as an
independent decorative veneers brand
Venture more aggressively into the B2B segment,
especially with construction largely moving offsite
(catalyzed by pre-fab)
Increase dealer network pan-India
Promote and market Decowood veneers as wood
interior surfacing product amongst the design
fraternity due to its natural looks, warmth and richness.
Invite a larger number of specifiers into Madera Hub;
our expectation for the year is to invite and engage
with 1,200 designers and architects to raise product
and category awareness, translating into sales
Leverage digital media to start conversations
around our products and have a positive impact
on sales
SOMETHING INTERESTING!Wood is the most traditional and the most dynamic material for décor. Decowood veneers, made from wood from around the globe, are today defining décor trends in India and beyond. With these products, one can experience the most elegant and pure form of nature – through a large range of veneers available in a variety of shades. At Greenlam Industries, we offer 200+ exotic and imported natural veneer wood species and use high density hardwood plywood which provides durability and strengthens product quality. Apart from the standard size of 4’x8’, we offer many specialized dimensions like 4x10 and 3x7, among others, for door and paneling applications.
B. ENGINEERED WOOD FLOORING
Brand: Mikasa Floors
Manufacturing facility:
Behror, Rajasthan
Installed capacity: 1 mn sq. m per annum
Production, 2016-17: 0.071 mn
sq. m
Production growth: (2.4%)
Sales, 2016-17: 0.077 mn sq. m
Contribution to the total revenue,
2016-17: 1.85%
Revenue, 2016-17: H18.0 crore
Snapshot
76 l Greenlam Industries Limited
Market overviewWith no manufacturer of engineered wood flooring in
India, most of these products are imported from Europe,
South East Asia and China. The products started getting
popular from the middle of 2005-06 and today, about
1.75-2.00 million sq. m of these products are imported
into the country every year. Europe and China are the
predominant producers and account for more than
80% of the global capacity available for engineered
wood flooring.
Greenlam Industries is the only manufacturer of
engineered wood flooring in India with a capacity
of 1 million sq. m per annum. Having commenced
production in September 2014, Mikasa, the brand of
engineered wood flooring from Greenlam Industries, is
making significant inroads into the Indian market and
competes with global players being brought into the
country by established importer-distributors, focusing
on import substitution.
Our positioning In 2016-17, Mikasa strengthened its market presence
by appointing and activating network partners (dealers
and retailers) in all the major consumption points of the
country. With a sales force comprising more than 35
trained and committed personnel, Mikasa was able to
competitively present the product portfolio to all major
designer and architectural firms and started to gain the
confidence of these specifiers.
The principal market segments for Mikasa include
residential renovation, residential multi-unit projects,
commercial spaces like chain stores and retail outlets,
office spaces, hospitality (hotel rooms and restaurants),
airport lounges and shops, schools and gymnasiums,
among others. We have employed cutting-edge
technology for producing world-class floorings in India.
Our entire raw material for the manufacture of these
products is imported from ethical sources and our
water-based lacquers and stains do not generate any
VOCs. All Mikasa floors are conditioned separately to
deliver finished floors suitable to the hot and humid
environment of the local market. All these features of
the products allow us to position them as a premium
range of floorings which the consumers can enjoy for
years to come. Our products are positioned and priced
as ‘Real wood affordable premium floorings made in
India’ and we are about 10-15% more affordable than
comparable European products and technologically-
better than most Asian imports.
Highlights, 2016-17 During the year under report, we spread our network in
various regions including Metros, Tier I and Tier II cities.
With this, we are now concentrating on consolidating
the trade channels, increasing presence in furniture
and furnishing outlets, tie-up with high-end developers
and increasing the specifications from designers and
architects. With increasing volumes, we are planning to
tap demand on a pan-India basis.
Industry optimismDriving the demand in the global wood flooring
manufacturing market is the increasing housing
construction and renovation activities. With the rapid
pace of urbanization, the housing industry has received
a major fillip. There has been a continued uptick in
activity in the commercial real estate and building
remodeling and renovation works as well. This has
significantly contributed to the market growth along
with increasing purchasing power of consumers who
are increasingly opting for green buildings. The rising
popularity of pre-finished products and manufactured
floors has also raised awareness and driven demand.
Business priorities, 2017-18 Reinforce our dealer network
Enhance product range in the mass-premium
segment
Annual Report 2016-17 l 77
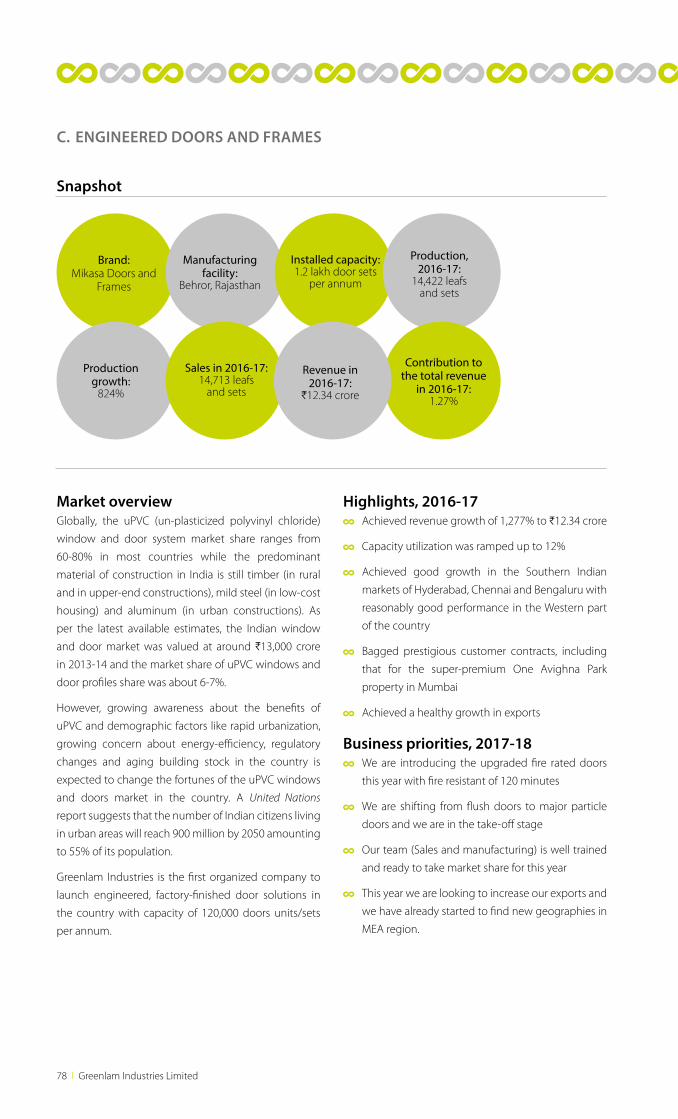
C. ENGINEERED DOORS AND FRAMES
Brand: Mikasa Doors and
Frames
Manufacturing facility:
Behror, Rajasthan
Installed capacity: 1.2 lakh door sets
per annum
Production, 2016-17:
14,422 leafs and sets
Production growth:
824%
Sales in 2016-17: 14,713 leafs
and sets
Contribution to the total revenue
in 2016-17: 1.27%
Revenue in 2016-17:
H12.34 crore
Snapshot
Market overviewGlobally, the uPVC (un-plasticized polyvinyl chloride)
window and door system market share ranges from
60-80% in most countries while the predominant
material of construction in India is still timber (in rural
and in upper-end constructions), mild steel (in low-cost
housing) and aluminum (in urban constructions). As
per the latest available estimates, the Indian window
and door market was valued at around H13,000 crore
in 2013-14 and the market share of uPVC windows and
door profiles share was about 6-7%.
However, growing awareness about the benefits of
uPVC and demographic factors like rapid urbanization,
growing concern about energy-efficiency, regulatory
changes and aging building stock in the country is
expected to change the fortunes of the uPVC windows
and doors market in the country. A United Nations
report suggests that the number of Indian citizens living
in urban areas will reach 900 million by 2050 amounting
to 55% of its population.
Greenlam Industries is the first organized company to
launch engineered, factory-finished door solutions in
the country with capacity of 120,000 doors units/sets
per annum.
Highlights, 2016-17 Achieved revenue growth of 1,277% to H12.34 crore
Capacity utilization was ramped up to 12%
Achieved good growth in the Southern Indian
markets of Hyderabad, Chennai and Bengaluru with
reasonably good performance in the Western part
of the country
Bagged prestigious customer contracts, including
that for the super-premium One Avighna Park
property in Mumbai
Achieved a healthy growth in exports
Business priorities, 2017-18 We are introducing the upgraded fire rated doors
this year with fire resistant of 120 minutes
We are shifting from flush doors to major particle
doors and we are in the take-off stage
Our team (Sales and manufacturing) is well trained
and ready to take market share for this year
This year we are looking to increase our exports and
we have already started to find new geographies in
MEA region.
78 l Greenlam Industries Limited
Operations
BUSINESS EXCELLENCE DRIVERS
Overview At Greenlam Industries, our technology is at par with
the global practices and we have internally worked and
improvised on different factors that contribute to higher
productivity and quality assurance. We are probably
the only Indian manufacturers to invest in gloss molds
polishing machinery with state-of-the-art technology
imported from Imeas, Italy. This is paying returns
in terms of consistent delivery of industry-leading
high gloss levels and commensurate orders thereof.
Importantly, our technology is stable and carries a risk
of low obsolescence.
Highlights, 2016-17 Some of the technological upgradations include
the replacement of rotary cutters with conventional
pneumatic cutters. These contribute to higher
productivity besides ensuring clean cuts at varied
speeds and lowering losses
Sourced and standardized black pigmented Kraft
paper for manufacture of compact laminates
Commercialized the production and supply of high
value products like ESD laminates, AFX laminates
and HD gloss as well as post-forming variants,
spangles etc
Energy saving drives were taken up post energy
audits. Utilities were made more efficient with
respect to controlling fuel and dry flue gas losses,
installing flash vessels across steam lines and
switching to LED modules; these efforts resulted
in an intangible saving of over 1.5% on fuel costs
during the year
There is a planned and concerted effort to deliver
goods more quickly than before. For this, the
Company invested in 11 regional distribution
centers which stock goods depending on their
movement. The requirements of the respective
areas are met within short time spans and this
has ensured quick and timely delivery of goods to
customers
Our core strengths Highest capacity in terms of volumes
Availability of diverse product sizes to suit end
product requirements
Consistent quality and supply chain modules
Wide range of interior and exterior decorative
products and solutions under one brand and
under one roof
First organized industry for engineered doors and
real wood flooring in India
Focus areas, 2017-18 Introduce veneered compacts and double décor-
layered HPLs for shower rooms and pizza and
skating boards
Increase production by adding press lines
Enhance heating facilities with more standby and
accumulation machineries and equipment
Ramp-up capacity utilization for Mikasa door and
flooring units
SOMETHING INTERESTING!Over the last five years, we have reduced rejections from 2.5% to 2% on the finished goods and Kraft paper wastages from 5.5% to 4.5%, demonstrating the effectiveness of our operations and the culture to control wastes.
Annual Report 2016-17 l 79
Quality
BUSINESS EXCELLENCE DRIVERS
Overview During the year 2016-17, the focus was on improving
the post-production quality assurance attributes.
Towards this extent, we worked on:
Eliminating pigeon menace and ensuring hygiene
Improving cutting quality
Bringing forth innovative methods of packaging
overseas goods
Peel coating
Outcome These initiatives have almost eliminated customer
complaints pertaining to the relevant product
attributes. Besides, the emphasis was top-driven and
initiatives have been taken to make necessary changes
and alterations and training to the concerned personnel
has also been imparted. The actions resulting from
these initiatives have been revalidated in the form of
re-inspection. The exercises have been repeated in
order to ensure that the system is in place and becomes
sustainable.
Focus going forward For us, the measure of quality is the percentage of
goods conforming to the specified internal quality
assurance norms and SOPs. The basic parameters
that the product should meet are appearance norms,
dimensional conformances and performance property
conformance. Going forward, we will continue to focus
on improving these parameters.
Research and development
BUSINESS EXCELLENCE DRIVERS
Overview At Greenlam Industries, our objective is to develop newer
products that are introduced in the international markets,
to work on improving the performance properties of
our existing products and focus on optimizing the cost
of production without compromising on end product
performance characteristics.
Highlights, 2016-17 Some of our new product developments include:
Pizza boards
Skating and anti-skid boards
Veneered compact
Thermo-foldable compacts
ESD, AFX and HD gloss’ commercial introduction
Augmented the post formability of HD gloss to
a radius as low as 6 mm which is a challenge for
the industry
Continuously revised and revalidated resin
formulations as part of ongoing improvements and
cost reduction
Modified resin formulations in order to bring forth
higher output that resulted from higher machine
speeds
2017-18 focus areas Some of the new products in the pipeline include:
Double layered decorative laminates (which have
defined water permeability and resistance for 28
days)
High-density fire retardant compacts using filled
Kraft paper for European markets
Magnetic laminates in marker and chalk variants
and newer textures in different sizes
Work on further cost reduction of existing products
80 l Greenlam Industries Limited
Human resources
BUSINESS EXCELLENCE DRIVERS
At Greenlam, we embrace several HR-centric initiatives,
anchored on building loyalty and engagement. With
1,732 employees on payroll as on March 31, 2017, the
Company’s HR policy and practices focus on rejuvenating
its intellectual capital and drive benefits of thinking
ahead of the market and capitalizing on opportunities
with speed and surety. The Company’s average attrition
level stood at 11% in 2016-17. Our average age of the
employee is about 36 years (excluding plant personnel).
Highlights, 2016-17 Realigned and consolidated the HR team structure
Focused on capabilities enhancement through
structured interventions, both on the functional
and behavioral side
Started various sessions to improve quality of
communication skills and customer-centricity
Provided exhaustive product training sessions to
our sales employees to improve their efficiency
Commenced several employee-friendly relationship
initiatives including structured monthly celebrations,
commonness of Family Day Celebration across the
country and many more
Focused on three basic pillars of employee
development – skills, knowledge and attitude
Priorities, 2017-18 Introduce Balance Score Cards at Leadership Level
and derive Goals Sheets from the same for all
employees to achieve synergy and clarity on job
roles
Information technology
BUSINESS EXCELLENCE DRIVERS
Overview Greenlam Industries has always considered information
technology as a serious business objective. At our
Company, we fixed the IT budget at 1% of total revenues.
With cutting-edge IT infrastructure, we are providing
solutions to our backend, frontend and after-sales
through SAP, CRM and customer sales, respectively.
The role of IT at Greenlam has transformed from that
of being a service provider to a service enabler. At our
Company, IT works closely with all relevant stakeholders
to increase the overall business efficiency.
Currently, the Company has two distinct streams under IT:
Frontend (sales employee)
Backend (finance and operations); currently, our
backend is supported by SAP
We incorporated a new CRM during the year under
review which will support our sales team. This service
is expected to increase the efficiency of our sales force,
reinforcing product off-take. CRM is expected to help
the backend efficiently process orders and facilitate on-
time delivery.
Advantages With the help of CRM, we would have better
systemic transparency, enabling the right decision
at the right time
Human dependency will decline through CRM
Sales team can have access to track all sales,
thereby enabling achieving targets on time
Quick notification is sent to the sales team about
new launches (with specifications)
Enables forecasting capabilities
Other highlights For GST, we filled the gaps and are now ready to
reap the advantages
Established a customer support and redressal
portal to support customer grievances
Effected SAP authorization audit to keep the
system updated; also effected an audit of the
Microsoft stack to maintain checks
Outlook Based on the IT audits, we have prepared our roadmap
comprising technology upgradation and also IT revamp.
Annual Report 2016-17 l 81
Focus on skill enhancement – Introduce Sales
Academy which will be a structured development
approach for all the sales employees
Leadership Development interventions for
Leadership Level and other Behavioral Development
interventions for all other employees
Focus on systems-based compliances for alertness
and accountability
Automation of HR Function to increase efficiency
and accuracy levels
Opportunities
There is a sharp shift towards the organised market
from the unorganised market due to innovation in
terms of product mix, design.
With expected implementation of GST from July,
2017, would ensure organised players have an edge
over unorganised manufacturers.
Conducive macroeconomic factors like a fast-
growing real estate sector, increasing consumerism,
a greater preference for classy home decor products
and burgeoning per capita incomes are expected to
bode well for the sector.
Threats
The unorganised segment, which constitutes
almost 45% (in terms of value) and 65% (in terms
of volume) of the entire laminates industry, erodes
competitiveness of the organized branded players
because of its ability to price products cheaper.
Continued increase in cheaper imports of furniture
and flooring products from China
Spiralling raw material costs and the inability of
companies to pass this cost increase to consumers
on account of high competitive intensity
Our financial performance
The Company’s revenues grew by 3.6% to H970.44 crore
in 2016-17 following an improvement in terms of sales
volumes. EBIDTA stood at H126.67 crore compared
to H123.92 crore in the previous year. Interest cost
decreased to H25.30 crore in 2016-17 compared to
H27.77 crore. The Company reported a post-tax profit of
H42.95 crore in 2016-17 compared to a post-tax profit of
H40.34 crore in the previous year.
Internal control systems and their adequacy
The Company has in place robust internal control
procedures commensurate with its size and
operations. The Board of Directors, responsible for the
internal control system, sets the guidelines, verifying
its adequacy, effectiveness and application. The
Company’s internal control system is designed to ensure
management efficiency, measurability and verifiability,
reliability of accounting and management information,
compliance with all applicable laws and regulations,
and the protection of the Company’s assets so that the
company’s main risks (operational, compliance-related,
economic and financial) are properly identified and
managed over time.
82 l Greenlam Industries Limited
Risks and concerns As a business, though Greenlam is exposed to a number of risks, the Company has evolved certain time-tested
initiatives and practices that have enabled it to ring fence its viability and sustainability.
Though the unorganized segment of the market represents a core risk, the proposed
implementation of the GST Act is a game-changer for the laminates industry as it will
enable a shift to organized constituents of the market. In this scenario, Greenlam enjoys an
entrenched brand recall, unparalleled distribution network and a wide bouquet of products
across laminates and veneers categories that will enable it to ride the favourable regulations.
Competition risk
The Company’s products might no longer be relevant for consumers. In fact, this is a virtually
minimal risk as laminates and veneers are established surface products whose market has
been registering a decent rate of growth in India and also globally. Besides, the huge range
of offering under these categories has only grown their appeal among customers.
Product risk
Brands play an important role in the sales and marketing of laminates and Decorative
veneers. In this context, Greenlam Industries has positioned itself as a global brand in the
decorative surfacing product market by being one stop solution for all surfacing needs.
Brand risk
For a working capital-intensive industry, prudent fiscal management is important for operational sustainability. In a significant initiative, the Company enforced a stipulated trade credit period. Though applied during the second half of the fiscal 2016-17 it has resulted in significant control over working capital and cash flow, the full impact of this will be evident this year onwards, enabling us to better manage our working capital and cash flow cycle.
Financial risk
At our Company, we operate state-of-the-art manufacturing facilities with documented
processes that enable us to manufacture products in compliance with the highest quality
standards, cost effectively with maximum resource consumption and minimal wastages.
This also makes our operations compliant with all environmental rules and regulations.
Manufacturing and quality risk
Greenlam possesses state-of-the-art IT infrastructure and support through SAP-based
ERP that integrates the entire ecosystem to ensure the availability of real-time information
that in turn enhances the quality of decision-making and ensures the contemporariness
of systems and processes.
IT risk
The Company enjoys an FMCG-like distribution network with a presence across India and
in 100+ countries around the world. Our supply chain is robust and dynamic, allowing us
to meet customer demands with speed and surety.
Distribution risk
Annual Report 2016-17 l 83
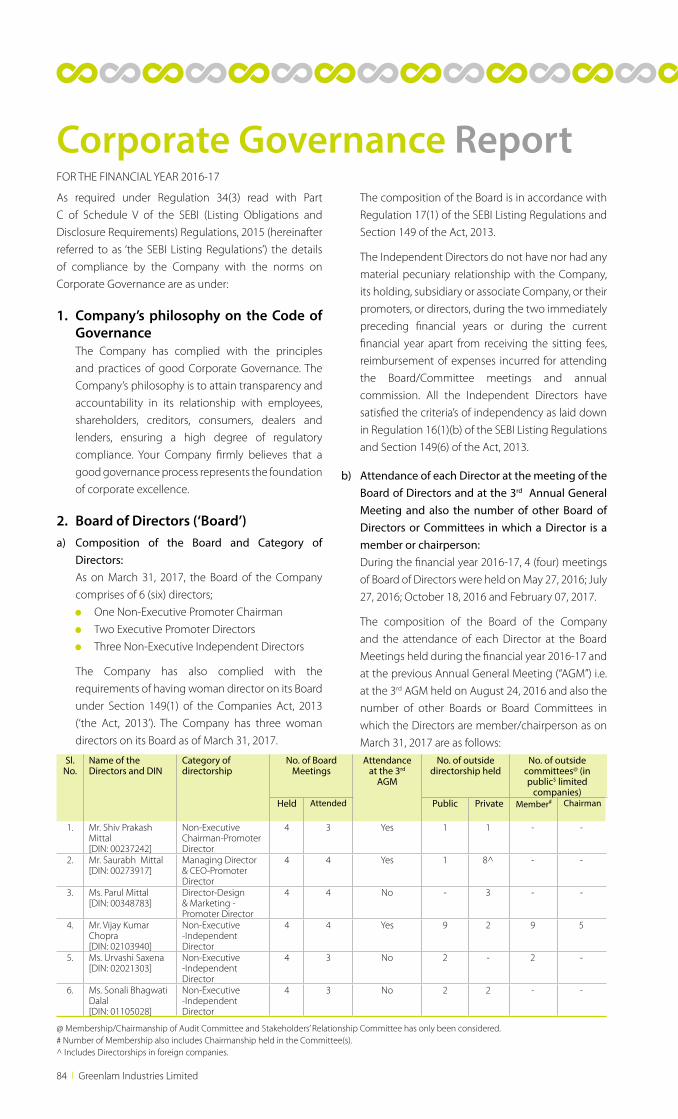
Corporate Governance ReportFOR THE FINANCIAL YEAR 2016-17
As required under Regulation 34(3) read with Part
C of Schedule V of the SEBI (Listing Obligations and
Disclosure Requirements) Regulations, 2015 (hereinafter
referred to as ‘the SEBI Listing Regulations’) the details
of compliance by the Company with the norms on
Corporate Governance are as under:
1. Company’s philosophy on the Code of Governance
The Company has complied with the principles
and practices of good Corporate Governance. The
Company’s philosophy is to attain transparency and
accountability in its relationship with employees,
shareholders, creditors, consumers, dealers and
lenders, ensuring a high degree of regulatory
compliance. Your Company firmly believes that a
good governance process represents the foundation
of corporate excellence.
2. Board of Directors (‘Board’)a) Composition of the Board and Category of
Directors: As on March 31, 2017, the Board of the Company
comprises of 6 (six) directors;
One Non-Executive Promoter Chairman
Two Executive Promoter Directors
Three Non-Executive Independent Directors
The Company has also complied with the
requirements of having woman director on its Board
under Section 149(1) of the Companies Act, 2013
(‘the Act, 2013’). The Company has three woman
directors on its Board as of March 31, 2017.
The composition of the Board is in accordance with
Regulation 17(1) of the SEBI Listing Regulations and
Section 149 of the Act, 2013.
The Independent Directors do not have nor had any
material pecuniary relationship with the Company,
its holding, subsidiary or associate Company, or their
promoters, or directors, during the two immediately
preceding financial years or during the current
financial year apart from receiving the sitting fees,
reimbursement of expenses incurred for attending
the Board/Committee meetings and annual
commission. All the Independent Directors have
satisfied the criteria’s of independency as laid down
in Regulation 16(1)(b) of the SEBI Listing Regulations
and Section 149(6) of the Act, 2013.
b) Attendance of each Director at the meeting of the Board of Directors and at the 3rd Annual General Meeting and also the number of other Board of Directors or Committees in which a Director is a member or chairperson:
During the financial year 2016-17, 4 (four) meetings
of Board of Directors were held on May 27, 2016; July
27, 2016; October 18, 2016 and February 07, 2017.
The composition of the Board of the Company
and the attendance of each Director at the Board
Meetings held during the financial year 2016-17 and
at the previous Annual General Meeting (“AGM”) i.e.
at the 3rd AGM held on August 24, 2016 and also the
number of other Boards or Board Committees in
which the Directors are member/chairperson as on
March 31, 2017 are as follows:
Sl. No.
Name of the Directors and DIN
Category of directorship
No. of Board Meetings
Attendance at the 3rd
AGM
No. of outside directorship held
No. of outside committees@ (in public$ limited
companies) Held Attended Public Private Member# Chairman
1. Mr. Shiv Prakash Mittal[DIN: 00237242]
Non-Executive Chairman-Promoter Director
4 3 Yes 1 1 - -
2. Mr. Saurabh Mittal[DIN: 00273917]
Managing Director & CEO-Promoter Director
4 4 Yes 1 8^ - -
3. Ms. Parul Mittal[DIN: 00348783]
Director-Design & Marketing - Promoter Director
4 4 No - 3 - -
4. Mr. Vijay Kumar Chopra[DIN: 02103940]
Non-Executive -Independent Director
4 4 Yes 9 2 9 5
5. Ms. Urvashi Saxena [DIN: 02021303]
Non-Executive -Independent Director
4 3 No 2 - 2 -
6. Ms. Sonali Bhagwati Dalal[DIN: 01105028]
Non-Executive -Independent Director
4 3 No 2 2 - -
@ Membership/Chairmanship of Audit Committee and Stakeholders’ Relationship Committee has only been considered.# Number of Membership also includes Chairmanship held in the Committee(s).^ Includes Directorships in foreign companies.
84 l Greenlam Industries Limited
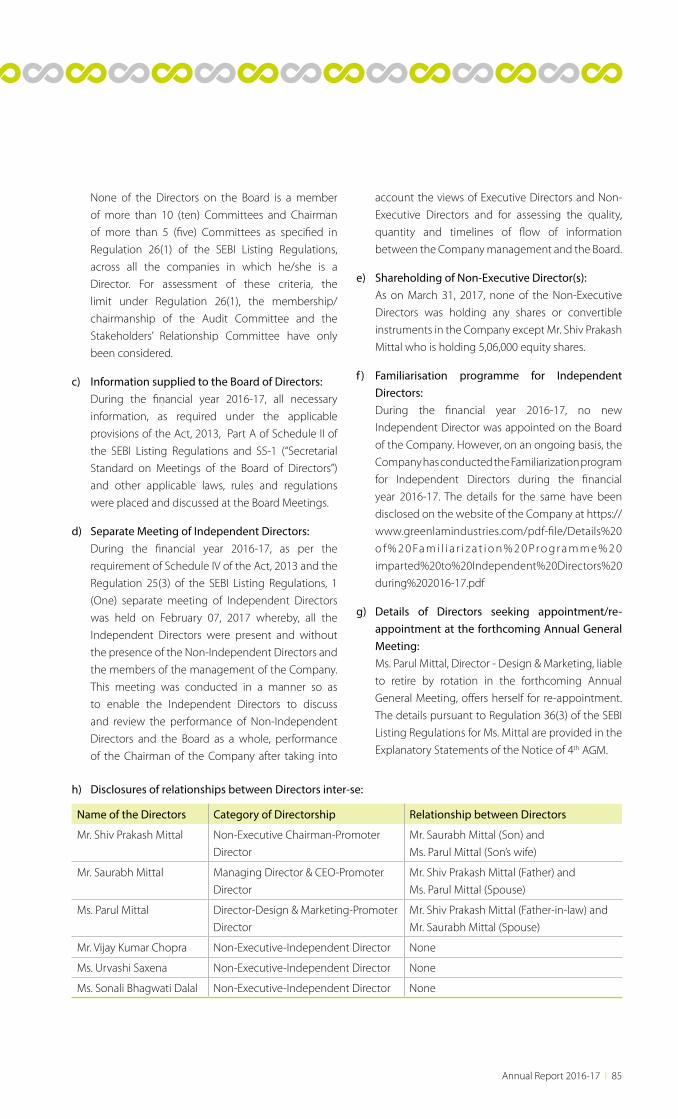
None of the Directors on the Board is a member
of more than 10 (ten) Committees and Chairman
of more than 5 (five) Committees as specified in
Regulation 26(1) of the SEBI Listing Regulations,
across all the companies in which he/she is a
Director. For assessment of these criteria, the
limit under Regulation 26(1), the membership/
chairmanship of the Audit Committee and the
Stakeholders’ Relationship Committee have only
been considered.
c) Information supplied to the Board of Directors: During the financial year 2016-17, all necessary
information, as required under the applicable
provisions of the Act, 2013, Part A of Schedule II of
the SEBI Listing Regulations and SS-1 (“Secretarial
Standard on Meetings of the Board of Directors”)
and other applicable laws, rules and regulations
were placed and discussed at the Board Meetings.
d) Separate Meeting of Independent Directors: During the financial year 2016-17, as per the
requirement of Schedule IV of the Act, 2013 and the
Regulation 25(3) of the SEBI Listing Regulations, 1
(One) separate meeting of Independent Directors
was held on February 07, 2017 whereby, all the
Independent Directors were present and without
the presence of the Non-Independent Directors and
the members of the management of the Company.
This meeting was conducted in a manner so as
to enable the Independent Directors to discuss
and review the performance of Non-Independent
Directors and the Board as a whole, performance
of the Chairman of the Company after taking into
account the views of Executive Directors and Non-
Executive Directors and for assessing the quality,
quantity and timelines of flow of information
between the Company management and the Board.
e) Shareholding of Non-Executive Director(s): As on March 31, 2017, none of the Non-Executive
Directors was holding any shares or convertible
instruments in the Company except Mr. Shiv Prakash
Mittal who is holding 5,06,000 equity shares.
f ) Familiarisation programme for Independent Directors:
During the financial year 2016-17, no new
Independent Director was appointed on the Board
of the Company. However, on an ongoing basis, the
Company has conducted the Familiarization program
for Independent Directors during the financial
year 2016-17. The details for the same have been
disclosed on the website of the Company at https://
www.greenlamindustries.com/pdf-file/Details%20
o f % 2 0 Fa m i l i a r i z a t i o n % 2 0 Pr o g r a m m e % 2 0
imparted%20to%20Independent%20Directors%20
during%202016-17.pdf
g) Details of Directors seeking appointment/re-appointment at the forthcoming Annual General Meeting:
Ms. Parul Mittal, Director - Design & Marketing, liable
to retire by rotation in the forthcoming Annual
General Meeting, offers herself for re-appointment.
The details pursuant to Regulation 36(3) of the SEBI
Listing Regulations for Ms. Mittal are provided in the
Explanatory Statements of the Notice of 4th AGM.
h) Disclosures of relationships between Directors inter-se:
Name of the Directors Category of Directorship Relationship between Directors
Mr. Shiv Prakash Mittal Non-Executive Chairman-Promoter
Director
Mr. Saurabh Mittal (Son) and
Ms. Parul Mittal (Son’s wife)
Mr. Saurabh Mittal Managing Director & CEO-Promoter
Director
Mr. Shiv Prakash Mittal (Father) and
Ms. Parul Mittal (Spouse)
Ms. Parul Mittal Director-Design & Marketing-Promoter
Director
Mr. Shiv Prakash Mittal (Father-in-law) and
Mr. Saurabh Mittal (Spouse)
Mr. Vijay Kumar Chopra Non-Executive-Independent Director None
Ms. Urvashi Saxena Non-Executive-Independent Director None
Ms. Sonali Bhagwati Dalal Non-Executive-Independent Director None
Annual Report 2016-17 l 85
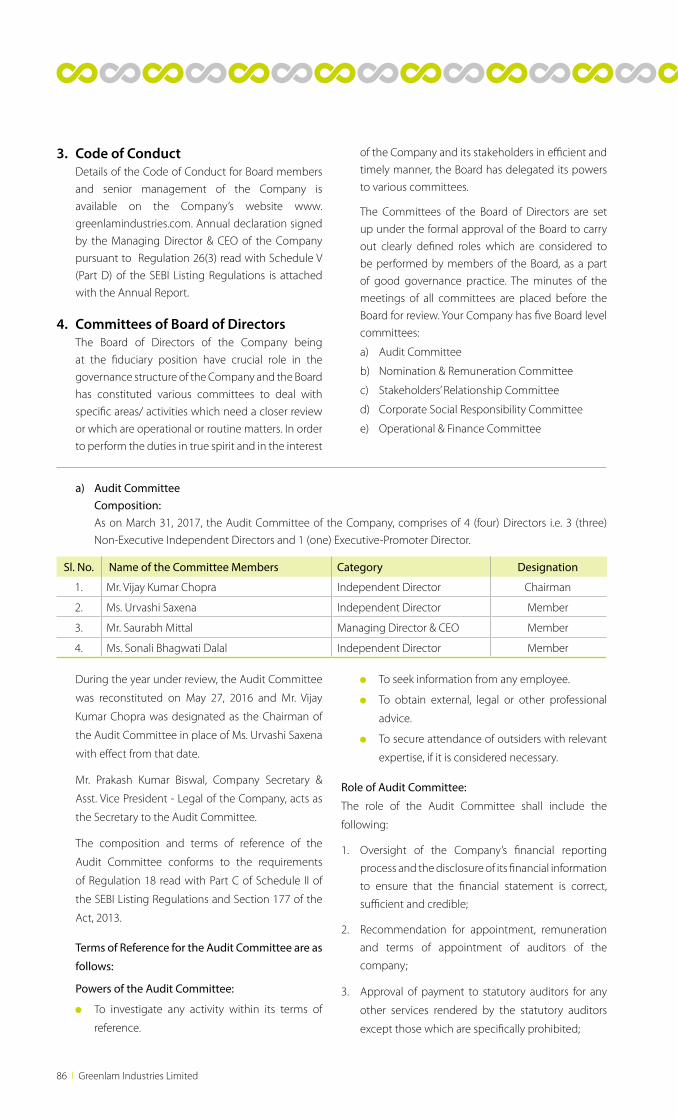
3. Code of Conduct Details of the Code of Conduct for Board members
and senior management of the Company is
available on the Company’s website www.
greenlamindustries.com. Annual declaration signed
by the Managing Director & CEO of the Company
pursuant to Regulation 26(3) read with Schedule V
(Part D) of the SEBI Listing Regulations is attached
with the Annual Report.
4. Committees of Board of Directors The Board of Directors of the Company being
at the fiduciary position have crucial role in the
governance structure of the Company and the Board
has constituted various committees to deal with
specific areas/ activities which need a closer review
or which are operational or routine matters. In order
to perform the duties in true spirit and in the interest
of the Company and its stakeholders in efficient and
timely manner, the Board has delegated its powers
to various committees.
The Committees of the Board of Directors are set
up under the formal approval of the Board to carry
out clearly defined roles which are considered to
be performed by members of the Board, as a part
of good governance practice. The minutes of the
meetings of all committees are placed before the
Board for review. Your Company has five Board level
committees:
a) Audit Committee
b) Nomination & Remuneration Committee
c) Stakeholders’ Relationship Committee
d) Corporate Social Responsibility Committee
e) Operational & Finance Committee
a) Audit Committee Composition: As on March 31, 2017, the Audit Committee of the Company, comprises of 4 (four) Directors i.e. 3 (three)
Non-Executive Independent Directors and 1 (one) Executive-Promoter Director.
Sl. No. Name of the Committee Members Category Designation
1. Mr. Vijay Kumar Chopra Independent Director Chairman
2. Ms. Urvashi Saxena Independent Director Member
3. Mr. Saurabh Mittal Managing Director & CEO Member
4. Ms. Sonali Bhagwati Dalal Independent Director Member
During the year under review, the Audit Committee
was reconstituted on May 27, 2016 and Mr. Vijay
Kumar Chopra was designated as the Chairman of
the Audit Committee in place of Ms. Urvashi Saxena
with effect from that date.
Mr. Prakash Kumar Biswal, Company Secretary &
Asst. Vice President - Legal of the Company, acts as
the Secretary to the Audit Committee.
The composition and terms of reference of the
Audit Committee conforms to the requirements
of Regulation 18 read with Part C of Schedule II of
the SEBI Listing Regulations and Section 177 of the
Act, 2013.
Terms of Reference for the Audit Committee are as
follows:
Powers of the Audit Committee:
To investigate any activity within its terms of
reference.
To seek information from any employee.
To obtain external, legal or other professional
advice.
To secure attendance of outsiders with relevant
expertise, if it is considered necessary.
Role of Audit Committee:
The role of the Audit Committee shall include the
following:
1. Oversight of the Company’s financial reporting
process and the disclosure of its financial information
to ensure that the financial statement is correct,
sufficient and credible;
2. Recommendation for appointment, remuneration
and terms of appointment of auditors of the
company;
3. Approval of payment to statutory auditors for any
other services rendered by the statutory auditors
except those which are specifically prohibited;
86 l Greenlam Industries Limited
4. Reviewing, with the management, the annual
financial statements and auditor’s report thereon
before submission to the board for approval, with
particular reference to:
i. Matters required to be included in the Director’s
Responsibility Statement to be included in the
Board’s report in terms of clause (c) of sub-
section 3 of Section 134 of the Companies Act,
2013;
ii. Changes, if any, in accounting policies and
practices and reasons for the same;
iii. Major accounting entries involving estimates
based on the exercise of judgment by
management;
iv. Significant adjustments made in the financial
statements arising out of audit findings;
v. Compliance with listing and other legal
requirements relating to financial statements;
vi. Disclosure of any related party transactions;
vii. Modified opinion(s) in the draft audit report.
5. Reviewing, with the management, the quarterly
financial statements before submission to the board
for approval;
6. Reviewing, with the management, the statement
of uses/application of funds raised through an issue
(public issue, rights issue, preferential issue, etc.), the
statement of funds utilized for purposes other than
those stated in the offer document/prospectus/
notice and the report submitted by the monitoring
agency monitoring the utilisation of proceeds of
a public or rights issue, and making appropriate
recommendations to the Board to take up steps in
this matter;
7. Review and monitor the auditor’s independence
and performance, and effectiveness of audit process;
8. Approval or any subsequent modification of
transactions of The Companywith related parties;
9. Scrutiny of inter-corporate loans and investments;
10. Valuation of undertakings or assets of the company,
wherever it is necessary;
11. Evaluation of internal financial controls and risk
management systems;
12. Reviewing, with the management, performance
of statutory and internal auditors, adequacy of the
internal control systems;
13. Reviewing the adequacy of internal audit function,
if any, including the structure of the internal audit
department, staffing and seniority of the official
heading the department, reporting structure
coverage and frequency of internal audit;
14. Discussion with internal auditors of any significant
findings and follow up there on;
15. Reviewing the findings of any internal investigations
by the internal auditors into matters where there is
suspected fraud or irregularity or a failure of internal
control systems of a material nature and reporting
the matter to the Board;
16. Discussion with statutory auditors before the audit
commences, about the nature and scope of audit as
well as post-audit discussion to ascertain any area of
concern;
17. To look into the reasons for substantial defaults in
the payment to the depositors, debenture holders,
shareholders (in case of non-payment of declared
dividends) and creditors;
18. To review the functioning of the Whistle Blower
mechanism;
19. Approval of appointment of Chief Financial Officer
after assessing the qualifications, experience and
background, etc. of the candidate;
20. Carrying out any other function as may be referred to
by the Board or mandated by regulatory provisions
from time to time.
Review of information by Audit Committee:
The Audit Committee shall mandatorily review the
following information:
a. Management discussion and analysis of financial
condition and results of operations;
b. Statement of significant related party
transactions (as defined by the Audit
Committee), submitted by management;
c. Management letters/letters of internal control
weaknesses issued by the statutory auditors;
d. Internal audit reports relating to internal control
weaknesses;
Annual Report 2016-17 l 87
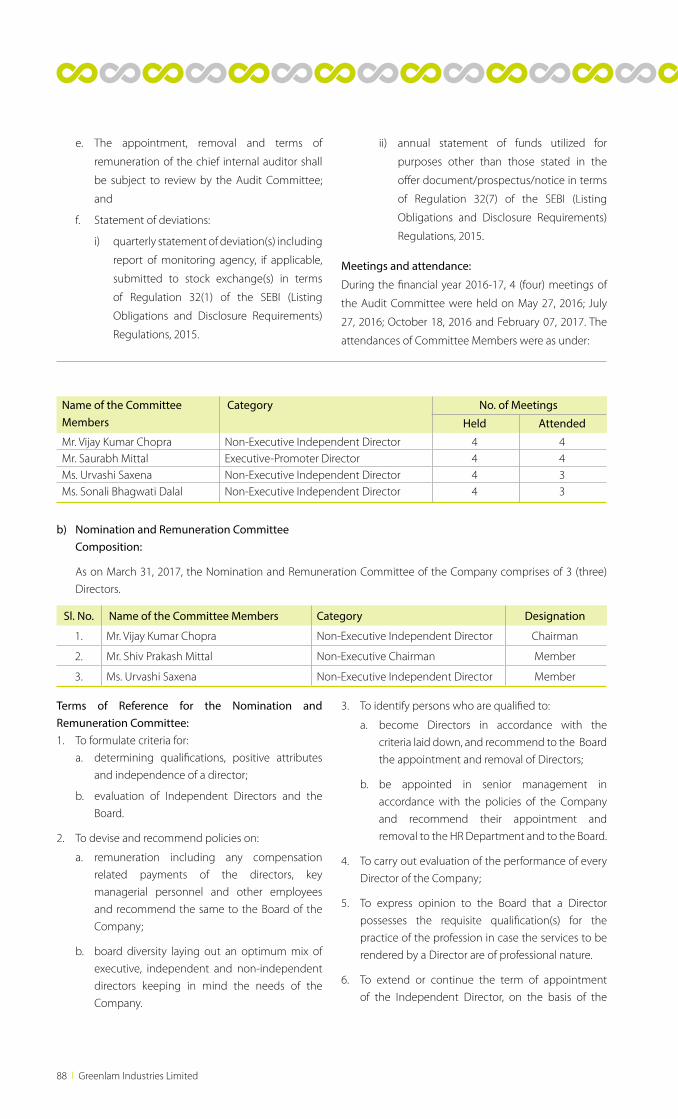
e. The appointment, removal and terms of
remuneration of the chief internal auditor shall
be subject to review by the Audit Committee;
and
f. Statement of deviations:
i) quarterly statement of deviation(s) including
report of monitoring agency, if applicable,
submitted to stock exchange(s) in terms
of Regulation 32(1) of the SEBI (Listing
Obligations and Disclosure Requirements)
Regulations, 2015.
ii) annual statement of funds utilized for
purposes other than those stated in the
offer document/prospectus/notice in terms
of Regulation 32(7) of the SEBI (Listing
Obligations and Disclosure Requirements)
Regulations, 2015.
Meetings and attendance:
During the financial year 2016-17, 4 (four) meetings of
the Audit Committee were held on May 27, 2016; July
27, 2016; October 18, 2016 and February 07, 2017. The
attendances of Committee Members were as under:
Name of the Committee Members
Category No. of Meetings
Held Attended
Mr. Vijay Kumar Chopra Non-Executive Independent Director 4 4Mr. Saurabh Mittal Executive-Promoter Director 4 4Ms. Urvashi Saxena Non-Executive Independent Director 4 3Ms. Sonali Bhagwati Dalal Non-Executive Independent Director 4 3
b) Nomination and Remuneration Committee Composition:
As on March 31, 2017, the Nomination and Remuneration Committee of the Company comprises of 3 (three)
Directors.
Terms of Reference for the Nomination and Remuneration Committee:1. To formulate criteria for:
a. determining qualifications, positive attributes
and independence of a director;
b. evaluation of Independent Directors and the
Board.
2. To devise and recommend policies on:
a. remuneration including any compensation
related payments of the directors, key
managerial personnel and other employees
and recommend the same to the Board of the
Company;
b. board diversity laying out an optimum mix of
executive, independent and non-independent
directors keeping in mind the needs of the
Company.
3. To identify persons who are qualified to:
a. become Directors in accordance with the
criteria laid down, and recommend to the Board
the appointment and removal of Directors;
b. be appointed in senior management in
accordance with the policies of the Company
and recommend their appointment and
removal to the HR Department and to the Board.
4. To carry out evaluation of the performance of every
Director of the Company;
5. To express opinion to the Board that a Director
possesses the requisite qualification(s) for the
practice of the profession in case the services to be
rendered by a Director are of professional nature.
6. To extend or continue the term of appointment
of the Independent Director, on the basis of the
Sl. No. Name of the Committee Members Category Designation
1. Mr. Vijay Kumar Chopra Non-Executive Independent Director Chairman
2. Mr. Shiv Prakash Mittal Non-Executive Chairman Member
3. Ms. Urvashi Saxena Non-Executive Independent Director Member
88 l Greenlam Industries Limited
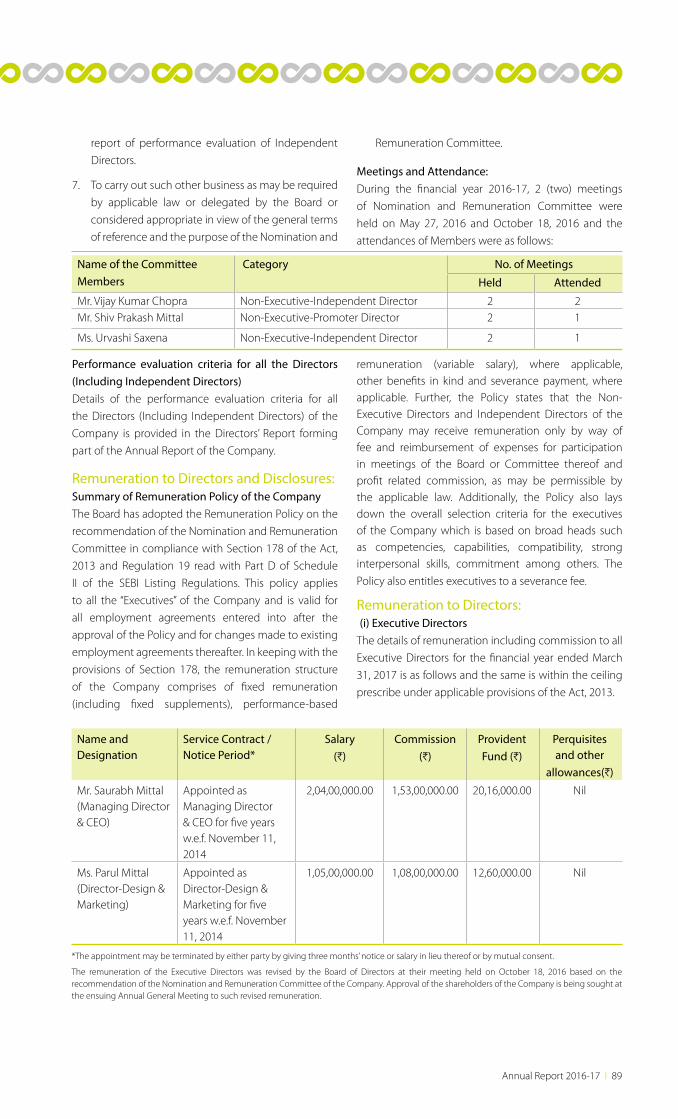
report of performance evaluation of Independent
Directors.
7. To carry out such other business as may be required
by applicable law or delegated by the Board or
considered appropriate in view of the general terms
of reference and the purpose of the Nomination and
Remuneration Committee.
Meetings and Attendance:During the financial year 2016-17, 2 (two) meetings
of Nomination and Remuneration Committee were
held on May 27, 2016 and October 18, 2016 and the
attendances of Members were as follows:
Performance evaluation criteria for all the Directors (Including Independent Directors)Details of the performance evaluation criteria for all
the Directors (Including Independent Directors) of the
Company is provided in the Directors’ Report forming
part of the Annual Report of the Company.
Remuneration to Directors and Disclosures:Summary of Remuneration Policy of the CompanyThe Board has adopted the Remuneration Policy on the
recommendation of the Nomination and Remuneration
Committee in compliance with Section 178 of the Act,
2013 and Regulation 19 read with Part D of Schedule
II of the SEBI Listing Regulations. This policy applies
to all the “Executives” of the Company and is valid for
all employment agreements entered into after the
approval of the Policy and for changes made to existing
employment agreements thereafter. In keeping with the
provisions of Section 178, the remuneration structure
of the Company comprises of fixed remuneration
(including fixed supplements), performance-based
remuneration (variable salary), where applicable, other benefits in kind and severance payment, where applicable. Further, the Policy states that the Non-Executive Directors and Independent Directors of the Company may receive remuneration only by way of fee and reimbursement of expenses for participation in meetings of the Board or Committee thereof and profit related commission, as may be permissible by the applicable law. Additionally, the Policy also lays down the overall selection criteria for the executives of the Company which is based on broad heads such as competencies, capabilities, compatibility, strong interpersonal skills, commitment among others. The
Policy also entitles executives to a severance fee.
Remuneration to Directors: (i) Executive DirectorsThe details of remuneration including commission to all
Executive Directors for the financial year ended March
31, 2017 is as follows and the same is within the ceiling
prescribe under applicable provisions of the Act, 2013.
Name of the Committee Members
Category No. of Meetings
Held Attended
Mr. Vijay Kumar Chopra Non-Executive-Independent Director 2 2Mr. Shiv Prakash Mittal Non-Executive-Promoter Director 2 1
Ms. Urvashi Saxena Non-Executive-Independent Director 2 1
Name and Designation
Service Contract /Notice Period*
Salary (H)
Commission
(H)Provident Fund (H)
Perquisites and other
allowances(H)
Mr. Saurabh Mittal(Managing Director & CEO)
Appointed as Managing Director & CEO for five years w.e.f. November 11, 2014
2,04,00,000.00 1,53,00,000.00 20,16,000.00 Nil
Ms. Parul Mittal(Director-Design & Marketing)
Appointed as Director-Design & Marketing for five years w.e.f. November 11, 2014
1,05,00,000.00 1,08,00,000.00 12,60,000.00 Nil
*The appointment may be terminated by either party by giving three months’ notice or salary in lieu thereof or by mutual consent.
The remuneration of the Executive Directors was revised by the Board of Directors at their meeting held on October 18, 2016 based on the recommendation of the Nomination and Remuneration Committee of the Company. Approval of the shareholders of the Company is being sought at the ensuing Annual General Meeting to such revised remuneration.
Annual Report 2016-17 l 89
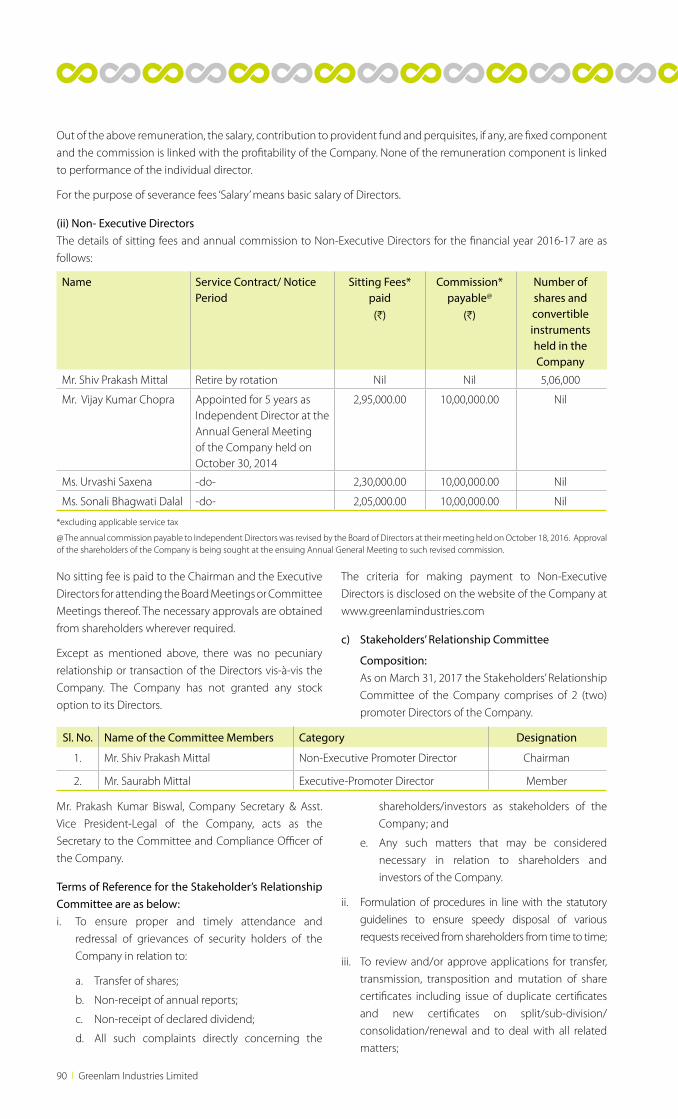
Out of the above remuneration, the salary, contribution to provident fund and perquisites, if any, are fixed component
and the commission is linked with the profitability of the Company. None of the remuneration component is linked
to performance of the individual director.
For the purpose of severance fees ‘Salary’ means basic salary of Directors.
(ii) Non- Executive DirectorsThe details of sitting fees and annual commission to Non-Executive Directors for the financial year 2016-17 are as
follows:
No sitting fee is paid to the Chairman and the Executive
Directors for attending the Board Meetings or Committee
Meetings thereof. The necessary approvals are obtained
from shareholders wherever required.
Except as mentioned above, there was no pecuniary
relationship or transaction of the Directors vis-à-vis the
Company. The Company has not granted any stock
option to its Directors.
The criteria for making payment to Non-Executive
Directors is disclosed on the website of the Company at
www.greenlamindustries.com
c) Stakeholders’ Relationship Committee
Composition: As on March 31, 2017 the Stakeholders’ Relationship
Committee of the Company comprises of 2 (two)
promoter Directors of the Company.
Mr. Prakash Kumar Biswal, Company Secretary & Asst.
Vice President-Legal of the Company, acts as the
Secretary to the Committee and Compliance Officer of
the Company.
Terms of Reference for the Stakeholder’s Relationship Committee are as below:i. To ensure proper and timely attendance and
redressal of grievances of security holders of the
Company in relation to:
a. Transfer of shares;
b. Non-receipt of annual reports;
c. Non-receipt of declared dividend;
d. All such complaints directly concerning the
shareholders/investors as stakeholders of the
Company; and
e. Any such matters that may be considered
necessary in relation to shareholders and
investors of the Company.
ii. Formulation of procedures in line with the statutory
guidelines to ensure speedy disposal of various
requests received from shareholders from time to time;
iii. To review and/or approve applications for transfer,
transmission, transposition and mutation of share
certificates including issue of duplicate certificates
and new certificates on split/sub-division/
consolidation/renewal and to deal with all related
matters;
Name Service Contract/ Notice Period
Sitting Fees* paid(H)
Commission* payable@
(H)
Number of shares and convertible instruments held in the Company
Mr. Shiv Prakash Mittal Retire by rotation Nil Nil 5,06,000
Mr. Vijay Kumar Chopra Appointed for 5 years as Independent Director at the Annual General Meeting of the Company held on October 30, 2014
2,95,000.00 10,00,000.00 Nil
Ms. Urvashi Saxena -do- 2,30,000.00 10,00,000.00 Nil
Ms. Sonali Bhagwati Dalal -do- 2,05,000.00 10,00,000.00 Nil
*excluding applicable service tax
@ The annual commission payable to Independent Directors was revised by the Board of Directors at their meeting held on October 18, 2016. Approval of the shareholders of the Company is being sought at the ensuing Annual General Meeting to such revised commission.
Sl. No. Name of the Committee Members Category Designation
1. Mr. Shiv Prakash Mittal Non-Executive Promoter Director Chairman
2. Mr. Saurabh Mittal Executive-Promoter Director Member
90 l Greenlam Industries Limited
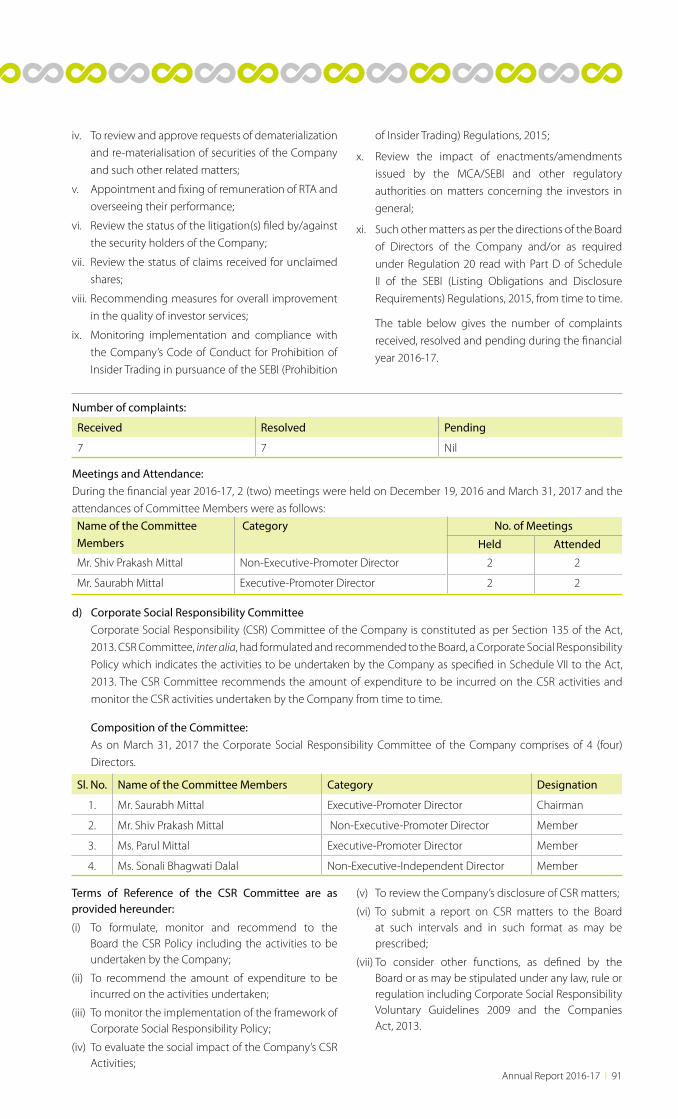
iv. To review and approve requests of dematerialization
and re-materialisation of securities of the Company
and such other related matters;
v. Appointment and fixing of remuneration of RTA and
overseeing their performance;
vi. Review the status of the litigation(s) filed by/against
the security holders of the Company;
vii. Review the status of claims received for unclaimed
shares;
viii. Recommending measures for overall improvement
in the quality of investor services;
ix. Monitoring implementation and compliance with
the Company’s Code of Conduct for Prohibition of
Insider Trading in pursuance of the SEBI (Prohibition
of Insider Trading) Regulations, 2015;
x. Review the impact of enactments/amendments
issued by the MCA/SEBI and other regulatory
authorities on matters concerning the investors in
general;
xi. Such other matters as per the directions of the Board
of Directors of the Company and/or as required
under Regulation 20 read with Part D of Schedule
II of the SEBI (Listing Obligations and Disclosure
Requirements) Regulations, 2015, from time to time.
The table below gives the number of complaints
received, resolved and pending during the financial
year 2016-17.
Number of complaints:
Received Resolved Pending
7 7 Nil
Meetings and Attendance:During the financial year 2016-17, 2 (two) meetings were held on December 19, 2016 and March 31, 2017 and the
attendances of Committee Members were as follows:
d) Corporate Social Responsibility Committee Corporate Social Responsibility (CSR) Committee of the Company is constituted as per Section 135 of the Act,
2013. CSR Committee, inter alia, had formulated and recommended to the Board, a Corporate Social Responsibility
Policy which indicates the activities to be undertaken by the Company as specified in Schedule VII to the Act,
2013. The CSR Committee recommends the amount of expenditure to be incurred on the CSR activities and
monitor the CSR activities undertaken by the Company from time to time.
Composition of the Committee: As on March 31, 2017 the Corporate Social Responsibility Committee of the Company comprises of 4 (four)
Directors.
Name of the Committee Members
Category No. of Meetings
Held Attended
Mr. Shiv Prakash Mittal Non-Executive-Promoter Director 2 2
Mr. Saurabh Mittal Executive-Promoter Director 2 2
Sl. No. Name of the Committee Members Category Designation
1. Mr. Saurabh Mittal Executive-Promoter Director Chairman
2. Mr. Shiv Prakash Mittal Non-Executive-Promoter Director Member
3. Ms. Parul Mittal Executive-Promoter Director Member
4. Ms. Sonali Bhagwati Dalal Non-Executive-Independent Director Member
Terms of Reference of the CSR Committee are as provided hereunder:
(i) To formulate, monitor and recommend to the Board the CSR Policy including the activities to be undertaken by the Company;
(ii) To recommend the amount of expenditure to be incurred on the activities undertaken;
(iii) To monitor the implementation of the framework of Corporate Social Responsibility Policy;
(iv) To evaluate the social impact of the Company’s CSR Activities;
(v) To review the Company’s disclosure of CSR matters;
(vi) To submit a report on CSR matters to the Board at such intervals and in such format as may be prescribed;
(vii) To consider other functions, as defined by the Board or as may be stipulated under any law, rule or regulation including Corporate Social Responsibility Voluntary Guidelines 2009 and the Companies Act, 2013.
Annual Report 2016-17 l 91
Meetings and Attendance:1 (one) meeting was held on April 18, 2016 and the attendances of Committee Members were as follows:
Also, a resolution was passed by the members of Corporate Social Responsibility Committee through circulation on
January 17, 2017 in compliance with the provisions of Section 175 of the Act, 2013.
e) Operational & Finance Committee As on March 31, 2017 the Operational & Finance Committee of the Company comprises of 3 (three) Directors.
The Committee meets as and when required to consider matters assigned to it by the Board of the Company from
time to time.
During the financial year 2016-17, 8 (eight) meetings of the Operational & Finance Committee were held.
5) Subsidiaries Details of the subsidiaries of the Company and their business activities are provided in the Directors’ Report
forming part of the Annual Report of the Company.
6) General Body Meetingsi. The details of previous three Annual General Meeting (AGM) of the shareholders are as under:
Name of the Committee Members
Category No. of Meetings
Held Attended
Mr. Saurabh Mittal Executive-Promoter Director 1 1Mr. Shiv Prakash Mittal Non-Executive-Promoter Director 1 0Ms. Parul Mittal Executive-Promoter Director 1 1Ms. Sonali Bhagwati Dalal Non-Executive-Independent Director 1 1
Sl. No. Name of the Committee Members Category Designation
1. Mr. Shiv Prakash Mittal Non-Executive-Promoter Director Member
2. Mr. Saurabh Mittal Executive-Promoter Director Member
3. Ms. Parul Mittal Executive-Promoter Director Member
Financial Year Date of AGM Venue Time
2015-16 August 24, 2016 [3rd AGM] Registered Office at Makum Road, Tinsukia,
Assam-786125
9:30 A.M.
2014-15 August 24, 2015 [2nd AGM] “ROYALIDE”, Hotel Royal Highness, G.N.B
Road, Tinsukia, Assam-786125
9:30 A.M.
2013-14 October 30, 2014 [1st AGM] Registered Office at Makum Road, Tinsukia,
Assam-786125
9:00 A.M.
ii. Special resolutions passed at the previous three Annual General Meetings are as below:
AGM No. AGM Date Details of Special Resolutions passed
3rd August 24, 2016 Nil
2nd August 24, 2015 Nil
1st October 30, 2014 Resolution pursuant to Section 14 and other applicable provisions, if any, of the
Companies Act, 2013, for Alteration of Article of Association of the Company.
iii. The details of Special Resolutions passed through postal ballot during the financial year 2016-17: During the
financial year 2016-17, no Resolution was passed through postal ballot.
iv. Person who conducted the Postal Ballot: Not Applicable
v. There is no immediate proposal for passing any special resolution through Postal Ballot.
vi. Procedure for Postal ballot: Not Applicable.
92 l Greenlam Industries Limited
Recommendation Compliance
Quarterly/Annual results Published in leading newspapers
Newspapers wherein results are normally published Ajib Dainik Batori, Dainik Assam, Ajir Asom or Amar Asom
(Assamese daily), Economic Times, Business Standard,
Mint, Business Line or Financial Express (English Daily)
Any website, where displayed www.greenlamindustries.com
Whether it also displays official news releases and
presentation made to institutional investors or to the
analysts.
Yes
i. Date, time and venue of the Annual General
Meeting
On Monday, August 21, 2017 at 10.15 a.m. at Registered
Office of the Company at Makum Road, Tinsukia,
Assam-786125
ii. Financial Year Financial year of the Company is from April 01
to March 31.
Publication of results for the financial year 2017-18
(tentative and subject to change)
a) First quarter results: On or before August 14, 2017.
b) Second quarter and half year results: On or before
November 14, 2017.
c) Third quarter results: On or before February
14, 2018.
d) Fourth quarter results and results for the year
ending March 31, 2017: On or before May 30, 2018.
iii. Dates of book closure From August 15, 2017 to August 21, 2017 (both days
inclusive)
iv. Dividend payment date Between August 25, 2017 and August 31, 2017
v. Listing of Equity Shares at Stock Exchanges BSE Ltd. (“BSE”)
Floor 25, P. J. Towers, Dalal Street, Fort, Mumbai-400001
National Stock Exchange of India Ltd. (“NSE”)
Exchange Plaza, Bandra Kurla Complex, Bandra (E),
Mumbai-400051
vi. Payment of Listing Fees Annual Listing Fees for both the stock exchanges for
the financial year 2017-18 has been duly paid by the
Company.
vii. Stock Code/Symbol BSE Scrip Code: 538979
NSE Symbol: GREENLAM
8) General shareholders’ information
7) Means of communication The quarterly/half-yearly/annual financial results of the Company are sent to Stock Exchanges immediately after
they are approved by the Board of Directors. These are also published in the prescribed proforma within 48 hours
of the conclusion of the meeting of the Board in which they are considered, in English newspaper circulating
the whole or substantially the whole of India and in one vernacular newspaper of the state where the registered
office of the Company is situated. In addition, these results are simultaneously posted on the Company’s website.
The official press releases and/or presentation are also available on the Company’s website.
Details about the means of communication:
Annual Report 2016-17 l 93
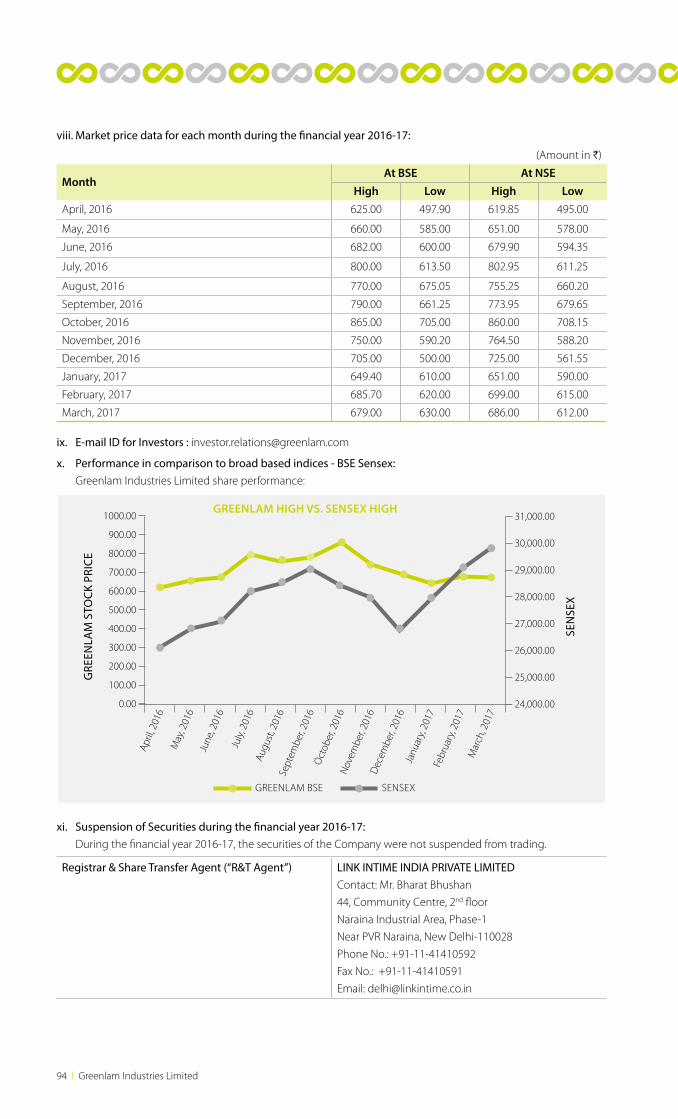
viii. Market price data for each month during the financial year 2016-17:
ix. E-mail ID for Investors : [email protected]
x. Performance in comparison to broad based indices - BSE Sensex: Greenlam Industries Limited share performance:
(Amount in H)
MonthAt BSE At NSE
High Low High LowApril, 2016 625.00 497.90 619.85 495.00
May, 2016 660.00 585.00 651.00 578.00
June, 2016 682.00 600.00 679.90 594.35
July, 2016 800.00 613.50 802.95 611.25
August, 2016 770.00 675.05 755.25 660.20
September, 2016 790.00 661.25 773.95 679.65
October, 2016 865.00 705.00 860.00 708.15
November, 2016 750.00 590.20 764.50 588.20
December, 2016 705.00 500.00 725.00 561.55
January, 2017 649.40 610.00 651.00 590.00
February, 2017 685.70 620.00 699.00 615.00
March, 2017 679.00 630.00 686.00 612.00
GREENLAM HIGH VS. SENSEX HIGH
SEN
SEX
GRE
ENLA
M S
TOCK
PRI
CE
0.00
100.00
200.00
300.00
400.00
500.00
600.00
700.00
800.00
900.00
1000.00 31,000.00
30,000.00
29,000.00
28,000.00
27,000.00
26,000.00
25,000.00
24,000.00
April
, 201
6M
ay, 2
016
June
, 201
6
July,
201
6Au
gust
, 201
6Se
ptem
ber,
2016
Oct
ober
, 201
6N
ovem
ber,
2016
Dec
embe
r, 20
16Ja
nuar
y, 20
17Fe
brua
ry, 2
017
Mar
ch, 2
017
GREENLAM BSE SENSEX
xi. Suspension of Securities during the financial year 2016-17: During the financial year 2016-17, the securities of the Company were not suspended from trading.
Registrar & Share Transfer Agent (“R&T Agent”) LINK INTIME INDIA PRIVATE LIMITEDContact: Mr. Bharat Bhushan
44, Community Centre, 2nd floor
Naraina Industrial Area, Phase-1
Near PVR Naraina, New Delhi-110028
Phone No.: +91-11-41410592
Fax No.: +91-11-41410591
Email: [email protected]
94 l Greenlam Industries Limited
xii. Distribution of equity shareholding as on March 31, 2017: Distribution of shareholding by size is as given below:
Share Transfer System The Company has a Committee of the Board of Directors
called Stakeholders’ Relationship Committee, which meets
as and when required. The formalities for transfer of shares
in the physical form are completed and share certificates are
dispatched to the transferee within 15 days of receipt of the
transfer documents, provided the documents are complete
and the shares under transfer are not under dispute. The
half year Compliance Certificate pursuant to Regulation
40 (9) of the SEBI Listing Regulations for the half year
ending September 30, 2016 and March 31, 2017 issued by
Mr. Pramod Kumar Pal, Practicing Company Secretary, have
been duly submitted to stock exchanges.
Range in number of shares held
Number of shareholders Percentage of shareholders (%)
Number of shares held
Percentage of shares held (%)
1-500 3819 90.41 319473 1.32
501-1,000 166 3.93 122741 0.51
1,001-2,000 99 2.35 136753 0.57
2,001-3,000 39 0.92 95986 0.40
3,001-4,000 19 0.45 67047 0.28
4,001-5,000 14 0.33 65758 0.27
5,001-10,000 22 0.52 161242 0.67
10,001 and above 46 1.09 23167374 95.98
Total 4224 100.00 24136374 100.00
xiii. Distribution of shareholding by category as on March 31, 2017 is as given below:
Category of Shareholders Number of shares Percentage of shares (%)
Promoters and Promoter Group 1,32,12,628 54.74
Mutual Funds 22,68,516 9.40
FII/Foreign Portfolio Investors 16,36,452 6.78
Domestic Bodies Corporate 2,24,156 0.93
Foreign Companies 19,01,342 7.88
Resident Individuals 41,50,805 17.20
Others 7,42,475 3.07
Total 2,41,36,374 100.00
Promoters & Promoter Group (54.74%)
Mutual Funds (9.40%)
Fll/Foreign Portfolio investors (6.78%)
Domestic Bodies Corporate (0.93%)
Foreign Companies (7.88%)
Resident Individuals (17.20%)
Others (3.07%)
54.74%
9.40%
6.78%0.93%
7.88%
17.20%
3.07%
Annual Report 2016-17 l 95
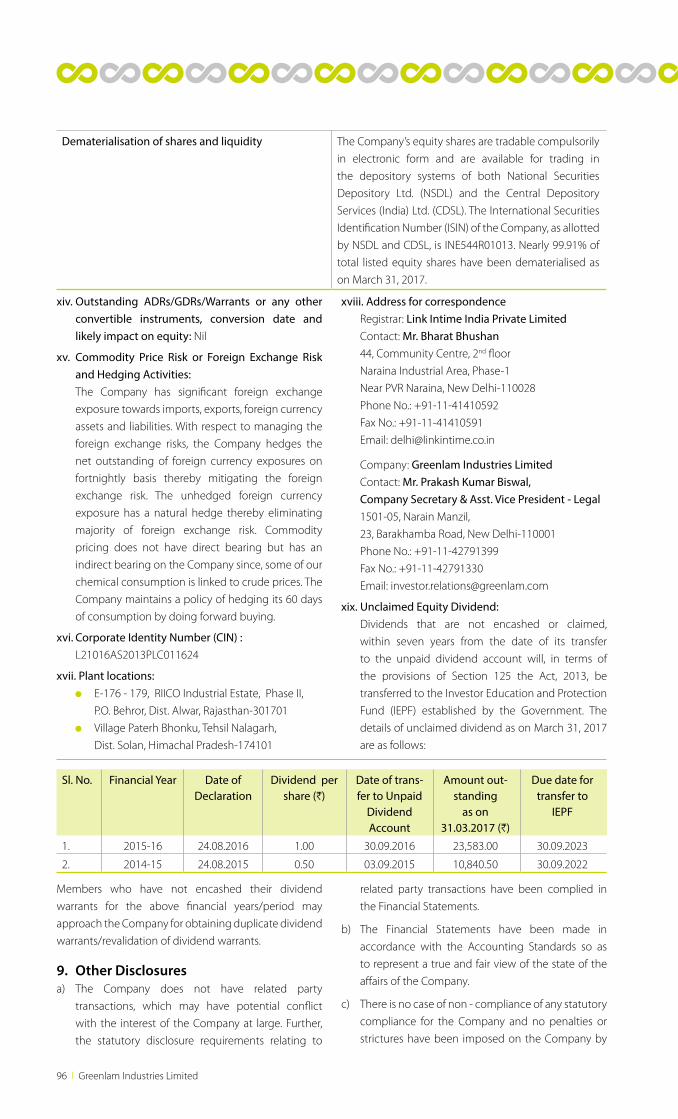
Dematerialisation of shares and liquidity The Company’s equity shares are tradable compulsorily
in electronic form and are available for trading in
the depository systems of both National Securities
Depository Ltd. (NSDL) and the Central Depository
Services (India) Ltd. (CDSL). The International Securities
Identification Number (ISIN) of the Company, as allotted
by NSDL and CDSL, is INE544R01013. Nearly 99.91% of
total listed equity shares have been dematerialised as
on March 31, 2017.
xiv. Outstanding ADRs/GDRs/Warrants or any other convertible instruments, conversion date and likely impact on equity: Nil
xv. Commodity Price Risk or Foreign Exchange Risk and Hedging Activities:
The Company has significant foreign exchange
exposure towards imports, exports, foreign currency
assets and liabilities. With respect to managing the
foreign exchange risks, the Company hedges the
net outstanding of foreign currency exposures on
fortnightly basis thereby mitigating the foreign
exchange risk. The unhedged foreign currency
exposure has a natural hedge thereby eliminating
majority of foreign exchange risk. Commodity
pricing does not have direct bearing but has an
indirect bearing on the Company since, some of our
chemical consumption is linked to crude prices. The
Company maintains a policy of hedging its 60 days
of consumption by doing forward buying.
xvi. Corporate Identity Number (CIN) : L21016AS2013PLC011624
xvii. Plant locations: E-176 - 179, RIICO Industrial Estate, Phase II,
P.O. Behror, Dist. Alwar, Rajasthan-301701
Village Paterh Bhonku, Tehsil Nalagarh,
Dist. Solan, Himachal Pradesh-174101
xviii. Address for correspondence Registrar: Link Intime India Private Limited Contact: Mr. Bharat Bhushan 44, Community Centre, 2nd floor
Naraina Industrial Area, Phase-1
Near PVR Naraina, New Delhi-110028
Phone No.: +91-11-41410592
Fax No.: +91-11-41410591
Email: [email protected]
Company: Greenlam Industries Limited Contact: Mr. Prakash Kumar Biswal,
Company Secretary & Asst. Vice President - Legal 1501-05, Narain Manzil,
23, Barakhamba Road, New Delhi-110001
Phone No.: +91-11-42791399
Fax No.: +91-11-42791330
Email: [email protected]
xix. Unclaimed Equity Dividend: Dividends that are not encashed or claimed,
within seven years from the date of its transfer
to the unpaid dividend account will, in terms of
the provisions of Section 125 the Act, 2013, be
transferred to the Investor Education and Protection
Fund (IEPF) established by the Government. The
details of unclaimed dividend as on March 31, 2017
are as follows:
Members who have not encashed their dividend
warrants for the above financial years/period may
approach the Company for obtaining duplicate dividend
warrants/revalidation of dividend warrants.
9. Other Disclosuresa) The Company does not have related party
transactions, which may have potential conflict
with the interest of the Company at large. Further,
the statutory disclosure requirements relating to
related party transactions have been complied in
the Financial Statements.
b) The Financial Statements have been made in
accordance with the Accounting Standards so as
to represent a true and fair view of the state of the
affairs of the Company.
c) There is no case of non - compliance of any statutory
compliance for the Company and no penalties or
strictures have been imposed on the Company by
Sl. No. Financial Year Date of Declaration
Dividend per share (H)
Date of trans-fer to Unpaid
Dividend Account
Amount out-standing
as on 31.03.2017 (H)
Due date for transfer to
IEPF
1. 2015-16 24.08.2016 1.00 30.09.2016 23,583.00 30.09.2023
2. 2014-15 24.08.2015 0.50 03.09.2015 10,840.50 30.09.2022
96 l Greenlam Industries Limited
the Stock Exchanges i.e. BSE & NSE or Securities and
Exchange Board of India or any statutory authority
on any matter related to the capital market, since
the incorporation of the Company.
d) The Company has in place Vigil Mechanism/Whistle
Blower Policy as required and it is affirmed that no
personnel has been denied access to the Audit
Committee.
e) The Company has complied with all the mandatory
requirements as prescribed in the SEBI Listing
Regulations and the Act, 2013.
f ) The Policy for determining material subsidiaries is
disclosed on the website of the Company and can
be accessed at http://www.greenlamindustries.
com/pdf-file/Policy_for_determining_Material_
Subsidiaries.pdf
g) The Related Party Transaction Policy is also posted
on the Company’s website and can be accessed
at http://www.greenlamindustries.com/pdf-file/
Related_Party_Transaction_Policy.pdf
h) The Disclosure of Commodity Price Risks and
Commodity Hedging Activities:
Commodity pricing does not have direct bearing
but has an indirect bearing on the Company since
some of our chemical consumption is linked to
crude prices. The Company maintains a policy
of hedging its 60 days of consumption by doing
forward buying.
i) Discretionary requirements as specified in Part E of
Schedule II of the SEBI Listing Regulations:
The Company has complied with the discretionary
requirements with regard to reporting of Internal
Auditor directly to Audit Committee, moving towards
a regime of unqualified Financial Statements and
unmodified audit opinion and separating the post
of Chairman and Managing Director/Chief Executive
Officer.
j) In addition to Directors’ Report, a Management
Discussion and Analysis Report form part of
the Annual Report to the shareholders. All key
managerial personnel and senior management
have confirmed that they do not have any material,
financial and commercial interest in transactions
with the Company that may have a potential conflict
with the interest of the Company at large.
k) All details relating to financial and commercial
transactions where Directors may have a pecuniary
interest are provided to the Board and the interested
Directors neither participate in the discussion nor
vote on such matters.
l) In order to prevent misuse of any unpublished price
sensitive information (UPSI), maintain confidentiality
of all UPSI and prohibit any insider trading activity
and abusive self-dealing of securities, in the
interest of the shareholders at large, the Company
has framed a Code of Conduct for Prohibition of
Insider Trading Practice. The said Code prohibits
the Directors, KMPs and connected persons of
the Company from dealing in the securities of the
Company on the basis of any unpublished price
sensitive information, available to them by virtue of
their position in the Company.
The details of dealing in Company’s shares by
Designated Employees/Designated Persons are
quarterly placed before the Audit Committee. The
Code also prescribes sanction framework and any
instance of breach of code is dealt in accordance
with the same. A copy of the said Code is made
available to all employees of the Company and
compliance of the same is ensured.
Further the Company has framed a Code of Practices
and Procedures for Fair Disclosure of Unpublished
Price Sensitive Information and the same is
available on the website of the Company at www.
greenlamindustries.com.
10. The Company has complied with the applicable requirement specified in Regulations 17 to 27 and clause (b) to (i) of sub-regulation (2) of Regulation 46 of the SEBI (Listing Obligations and Disclosure Requirements) Regulations, 2015.
11. Compliance Certificate of the Auditors The Statutory Auditors have certified that the
Company has complied with the conditions of
Corporate Governance as stipulated in the SEBI
Listing Regulations and the same is annexed to this
report.
12.Disclosures with respect to demat suspense account/unclaimed suspense account
The Company had allotted 2,41,36,374 equity
shares of H5 each to the eligible shareholders of
Greenply Industries Limited on November 29, 2014
pursuant to Composite Scheme of Arrangement
between Greenply Industries Limited and
Greenlam Industries Limited and their respective
shareholders and creditors for the demerger of the
Decorative Business (comprised of Laminates and
Allied Products) of Greenply Industries Limited to
Greenlam Industries Limited. The shares allotted
Annual Report 2016-17 l 97
in demat form were successfully credited to the
respective beneficiary account of the concerned
shareholders. Physical share certificates for shares
allotted in physical mode were dispatched to the
registered address of the concerned shareholders
out of which 72 share certificates representing 10,277
shares of 72 shareholders returned undelivered to
Registrar & Share Transfer Agent of the Company.
During the financial year 2016-17, the Company/
R&T Agent pursuant to Regulation 39(4) read with
Schedule of the SEBI Listing Regulations had sent
three reminders to the concerned members on
May 25, 2016; June 30, 2016 and August 18, 2016
respectively at their respective address registered
with the Company. Subsequently, 806 equity shares
were claimed and the relevant shares certificates
were given to the respective shareholders after
proper verification of the identity of the claimant.
Thereafter, the Company has opened an Unclaimed
Suspense Account, i.e. ‘Greenlam Industries Limited-
Unclaimed Suspense Account’ with Julius Baer
Wealth Advisors (India) Private Limited and 9,471
unclaimed equity shares of 67 shareholders lying
with the Company have been dematerialized and
credited to ‘Greenlam Industries Limited-Unclaimed
Suspense Account’. The voting rights on the
unclaimed shares shall remain frozen till the rightful
owner of such shares claims the shares.
(a) Aggregate number of shareholders and the outstanding shares in the suspense account lying at the beginning of the year: Nil
(b) Number of shareholders who approached the Company for transfer of shares from suspense account during the year: Nil
(c) Number of shareholders to whom shares were transferred from suspense account during the year: Nil
(d) Aggregate number of shareholders and the outstanding shares in the suspense account lying at the end of the year: 9,471 equity shares
of 67 shareholders
(e) Aggregate number of shares on which voting rights shall remain frozen till the rightful owner of such shares claims the shares: 9,471
equity shares
On behalf of the Board of Directors
Shiv Prakash Mittal Place: New Delhi Non-Executive Chairman
Date: May 25, 2017 [DIN: 00237242]
98 l Greenlam Industries Limited
To
The Board of Directors,
Greenlam Industries Ltd.
(a) We have reviewed the Financial Statements and the Cash Flow Statement for the financial year ended on March
31, 2017 and that to the best of our knowledge and belief:
i. these statements do not contain any materially untrue statement or omit any material fact or contain
statements that might be misleading;
ii. these statements together present a true and fair view of the Company’s affairs and are in compliance with
existing Accounting Standards, applicable laws and regulations.
(b) There are, to the best of our knowledge and belief, no transactions entered into by the Company during the year
which are fraudulent, illegal or violative of the Company’s code of conduct.
(c) We accept responsibility for establishing and maintaining internal controls for financial reporting and that we
have evaluated the effectiveness of internal control systems of the Company pertaining to financial reporting
and we have disclosed to the Auditors and the Audit Committee, deficiencies in the design or operation of such
internal controls, if any, of which we are aware and the steps we have taken or propose to take to rectify these
deficiencies.
(d) We have indicated to the Auditors and the Audit Committee that there are no:
i. Significant changes in internal control over financial reporting during the year;
ii. Significant changes in accounting policies during the year and the same have been disclosed in the notes to
the financial statements; and
iii. Instances of significant fraud of which we have become aware and the involvement therein of the
management or an employee having a significant role in the Company’s internal control system over financial
reporting.
Saurabh Mittal Ashok Kumar SharmaManaging Director & CEO Chief Financial Officer
[DIN: 00273917]
Place: New Delhi
Dated: May 25, 2017
Certification by Chief Executive Officer and Chief Financial Officer pursuant to Regulation 17(8) of SEBI (Listing Obligations and
Disclosure Requirements) Regulations, 2015
To
The Members,
Greenlam Industries Ltd.
In accordance with Regulation 26(3) of SEBI (Listing Obligations and Disclosure Requirements) Regulations, 2015, I
hereby confirm that, all the Directors and Senior Management Personnel of the Company have affirmed compliance
with the Code of Conduct, as applicable to them, for the financial year ended on March 31, 2017.
Saurabh MittalPlace: New Delhi Managing Director & CEO
Dated: May 25, 2017 [DIN: 00273917]
Declaration by the Managing Director and CEO under Regulation 26(3) read with Part D of Schedule V of SEBI (Listing Obligations and Disclosure Requirements) Regulations, 2015 regarding Compliance with Code of Conduct
Annual Report 2016-17 l 99
To
The Members,
Greenlam Industries Ltd.
We have examined the compliance of conditions of Corporate Governance by Greenlam Industries Ltd., for the year
ended on March 31, 2017, as stipulated in SEBI (Listing Obligations and Disclosure Requirements) Regulations, 2015.
The compliance of conditions of Corporate Governance is the responsibility of the Company’s Management. Our
examination was limited to procedures and implementation thereof, adopted by the Company for ensuring the
compliance of the conditions of the Corporate Governance. It is neither an audit nor an expression of opinion on the
Financial Statements of the Company.
We certify that the Company has complied with the conditions of Corporate Governance as stipulated in the above
mentioned SEBI (Listing Obligations and Disclosure Requirements) Regulations, 2015.
We state that in respect of investor grievances received during the year ended March 31, 2017, no investor grievances
are pending against the Company, as per the records maintained by the Company and presented to the Stakeholders’
Relationship Committee.
We further state that such compliance is neither an assurance as to future viability of the Company nor the efficiency
or effectiveness with which the management has conducted the affairs of the Company.
For D. DHANDARIA & COMPANY Chartered Accountants
ICAI Firm Reg. No. 306147E
Place of Signature: New Delhi
Dated: May 25, 2017 Dindayal Dhandaria Partner
Membership No. 010928
AUDITORS’ CERTIFICATE
100 l Greenlam Industries Limited
Annual Report 2016-17 l 101
FINANCIAL SECTION
102 l Greenlam Industries Limited
REPORT ON THE STANDALONE FINANCIAL STATEMENTSWe have audited the accompanying standalone
financial statements of GREENLAM INDUSTRIES LIMITED
(“the Company”), which comprise the Balance Sheet
as at 31 March 2017, the Statement of Profit and Loss,
the Cash Flow Statement for the year then ended, and
a summary of the significant accounting policies and
other explanatory information.
MANAGEMENT’S RESPONSIBILITY FOR THE STANDALONE FINANCIAL STATEMENTSThe Company’s Board of Directors is responsible for the
matters stated in Section 134(5) of the Companies Act,
2013 (“the Act”) with respect to the preparation of these
standalone financial statements that give a true and fair
view of the financial position, financial performance
and cash flows of the Company in accordance with
the accounting principles generally accepted in
India, including the Accounting Standards specified
under Section 133 of the Act, read with Rule 7 of the
Companies (Accounts) Rules, 2014 and Companies
(Accounting Standards) Amendment Rules, 2016. This
responsibility also includes maintenance of adequate
accounting records in accordance with the provisions
of the Act for safeguarding of the assets of the Company
and for preventing and detecting frauds and other
irregularities; selection and application of appropriate
accounting policies; making judgments and estimates
that are reasonable and prudent; and design,
implementation and maintenance of adequate internal
financial controls, that were operating effectively
for ensuring the accuracy and completeness of the
accounting records, relevant to the preparation and
presentation of the financial statements that give a true
and fair view and are free from material misstatement,
whether due to fraud or error.
AUDITOR’S RESPONSIBILITYOur responsibility is to express an opinion on these
standalone financial statements based on our audit. We
have taken into account the provisions of the Act, the
accounting and auditing standards and matters which are required to be included in the audit report under the provisions of the Act and the Rules made thereunder.
We conducted our audit in accordance with the Standards on Auditing specified under Section 143(10) of the Act. Those Standards require that we comply with ethical requirements and plan and perform the audit to obtain reasonable assurance about whether the financial statements are free from material misstatement.
An audit involves performing procedures to obtain audit evidence about the amounts and the disclosures in the financial statements. The procedures selected depend on the auditor’s judgment, including the assessment of the risks of material misstatement of the financial statements, whether due to fraud or error. In making those risk assessments, the auditor considers internal financial control relevant to the Company’s preparation of the financial statements that give a true and fair view in order to design audit procedures that are appropriate in the circumstances. An audit also includes evaluating the appropriateness of the accounting policies used and the reasonableness of the accounting estimates made by the Company’s Directors, as well as evaluating the overall presentation of the financial statements.
We believe that the audit evidence we have obtained is sufficient and appropriate to provide a basis for our audit opinion on the standalone financial statements.
OPINIONIn our opinion and to the best of our information and
according to the explanations given to us, the aforesaid
standalone financial statements give the information
required by the Act in the manner so required and give
a true and fair view in conformity with the accounting
principles generally accepted in India, of the state of
affairs of the Company as at 31March 2017, and its profit
and its cash flows for the year ended on that date.
REPORT ON OTHER LEGAL AND REGULATORY REQUIREMENTS1. As required by the Companies (Auditor’s Report)
Order, 2016 (“the Order”) issued by the Central
Independent Auditors’ Report
To
The Members of
Greenlam Industries Limited
Annual Report 2016-17 l 103
Government of India in terms of sub-section (11) of
Section 143 of the Act, we give in the Annexure ‘A’ a
statement on the matters specified in paragraphs 3 and
4 of the Order.
2. As required by Section 143 (3) of the Act, we report
that:
(a) We have sought and obtained all the
information and explanations which to
the best of our knowledge and belief were
necessary for the purposes of our audit.
(b) In our opinion, proper books of account
as required by the law have been kept by
the Company so far as it appears from our
examination of those books.
(c) The Balance Sheet, the Statement of Profit
and Loss and the Cash Flow Statement dealt
with by this Report are in agreement with the
books of account.
(d) In our opinion, the aforesaid standalone
financial statements comply with the
Accounting Standards specified under
Section 133 of the Act, read with Rule 7
of the Companies (Accounts) Rules, 2014
and Companies (Accounting Standards)
Amendment Rules, 2016.
(e) On the basis of the written representations
received from the directors and taken on
record by the Board of Directors, none of the
directors is disqualified as on 31 March 2017
from being appointed as a director in terms of
Section 164 (2) of the Act.
(f ) With respect to the adequacy of the internal
financial controls over financial reporting of
the Company and the operating effectiveness
of such controls, refer to our separate Report
in “Annexure B”.
(g) With respect to the other matters to be
included in the Auditor’s Report in accordance
with Rule 11 of the Companies (Audit and
Auditors) Rules, 2014, in our opinion and to
the best of our information and according to
the explanations given to us:
i. The Company has disclosed the impact
of pending litigations on its financial
position in its financial statements – Refer
Note 20.1.1 to the financial statements;
ii. The Company did not have any long-
term contracts including derivative
contracts for which there were any
material foreseeable losses;
iii. There were no amounts which were
required to be transferred to the Investor
Education and Protection Fund by the
Company.
iv. The Company has provided requisite
disclosures in the financial statements as
to holdings as well as dealings in Specified
Bank Notes during the period from 8th
November 2016 to 30th December 2016
and the same are in accordance with
books of accounts maintained by the
Company and as produced to us by the
Management. (Refer note no. 42)
For D. DHANDARIA & COMPANYChartered Accountants
ICAI Firm Reg. No. 306147E
(Dindayal Dhandaria)Partner
Membership No. 010928
Place of Signature: New Delhi
Date : 25th May, 2017
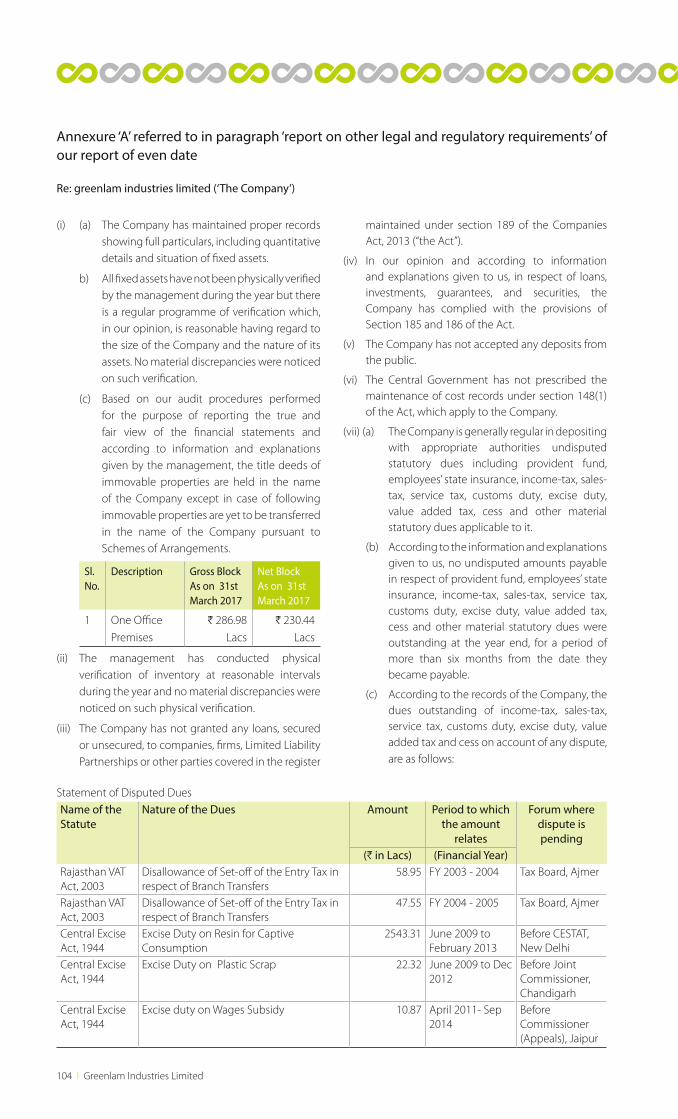
104 l Greenlam Industries Limited
(i) (a) The Company has maintained proper records showing full particulars, including quantitative details and situation of fixed assets.
b) All fixed assets have not been physically verified by the management during the year but there is a regular programme of verification which, in our opinion, is reasonable having regard to the size of the Company and the nature of its assets. No material discrepancies were noticed on such verification.
(c) Based on our audit procedures performed for the purpose of reporting the true and fair view of the financial statements and according to information and explanations given by the management, the title deeds of immovable properties are held in the name of the Company except in case of following immovable properties are yet to be transferred in the name of the Company pursuant to Schemes of Arrangements.
Sl.No.
Description Gross Block As on 31st March 2017
Net Block As on 31st March 2017
1 One Office
Premises
H 286.98
Lacs
H 230.44
Lacs
(ii) The management has conducted physical verification of inventory at reasonable intervals during the year and no material discrepancies were noticed on such physical verification.
(iii) The Company has not granted any loans, secured or unsecured, to companies, firms, Limited Liability Partnerships or other parties covered in the register
maintained under section 189 of the Companies Act, 2013 (“the Act”).
(iv) In our opinion and according to information and explanations given to us, in respect of loans, investments, guarantees, and securities, the Company has complied with the provisions of Section 185 and 186 of the Act.
(v) The Company has not accepted any deposits from the public.
(vi) The Central Government has not prescribed the maintenance of cost records under section 148(1) of the Act, which apply to the Company.
(vii) (a) The Company is generally regular in depositing with appropriate authorities undisputed statutory dues including provident fund, employees’ state insurance, income-tax, sales-tax, service tax, customs duty, excise duty, value added tax, cess and other material statutory dues applicable to it.
(b) According to the information and explanations given to us, no undisputed amounts payable in respect of provident fund, employees’ state insurance, income-tax, sales-tax, service tax, customs duty, excise duty, value added tax, cess and other material statutory dues were outstanding at the year end, for a period of more than six months from the date they became payable.
(c) According to the records of the Company, the dues outstanding of income-tax, sales-tax, service tax, customs duty, excise duty, value added tax and cess on account of any dispute, are as follows:
Annexure ‘A’ referred to in paragraph ‘report on other legal and regulatory requirements’ of our report of even date
Re: greenlam industries limited (‘The Company’)
Statement of Disputed DuesName of the Statute
Nature of the Dues Amount Period to which the amount
relates
Forum where dispute is pending
(H in Lacs) (Financial Year)Rajasthan VAT Act, 2003
Disallowance of Set-off of the Entry Tax in respect of Branch Transfers
58.95 FY 2003 - 2004 Tax Board, Ajmer
Rajasthan VAT Act, 2003
Disallowance of Set-off of the Entry Tax in respect of Branch Transfers
47.55 FY 2004 - 2005 Tax Board, Ajmer
Central Excise Act, 1944
Excise Duty on Resin for Captive Consumption
2543.31 June 2009 to February 2013
Before CESTAT, New Delhi
Central Excise Act, 1944
Excise Duty on Plastic Scrap 22.32 June 2009 to Dec 2012
Before Joint Commissioner, Chandigarh
Central Excise Act, 1944
Excise duty on Wages Subsidy 10.87 April 2011- Sep 2014
Before Commissioner (Appeals), Jaipur
Annual Report 2016-17 l 105
(viii) Based on our audit procedures performed for the
purpose of reporting the true and fair view of the
financial statements and according to information
and explanations given by the management, we are
of the opinion that the Company has not defaulted
in repayment of dues to any bank. Further, the
Company does not have any debentures and loan
from financial institution or government.
(ix) According to the information and explanations
given by the management, the Company has not
raised any money way of initial public offer / further
public offer / debt instruments and term loans and
hence, reporting under clause (ix) is not applicable
to the Company and hence not commented upon.
(x) According to the information and explanations
given to us by the Management, no fraud on or
by the Company was noticed and detected by the
Management during the year.
(xi) Subject to the approval of the shareholders,
the Board of Directors resolved to increase the
managerial remuneration with effect from 1st
October, 2016. Accordingly, the Company has paid/
provided an additional sum of H106.62 lacs which,
in the event of non-approval by shareholders
would be adjusted against commission due to
them. Except this, the Company has paid/provided
for managerial remuneration in accordance with
requisite approvals mandated by the provisions of
section 197 read with Schedule V of the Companies
Act, 2013.
(xii) In our opinion, the Company is not a nidhi
company. Therefore, the provisions of clause 3(xii)
of the Order are not applicable to the Company
and hence not commented upon.
(xiii) Based on our audit procedures performed for
the purpose of reporting the true and fair view
of the financial statements and according to
the information and explanations given by the
management, transactions with the related parties
are in compliance with Section 177 and 188 of
Companies Act, 2013 where applicable and the
details have been disclosed in the notes to the
financial statements, as required by the applicable
accounting standards.
(xiv) According to the information and explanations
given to us and on an overall examination of the
balance sheet, the Company has not made any
preferential allotment or private placement of
shares or fully or partly convertible debentures
during the year under review and hence not
commented upon.
(xv) Based on our audit procedures performed for
the purpose of reporting the true and fair view
of the financial statements and according to
the information and explanations given by the
management, the Company has not entered
into any non-cash transactions with directors or
persons connected with him.
(xvi) According to the information and explanations
given to us, the provisions of Section 45-IA of the
Reserve Bank of India Act, 1934 are not applicable
to the Company.
For D. DHANDARIA & COMPANYChartered Accountants
ICAI Firm Reg. No. 306147E
(Dindayal Dhandaria)Partner
Membership No. 010928
Place of Signature: New Delhi
Date : 25th May, 2017
106 l Greenlam Industries Limited
We have audited the internal financial controls over
financial reporting of GREENLAM INDUSTRIES LIMITED
(“the Company”) as of March 31, 2017 in conjunction
with our audit of the financial statements of the
Company for the year ended on that date.
MANAGEMENT’S RESPONSIBILITY FOR INTERNAL FINANCIAL CONTROLSThe Company’s Management is responsible for
establishing and maintaining internal financial controls
based on the internal control over financial reporting
criteria established by the Company considering the
essential components of internal control stated in the
Guidance Note on Audit of Internal Financial Controls
Over Financial Reporting issued by the Institute of
Chartered Accountants of India. These responsibilities
include the design, implementation and maintenance of
adequate internal financial controls that were operating
effectively for ensuring the orderly and efficient conduct
of its business, including adherence to the Company’s
policies, the safeguarding of its assets, the prevention
and detection of frauds and errors, the accuracy and
completeness of the accounting records, and the timely
preparation of reliable financial information, as required
under the Companies Act, 2013.
AUDITOR’S RESPONSIBILITYOur responsibility is to express an opinion on the
Company’s internal financial controls over financial
reporting based on our audit. We conducted our audit
in accordance with the Guidance Note on Audit of
Internal Financial Controls Over Financial Reporting
(the “Guidance Note”) and the Standards on Auditing as
specified under Section 143(10) of the Companies Act,
2013, to the extent applicable to an audit of internal
financial controls, both applicable to an audit of Internal
Financial Controls and, both issued by the Institute
of Chartered Accountants of India. Those Standards
and the Guidance Note require that we comply with
ethical requirements and plan and perform the audit to
obtain reasonable assurance about whether adequate
internal financial controls over financial reporting
was established and maintained and if such controls
operated effectively in all material respects.
Our audit involves performing procedures to obtain
audit evidence about the adequacy of the internal
financial controls system over financial reporting and
their operating effectiveness. Our audit of internal
financial controls over financial reporting included
obtaining an understanding of internal financial
controls over financial reporting, assessing the risk that
a material weakness exists, and testing and evaluating
the design and operating effectiveness of internal
control based on the assessed risk. The procedures
selected depend on the auditor’s judgment, including
the assessment of the risks of material misstatement of
the financial statements, whether due to fraud or error.
We believe that the audit evidence we have obtained
is sufficient and appropriate to provide a basis for our
audit opinion on the internal financial controls system
over financial reporting.
MEANING OF INTERNAL FINANCIAL CONTROLS OVER FINANCIAL REPORTINGA Company’s internal financial control over financial
reporting is a process designed to provide reasonable
assurance regarding the reliability of financial reporting
and the preparation of financial statements for external
purposes in accordance with generally accepted
accounting principles. A Company’s internal financial
control over financial reporting includes those policies
and procedures that (1) pertain to the maintenance of
records that, in reasonable detail, accurately and fairly
reflect the transactions and dispositions of the assets
of the Company; (2) provide reasonable assurance
that transactions are recorded as necessary to permit
preparation of financial statements in accordance
with generally accepted accounting principles, and
that receipts and expenditures of the Company are
being made only in accordance with authorisations of
management and directors of the Company; and (3)
provide reasonable assurance regarding prevention or
timely detection of unauthorised acquisition, use, or
Annexure ‘B’ to the Independent Auditor’s Report of even date on the Financial Statements of Greenlam Industries Limted
REPORT ON THE INTERNAL FINANCIAL CONTROLS UNDER CLAUSE (I) OF SUB-SECTION 3 OF SECTION 143 OF THE COMPANIES ACT, 2013 (“THE ACT”)
To
The Members of
Greenlam Industries Limited
Annual Report 2016-17 l 107
disposition of the Company’s assets that could have a
material effect on the financial statements.
INHERENT LIMITATIONS OF INTERNAL FINANCIAL CONTROLS OVER FINANCIAL REPORTING
Because of the inherent limitations of internal
financial controls over financial reporting, including
the possibility of collusion or improper management
override of controls, material misstatements due to
error or fraud may occur and not be detected. Also,
projections of any evaluation of the internal financial
controls over financial reporting to future periods are
subject to the risk that the internal financial control over
financial reporting may become inadequate because of
changes in conditions, or that the degree of compliance
with the policies or procedures may deteriorate.
OPINIONIn our opinion, the Company has, in all material respects,
an adequate internal financial controls system over
financial reporting and such internal financial controls
over financial reporting were operating effectively as
at March 31, 2017, based on the internal control over
financial reporting criteria established by the Company
considering the essential components of internal
control stated in the Guidance Note on Audit of Internal
Financial Controls Over Financial Reporting issued by
the Institute of Chartered Accountants of India.
EXPLANATORY PARAGRAPHWe also have audited, in accordance with the Standards
on Auditing issued by the Institute of Chartered
Accountants of India, as specified under Section 143(10)
of the Act, the financial statements of Company, which
comprise the Balance Sheet as at March 31, 2017, and
the related Statement of Profit and Loss and Cash Flow
Statement for the year then ended, and a summary of
significant accounting policies and other explanatory
information, and our report dated 25th May, 2017
expressed an unqualified opinion thereon.
For D. DHANDARIA & COMPANYChartered Accountants
ICAI Firm Reg. No. 306147E
(Dindayal Dhandaria)Partner
Membership No. 010928
Place of Signature: New Delhi
Date : 25th May, 2017
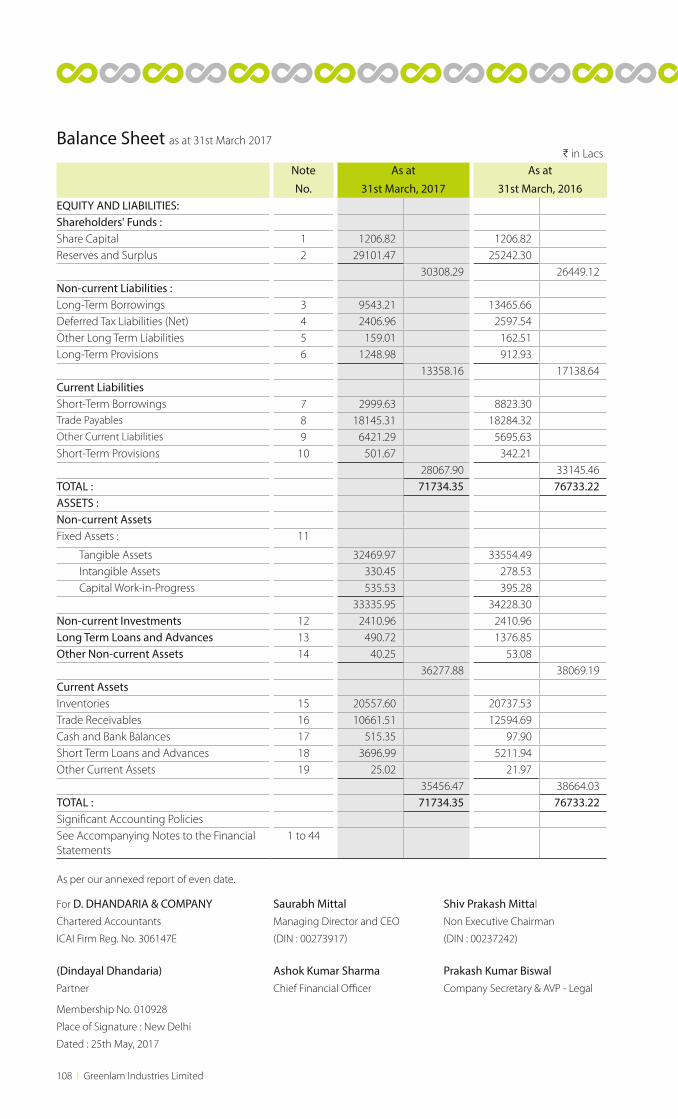
108 l Greenlam Industries Limited
H in LacsNote
No.
As at
31st March, 2017
As at
31st March, 2016EQUITY AND LIABILITIES:Shareholders' Funds :Share Capital 1 1206.82 1206.82 Reserves and Surplus 2 29101.47 25242.30
30308.29 26449.12 Non-current Liabilities :Long-Term Borrowings 3 9543.21 13465.66 Deferred Tax Liabilities (Net) 4 2406.96 2597.54 Other Long Term Liabilities 5 159.01 162.51 Long-Term Provisions 6 1248.98 912.93
13358.16 17138.64 Current LiabilitiesShort-Term Borrowings 7 2999.63 8823.30 Trade Payables 8 18145.31 18284.32 Other Current Liabilities 9 6421.29 5695.63 Short-Term Provisions 10 501.67 342.21
28067.90 33145.46 TOTAL : 71734.35 76733.22 ASSETS :Non-current AssetsFixed Assets : 11
Tangible Assets 32469.97 33554.49 Intangible Assets 330.45 278.53 Capital Work-in-Progress 535.53 395.28
33335.95 34228.30 Non-current Investments 12 2410.96 2410.96 Long Term Loans and Advances 13 490.72 1376.85 Other Non-current Assets 14 40.25 53.08
36277.88 38069.19 Current AssetsInventories 15 20557.60 20737.53 Trade Receivables 16 10661.51 12594.69 Cash and Bank Balances 17 515.35 97.90 Short Term Loans and Advances 18 3696.99 5211.94 Other Current Assets 19 25.02 21.97
35456.47 38664.03 TOTAL : 71734.35 76733.22 Significant Accounting PoliciesSee Accompanying Notes to the Financial Statements
1 to 44
Balance Sheet as at 31st March 2017
As per our annexed report of even date.
For D. DHANDARIA & COMPANY Saurabh Mittal Shiv Prakash Mittal
Chartered Accountants Managing Director and CEO Non Executive Chairman
ICAI Firm Reg. No. 306147E (DIN : 00273917) (DIN : 00237242)
(Dindayal Dhandaria) Ashok Kumar Sharma Prakash Kumar BiswalPartner Chief Financial Officer Company Secretary & AVP - Legal
Membership No. 010928
Place of Signature : New Delhi
Dated : 25th May, 2017
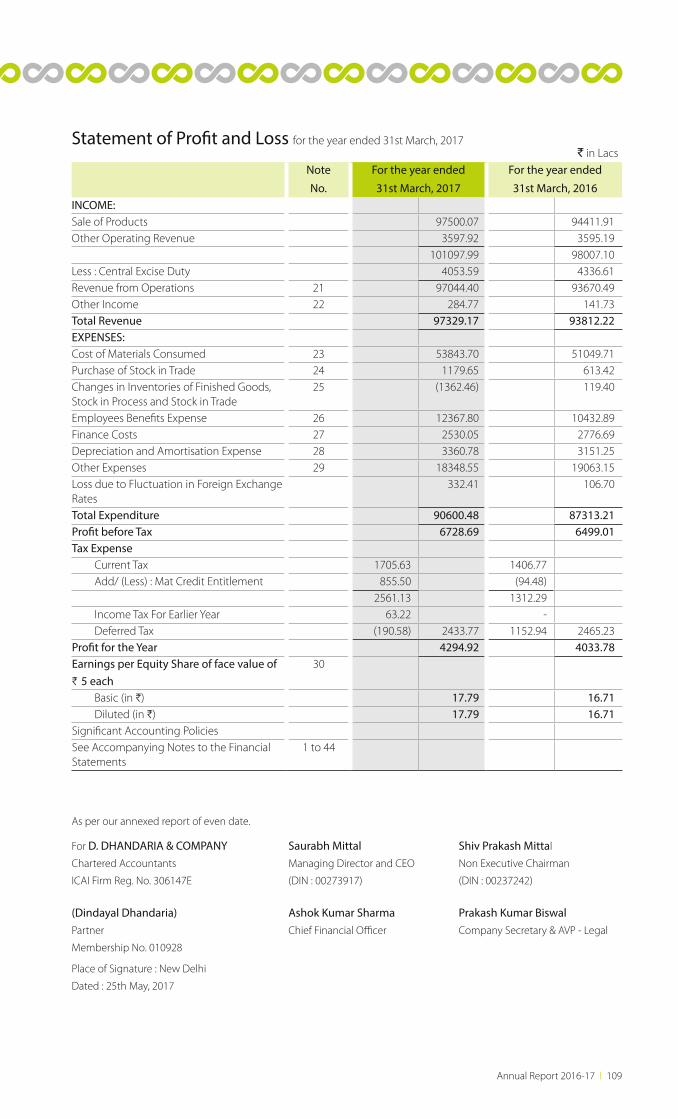
Annual Report 2016-17 l 109
As per our annexed report of even date.
For D. DHANDARIA & COMPANY Saurabh Mittal Shiv Prakash Mittal
Chartered Accountants Managing Director and CEO Non Executive Chairman
ICAI Firm Reg. No. 306147E (DIN : 00273917) (DIN : 00237242)
(Dindayal Dhandaria) Ashok Kumar Sharma Prakash Kumar BiswalPartner Chief Financial Officer Company Secretary & AVP - Legal
Membership No. 010928
Place of Signature : New Delhi
Dated : 25th May, 2017
` in LacsNote
No.
For the year ended
31st March, 2017
For the year ended
31st March, 2016INCOME:Sale of Products 97500.07 94411.91 Other Operating Revenue 3597.92 3595.19
101097.99 98007.10 Less : Central Excise Duty 4053.59 4336.61 Revenue from Operations 21 97044.40 93670.49 Other Income 22 284.77 141.73 Total Revenue 97329.17 93812.22 EXPENSES:Cost of Materials Consumed 23 53843.70 51049.71 Purchase of Stock in Trade 24 1179.65 613.42 Changes in Inventories of Finished Goods, Stock in Process and Stock in Trade
25 (1362.46) 119.40
Employees Benefits Expense 26 12367.80 10432.89 Finance Costs 27 2530.05 2776.69 Depreciation and Amortisation Expense 28 3360.78 3151.25 Other Expenses 29 18348.55 19063.15 Loss due to Fluctuation in Foreign Exchange Rates
332.41 106.70
Total Expenditure 90600.48 87313.21 Profit before Tax 6728.69 6499.01 Tax Expense Current Tax 1705.63 1406.77 Add/ (Less) : Mat Credit Entitlement 855.50 (94.48)
2561.13 1312.29 Income Tax For Earlier Year 63.22 - Deferred Tax (190.58) 2433.77 1152.94 2465.23 Profit for the Year 4294.92 4033.78 Earnings per Equity Share of face value of H 5 each
30
Basic (in H) 17.79 16.71 Diluted (in H) 17.79 16.71 Significant Accounting PoliciesSee Accompanying Notes to the Financial Statements
1 to 44
Statement of Profit and Loss for the year ended 31st March, 2017
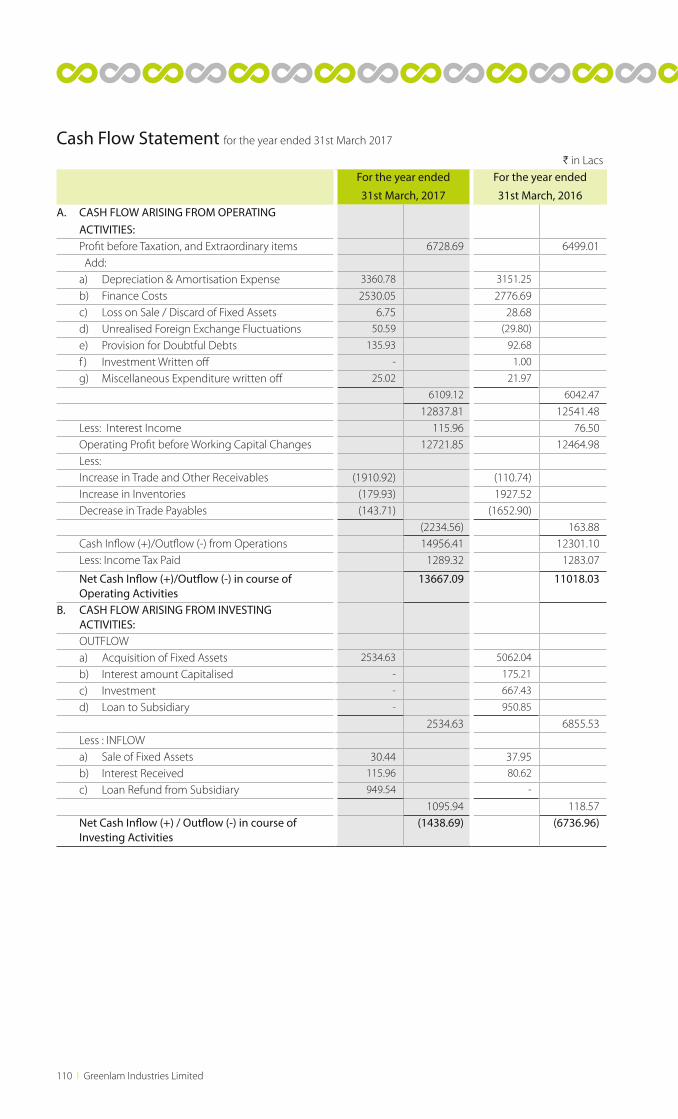
110 l Greenlam Industries Limited
H in LacsFor the year ended
31st March, 2017
For the year ended
31st March, 2016A. CASH FLOW ARISING FROM OPERATING ACTIVITIES: Profit before Taxation, and Extraordinary items 6728.69 6499.01 Add: a) Depreciation & Amortisation Expense 3360.78 3151.25
b) Finance Costs 2530.05 2776.69 c) Loss on Sale / Discard of Fixed Assets 6.75 28.68 d) Unrealised Foreign Exchange Fluctuations 50.59 (29.80)
e) Provision for Doubtful Debts 135.93 92.68
f ) Investment Written off - 1.00
g) Miscellaneous Expenditure written off 25.02 21.97
6109.12 6042.47
12837.81 12541.48 Less: Interest Income 115.96 76.50 Operating Profit before Working Capital Changes 12721.85 12464.98 Less: Increase in Trade and Other Receivables (1910.92) (110.74) Increase in Inventories (179.93) 1927.52 Decrease in Trade Payables (143.71) (1652.90)
(2234.56) 163.88 Cash Inflow (+)/Outflow (-) from Operations 14956.41 12301.10 Less: Income Tax Paid 1289.32 1283.07
Net Cash Inflow (+)/Outflow (-) in course of Operating Activities
13667.09 11018.03
B. CASH FLOW ARISING FROM INVESTING ACTIVITIES: OUTFLOW a) Acquisition of Fixed Assets 2534.63 5062.04
b) Interest amount Capitalised - 175.21
c) Investment - 667.43
d) Loan to Subsidiary - 950.85
2534.63 6855.53 Less : INFLOW a) Sale of Fixed Assets 30.44 37.95 b) Interest Received 115.96 80.62
c) Loan Refund from Subsidiary 949.54 -
1095.94 118.57 Net Cash Inflow (+) / Outflow (-) in course of Investing Activities
(1438.69) (6736.96)
Cash Flow Statement for the year ended 31st March 2017
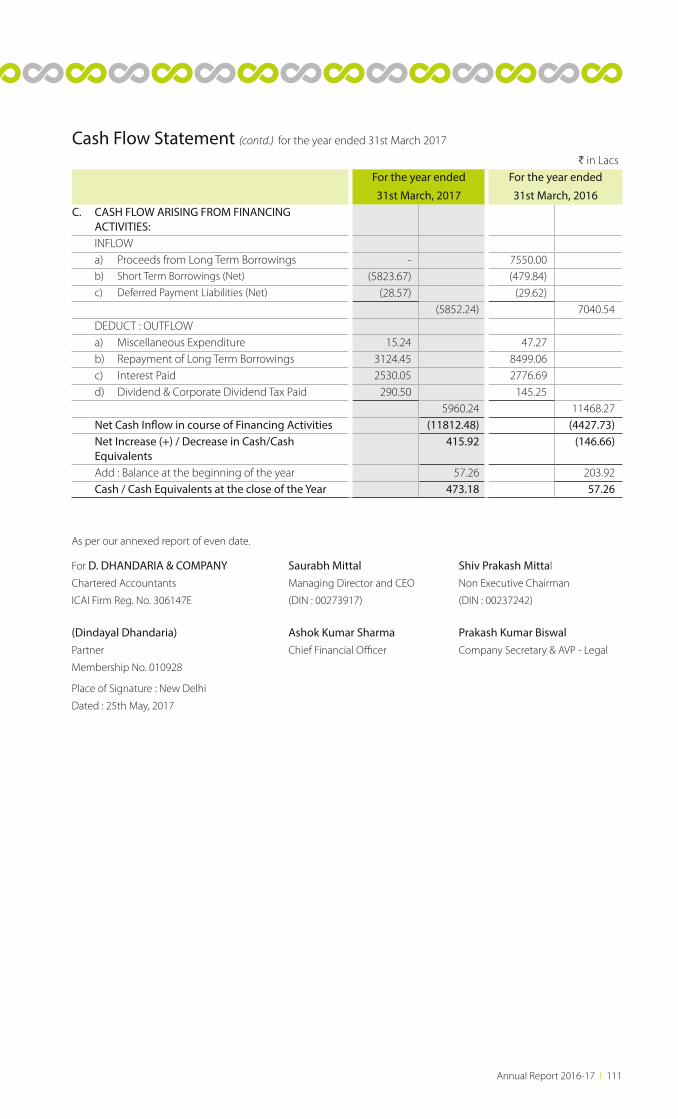
Annual Report 2016-17 l 111
H in LacsFor the year ended
31st March, 2017
For the year ended
31st March, 2016C. CASH FLOW ARISING FROM FINANCING ACTIVITIES: INFLOW a) Proceeds from Long Term Borrowings - 7550.00 b) Short Term Borrowings (Net) (5823.67) (479.84) c) Deferred Payment Liabilities (Net) (28.57) (29.62)
(5852.24) 7040.54 DEDUCT : OUTFLOW a) Miscellaneous Expenditure 15.24 47.27 b) Repayment of Long Term Borrowings 3124.45 8499.06 c) Interest Paid 2530.05 2776.69 d) Dividend & Corporate Dividend Tax Paid 290.50 145.25
5960.24 11468.27 Net Cash Inflow in course of Financing Activities (11812.48) (4427.73) Net Increase (+) / Decrease in Cash/Cash Equivalents
415.92 (146.66)
Add : Balance at the beginning of the year 57.26 203.92 Cash / Cash Equivalents at the close of the Year 473.18 57.26
Cash Flow Statement (contd.) for the year ended 31st March 2017
As per our annexed report of even date.
For D. DHANDARIA & COMPANY Saurabh Mittal Shiv Prakash Mittal
Chartered Accountants Managing Director and CEO Non Executive Chairman
ICAI Firm Reg. No. 306147E (DIN : 00273917) (DIN : 00237242)
(Dindayal Dhandaria) Ashok Kumar Sharma Prakash Kumar BiswalPartner Chief Financial Officer Company Secretary & AVP - Legal
Membership No. 010928
Place of Signature : New Delhi
Dated : 25th May, 2017
112 l Greenlam Industries Limited
1.00 SIGNIFICANT ACCOUNTING POLICIES:
1.01 DISCLOSURE OF ACCOUNTING POLICIES (AS-1):
1.01.01 Nature of Operation Company is engaged in the business of manufacturing laminates, decorative veneers and allied
products through its factories at various locations and branches and dealers’ network spread all
over the country. It has two wholly owned subsidiary companies operating in overseas countries.
It imports raw materials for manufacturing. Manufactured goods are sold both in domestic and
overseas markets. The Overseas subsidiaries of the Company are mainly engaged in marketing
and distribution of Company’s products.
1.01.02 Accounting Concepts & Basis of Presentation
The financial Statements are prepared in accordance with the Indian Generally Accepted
Accounting Principles (GAAP) under the historical cost convention on the accrual basis. GAAP
comprises mandatory accounting standards as specified in the Company (Accounting Standards)
Rules 2006 read with Rule 7(1) of the Companies (Accounts) Rules, 2014 and the provisions of
the Companies Act, 2013. Accounting policies have been consistently applied except where
a newly issued accounting standard is initially adopted or a revision to an existing accounting
standard requires a change in the accounting policy hitherto in use. The Company’s management
evaluates all recently issued or revised accounting standards on an on-going basis.
The Normal Operating Cycle for the Company has been assumed to be of twelve months for
classification of its various assets and liabilities into “Current” and “Non-current”.
Where changes are made in presentation, the comparative figures of the previous year are
regrouped and re-arranged accordingly.
1.01.03 Use of Estimates:
The preparation of financial statements in conformity with Generally Accepted Accounting
Principles requires management to make estimates and assumptions that affect the reported
amounts of assets and liabilities and disclosure of contingent liabilities at the date of the financial
statements and the results of operations during the reporting period end. Although these
estimates are based upon management’s best knowledge of current events and actions, actual
results could differ from these estimates.
1.02 VALUATION OF INVENTORIES (AS-2): 1.02.01 Stock of Raw Materials, Stores and spare parts are valued at lower of cost or net realisable value;
and of those in transit related to these items are valued at lower of cost to date or net realisable
value.
1.02.02 Goods-in-process is valued at lower of cost or net realisable value
1.02.03 Stock of Finished goods is valued at lower of cost or net realisable value
1.02.04 Stock-in-trade is valued at lower of cost or net realisable value.
1.02.05 Waste and scraps are accounted at estimated realisable value.
1.02.06 Cost of inventories is ascertained on the ‘weighted average’ basis. Goods-in-process and finished
goods are valued on absorption cost basis.
1.02.07 The self-generated Certified Emission Reductions (CERs) are recognized as asset on certification
by UNFCCC and are valued at lower of cost or net realisable value.
1.03 CASH FLOW STATEMENT (AS – 3): Cash flows are reported using indirect method, whereby profit before tax is adjusted for the effects of
transactions of a non-cash nature and any deferrals or accruals of past or future cash receipts or payments.
The cash flow from regular revenue generating, financing and investing activities of the Company is
segregated. Cash and cash equivalents in the balance sheet comprise cash at bank, cash/cheques in hand
Significant Accounting Policies
Annual Report 2016-17 l 113
and short term investments (excluding pledged term deposits) with an original maturity of three months
or less.
1.04 CONTINGENCIES AND EVENTS OCCURRING AFTER BALANCE SHEET DATE (AS -4): Disclosure of contingencies as required by the accounting standard is furnished in the Notes on accounts.
1.05 DEPRECIATION (AS – 6): 1.05.01 Tangible assets are depreciated and/or amortised on the basis of their useful lives as notified in
Schedule II to the Companies Act, 2013. Depreciation in respect of additions to assets has been
charged on pro rata basis with reference to the period when the assets are ready for use. The
provision for depreciation for multiple shifts has been made in respect of eligible assets on the
basis of operation of respective units. Where the historical cost of a depreciable asset undergoes
a change due to increase or decrease in long term liability on account of exchange fluctuations,
the depreciation on the revised unamortised depreciable amount is provided prospectively over
the residual useful life of the asset.
1.05.02 Leasehold lands are amortised over the period of lease.
1.05.03 Intangible assets are amortised on straight-line method as follows :
Trademarks - 10 years
Computer Software - 5 years
Technical Know-how - 2 years
1.06 REVENUE RECOGNITION (AS -9): Revenue is recognized to the extent that it is probable that the economic benefits will flow to the Company
and the revenue can be reliably measured.
1.06.01 Sale of Goods: Revenue from sales of goods is recognised on transfer of significant risks and
rewards of ownership to the customers. Gross sales shown in the Statement of Profit & Loss are
inclusive of Excise Duty but excludes Trade discounts, CST and VAT. Net sales are shown after
deducting Excise duty which is disclosed at appropriate places.
1.06.02 Interest: Interest income is recognized on a time proportion basis taking into account the amount
outstanding and rate applicable.
1.06.03 Dividends: Dividend from investment is recognized when the Company in which they are held
declares the dividend and when the right to receive the same is established.
1.06.04 Insurance Claims: Insurance Claims are accounted for on acceptance and when there is a
reasonable certainty of receiving the same, on grounds of prudence.
1.06.05 Export Incentives: Benefit on account of entitlement to import goods free of duty under the
Advance Authorisation Scheme, Merchandise Export Incentives Scheme (MEIS), Duty Free Import
Authorisation (DFIA) Scheme, and Focus Market Scheme (FMS), are accounted for on accrual basis
at estimated realisable value, as and when exports are made i.e., in the year of export. Profit or loss
arising on utilisation of the same and/or sale thereof are accounted for in the year in which either
the imports are made against the said Advance License, MEIS, DFIA, FMS and/or the same are
sold.
1.07 ACCOUNTING FOR TANGIBLE AND INTANGIBLE ASSETS (AS – 10): 1.07.01 Tangible assets are stated at original cost (net of tax/duty credit availed) less accumulated
depreciation, amortisation and impairment losses except freehold land which is carried at
cost. Cost includes cost of acquisition, construction and installation, taxes, duties, freight, other
incidental expenses related to the acquisition, trial run expenses (net of revenue) and pre-operative
expenses including attributable borrowing costs incurred during pre-operational period.
1.07.02 Tangible assets which are not ready for their intended use on reporting date are carried as capital
work-in-progress at cost, comprising direct cost and related incidental expenses.
Significant Accounting Policies
114 l Greenlam Industries Limited
1.07.03 The Company has exercised the option available to it under Rule 46A of the Companies (Accounting
Standards) (Second Amendment) Rules, 2011 in respect of accounting for fluctuations in foreign
exchange relating to “Long Term Foreign Currency Monetary Items”.
1.07.04 Intangible assets are carried at cost, net of accumulated amortization and impairment loss, if any.
1.08 ACCOUNTING FOR THE EFFECTS IN FOREIGN EXCHANGE RATES (AS – 11): 1.08.01 Initial Recognition: Transactions denominated in foreign currencies are normally recorded at the
exchange rates prevailing at the time of the transactions.
1.08.02 Conversion: Foreign currency monetary items are reported using the closing rate. Non-monetary
items which are carried in terms of historical cost denominated in a foreign currency are reported
using the exchange rate at the date of the transaction.
1.08.03 Exchange Differences: Exchange differences arising on the settlement of monetary items or on
reporting company’s monetary items at rates different from those at which they were initially
recorded during the year, or reported in previous financial statements, are recognized as income
or expenses in the year in which they arise.
1.08.04 Forward exchange contracts entered into to hedge foreign currency risk of an existing asset/liability: The premium or discount arising at the inception of forward exchange contract
is recognized as an expense/income on the date of transaction. Any profit or loss arising on
cancellation or renewal of such forward exchange contract is also recognized as income or
expense for the period. However, in case of long term liabilities, where they relate to acquisition of
fixed assets, the income or expense on account of exchange difference is adjusted to the carrying
cost of such assets.
1.09 ACCOUNTING FOR INVESTMENTS (AS – 13): Investments that are readily realisable and intended to be held for not more than a year are classified as
Current investments. All other investments are classified as Non-Current/Long-term Investments. Current
investments are carried at lower of cost and market value on individual investment basis. Non-Current/
Long term Investments are considered at cost, unless there is an “other than temporary” decline in value, in
which case adequate provision is made for the diminution in the value of Investments.
1.10 EMPLOYEE BENEFITS (AS – 15): 1.10.01 Short-term employee benefits are recognized as an expense at the undiscounted amount in the
Statement of Profit and Loss of the year in which the related service is rendered.
1.10.02 Post employment and other long term employee benefits are charged off in the year in which the
employee has rendered services. The amount charged off is recognized at the present value of the
amounts payable determined using actuarial valuation techniques. Actuarial gains and losses in
respect of past employment and other long term benefits are charged to the Statement of Profit
and Loss.
1.11 BORROWING COSTS (AS – 16): Borrowing costs that are attributable to the acquisition or construction of qualifying assets are capitalised
as part of the cost of such assets. A qualifying asset is one that takes necessarily substantial period of time
to get ready for its intended use. All other borrowing costs are charged to revenue.
1.12 SEGMENT REPORTING (AS – 17): 1.12.01 Identification of Segments:
Primary Segment
Business Segment:
The Company’s operating businesses are organized and managed separately according to the nature of
products, with each segment representing a strategic business unit that offers different products and serves
Significant Accounting Policies
Annual Report 2016-17 l 115
Significant Accounting Policies
different markets. The identified segments are Manufacturing and Sale of (a) Laminate & Allied products; and (b)
Veneer & Allied products.
1.12.01 Secondary Segment
Geographical Segment:
The analysis of geographical segment is based on the geographical location of the customers.
The geographical segments considered for disclosure are as follows:
• Sales within India include sales to customers located within India.
• Sales outside India include sales to customers located outside India.
1.12.02 Allocation of Common costs:
Common allocable costs are allocated to each segment according to the ratio of their respective
turnover to the total turnover.
1.12.03 Unallocated items:
The Unallocated Segment includes general corporate income and expense items, which are not
allocated to any business segment.
1.13 RELATED PARTY DISCLOSURES (AS – 18): Disclosure of related parties as required by the accounting standard is furnished in the Notes on accounts.
1.14 LEASES (AS – 19): In accordance with Accounting Standard 19 “Accounting for leases”, lease arrangements, where the risks and
rewards incidental to ownership of an asset substantially vests with the lessor, are recognized as operating
leases. Lease payments under operating leases are recognized as an expense in the Statement of Profit and
Loss.
1.15 EARNINGS PER SHARE (AS – 20): Basic earnings (loss) per share are calculated by dividing the net profit or loss for the period attributable to
equity shareholders by the weighted average number of equity shares outstanding during the period.
For the purpose of calculating diluted earnings per share, the net profit or loss for the period attributable
to equity shareholders and the weighted average number of shares outstanding during the period are
adjusted for the effects of all dilutive potential equity shares.
1.16 ACCOUNTING FOR TAXES ON INCOME (AS-22): 1.16.01 Tax expenses comprise of current tax and deferred tax including applicable surcharge and cess.
1.16.02 Current Income tax is computed using the tax effect accounting method, where taxes are accrued
in the same period in which the related revenue and expenses arise. A provision is made for
income tax annually, based on the tax liability computed, after considering tax allowances and
exemptions. Provisions are recorded when it is estimated that a liability due to disallowances or
other matters is probable.
1.16.03 The differences that result between the profit considered for income taxes and the profit as per
the financial statements are identified, and thereafter a deferred tax asset or deferred tax liability
is recorded for timing differences, namely the differences that originate in one accounting period
and reverse in another, based on the tax effect of the aggregate amount being considered.
The tax effect is calculated on the accumulated timing differences at the end of an accounting
period based on prevailing enacted or substantially enacted regulations. Deferred Tax Assets and
Deferred Tax Liabilities are offset, if a legally enforceable right exists to set off current tax assets
against current tax liabilities and the Deferred Tax Assets and Deferred Tax Liabilities relate to taxes
on income levied by same governing taxation laws. Deferred Tax Assets are recognized only if
there is reasonable certainty that they will be realized and are reviewed for the appropriateness of
their respective carrying values at each balance sheet date.
116 l Greenlam Industries Limited
Significant Accounting Policies
1.16.04 MAT (Minimum Alternate Tax) credit is recognised as an asset only when and to the extent there
is convincing evidence that the Company will pay normal income tax during the specified period.
In the year in which the MAT credit becomes eligible to be recognized as an asset in accordance
with the recommendations contained in guidance Note issued by the Institute of Chartered
Accountants of India, the said asset is created by way of a credit to the Statement of Profit and
Loss and shown as MAT Credit Entitlement. The Company reviews the same at each balance sheet
date and writes down the carrying amount of MAT Credit Entitlement to the extent there is no
longer convincing evidence to the effect that Company will pay normal Income Tax during the
specified period.
1.17 INTANGIBLE ASSETS (AS – 26): 1.17.01 Internally generated intangible asset under development stage is recognized when it is
demonstrated that it is technically feasible to use the same and the cost incurred for developing
the same is ascertained. Technical Know-how so developed internally is amortised on a straight-
line basis over its estimated useful life.
1.17.02 Intangible assets acquired by payment e.g., Trademarks, Computer Software and Technical Know-
how are disclosed at cost less amortization on a straight-line basis over its estimated useful life.
1.18 IMPAIRMENT OF TANGIBLE AND INTANGIBLE ASSETS (AS-28): At each balance sheet date, the Company reviews the carrying amount of tangible and intangible assets to
determine whether there is any indication of impairment loss. If any such indication exists, the recoverable
amount of the assets is estimated in order to determine the extent of impairment loss. The recoverable
amount is higher of the net selling price and the value in use, determined by discounting the estimated
future cash flows expected from the continuing use of the asset to their present value.
1.19 PROVISIONS, CONTINGENT LIABILITIES AND CONTINGENT ASSETS (AS – 29): 1.19.01 Provisions are made when (a) the Company has a present obligation as a result of past events; (b)
it is probable that an outflow of resources embodying economic benefits will be required to settle
the obligation; and (c) a reliable estimate is made of the amount of the obligation.
1.19.02 Contingent liabilities are not provided for but are disclosed by way of Notes on Accounts.
1.19.03 Contingent assets are neither accounted for nor disclosed by way of Notes on Accounts.
1.20 EXCISE DUTY AND CUSTOM DUTY: Excise Duty on finished goods stock lying at the factories is accounted for at the point of manufacture of
goods and accordingly, is considered for valuation of finished goods lying in the factories as on the Balance
Sheet date. Similarly, Custom Duty on imported material in transit/lying in bonded warehouse is accounted
for at the time of import/bonding of materials.
1.21 CONSUMPTION OF RAW MATERIALS, STORES & SPARE PARTS ETC.: The costs of Raw Materials, Stores and spare parts etc., consumed consist of purchase price including duties
and taxes (other than those subsequently recoverable by the enterprise from the taxing authorities), freight
inwards and other expenditure directly attributable to the procurement.
1.22 SERVICE TAX & CESS: Various expenses are accounted for after deducting the input tax credit available in respect of Service Tax,
Education Cess and Secondary & Higher Education Cess.
1.23 EXPENSES FOR CORPORATE SOCIAL RESPONSIBILITY: In case of CSR activities undertaken by the Company, if any expenditure of revenue nature is incurred or an
irrevocable contribution is made to any agency to be spent by the later on any of the activities mentioned
in Schedule VII to the Companies Act, 2013, the same is charged as an expense to its Statement of Profit
and Loss. In case, the expenditure incurred by the Company is of such a nature which gives rise to an asset,
Annual Report 2016-17 l 117
Significant Accounting Policies
such an asset is recognised where the Company retains the control of the asset and any future economic
benefit accrues to it. A liability incurred by entering into a contractual obligation is recognised to the extent
to which CSR activity is completed during the year.
1.24 MISCELLANEOUS EXPENDITURE WRITTEN OFF: Expenses related to Scheme of Arrangement, Fee for increase in Authorised Share Capital and Preliminary
Expenses are written off in five equal annual installments in accordance with the provisions of Section 35DD
of the Income Tax Act, 1961.
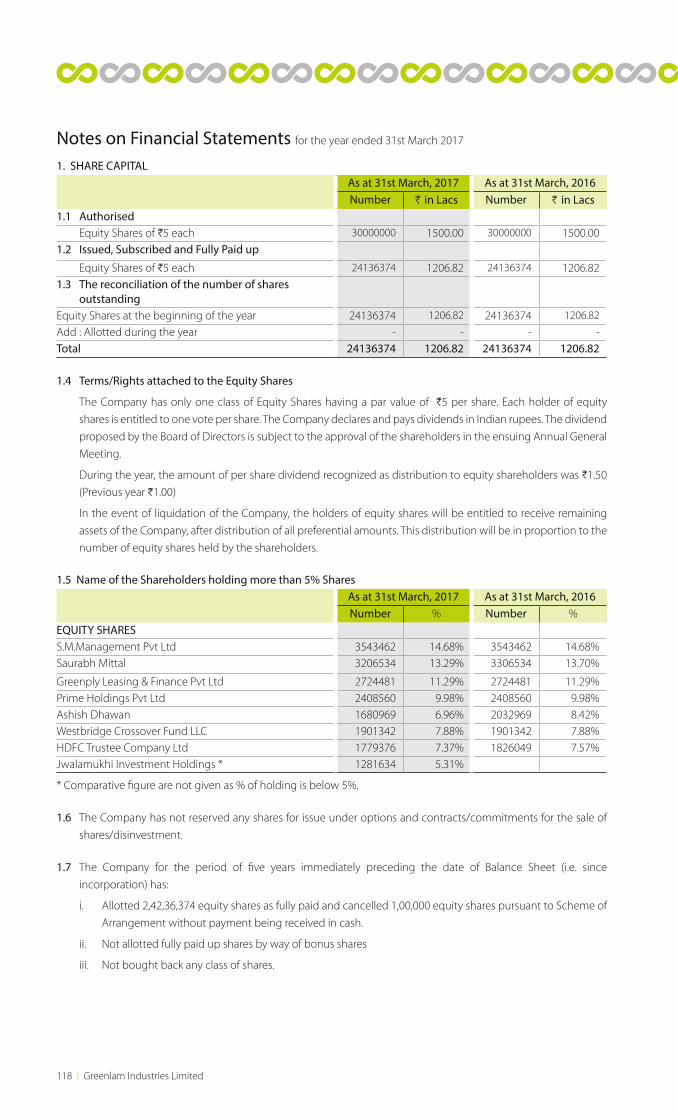
118 l Greenlam Industries Limited
1. SHARE CAPITALAs at 31st March, 2017 As at 31st March, 2016Number H in Lacs Number H in Lacs
1.1 Authorised Equity Shares of H5 each 30000000 1500.00 30000000 1500.00 1.2 Issued, Subscribed and Fully Paid up
Equity Shares of H5 each 24136374 1206.82 24136374 1206.82 1.3 The reconciliation of the number of shares outstandingEquity Shares at the beginning of the year 24136374 1206.82 24136374 1206.82
Add : Allotted during the year - - - -
Total 24136374 1206.82 24136374 1206.82
1.4 Terms/Rights attached to the Equity Shares
The Company has only one class of Equity Shares having a par value of H5 per share. Each holder of equity
shares is entitled to one vote per share. The Company declares and pays dividends in Indian rupees. The dividend
proposed by the Board of Directors is subject to the approval of the shareholders in the ensuing Annual General
Meeting.
During the year, the amount of per share dividend recognized as distribution to equity shareholders was H1.50
(Previous year H1.00)
In the event of liquidation of the Company, the holders of equity shares will be entitled to receive remaining
assets of the Company, after distribution of all preferential amounts. This distribution will be in proportion to the
number of equity shares held by the shareholders.
1.5 Name of the Shareholders holding more than 5% SharesAs at 31st March, 2017 As at 31st March, 2016Number % Number %
EQUITY SHARESS.M.Management Pvt Ltd 3543462 14.68% 3543462 14.68%Saurabh Mittal 3206534 13.29% 3306534 13.70%
Greenply Leasing & Finance Pvt Ltd 2724481 11.29% 2724481 11.29%Prime Holdings Pvt Ltd 2408560 9.98% 2408560 9.98%Ashish Dhawan 1680969 6.96% 2032969 8.42%Westbridge Crossover Fund LLC 1901342 7.88% 1901342 7.88%HDFC Trustee Company Ltd 1779376 7.37% 1826049 7.57%Jwalamukhi Investment Holdings * 1281634 5.31%
* Comparative figure are not given as % of holding is below 5%.
1.6 The Company has not reserved any shares for issue under options and contracts/commitments for the sale of
shares/disinvestment.
1.7 The Company for the period of five years immediately preceding the date of Balance Sheet (i.e. since
incorporation) has:
i. Allotted 2,42,36,374 equity shares as fully paid and cancelled 1,00,000 equity shares pursuant to Scheme of
Arrangement without payment being received in cash.
ii. Not allotted fully paid up shares by way of bonus shares
iii. Not bought back any class of shares.
Notes on Financial Statements for the year ended 31st March 2017
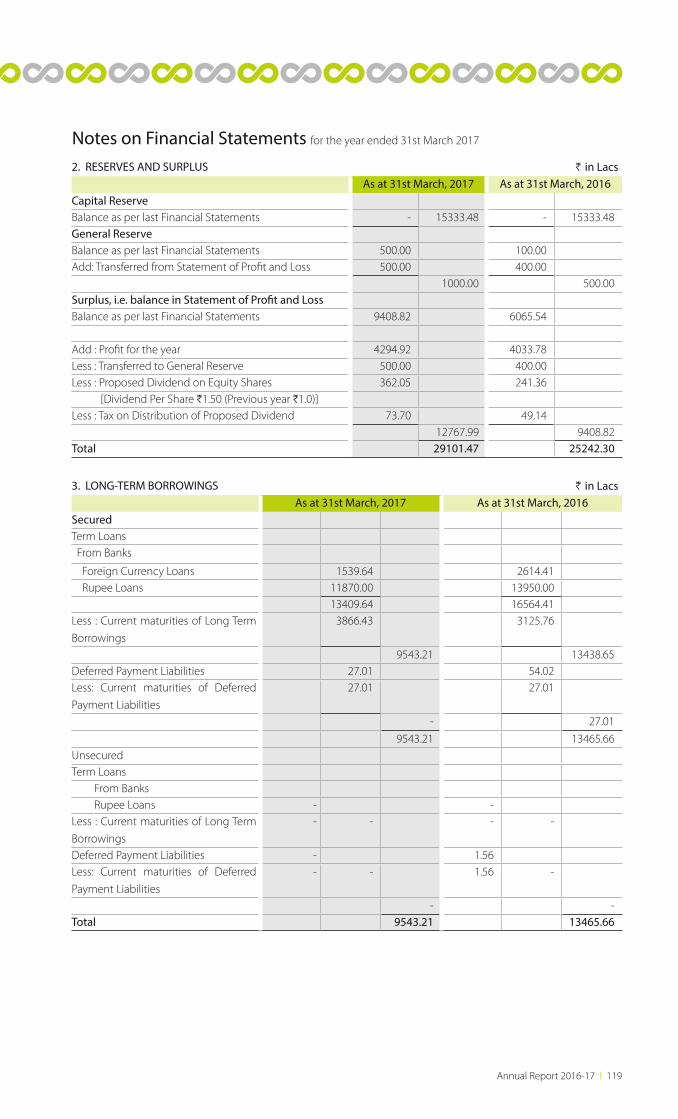
Annual Report 2016-17 l 119
Notes on Financial Statements for the year ended 31st March 2017
2. RESERVES AND SURPLUS H in LacsAs at 31st March, 2017 As at 31st March, 2016
Capital ReserveBalance as per last Financial Statements - 15333.48 - 15333.48General ReserveBalance as per last Financial Statements 500.00 100.00 Add: Transferred from Statement of Profit and Loss 500.00 400.00
1000.00 500.00 Surplus, i.e. balance in Statement of Profit and LossBalance as per last Financial Statements 9408.82 6065.54
Add : Profit for the year 4294.92 4033.78Less : Transferred to General Reserve 500.00 400.00Less : Proposed Dividend on Equity Shares 362.05 241.36 [Dividend Per Share H1.50 (Previous year H1.0)]Less : Tax on Distribution of Proposed Dividend 73.70 49.14
12767.99 9408.82 Total 29101.47 25242.30
3. LONG-TERM BORROWINGS H in LacsAs at 31st March, 2017 As at 31st March, 2016
SecuredTerm Loans From Banks
Foreign Currency Loans 1539.64 2614.41 Rupee Loans 11870.00 13950.00
13409.64 16564.41 Less : Current maturities of Long Term
Borrowings
3866.43 3125.76
9543.21 13438.65Deferred Payment Liabilities 27.01 54.02 Less: Current maturities of Deferred
Payment Liabilities
27.01 27.01
- 27.01
9543.21 13465.66UnsecuredTerm Loans From Banks Rupee Loans - - Less : Current maturities of Long Term
Borrowings
- - - -
Deferred Payment Liabilities - 1.56 Less: Current maturities of Deferred
Payment Liabilities
- - 1.56 -
- - Total 9543.21 13465.66
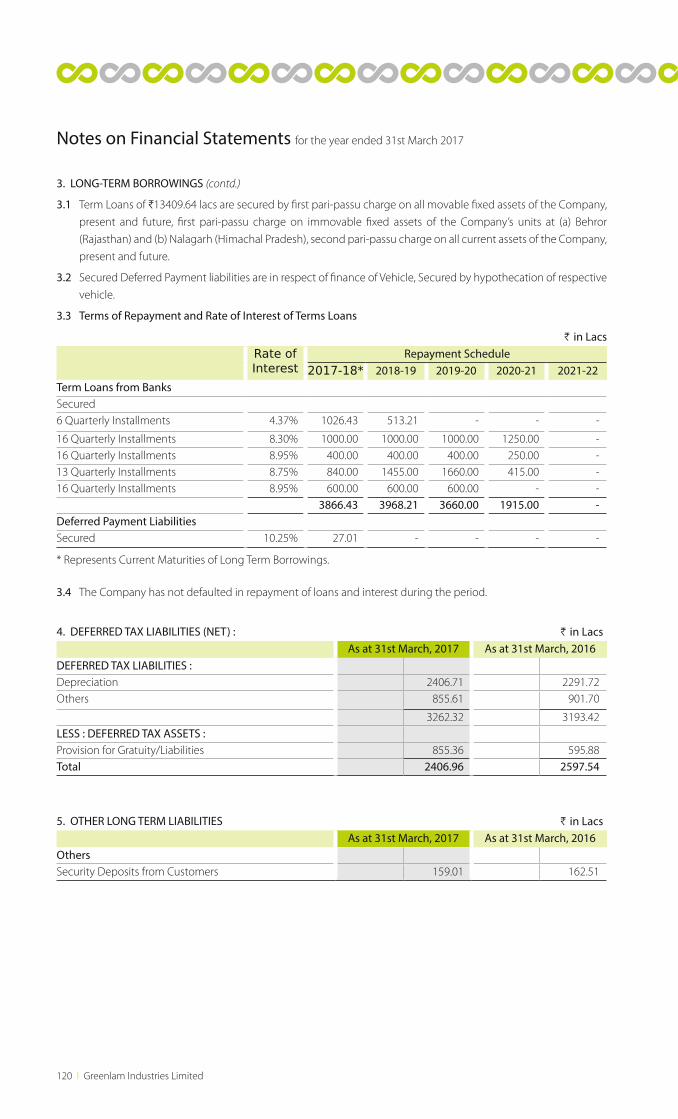
120 l Greenlam Industries Limited
3. LONG-TERM BORROWINGS (contd.)
3.1 Term Loans of H13409.64 lacs are secured by first pari-passu charge on all movable fixed assets of the Company,
present and future, first pari-passu charge on immovable fixed assets of the Company’s units at (a) Behror
(Rajasthan) and (b) Nalagarh (Himachal Pradesh), second pari-passu charge on all current assets of the Company,
present and future.
3.2 Secured Deferred Payment liabilities are in respect of finance of Vehicle, Secured by hypothecation of respective
vehicle.
3.3 Terms of Repayment and Rate of Interest of Terms Loans
H in LacsRate ofInterest
Repayment Schedule2017-18* 2018-19 2019-20 2020-21 2021-22
Term Loans from BanksSecured6 Quarterly Installments 4.37% 1026.43 513.21 - - -
16 Quarterly Installments 8.30% 1000.00 1000.00 1000.00 1250.00 - 16 Quarterly Installments 8.95% 400.00 400.00 400.00 250.00 - 13 Quarterly Installments 8.75% 840.00 1455.00 1660.00 415.00 - 16 Quarterly Installments 8.95% 600.00 600.00 600.00 - -
3866.43 3968.21 3660.00 1915.00 - Deferred Payment LiabilitiesSecured 10.25% 27.01 - - - -
* Represents Current Maturities of Long Term Borrowings.
3.4 The Company has not defaulted in repayment of loans and interest during the period.
4. DEFERRED TAX LIABILITIES (NET) : H in LacsAs at 31st March, 2017 As at 31st March, 2016
DEFERRED TAX LIABILITIES :Depreciation 2406.71 2291.72Others 855.61 901.70
3262.32 3193.42LESS : DEFERRED TAX ASSETS :Provision for Gratuity/Liabilities 855.36 595.88Total 2406.96 2597.54
Notes on Financial Statements for the year ended 31st March 2017
5. OTHER LONG TERM LIABILITIES H in LacsAs at 31st March, 2017 As at 31st March, 2016
OthersSecurity Deposits from Customers 159.01 162.51
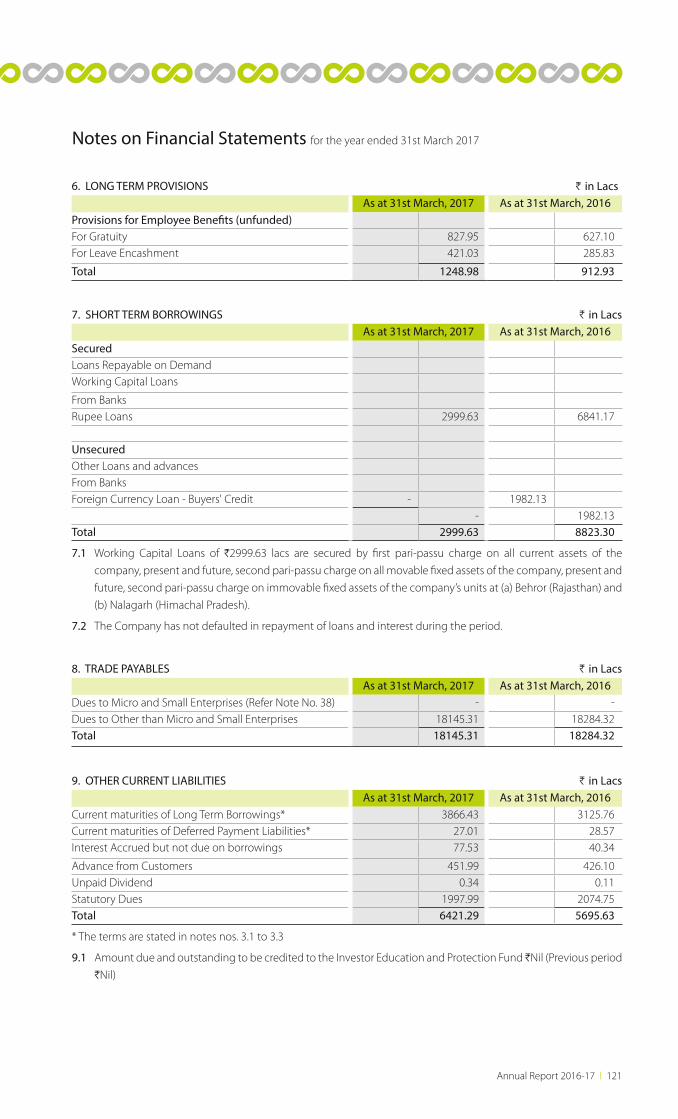
Annual Report 2016-17 l 121
Notes on Financial Statements for the year ended 31st March 2017
6. LONG TERM PROVISIONS H in LacsAs at 31st March, 2017 As at 31st March, 2016
Provisions for Employee Benefits (unfunded)For Gratuity 827.95 627.10 For Leave Encashment 421.03 285.83
Total 1248.98 912.93
7. SHORT TERM BORROWINGS H in LacsAs at 31st March, 2017 As at 31st March, 2016
SecuredLoans Repayable on DemandWorking Capital Loans
From BanksRupee Loans 2999.63 6841.17
UnsecuredOther Loans and advancesFrom BanksForeign Currency Loan - Buyers' Credit - 1982.13
- 1982.13Total 2999.63 8823.30
7.1 Working Capital Loans of H2999.63 lacs are secured by first pari-passu charge on all current assets of the
company, present and future, second pari-passu charge on all movable fixed assets of the company, present and
future, second pari-passu charge on immovable fixed assets of the company’s units at (a) Behror (Rajasthan) and
(b) Nalagarh (Himachal Pradesh).
7.2 The Company has not defaulted in repayment of loans and interest during the period.
8. TRADE PAYABLES H in LacsAs at 31st March, 2017 As at 31st March, 2016
Dues to Micro and Small Enterprises (Refer Note No. 38) - -
Dues to Other than Micro and Small Enterprises 18145.31 18284.32 Total 18145.31 18284.32
9. OTHER CURRENT LIABILITIES H in LacsAs at 31st March, 2017 As at 31st March, 2016
Current maturities of Long Term Borrowings* 3866.43 3125.76Current maturities of Deferred Payment Liabilities* 27.01 28.57Interest Accrued but not due on borrowings 77.53 40.34
Advance from Customers 451.99 426.10Unpaid Dividend 0.34 0.11Statutory Dues 1997.99 2074.75Total 6421.29 5695.63
* The terms are stated in notes nos. 3.1 to 3.3
9.1 Amount due and outstanding to be credited to the Investor Education and Protection Fund HNil (Previous period
HNil)
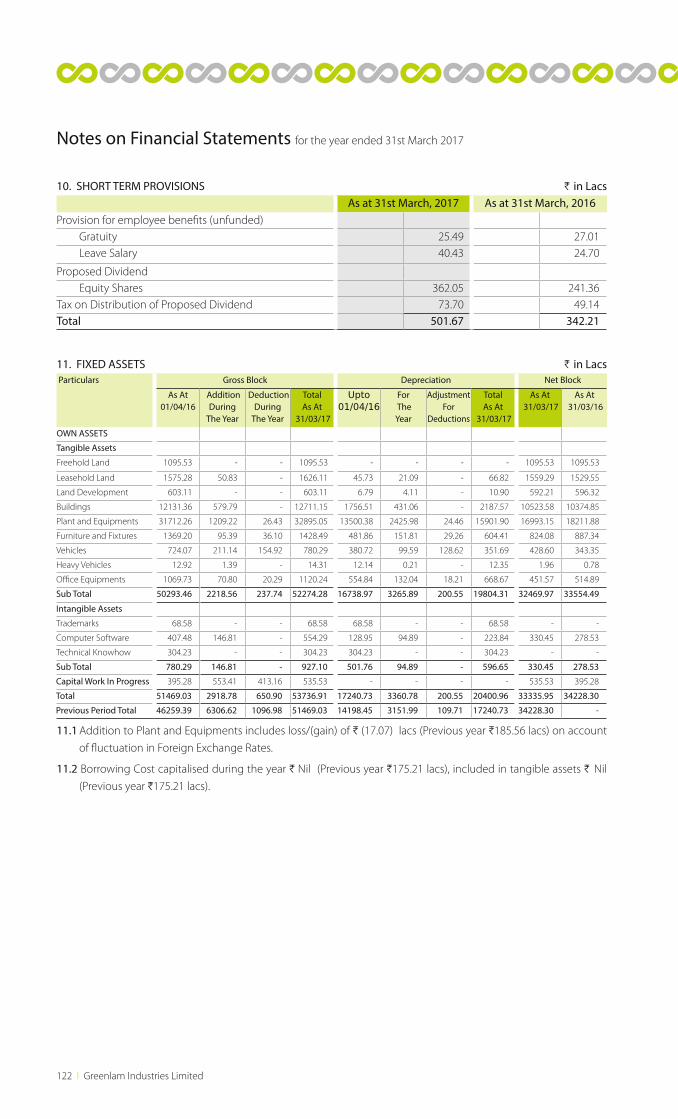
122 l Greenlam Industries Limited
Notes on Financial Statements for the year ended 31st March 2017
10. SHORT TERM PROVISIONS H in LacsAs at 31st March, 2017 As at 31st March, 2016
Provision for employee benefits (unfunded) Gratuity 25.49 27.01 Leave Salary 40.43 24.70
Proposed Dividend Equity Shares 362.05 241.36 Tax on Distribution of Proposed Dividend 73.70 49.14 Total 501.67 342.21
11. FIXED ASSETS H in Lacs Particulars Gross Block Depreciation Net Block
As At01/04/16
AdditionDuring
The Year
DeductionDuring
The Year
TotalAs At
31/03/17
Upto01/04/16
For The Year
AdjustmentFor
Deductions
TotalAs At
31/03/17
As At 31/03/17
As At 31/03/16
OWN ASSETS
Tangible Assets
Freehold Land 1095.53 - - 1095.53 - - - - 1095.53 1095.53
Leasehold Land 1575.28 50.83 - 1626.11 45.73 21.09 - 66.82 1559.29 1529.55
Land Development 603.11 - - 603.11 6.79 4.11 - 10.90 592.21 596.32
Buildings 12131.36 579.79 - 12711.15 1756.51 431.06 - 2187.57 10523.58 10374.85
Plant and Equipments 31712.26 1209.22 26.43 32895.05 13500.38 2425.98 24.46 15901.90 16993.15 18211.88
Furniture and Fixtures 1369.20 95.39 36.10 1428.49 481.86 151.81 29.26 604.41 824.08 887.34
Vehicles 724.07 211.14 154.92 780.29 380.72 99.59 128.62 351.69 428.60 343.35
Heavy Vehicles 12.92 1.39 - 14.31 12.14 0.21 - 12.35 1.96 0.78
Office Equipments 1069.73 70.80 20.29 1120.24 554.84 132.04 18.21 668.67 451.57 514.89
Sub Total 50293.46 2218.56 237.74 52274.28 16738.97 3265.89 200.55 19804.31 32469.97 33554.49
Intangible Assets
Trademarks 68.58 - - 68.58 68.58 - - 68.58 - -
Computer Software 407.48 146.81 - 554.29 128.95 94.89 - 223.84 330.45 278.53
Technical Knowhow 304.23 - - 304.23 304.23 - - 304.23 - -
Sub Total 780.29 146.81 - 927.10 501.76 94.89 - 596.65 330.45 278.53
Capital Work In Progress 395.28 553.41 413.16 535.53 - - - - 535.53 395.28
Total 51469.03 2918.78 650.90 53736.91 17240.73 3360.78 200.55 20400.96 33335.95 34228.30
Previous Period Total 46259.39 6306.62 1096.98 51469.03 14198.45 3151.99 109.71 17240.73 34228.30 -
11.1 Addition to Plant and Equipments includes loss/(gain) of H (17.07) lacs (Previous year H185.56 lacs) on account
of fluctuation in Foreign Exchange Rates.
11.2 Borrowing Cost capitalised during the year H Nil (Previous year H175.21 lacs), included in tangible assets H Nil
(Previous year H175.21 lacs).
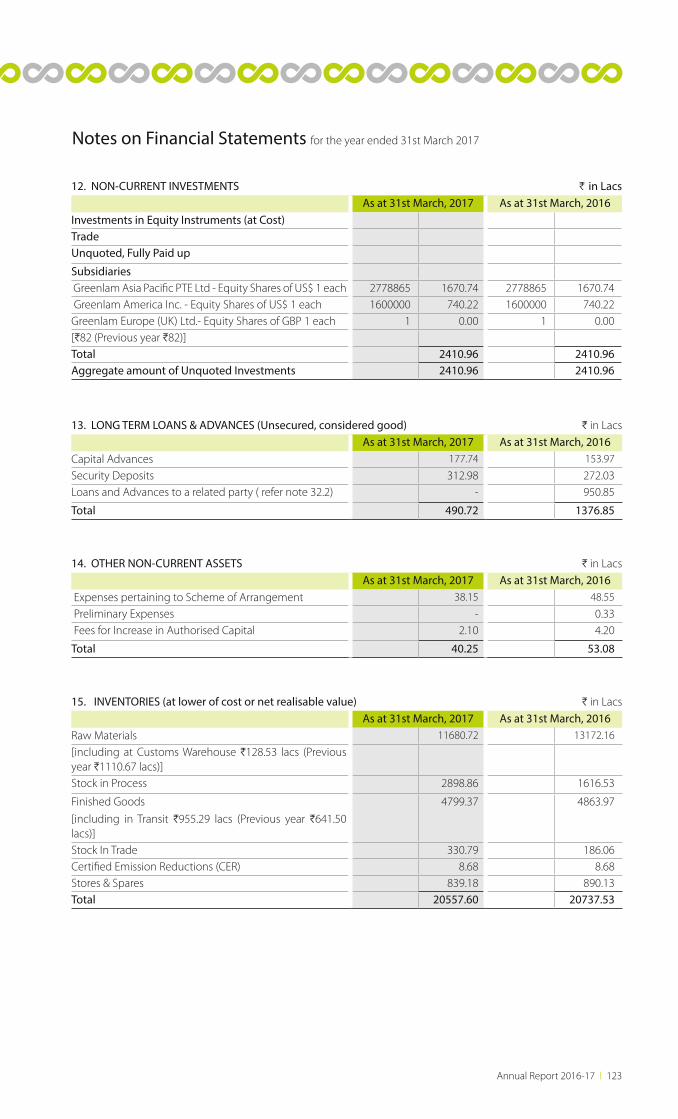
Annual Report 2016-17 l 123
Notes on Financial Statements for the year ended 31st March 2017
12. NON-CURRENT INVESTMENTS H in LacsAs at 31st March, 2017 As at 31st March, 2016
Investments in Equity Instruments (at Cost)TradeUnquoted, Fully Paid up
Subsidiaries Greenlam Asia Pacific PTE Ltd - Equity Shares of US$ 1 each 2778865 1670.74 2778865 1670.74 Greenlam America Inc. - Equity Shares of US$ 1 each 1600000 740.22 1600000 740.22Greenlam Europe (UK) Ltd.- Equity Shares of GBP 1 each 1 0.00 1 0.00[H82 (Previous year H82)]Total 2410.96 2410.96Aggregate amount of Unquoted Investments 2410.96 2410.96
13. LONG TERM LOANS & ADVANCES (Unsecured, considered good) H in LacsAs at 31st March, 2017 As at 31st March, 2016
Capital Advances 177.74 153.97
Security Deposits 312.98 272.03Loans and Advances to a related party ( refer note 32.2) - 950.85
Total 490.72 1376.85
14. OTHER NON-CURRENT ASSETS H in LacsAs at 31st March, 2017 As at 31st March, 2016
Expenses pertaining to Scheme of Arrangement 38.15 48.55
Preliminary Expenses - 0.33 Fees for Increase in Authorised Capital 2.10 4.20
Total 40.25 53.08
15. INVENTORIES (at lower of cost or net realisable value) H in LacsAs at 31st March, 2017 As at 31st March, 2016
Raw Materials 11680.72 13172.16
[including at Customs Warehouse H128.53 lacs (Previous year H1110.67 lacs)]Stock in Process 2898.86 1616.53
Finished Goods
[including in Transit H955.29 lacs (Previous year H641.50 lacs)]
4799.37 4863.97
Stock In Trade 330.79 186.06Certified Emission Reductions (CER) 8.68 8.68Stores & Spares 839.18 890.13Total 20557.60 20737.53
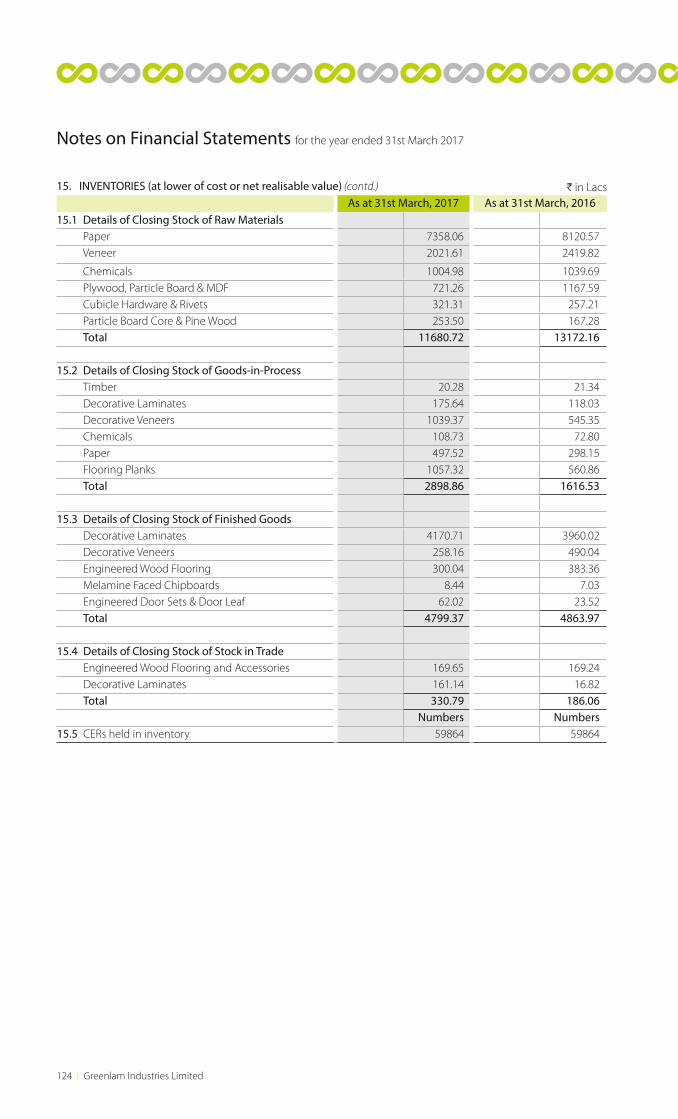
124 l Greenlam Industries Limited
15. INVENTORIES (at lower of cost or net realisable value) (contd.)
As at 31st March, 2017 As at 31st March, 201615.1 Details of Closing Stock of Raw Materials Paper 7358.06 8120.57 Veneer 2021.61 2419.82
Chemicals 1004.98 1039.69 Plywood, Particle Board & MDF 721.26 1167.59 Cubicle Hardware & Rivets 321.31 257.21 Particle Board Core & Pine Wood 253.50 167.28 Total 11680.72 13172.16
15.2 Details of Closing Stock of Goods-in-Process Timber 20.28 21.34 Decorative Laminates 175.64 118.03 Decorative Veneers 1039.37 545.35 Chemicals 108.73 72.80 Paper 497.52 298.15 Flooring Planks 1057.32 560.86 Total 2898.86 1616.53
15.3 Details of Closing Stock of Finished Goods Decorative Laminates 4170.71 3960.02 Decorative Veneers 258.16 490.04 Engineered Wood Flooring 300.04 383.36 Melamine Faced Chipboards 8.44 7.03 Engineered Door Sets & Door Leaf 62.02 23.52 Total 4799.37 4863.97
15.4 Details of Closing Stock of Stock in Trade Engineered Wood Flooring and Accessories 169.65 169.24 Decorative Laminates 161.14 16.82 Total 330.79 186.06
Numbers Numbers15.5 CERs held in inventory 59864 59864
Notes on Financial Statements for the year ended 31st March 2017
H in Lacs
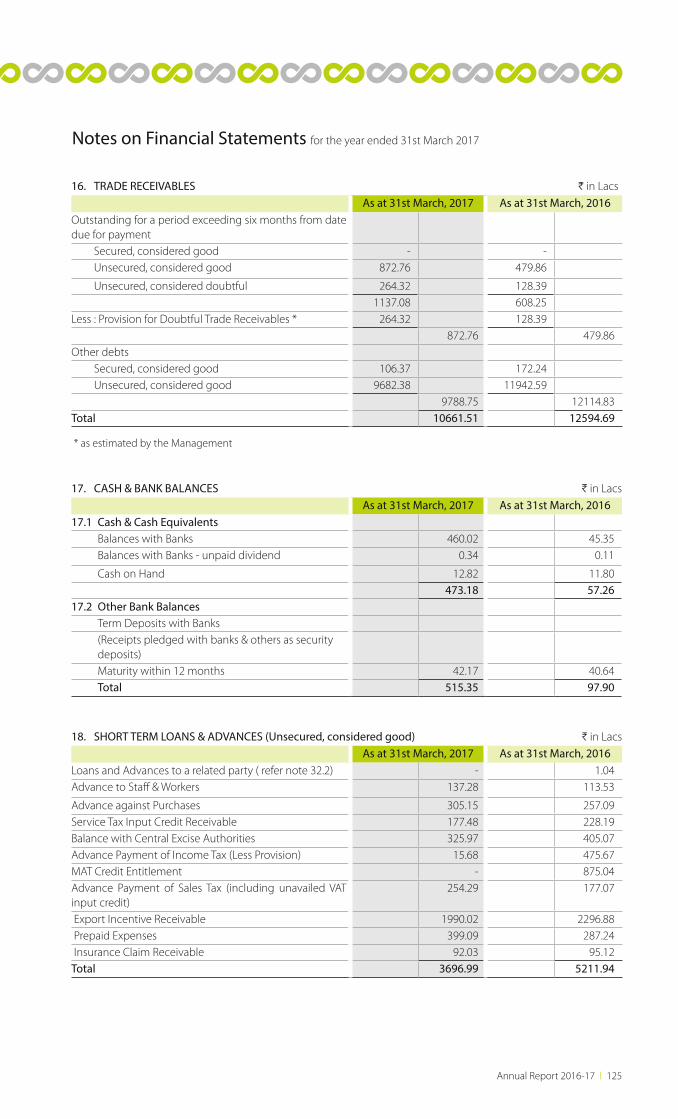
Annual Report 2016-17 l 125
16. TRADE RECEIVABLES H in LacsAs at 31st March, 2017 As at 31st March, 2016
Outstanding for a period exceeding six months from date due for payment Secured, considered good - - Unsecured, considered good 872.76 479.86
Unsecured, considered doubtful 264.32 128.391137.08 608.25
Less : Provision for Doubtful Trade Receivables * 264.32 128.39872.76 479.86
Other debts Secured, considered good 106.37 172.24 Unsecured, considered good 9682.38 11942.59
9788.75 12114.83Total 10661.51 12594.69
* as estimated by the Management
17. CASH & BANK BALANCES H in LacsAs at 31st March, 2017 As at 31st March, 2016
17.1 Cash & Cash Equivalents Balances with Banks 460.02 45.35 Balances with Banks - unpaid dividend 0.34 0.11
Cash on Hand 12.82 11.80473.18 57.26
17.2 Other Bank Balances Term Deposits with Banks (Receipts pledged with banks & others as security deposits) Maturity within 12 months 42.17 40.64 Total 515.35 97.90
18. SHORT TERM LOANS & ADVANCES (Unsecured, considered good) H in LacsAs at 31st March, 2017 As at 31st March, 2016
Loans and Advances to a related party ( refer note 32.2) - 1.04 Advance to Staff & Workers 137.28 113.53
Advance against Purchases 305.15 257.09 Service Tax Input Credit Receivable 177.48 228.19 Balance with Central Excise Authorities 325.97 405.07 Advance Payment of Income Tax (Less Provision) 15.68 475.67 MAT Credit Entitlement - 875.04 Advance Payment of Sales Tax (including unavailed VAT input credit)
254.29 177.07
Export Incentive Receivable 1990.02 2296.88 Prepaid Expenses 399.09 287.24 Insurance Claim Receivable 92.03 95.12 Total 3696.99 5211.94
Notes on Financial Statements for the year ended 31st March 2017
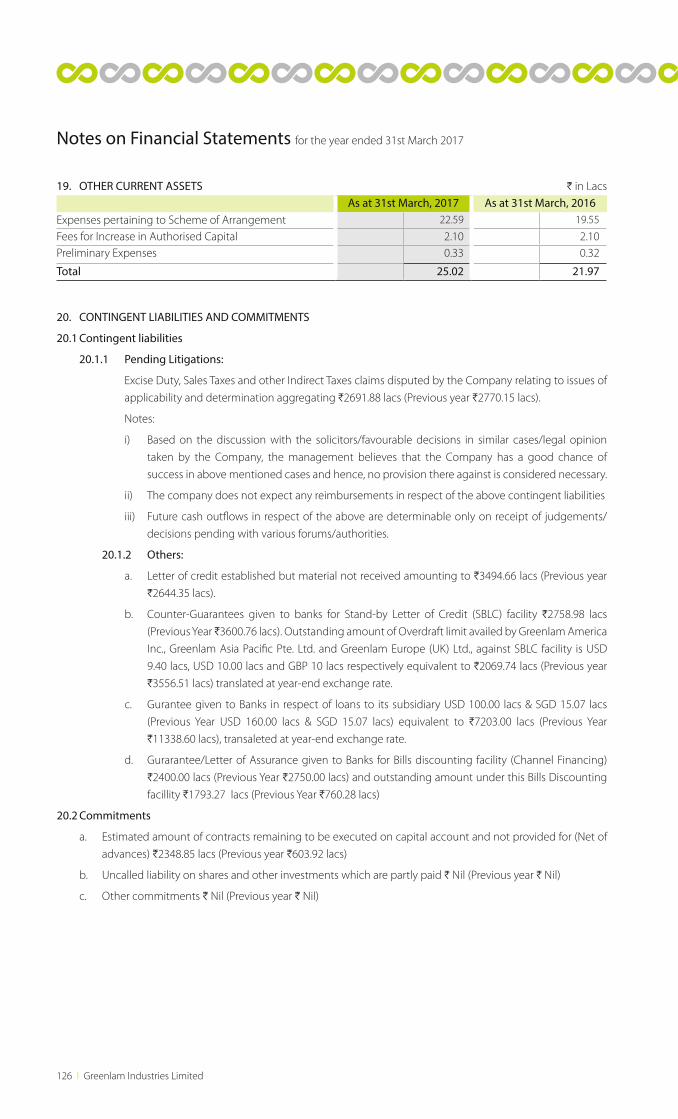
126 l Greenlam Industries Limited
Notes on Financial Statements for the year ended 31st March 2017
19. OTHER CURRENT ASSETS H in LacsAs at 31st March, 2017 As at 31st March, 2016
Expenses pertaining to Scheme of Arrangement 22.59 19.55
Fees for Increase in Authorised Capital 2.10 2.10Preliminary Expenses 0.33 0.32
Total 25.02 21.97
20. CONTINGENT LIABILITIES AND COMMITMENTS
20.1 Contingent liabilities
20.1.1 Pending Litigations:
Excise Duty, Sales Taxes and other Indirect Taxes claims disputed by the Company relating to issues of
applicability and determination aggregating H2691.88 lacs (Previous year H2770.15 lacs).
Notes:
i) Based on the discussion with the solicitors/favourable decisions in similar cases/legal opinion
taken by the Company, the management believes that the Company has a good chance of
success in above mentioned cases and hence, no provision there against is considered necessary.
ii) The company does not expect any reimbursements in respect of the above contingent liabilities
iii) Future cash outflows in respect of the above are determinable only on receipt of judgements/
decisions pending with various forums/authorities.
20.1.2 Others:
a. Letter of credit established but material not received amounting to H3494.66 lacs (Previous year
H2644.35 lacs).
b. Counter-Guarantees given to banks for Stand-by Letter of Credit (SBLC) facility H2758.98 lacs
(Previous Year H3600.76 lacs). Outstanding amount of Overdraft limit availed by Greenlam America
Inc., Greenlam Asia Pacific Pte. Ltd. and Greenlam Europe (UK) Ltd., against SBLC facility is USD
9.40 lacs, USD 10.00 lacs and GBP 10 lacs respectively equivalent to H2069.74 lacs (Previous year
H3556.51 lacs) translated at year-end exchange rate.
c. Gurantee given to Banks in respect of loans to its subsidiary USD 100.00 lacs & SGD 15.07 lacs
(Previous Year USD 160.00 lacs & SGD 15.07 lacs) equivalent to H7203.00 lacs (Previous Year
H11338.60 lacs), transaleted at year-end exchange rate.
d. Gurarantee/Letter of Assurance given to Banks for Bills discounting facility (Channel Financing)
H2400.00 lacs (Previous Year H2750.00 lacs) and outstanding amount under this Bills Discounting
facillity H1793.27 lacs (Previous Year H760.28 lacs)
20.2 Commitments
a. Estimated amount of contracts remaining to be executed on capital account and not provided for (Net of
advances) H2348.85 lacs (Previous year H603.92 lacs)
b. Uncalled liability on shares and other investments which are partly paid H Nil (Previous year H Nil)
c. Other commitments H Nil (Previous year H Nil)
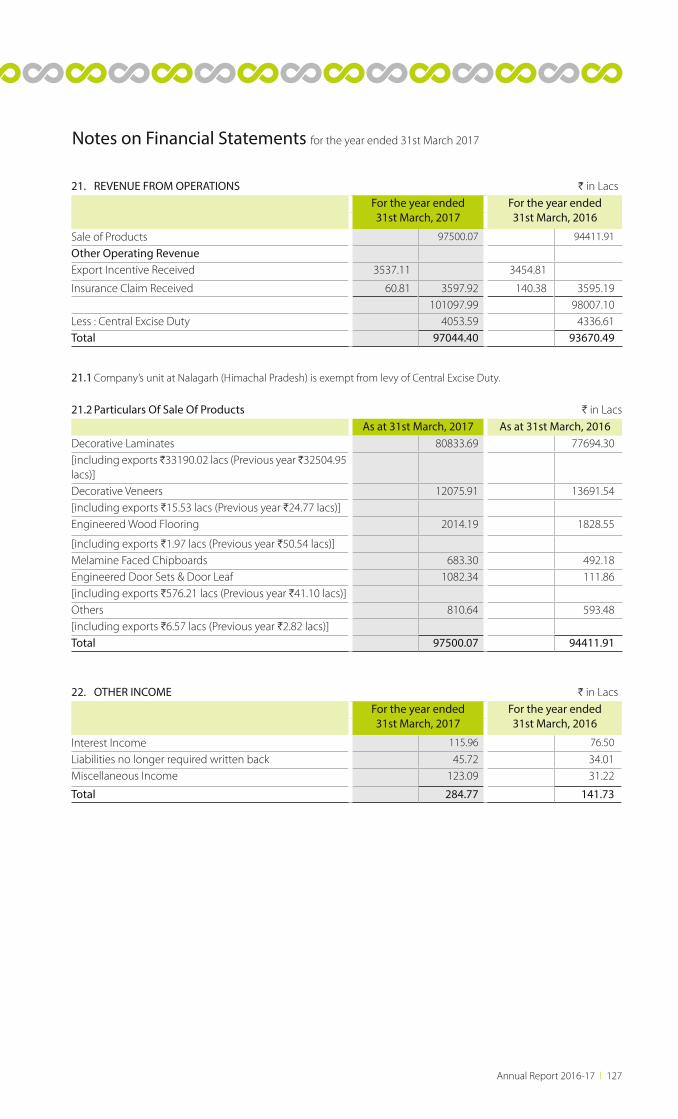
Annual Report 2016-17 l 127
Notes on Financial Statements for the year ended 31st March 2017
21. REVENUE FROM OPERATIONS H in LacsFor the year ended31st March, 2017
For the year ended31st March, 2016
Sale of Products 97500.07 94411.91
Other Operating RevenueExport Incentive Received 3537.11 3454.81
Insurance Claim Received 60.81 3597.92 140.38 3595.19101097.99 98007.10
Less : Central Excise Duty 4053.59 4336.61Total 97044.40 93670.49
21.1 Company’s unit at Nalagarh (Himachal Pradesh) is exempt from levy of Central Excise Duty.
21.2 Particulars Of Sale Of Products H in LacsAs at 31st March, 2017 As at 31st March, 2016
Decorative Laminates 80833.69 77694.30[including exports H33190.02 lacs (Previous year H32504.95 lacs)]Decorative Veneers 12075.91 13691.54[including exports H15.53 lacs (Previous year H24.77 lacs)]Engineered Wood Flooring 2014.19 1828.55
[including exports H1.97 lacs (Previous year H50.54 lacs)]Melamine Faced Chipboards 683.30 492.18Engineered Door Sets & Door Leaf 1082.34 111.86 [including exports H576.21 lacs (Previous year H41.10 lacs)]Others 810.64 593.48[including exports H6.57 lacs (Previous year H2.82 lacs)]Total 97500.07 94411.91
22. OTHER INCOME H in LacsFor the year ended31st March, 2017
For the year ended31st March, 2016
Interest Income 115.96 76.50
Liabilities no longer required written back 45.72 34.01Miscellaneous Income 123.09 31.22
Total 284.77 141.73
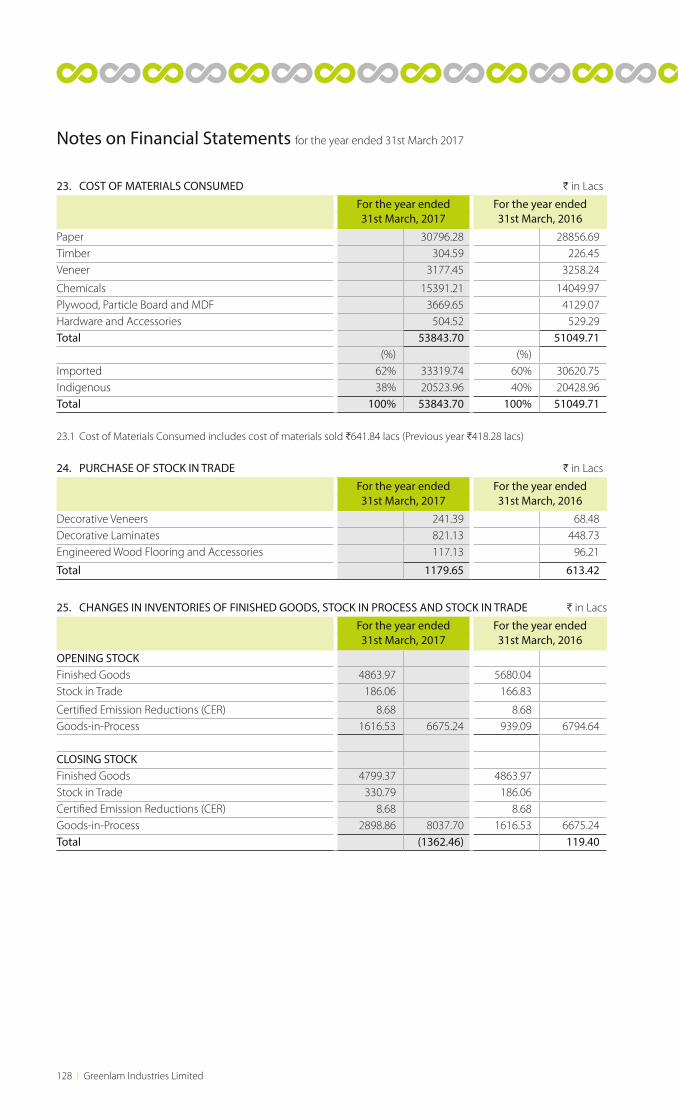
128 l Greenlam Industries Limited
23. COST OF MATERIALS CONSUMED H in Lacs
For the year ended31st March, 2017
For the year ended31st March, 2016
Paper 30796.28 28856.69Timber 304.59 226.45Veneer 3177.45 3258.24
Chemicals 15391.21 14049.97Plywood, Particle Board and MDF 3669.65 4129.07Hardware and Accessories 504.52 529.29Total 53843.70 51049.71
(%) (%)Imported 62% 33319.74 60% 30620.75Indigenous 38% 20523.96 40% 20428.96Total 100% 53843.70 100% 51049.71
23.1 Cost of Materials Consumed includes cost of materials sold H641.84 lacs (Previous year H418.28 lacs)
24. PURCHASE OF STOCK IN TRADE H in Lacs
For the year ended31st March, 2017
For the year ended31st March, 2016
Decorative Veneers 241.39 68.48 Decorative Laminates 821.13 448.73 Engineered Wood Flooring and Accessories 117.13 96.21
Total 1179.65 613.42
25. CHANGES IN INVENTORIES OF FINISHED GOODS, STOCK IN PROCESS AND STOCK IN TRADE H in Lacs
For the year ended31st March, 2017
For the year ended31st March, 2016
OPENING STOCKFinished Goods 4863.97 5680.04Stock in Trade 186.06 166.83
Certified Emission Reductions (CER) 8.68 8.68Goods-in-Process 1616.53 6675.24 939.09 6794.64
CLOSING STOCKFinished Goods 4799.37 4863.97Stock in Trade 330.79 186.06Certified Emission Reductions (CER) 8.68 8.68Goods-in-Process 2898.86 8037.70 1616.53 6675.24Total (1362.46) 119.40
Notes on Financial Statements for the year ended 31st March 2017
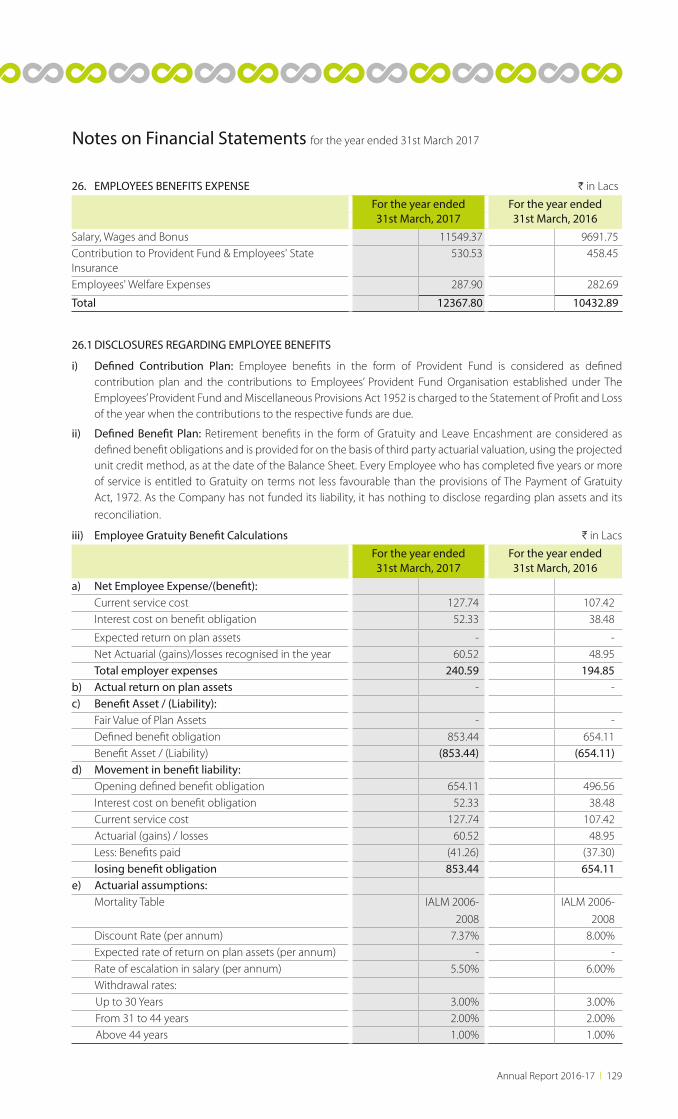
Annual Report 2016-17 l 129
Notes on Financial Statements for the year ended 31st March 2017
26. EMPLOYEES BENEFITS EXPENSE H in Lacs
For the year ended31st March, 2017
For the year ended31st March, 2016
Salary, Wages and Bonus 11549.37 9691.75Contribution to Provident Fund & Employees' State Insurance
530.53 458.45
Employees' Welfare Expenses 287.90 282.69
Total 12367.80 10432.89
26.1 DISCLOSURES REGARDING EMPLOYEE BENEFITS
i) Defined Contribution Plan: Employee benefits in the form of Provident Fund is considered as defined contribution plan and the contributions to Employees’ Provident Fund Organisation established under The Employees’ Provident Fund and Miscellaneous Provisions Act 1952 is charged to the Statement of Profit and Loss of the year when the contributions to the respective funds are due.
ii) Defined Benefit Plan: Retirement benefits in the form of Gratuity and Leave Encashment are considered as defined benefit obligations and is provided for on the basis of third party actuarial valuation, using the projected unit credit method, as at the date of the Balance Sheet. Every Employee who has completed five years or more of service is entitled to Gratuity on terms not less favourable than the provisions of The Payment of Gratuity Act, 1972. As the Company has not funded its liability, it has nothing to disclose regarding plan assets and its
reconciliation.
iii) Employee Gratuity Benefit Calculations H in Lacs
For the year ended31st March, 2017
For the year ended31st March, 2016
a) Net Employee Expense/(benefit): Current service cost 127.74 107.42 Interest cost on benefit obligation 52.33 38.48
Expected return on plan assets - - Net Actuarial (gains)/losses recognised in the year 60.52 48.95 Total employer expenses 240.59 194.85 b) Actual return on plan assets - -c) Benefit Asset / (Liability): Fair Value of Plan Assets - - Defined benefit obligation 853.44 654.11 Benefit Asset / (Liability) (853.44) (654.11)d) Movement in benefit liability: Opening defined benefit obligation 654.11 496.56 Interest cost on benefit obligation 52.33 38.48 Current service cost 127.74 107.42 Actuarial (gains) / losses 60.52 48.95 Less: Benefits paid (41.26) (37.30) losing benefit obligation 853.44 654.11 e) Actuarial assumptions: Mortality Table IALM 2006-
2008
IALM 2006-
2008 Discount Rate (per annum) 7.37% 8.00% Expected rate of return on plan assets (per annum) - - Rate of escalation in salary (per annum) 5.50% 6.00% Withdrawal rates: Up to 30 Years 3.00% 3.00% From 31 to 44 years 2.00% 2.00% Above 44 years 1.00% 1.00%
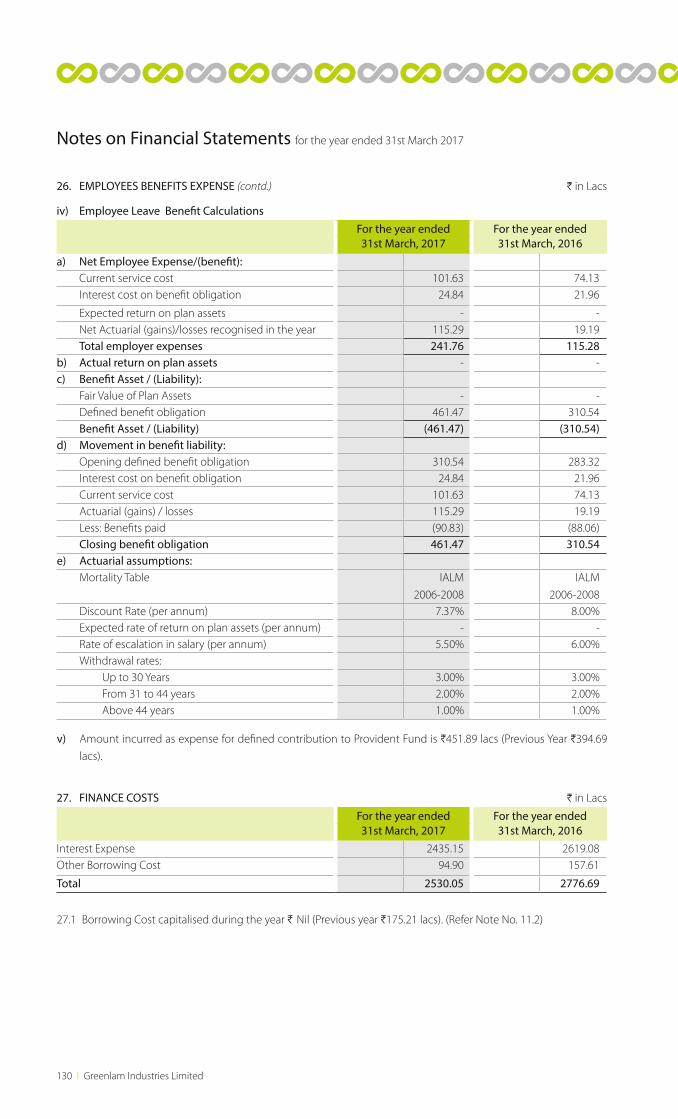
130 l Greenlam Industries Limited
Notes on Financial Statements for the year ended 31st March 2017
26. EMPLOYEES BENEFITS EXPENSE (contd.) H in Lacs
iv) Employee Leave Benefit Calculations
For the year ended31st March, 2017
For the year ended31st March, 2016
a) Net Employee Expense/(benefit): Current service cost 101.63 74.13 Interest cost on benefit obligation 24.84 21.96
Expected return on plan assets - - Net Actuarial (gains)/losses recognised in the year 115.29 19.19 Total employer expenses 241.76 115.28b) Actual return on plan assets - -c) Benefit Asset / (Liability): Fair Value of Plan Assets - - Defined benefit obligation 461.47 310.54 Benefit Asset / (Liability) (461.47) (310.54)d) Movement in benefit liability: Opening defined benefit obligation 310.54 283.32 Interest cost on benefit obligation 24.84 21.96 Current service cost 101.63 74.13 Actuarial (gains) / losses 115.29 19.19 Less: Benefits paid (90.83) (88.06) Closing benefit obligation 461.47 310.54 e) Actuarial assumptions: Mortality Table IALM
2006-2008
IALM
2006-2008 Discount Rate (per annum) 7.37% 8.00% Expected rate of return on plan assets (per annum) - - Rate of escalation in salary (per annum) 5.50% 6.00% Withdrawal rates: Up to 30 Years 3.00% 3.00% From 31 to 44 years 2.00% 2.00% Above 44 years 1.00% 1.00%
v) Amount incurred as expense for defined contribution to Provident Fund is H451.89 lacs (Previous Year H394.69
lacs).
27. FINANCE COSTS H in Lacs
For the year ended31st March, 2017
For the year ended31st March, 2016
Interest Expense 2435.15 2619.08 Other Borrowing Cost 94.90 157.61
Total 2530.05 2776.69
27.1 Borrowing Cost capitalised during the year H Nil (Previous year H175.21 lacs). (Refer Note No. 11.2)
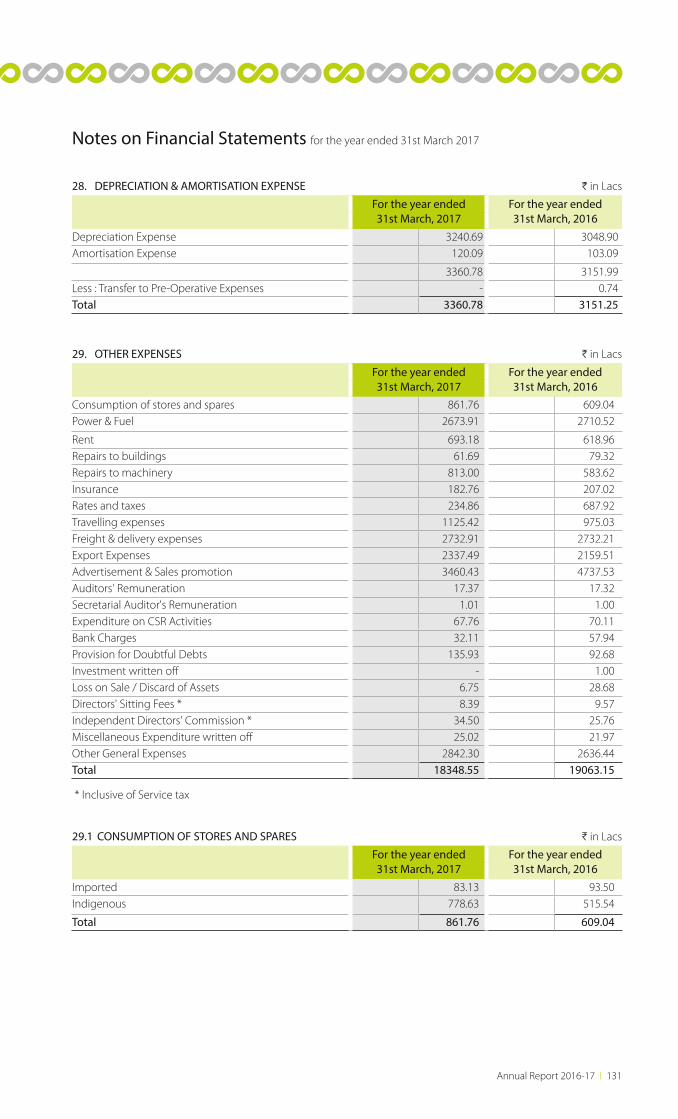
Annual Report 2016-17 l 131
Notes on Financial Statements for the year ended 31st March 2017
28. DEPRECIATION & AMORTISATION EXPENSE H in Lacs
For the year ended31st March, 2017
For the year ended31st March, 2016
Depreciation Expense 3240.69 3048.90 Amortisation Expense 120.09 103.09
3360.78 3151.99 Less : Transfer to Pre-Operative Expenses - 0.74 Total 3360.78 3151.25
29. OTHER EXPENSES H in Lacs
For the year ended31st March, 2017
For the year ended31st March, 2016
Consumption of stores and spares 861.76 609.04Power & Fuel 2673.91 2710.52
Rent 693.18 618.96Repairs to buildings 61.69 79.32Repairs to machinery 813.00 583.62Insurance 182.76 207.02Rates and taxes 234.86 687.92Travelling expenses 1125.42 975.03Freight & delivery expenses 2732.91 2732.21Export Expenses 2337.49 2159.51Advertisement & Sales promotion 3460.43 4737.53Auditors' Remuneration 17.37 17.32Secretarial Auditor's Remuneration 1.01 1.00Expenditure on CSR Activities 67.76 70.11Bank Charges 32.11 57.94Provision for Doubtful Debts 135.93 92.68Investment written off - 1.00Loss on Sale / Discard of Assets 6.75 28.68Directors' Sitting Fees * 8.39 9.57Independent Directors' Commission * 34.50 25.76Miscellaneous Expenditure written off 25.02 21.97Other General Expenses 2842.30 2636.44Total 18348.55 19063.15
* Inclusive of Service tax
29.1 CONSUMPTION OF STORES AND SPARES H in Lacs
For the year ended31st March, 2017
For the year ended31st March, 2016
Imported 83.13 93.50Indigenous 778.63 515.54
Total 861.76 609.04
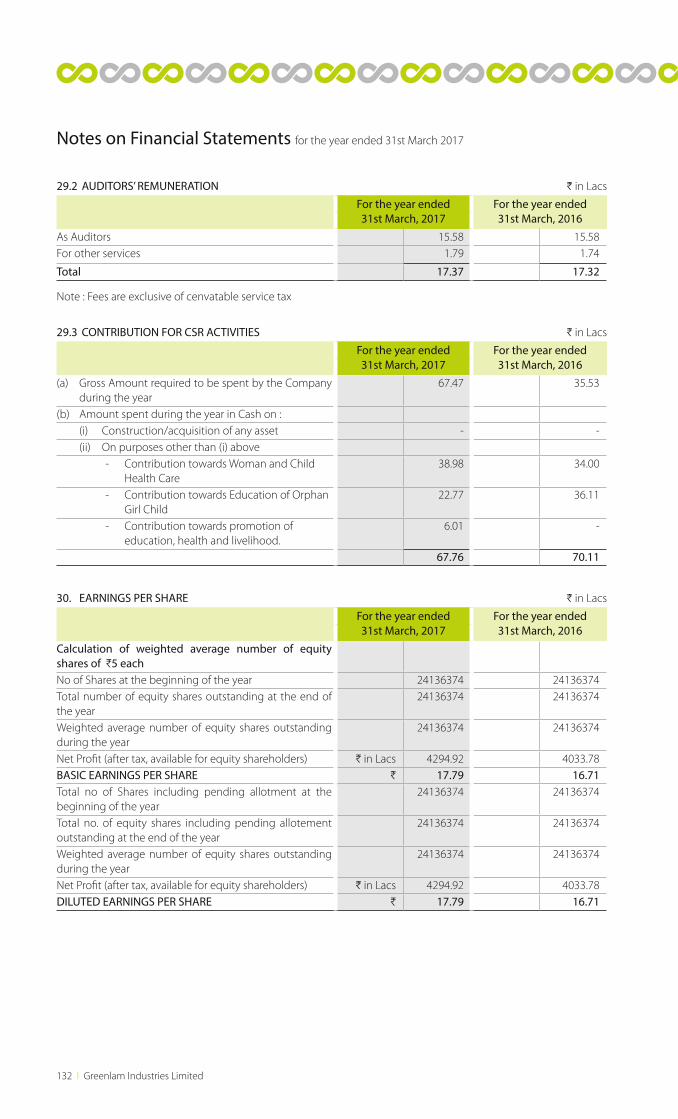
132 l Greenlam Industries Limited
29.2 AUDITORS’ REMUNERATION H in Lacs
For the year ended31st March, 2017
For the year ended31st March, 2016
As Auditors 15.58 15.58For other services 1.79 1.74
Total 17.37 17.32
Note : Fees are exclusive of cenvatable service tax
29.3 CONTRIBUTION FOR CSR ACTIVITIES H in Lacs
For the year ended31st March, 2017
For the year ended31st March, 2016
(a) Gross Amount required to be spent by the Company during the year
67.47 35.53
(b) Amount spent during the year in Cash on : (i) Construction/acquisition of any asset - - (ii) On purposes other than (i) above
- Contribution towards Woman and Child Health Care
38.98 34.00
- Contribution towards Education of Orphan Girl Child
22.77 36.11
- Contribution towards promotion of education, health and livelihood.
6.01 -
67.76 70.11
30. EARNINGS PER SHARE H in Lacs
For the year ended31st March, 2017
For the year ended31st March, 2016
Calculation of weighted average number of equity shares of H5 eachNo of Shares at the beginning of the year 24136374 24136374Total number of equity shares outstanding at the end of the year
24136374 24136374
Weighted average number of equity shares outstanding during the year
24136374 24136374
Net Profit (after tax, available for equity shareholders) H in Lacs 4294.92 4033.78BASIC EARNINGS PER SHARE H 17.79 16.71Total no of Shares including pending allotment at the beginning of the year
24136374 24136374
Total no. of equity shares including pending allotement outstanding at the end of the year
24136374 24136374
Weighted average number of equity shares outstanding during the year
24136374 24136374
Net Profit (after tax, available for equity shareholders) H in Lacs 4294.92 4033.78DILUTED EARNINGS PER SHARE H 17.79 16.71
Notes on Financial Statements for the year ended 31st March 2017
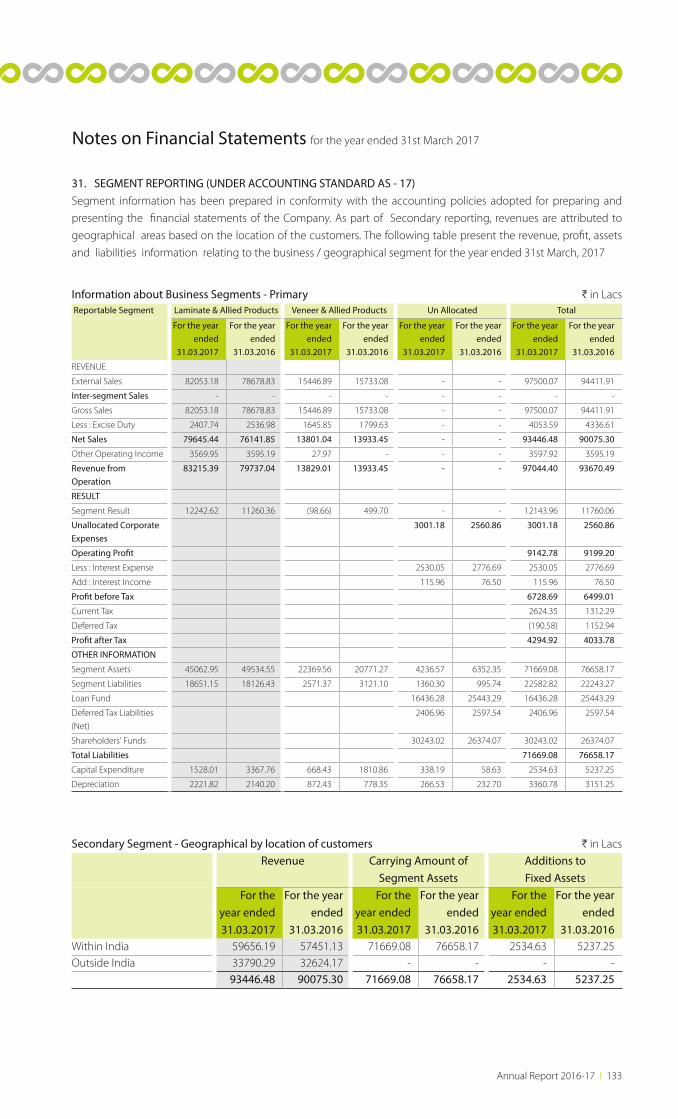
Annual Report 2016-17 l 133
31. SEGMENT REPORTING (UNDER ACCOUNTING STANDARD AS - 17) Segment information has been prepared in conformity with the accounting policies adopted for preparing and
presenting the financial statements of the Company. As part of Secondary reporting, revenues are attributed to
geographical areas based on the location of the customers. The following table present the revenue, profit, assets
and liabilities information relating to the business / geographical segment for the year ended 31st March, 2017
Information about Business Segments - Primary H in Lacs Reportable Segment Laminate & Allied Products Veneer & Allied Products Un Allocated Total
For the year ended
31.03.2017
For the year ended
31.03.2016
For the year ended
31.03.2017
For the year ended
31.03.2016
For the year ended
31.03.2017
For the year ended
31.03.2016
For the year ended
31.03.2017
For the year ended
31.03.2016
REVENUE
External Sales 82053.18 78678.83 15446.89 15733.08 - - 97500.07 94411.91
Inter-segment Sales - - - - - - - -
Gross Sales 82053.18 78678.83 15446.89 15733.08 - - 97500.07 94411.91
Less : Excise Duty 2407.74 2536.98 1645.85 1799.63 - - 4053.59 4336.61
Net Sales 79645.44 76141.85 13801.04 13933.45 - - 93446.48 90075.30
Other Operating Income 3569.95 3595.19 27.97 - - - 3597.92 3595.19
Revenue from Operation
83215.39 79737.04 13829.01 13933.45 - - 97044.40 93670.49
RESULT
Segment Result 12242.62 11260.36 (98.66) 499.70 - - 12143.96 11760.06
Unallocated Corporate Expenses
3001.18 2560.86 3001.18 2560.86
Operating Profit 9142.78 9199.20
Less : Interest Expense 2530.05 2776.69 2530.05 2776.69
Add : Interest Income 115.96 76.50 115.96 76.50
Profit before Tax 6728.69 6499.01
Current Tax 2624.35 1312.29
Deferred Tax (190.58) 1152.94
Profit after Tax 4294.92 4033.78
OTHER INFORMATION
Segment Assets 45062.95 49534.55 22369.56 20771.27 4236.57 6352.35 71669.08 76658.17
Segment Liabilities 18651.15 18126.43 2571.37 3121.10 1360.30 995.74 22582.82 22243.27
Loan Fund 16436.28 25443.29 16436.28 25443.29
Deferred Tax Liabilities
(Net)
2406.96 2597.54 2406.96 2597.54
Shareholders' Funds 30243.02 26374.07 30243.02 26374.07
Total Liabilities 71669.08 76658.17
Capital Expenditure 1528.01 3367.76 668.43 1810.86 338.19 58.63 2534.63 5237.25
Depreciation 2221.82 2140.20 872.43 778.35 266.53 232.70 3360.78 3151.25
Secondary Segment - Geographical by location of customers H in Lacs
Revenue Carrying Amount ofSegment Assets
Additions toFixed Assets
For the year ended31.03.2017
For the year ended
31.03.2016
For the year ended31.03.2017
For the year ended
31.03.2016
For the year ended31.03.2017
For the year ended
31.03.2016Within India 59656.19 57451.13 71669.08 76658.17 2534.63 5237.25Outside India 33790.29 32624.17 - - - -
93446.48 90075.30 71669.08 76658.17 2534.63 5237.25
Notes on Financial Statements for the year ended 31st March 2017
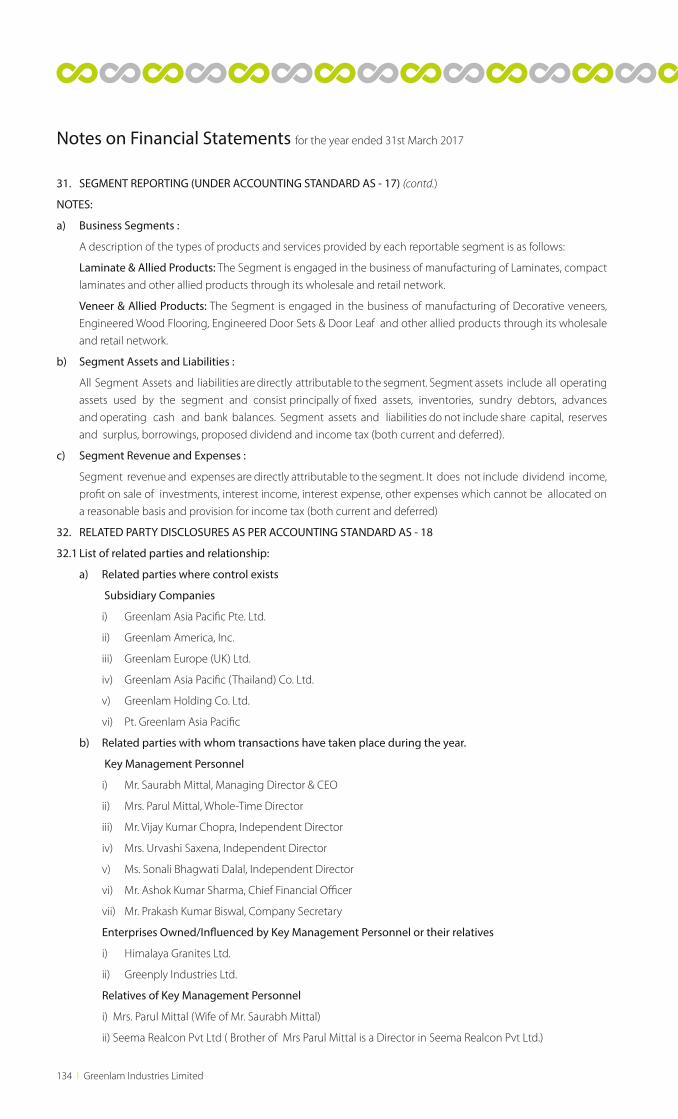
134 l Greenlam Industries Limited
Notes on Financial Statements for the year ended 31st March 2017
31. SEGMENT REPORTING (UNDER ACCOUNTING STANDARD AS - 17) (contd.)
NOTES:
a) Business Segments :
A description of the types of products and services provided by each reportable segment is as follows:
Laminate & Allied Products: The Segment is engaged in the business of manufacturing of Laminates, compact
laminates and other allied products through its wholesale and retail network.
Veneer & Allied Products: The Segment is engaged in the business of manufacturing of Decorative veneers,
Engineered Wood Flooring, Engineered Door Sets & Door Leaf and other allied products through its wholesale
and retail network.
b) Segment Assets and Liabilities :
All Segment Assets and liabilities are directly attributable to the segment. Segment assets include all operating
assets used by the segment and consist principally of fixed assets, inventories, sundry debtors, advances
and operating cash and bank balances. Segment assets and liabilities do not include share capital, reserves
and surplus, borrowings, proposed dividend and income tax (both current and deferred).
c) Segment Revenue and Expenses :
Segment revenue and expenses are directly attributable to the segment. It does not include dividend income,
profit on sale of investments, interest income, interest expense, other expenses which cannot be allocated on
a reasonable basis and provision for income tax (both current and deferred)
32. RELATED PARTY DISCLOSURES AS PER ACCOUNTING STANDARD AS - 18
32.1 List of related parties and relationship:
a) Related parties where control exists
Subsidiary Companies
i) Greenlam Asia Pacific Pte. Ltd.
ii) Greenlam America, Inc.
iii) Greenlam Europe (UK) Ltd.
iv) Greenlam Asia Pacific (Thailand) Co. Ltd.
v) Greenlam Holding Co. Ltd.
vi) Pt. Greenlam Asia Pacific
b) Related parties with whom transactions have taken place during the year.
Key Management Personnel
i) Mr. Saurabh Mittal, Managing Director & CEO
ii) Mrs. Parul Mittal, Whole-Time Director
iii) Mr. Vijay Kumar Chopra, Independent Director
iv) Mrs. Urvashi Saxena, Independent Director
v) Ms. Sonali Bhagwati Dalal, Independent Director
vi) Mr. Ashok Kumar Sharma, Chief Financial Officer
vii) Mr. Prakash Kumar Biswal, Company Secretary
Enterprises Owned/Influenced by Key Management Personnel or their relatives
i) Himalaya Granites Ltd.
ii) Greenply Industries Ltd.
Relatives of Key Management Personnel
i) Mrs. Parul Mittal (Wife of Mr. Saurabh Mittal)
ii) Seema Realcon Pvt Ltd ( Brother of Mrs Parul Mittal is a Director in Seema Realcon Pvt Ltd.)
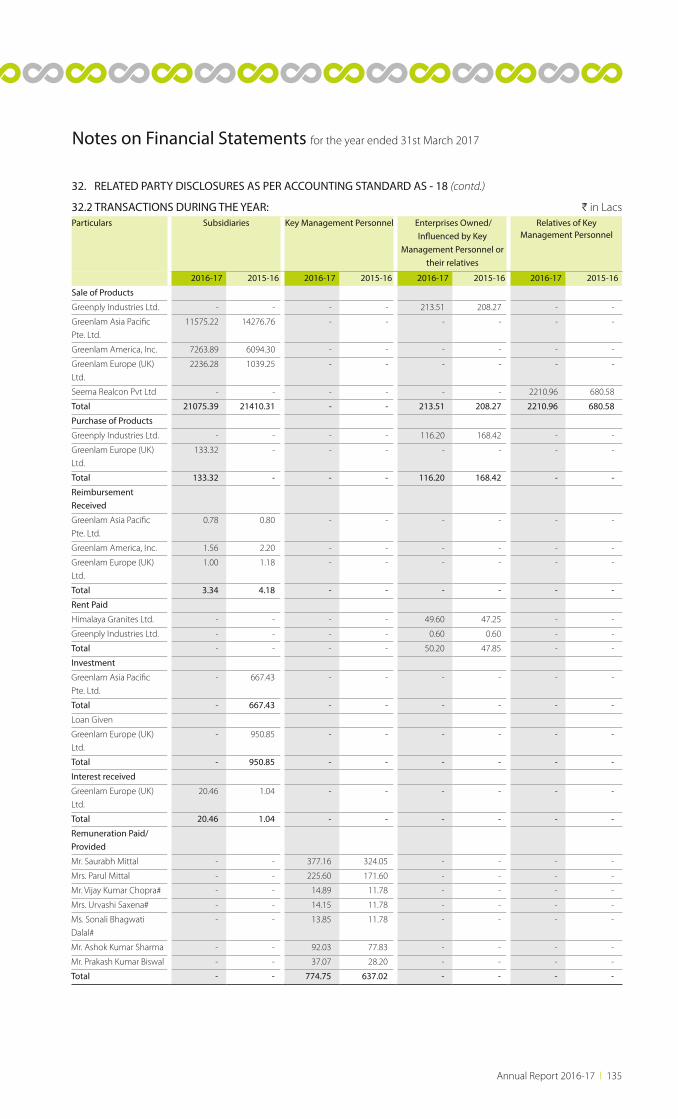
Annual Report 2016-17 l 135
Notes on Financial Statements for the year ended 31st March 2017
32. RELATED PARTY DISCLOSURES AS PER ACCOUNTING STANDARD AS - 18 (contd.)
32.2 TRANSACTIONS DURING THE YEAR: H in LacsParticulars Subsidiaries Key Management Personnel Enterprises Owned/
Influenced by Key Management Personnel or
their relatives
Relatives of Key Management Personnel
2016-17 2015-16 2016-17 2015-16 2016-17 2015-16 2016-17 2015-16
Sale of Products
Greenply Industries Ltd. - - - - 213.51 208.27 - -
Greenlam Asia Pacific
Pte. Ltd.
11575.22 14276.76 - - - - - -
Greenlam America, Inc. 7263.89 6094.30 - - - - - -
Greenlam Europe (UK)
Ltd.
2236.28 1039.25 - - - - - -
Seema Realcon Pvt Ltd - - - - - - 2210.96 680.58
Total 21075.39 21410.31 - - 213.51 208.27 2210.96 680.58
Purchase of Products
Greenply Industries Ltd. - - - - 116.20 168.42 - -
Greenlam Europe (UK)
Ltd.
133.32 - - - - - - -
Total 133.32 - - - 116.20 168.42 - -
Reimbursement Received
Greenlam Asia Pacific
Pte. Ltd.
0.78 0.80 - - - - - -
Greenlam America, Inc. 1.56 2.20 - - - - - -
Greenlam Europe (UK)
Ltd.
1.00 1.18 - - - - - -
Total 3.34 4.18 - - - - - -
Rent Paid
Himalaya Granites Ltd. - - - - 49.60 47.25 - -
Greenply Industries Ltd. - - - - 0.60 0.60 - -
Total - - - - 50.20 47.85 - -
Investment
Greenlam Asia Pacific
Pte. Ltd.
- 667.43 - - - - - -
Total - 667.43 - - - - - -
Loan Given
Greenlam Europe (UK)
Ltd.
- 950.85 - - - - - -
Total - 950.85 - - - - - -
Interest received
Greenlam Europe (UK)
Ltd.
20.46 1.04 - - - - - -
Total 20.46 1.04 - - - - - -
Remuneration Paid/Provided
Mr. Saurabh Mittal - - 377.16 324.05 - - - -
Mrs. Parul Mittal - - 225.60 171.60 - - - -
Mr. Vijay Kumar Chopra# - - 14.89 11.78 - - - -
Mrs. Urvashi Saxena# - - 14.15 11.78 - - - -
Ms. Sonali Bhagwati
Dalal#
- - 13.85 11.78 - - - -
Mr. Ashok Kumar Sharma - - 92.03 77.83 - - - -
Mr. Prakash Kumar Biswal - - 37.07 28.20 - - - -
Total - - 774.75 637.02 - - - -
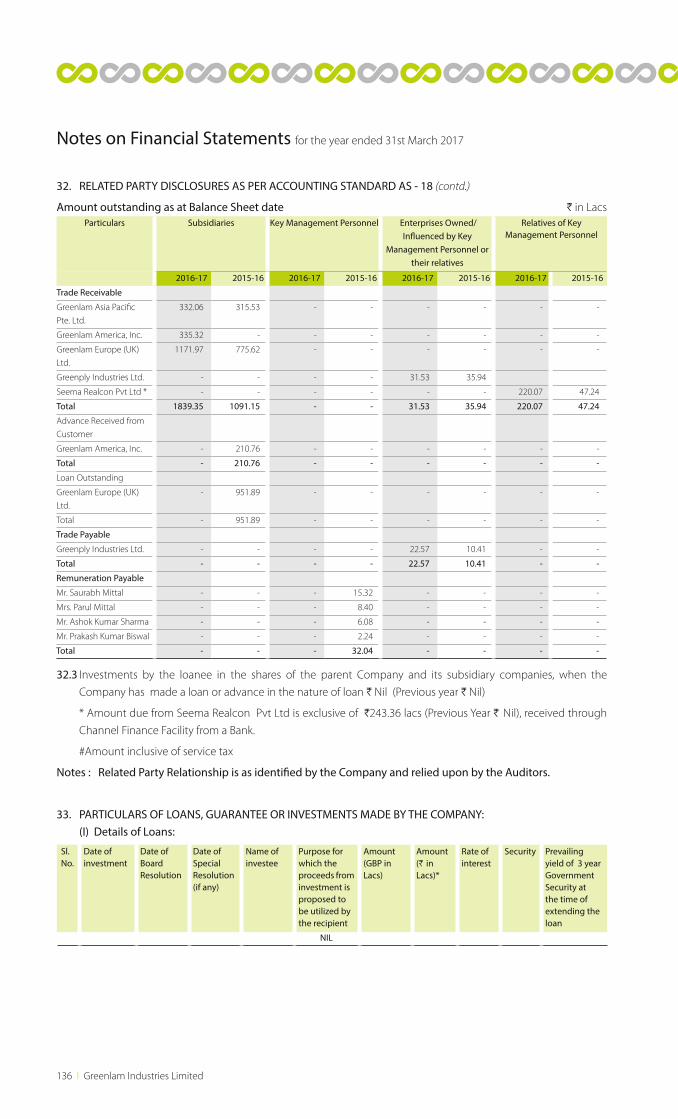
136 l Greenlam Industries Limited
32. RELATED PARTY DISCLOSURES AS PER ACCOUNTING STANDARD AS - 18 (contd.)
Amount outstanding as at Balance Sheet date H in LacsParticulars Subsidiaries Key Management Personnel Enterprises Owned/
Influenced by Key Management Personnel or
their relatives
Relatives of Key Management Personnel
2016-17 2015-16 2016-17 2015-16 2016-17 2015-16 2016-17 2015-16
Trade Receivable
Greenlam Asia Pacific
Pte. Ltd.
332.06 315.53 - - - - - -
Greenlam America, Inc. 335.32 - - - - - - -
Greenlam Europe (UK)
Ltd.
1171.97 775.62 - - - - - -
Greenply Industries Ltd. - - - - 31.53 35.94
Seema Realcon Pvt Ltd * - - - - - - 220.07 47.24
Total 1839.35 1091.15 - - 31.53 35.94 220.07 47.24
Advance Received from
Customer
Greenlam America, Inc. - 210.76 - - - - - -
Total - 210.76 - - - - - -
Loan Outstanding
Greenlam Europe (UK)
Ltd.
- 951.89 - - - - - -
Total - 951.89 - - - - - -
Trade Payable
Greenply Industries Ltd. - - - - 22.57 10.41 - -
Total - - - - 22.57 10.41 - -
Remuneration Payable
Mr. Saurabh Mittal - - - 15.32 - - - -
Mrs. Parul Mittal - - - 8.40 - - - -
Mr. Ashok Kumar Sharma - - - 6.08 - - - -
Mr. Prakash Kumar Biswal - - - 2.24 - - - -
Total - - - 32.04 - - - -
32.3 Investments by the loanee in the shares of the parent Company and its subsidiary companies, when the
Company has made a loan or advance in the nature of loan H Nil (Previous year H Nil)
* Amount due from Seema Realcon Pvt Ltd is exclusive of H243.36 lacs (Previous Year H Nil), received through
Channel Finance Facility from a Bank.
#Amount inclusive of service tax
Notes : Related Party Relationship is as identified by the Company and relied upon by the Auditors.
33. PARTICULARS OF LOANS, GUARANTEE OR INVESTMENTS MADE BY THE COMPANY: (I) Details of Loans:
Sl.No.
Date ofinvestment
Date of Board Resolution
Date of Special Resolution (if any)
Name of investee
Purpose for which the proceeds from investment is proposed to be utilized by the recipient
Amount (GBP in Lacs)
Amount (H in Lacs)*
Rate of interest
Security Prevailing yield of 3 year Government Security at the time of extending the loan
NIL
Notes on Financial Statements for the year ended 31st March 2017
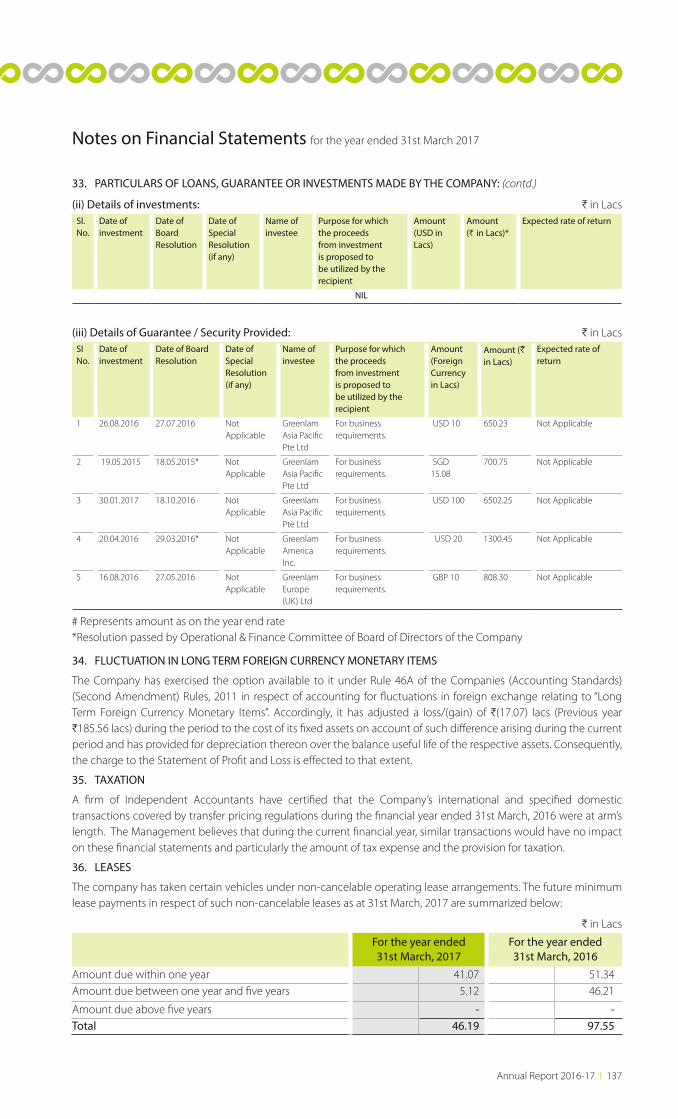
Annual Report 2016-17 l 137
33. PARTICULARS OF LOANS, GUARANTEE OR INVESTMENTS MADE BY THE COMPANY: (contd.)
(ii) Details of investments: H in LacsSl.No.
Date ofinvestment
Date of Board Resolution
Date of Special Resolution (if any)
Name of investee
Purpose for which the proceeds from investment is proposed to be utilized by the recipient
Amount (USD in Lacs)
Amount (H in Lacs)*
Expected rate of return
NIL
(iii) Details of Guarantee / Security Provided: H in LacsSl No.
Date of investment
Date of Board Resolution
Date of Special Resolution (if any)
Name of investee
Purpose for which the proceeds from investment is proposed to be utilized by the recipient
Amount (Foreign Currency in Lacs)
Amount (H in Lacs)
Expected rate of return
1 26.08.2016 27.07.2016 Not Applicable
Greenlam Asia Pacific Pte Ltd
For business requirements.
USD 10 650.23 Not Applicable
2 19.05.2015 18.05.2015* Not Applicable
Greenlam Asia Pacific Pte Ltd
For business requirements.
SGD 15.08
700.75 Not Applicable
3 30.01.2017 18.10.2016 Not Applicable
Greenlam Asia Pacific Pte Ltd
For business requirements.
USD 100 6502.25 Not Applicable
4 20.04.2016 29.03.2016* Not Applicable
Greenlam America Inc.
For business requirements.
USD 20 1300.45 Not Applicable
5 16.08.2016 27.05.2016 Not Applicable
Greenlam Europe (UK) Ltd
For business requirements.
GBP 10 808.30 Not Applicable
# Represents amount as on the year end rate *Resolution passed by Operational & Finance Committee of Board of Directors of the Company
34. FLUCTUATION IN LONG TERM FOREIGN CURRENCY MONETARY ITEMS
The Company has exercised the option available to it under Rule 46A of the Companies (Accounting Standards) (Second Amendment) Rules, 2011 in respect of accounting for fluctuations in foreign exchange relating to “Long Term Foreign Currency Monetary Items”. Accordingly, it has adjusted a loss/(gain) of H(17.07) lacs (Previous year H185.56 lacs) during the period to the cost of its fixed assets on account of such difference arising during the current period and has provided for depreciation thereon over the balance useful life of the respective assets. Consequently, the charge to the Statement of Profit and Loss is effected to that extent.
35. TAXATION
A firm of Independent Accountants have certified that the Company’s international and specified domestic transactions covered by transfer pricing regulations during the financial year ended 31st March, 2016 were at arm’s length. The Management believes that during the current financial year, similar transactions would have no impact on these financial statements and particularly the amount of tax expense and the provision for taxation.
36. LEASES
The company has taken certain vehicles under non-cancelable operating lease arrangements. The future minimum lease payments in respect of such non-cancelable leases as at 31st March, 2017 are summarized below:
H in Lacs
For the year ended31st March, 2017
For the year ended31st March, 2016
Amount due within one year 41.07 51.34Amount due between one year and five years 5.12 46.21
Amount due above five years - - Total 46.19 97.55
Notes on Financial Statements for the year ended 31st March 2017
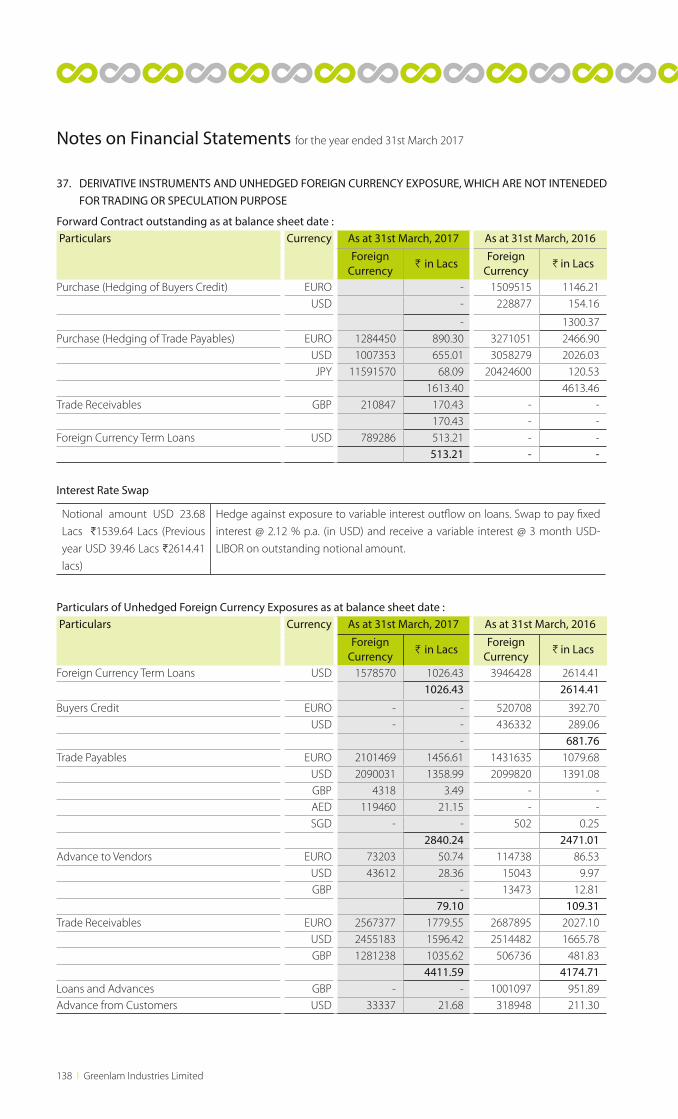
138 l Greenlam Industries Limited
Notes on Financial Statements for the year ended 31st March 2017
37. DERIVATIVE INSTRUMENTS AND UNHEDGED FOREIGN CURRENCY EXPOSURE, WHICH ARE NOT INTENEDED FOR TRADING OR SPECULATION PURPOSE
Forward Contract outstanding as at balance sheet date : Particulars Currency As at 31st March, 2017 As at 31st March, 2016
Foreign Currency
H in LacsForeign
CurrencyH in Lacs
Purchase (Hedging of Buyers Credit) EURO - 1509515 1146.21USD - 228877 154.16
- 1300.37Purchase (Hedging of Trade Payables) EURO 1284450 890.30 3271051 2466.90
USD 1007353 655.01 3058279 2026.03JPY 11591570 68.09 20424600 120.53
1613.40 4613.46Trade Receivables GBP 210847 170.43 - -
170.43 - -Foreign Currency Term Loans USD 789286 513.21 - -
513.21 - -
Interest Rate Swap
Notional amount USD 23.68
Lacs H1539.64 Lacs (Previous
year USD 39.46 Lacs H2614.41
lacs)
Hedge against exposure to variable interest outflow on loans. Swap to pay fixed
interest @ 2.12 % p.a. (in USD) and receive a variable interest @ 3 month USD-
LIBOR on outstanding notional amount.
Particulars of Unhedged Foreign Currency Exposures as at balance sheet date : Particulars Currency As at 31st March, 2017 As at 31st March, 2016
Foreign Currency
H in LacsForeign
CurrencyH in Lacs
Foreign Currency Term Loans USD 1578570 1026.43 3946428 2614.411026.43 2614.41
Buyers Credit EURO - - 520708 392.70USD - - 436332 289.06
- 681.76Trade Payables EURO 2101469 1456.61 1431635 1079.68
USD 2090031 1358.99 2099820 1391.08GBP 4318 3.49 - -AED 119460 21.15 - -SGD - - 502 0.25
2840.24 2471.01Advance to Vendors EURO 73203 50.74 114738 86.53
USD 43612 28.36 15043 9.97GBP - 13473 12.81
79.10 109.31Trade Receivables EURO 2567377 1779.55 2687895 2027.10
USD 2455183 1596.42 2514482 1665.78GBP 1281238 1035.62 506736 481.83
4411.59 4174.71Loans and Advances GBP - - 1001097 951.89Advance from Customers USD 33337 21.68 318948 211.30
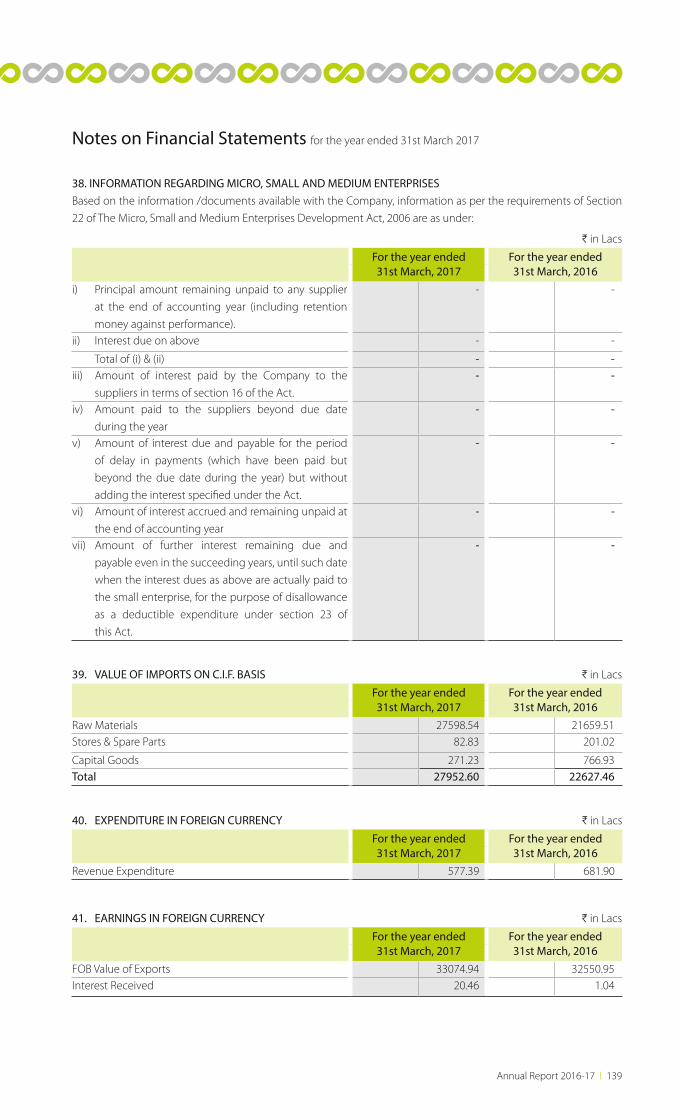
Annual Report 2016-17 l 139
Notes on Financial Statements for the year ended 31st March 2017
38. INFORMATION REGARDING MICRO, SMALL AND MEDIUM ENTERPRISESBased on the information /documents available with the Company, information as per the requirements of Section
22 of The Micro, Small and Medium Enterprises Development Act, 2006 are as under:
H in Lacs
For the year ended31st March, 2017
For the year ended31st March, 2016
i) Principal amount remaining unpaid to any supplier
at the end of accounting year (including retention
money against performance).
- -
ii) Interest due on above - -
Total of (i) & (ii) - - iii) Amount of interest paid by the Company to the
suppliers in terms of section 16 of the Act.
- -
iv) Amount paid to the suppliers beyond due date
during the year
- -
v) Amount of interest due and payable for the period
of delay in payments (which have been paid but
beyond the due date during the year) but without
adding the interest specified under the Act.
- -
vi) Amount of interest accrued and remaining unpaid at
the end of accounting year
- -
vii) Amount of further interest remaining due and
payable even in the succeeding years, until such date
when the interest dues as above are actually paid to
the small enterprise, for the purpose of disallowance
as a deductible expenditure under section 23 of
this Act.
- -
39. VALUE OF IMPORTS ON C.I.F. BASIS H in Lacs
For the year ended31st March, 2017
For the year ended31st March, 2016
Raw Materials 27598.54 21659.51Stores & Spare Parts 82.83 201.02
Capital Goods 271.23 766.93Total 27952.60 22627.46
41. EARNINGS IN FOREIGN CURRENCY H in Lacs
For the year ended31st March, 2017
For the year ended31st March, 2016
FOB Value of Exports 33074.94 32550.95Interest Received 20.46 1.04
40. EXPENDITURE IN FOREIGN CURRENCY H in Lacs
For the year ended31st March, 2017
For the year ended31st March, 2016
Revenue Expenditure 577.39 681.90
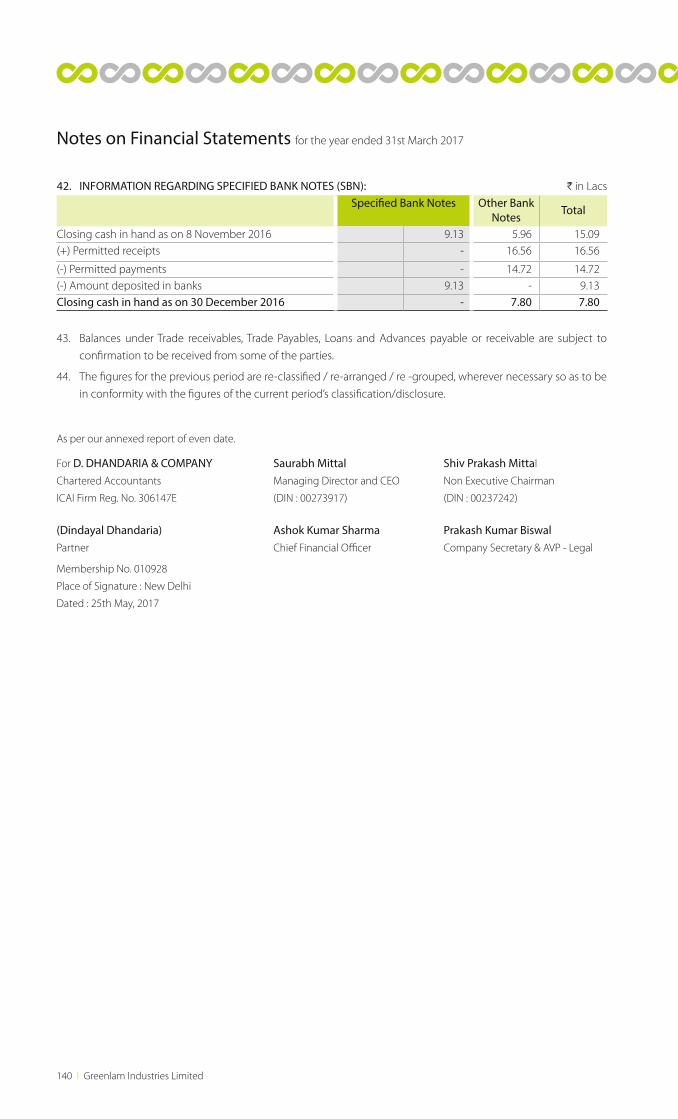
140 l Greenlam Industries Limited
42. INFORMATION REGARDING SPECIFIED BANK NOTES (SBN): H in LacsSpecified Bank Notes Other Bank
NotesTotal
Closing cash in hand as on 8 November 2016 9.13 5.96 15.09(+) Permitted receipts - 16.56 16.56
(-) Permitted payments - 14.72 14.72(-) Amount deposited in banks 9.13 - 9.13Closing cash in hand as on 30 December 2016 - 7.80 7.80
43. Balances under Trade receivables, Trade Payables, Loans and Advances payable or receivable are subject to
confirmation to be received from some of the parties.
44. The figures for the previous period are re-classified / re-arranged / re -grouped, wherever necessary so as to be
in conformity with the figures of the current period’s classification/disclosure.
Notes on Financial Statements for the year ended 31st March 2017
As per our annexed report of even date.
For D. DHANDARIA & COMPANY Saurabh Mittal Shiv Prakash Mittal
Chartered Accountants Managing Director and CEO Non Executive Chairman
ICAI Firm Reg. No. 306147E (DIN : 00273917) (DIN : 00237242)
(Dindayal Dhandaria) Ashok Kumar Sharma Prakash Kumar BiswalPartner Chief Financial Officer Company Secretary & AVP - Legal
Membership No. 010928
Place of Signature : New Delhi
Dated : 25th May, 2017
Annual Report 2016-17 l 141
CONSOLIDATEDFINANCIAL SECTION
142 l Greenlam Industries Limited
REPORT ON THE CONSOLIDATED FINANCIAL STATEMENTS We have audited the accompanying consolidated
financial statements of GREENLAM INDUSTRIES
LIMITED (hereinafter referred to as “the Holding
Company”) and its subsidiaries (the Holding Company
and its subsidiaries together referred to as “the Group”)
comprising of the Consolidated Balance Sheet as at
31st March, 2017, the Consolidated Statement of Profit
and Loss, the Consolidated Cash Flow Statement for
the year then ended, and a summary of the significant
accounting policies and other explanatory information
(hereinafter referred to as “the consolidated financial
statements”).
MANAGEMENT’S RESPONSIBILITY FOR THE CONSOLIDATED FINANCIAL STATEMENTSThe Holding Company’s Board of Directors is responsible for the preparation of these consolidated financial statements in terms of the requirements of the Companies Act, 2013 (hereinafter referred to as “the Act”) that give a true and fair view of the consolidated financial position, consolidated financial performance and consolidated cash flows of the Group in accordance with the accounting principles generally accepted in India, including the Accounting Standards specified under Section 133 of the Act, read with Rule 7 of the Companies (Accounts) Rules, 2014. The respective Board of Directors of the companies included in the Group are responsible for maintenance of adequate accounting records in accordance with the provisions of the Act for safeguarding the assets of the Group and for preventing and detecting frauds and other irregularities; the selection and application of appropriate accounting policies; making judgments and estimates that are reasonable and prudent; and the design, implementation and maintenance of adequate internal financial controls, that were operating effectively for ensuring the accuracy and completeness of the accounting records, relevant to the preparation and presentation of the financial statements that give a true and fair view and are free from material misstatement, whether due to fraud or error, which have been used for the purpose of preparation of the consolidated financial
statements by the Directors of the Holding Company,
as aforesaid.
AUDITORS’ RESPONSIBILITYOur responsibility is to express an opinion on these
consolidated financial statements based on our audit.
While conducting the audit, we have taken into
account the provisions of the Act, the accounting and
auditing standards and matters which are required to
be included in the audit report under the provisions of
the Act and the Rules made thereunder.
We conducted our audit in accordance with the
Standards on Auditing specified under Section 143(10)
of the Act. Those Standards require that we comply with
ethical requirements and plan and perform the audit
to obtain reasonable assurance about whether the
consolidated financial statements are free from material
misstatement.
An audit involves performing procedures to obtain audit
evidence about the amounts and the disclosures in
the consolidated financial statements. The procedures
selected depend on the auditor’s judgment, including
the assessment of the risks of material misstatement
of the consolidated financial statements, whether due
to fraud or error. In making those risk assessments, the
auditor considers internal financial control relevant to
the Holding Company’s preparation of the consolidated
financial statements that give a true and fair view in
order to design audit procedures that are appropriate in
the circumstances but not for the purpose of expressing
an opinion on whether the Holding Company has an
adequate internal financial controls system over financial
reporting in place and the operating effectiveness of
such controls. An audit also includes evaluating the
appropriateness of the accounting policies used and
the reasonableness of the accounting estimates made
by the Holding Company’s Board of Directors, as well as
evaluating the overall presentation of the consolidated
financial statements.
We believe that the audit evidence obtained by us and
the audit evidence obtained by the other auditors in
terms of their reports referred to in sub-paragraph (a)
Independent Auditors’ Report
To
The Members of
Greenlam Industries Limited
Annual Report 2016-17 l 143
of the Other Matters paragraph below, is sufficient and
appropriate to provide a basis for our audit opinion on
the consolidated financial statements.
OPINIONIn our opinion and to the best of our information
and according to the explanations given to us, the
aforesaid consolidated financial statements give the
information required by the Act in the manner so
required and give a true and fair view in conformity with
the accounting principles generally accepted in India,
of the consolidated state of affairs of the Group as at
31st March, 2017, and their consolidated profit and their
consolidated cash flows for the year ended on that date.
OTHER MATTERSWe did not audit the financial statements of the two
foreign subsidiaries whose financial statements reflect
total assets of H9653.27 lacs as at 31st March, 2017,
total revenues of H31646.87 lacs and net cash flows
amounting to H794.53 lacs for the year ended on
that date, as considered in the consolidated financial
statements. These financial statements have been
audited by other auditors whose reports have been
furnished to us by the Management and our opinion
on the consolidated financial statements, in so far as
it relates to the amounts and disclosures included in
respect of the said subsidiaries and our report in terms
of sub-sections (3) and (11) of Section 143 of the Act,
insofar as it relates to the aforesaid subsidiaries, is based
solely on the reports of the other auditors.
REPORT ON OTHER LEGAL AND REGULATORY REQUIREMENTSAs required by Section 143(3) of the Act, we report, to
the extent applicable, that:
(a) We have sought and obtained all the information
and explanations which to the best of our
knowledge and belief were necessary for the
purposes of our audit of the aforesaid consolidated
financial statements.
(b) In our opinion, proper books of account as required
by law relating to preparation of the aforesaid
consolidated financial statements have been kept
so far as it appears from our examination of those
books and the reports of the other auditors.
(c) The Consolidated Balance Sheet, the Consolidated
Statement of Profit and Loss, and the Consolidated
Cash Flow Statement dealt with by this Report are
in agreement with the relevant books of account
maintained for the purpose of preparation of the
consolidated financial statements.
(d) In our opinion, the aforesaid consolidated financial
statements comply with the Accounting Standards
specified under Section 133 of the Act, read with
Rule 7 of the Companies (Accounts) Rules, 2014.
(e) On the basis of the written representations received
from the directors of the Holding Company as on
31st March, 2017 taken on record by the Board of
Directors of the Holding Company, none of the
directors of the Group company is disqualified as
on 31st March, 2017 from being appointed as a
director in terms of Section 164 (2) of the Act.
(f ) With respect to the other matters to be included in
the Auditor’s Report in accordance with Rule 11 of
the Companies (Audit and Auditor’s) Rules, 2014, in
our opinion and to the best of our information and
according to the explanations given to us:
i. The consolidated financial statements
disclose the impact of pending litigations
on the consolidated financial position of the
Group as referred to in Note 19.1.1 to the
consolidated financial statements.
ii. The Group did not have any material
foreseeable losses on long-term contracts
including derivative contracts.
iii. The Company was not required to transfer
any amount to the Investor Education and
Protection Fund.
iv. The Company has provided requisite
disclosures in the financial statements as to
holdings as well as dealings in Specified Bank
Notes during the period from 8th November
2016 to 30th December 2016 and the same
are in accordance with books of accounts
maintained by the Company and as produced
to us by the Management. (Refer note no. 36)
For D. DHANDARIA & COMPANYChartered Accountants
ICAI Firm Reg. No. 306147E
(Dindayal Dhandaria)Partner
Membership No. 010928
Place of Signature: New Delhi
Date : 25th May, 2017
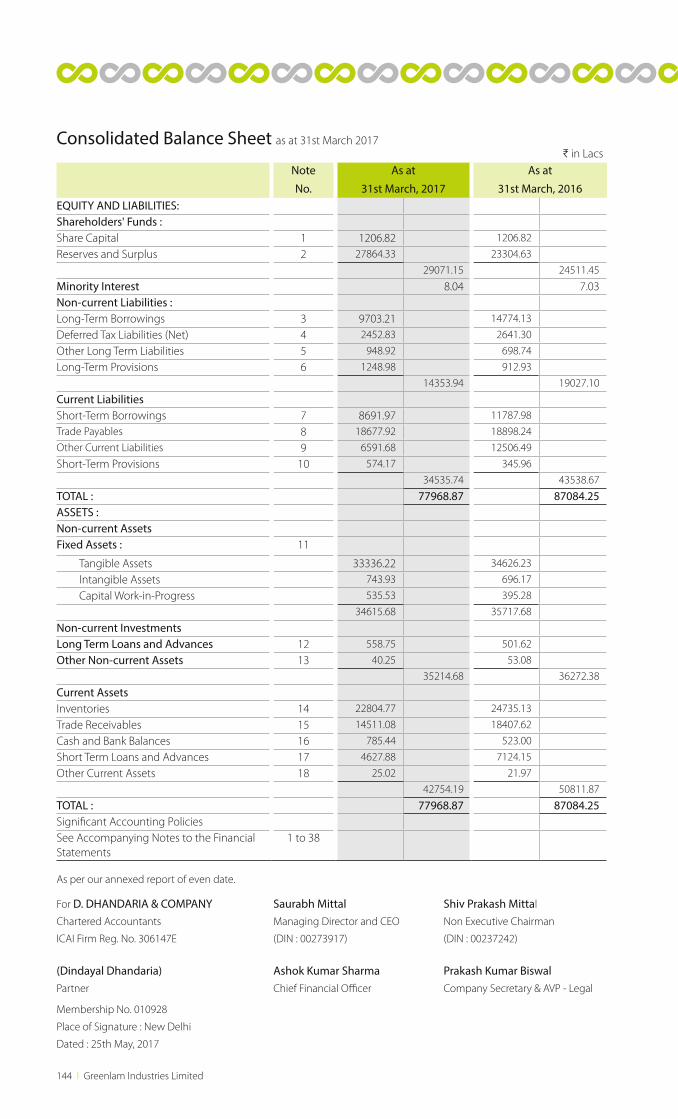
144 l Greenlam Industries Limited
H in LacsNote
No.
As at
31st March, 2017
As at
31st March, 2016EQUITY AND LIABILITIES:Shareholders' Funds :Share Capital 1 1206.82 1206.82
Reserves and Surplus 2 27864.33 23304.63
29071.15 24511.45
Minority Interest 8.04 7.03Non-current Liabilities :Long-Term Borrowings 3 9703.21 14774.13
Deferred Tax Liabilities (Net) 4 2452.83 2641.30
Other Long Term Liabilities 5 948.92 698.74
Long-Term Provisions 6 1248.98 912.93
14353.94 19027.10
Current LiabilitiesShort-Term Borrowings 7 8691.97 11787.98
Trade Payables 8 18677.92 18898.24
Other Current Liabilities 9 6591.68 12506.49
Short-Term Provisions 10 574.17 345.96
34535.74 43538.67
TOTAL : 77968.87 87084.25ASSETS :Non-current AssetsFixed Assets : 11
Tangible Assets 33336.22 34626.23
Intangible Assets 743.93 696.17
Capital Work-in-Progress 535.53 395.28
34615.68 35717.68
Non-current InvestmentsLong Term Loans and Advances 12 558.75 501.62
Other Non-current Assets 13 40.25 53.08
35214.68 36272.38
Current AssetsInventories 14 22804.77 24735.13
Trade Receivables 15 14511.08 18407.62
Cash and Bank Balances 16 785.44 523.00
Short Term Loans and Advances 17 4627.88 7124.15
Other Current Assets 18 25.02 21.97
42754.19 50811.87
TOTAL : 77968.87 87084.25Significant Accounting PoliciesSee Accompanying Notes to the Financial Statements
1 to 38
Consolidated Balance Sheet as at 31st March 2017
As per our annexed report of even date.
For D. DHANDARIA & COMPANY Saurabh Mittal Shiv Prakash Mittal
Chartered Accountants Managing Director and CEO Non Executive Chairman
ICAI Firm Reg. No. 306147E (DIN : 00273917) (DIN : 00237242)
(Dindayal Dhandaria) Ashok Kumar Sharma Prakash Kumar BiswalPartner Chief Financial Officer Company Secretary & AVP - Legal
Membership No. 010928
Place of Signature : New Delhi
Dated : 25th May, 2017
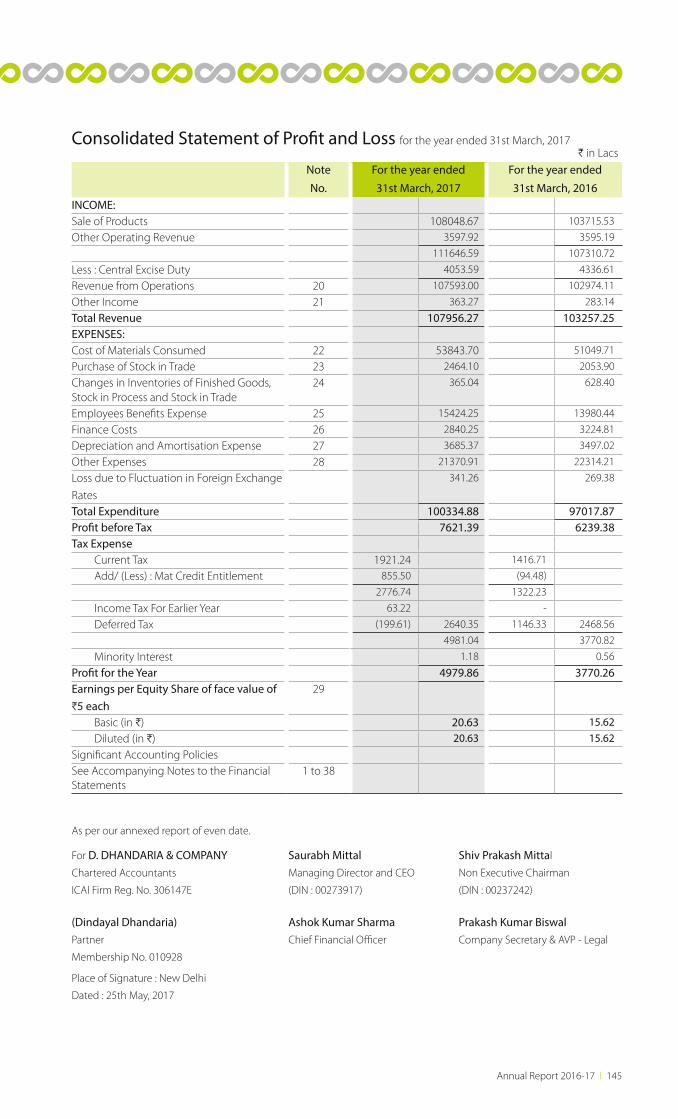
Annual Report 2016-17 l 145
As per our annexed report of even date.
For D. DHANDARIA & COMPANY Saurabh Mittal Shiv Prakash Mittal
Chartered Accountants Managing Director and CEO Non Executive Chairman
ICAI Firm Reg. No. 306147E (DIN : 00273917) (DIN : 00237242)
(Dindayal Dhandaria) Ashok Kumar Sharma Prakash Kumar BiswalPartner Chief Financial Officer Company Secretary & AVP - Legal
Membership No. 010928
Place of Signature : New Delhi
Dated : 25th May, 2017
H in LacsNote
No.
For the year ended
31st March, 2017
For the year ended
31st March, 2016INCOME:Sale of Products 108048.67 103715.53
Other Operating Revenue 3597.92 3595.19
111646.59 107310.72
Less : Central Excise Duty 4053.59 4336.61
Revenue from Operations 20 107593.00 102974.11
Other Income 21 363.27 283.14
Total Revenue 107956.27 103257.25EXPENSES:Cost of Materials Consumed 22 53843.70 51049.71
Purchase of Stock in Trade 23 2464.10 2053.90
Changes in Inventories of Finished Goods, Stock in Process and Stock in Trade
24 365.04 628.40
Employees Benefits Expense 25 15424.25 13980.44
Finance Costs 26 2840.25 3224.81
Depreciation and Amortisation Expense 27 3685.37 3497.02
Other Expenses 28 21370.91 22314.21
Loss due to Fluctuation in Foreign Exchange
Rates
341.26 269.38
Total Expenditure 100334.88 97017.87Profit before Tax 7621.39 6239.38Tax Expense Current Tax 1921.24 1416.71
Add/ (Less) : Mat Credit Entitlement 855.50 (94.48)
2776.74 1322.23
Income Tax For Earlier Year 63.22 -
Deferred Tax (199.61) 2640.35 1146.33 2468.56
4981.04 3770.82
Minority Interest 1.18 0.56
Profit for the Year 4979.86 3770.26Earnings per Equity Share of face value of H5 each
29
Basic (in H) 20.63 15.62 Diluted (in H) 20.63 15.62 Significant Accounting PoliciesSee Accompanying Notes to the Financial Statements
1 to 38
Consolidated Statement of Profit and Loss for the year ended 31st March, 2017
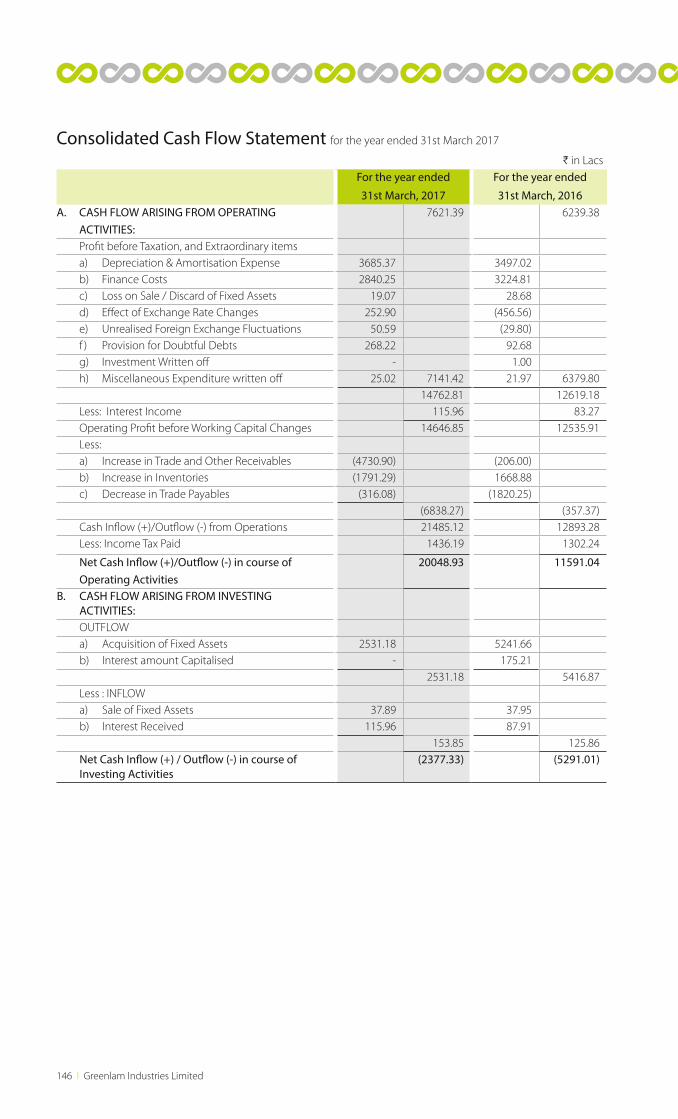
146 l Greenlam Industries Limited
H in LacsFor the year ended
31st March, 2017
For the year ended
31st March, 2016A. CASH FLOW ARISING FROM OPERATING ACTIVITIES:
7621.39 6239.38
Profit before Taxation, and Extraordinary items a) Depreciation & Amortisation Expense 3685.37 3497.02 b) Finance Costs 2840.25 3224.81 c) Loss on Sale / Discard of Fixed Assets 19.07 28.68 d) Effect of Exchange Rate Changes 252.90 (456.56) e) Unrealised Foreign Exchange Fluctuations 50.59 (29.80) f ) Provision for Doubtful Debts 268.22 92.68 g) Investment Written off - 1.00 h) Miscellaneous Expenditure written off 25.02 7141.42 21.97 6379.80
14762.81 12619.18 Less: Interest Income 115.96 83.27 Operating Profit before Working Capital Changes 14646.85 12535.91 Less: a) Increase in Trade and Other Receivables (4730.90) (206.00) b) Increase in Inventories (1791.29) 1668.88 c) Decrease in Trade Payables (316.08) (1820.25)
(6838.27) (357.37) Cash Inflow (+)/Outflow (-) from Operations 21485.12 12893.28 Less: Income Tax Paid 1436.19 1302.24
Net Cash Inflow (+)/Outflow (-) in course of Operating Activities
20048.93 11591.04
B. CASH FLOW ARISING FROM INVESTING ACTIVITIES: OUTFLOW a) Acquisition of Fixed Assets 2531.18 5241.66 b) Interest amount Capitalised - 175.21
2531.18 5416.87 Less : INFLOW a) Sale of Fixed Assets 37.89 37.95 b) Interest Received 115.96 87.91
153.85 125.86 Net Cash Inflow (+) / Outflow (-) in course of Investing Activities
(2377.33) (5291.01)
Consolidated Cash Flow Statement for the year ended 31st March 2017
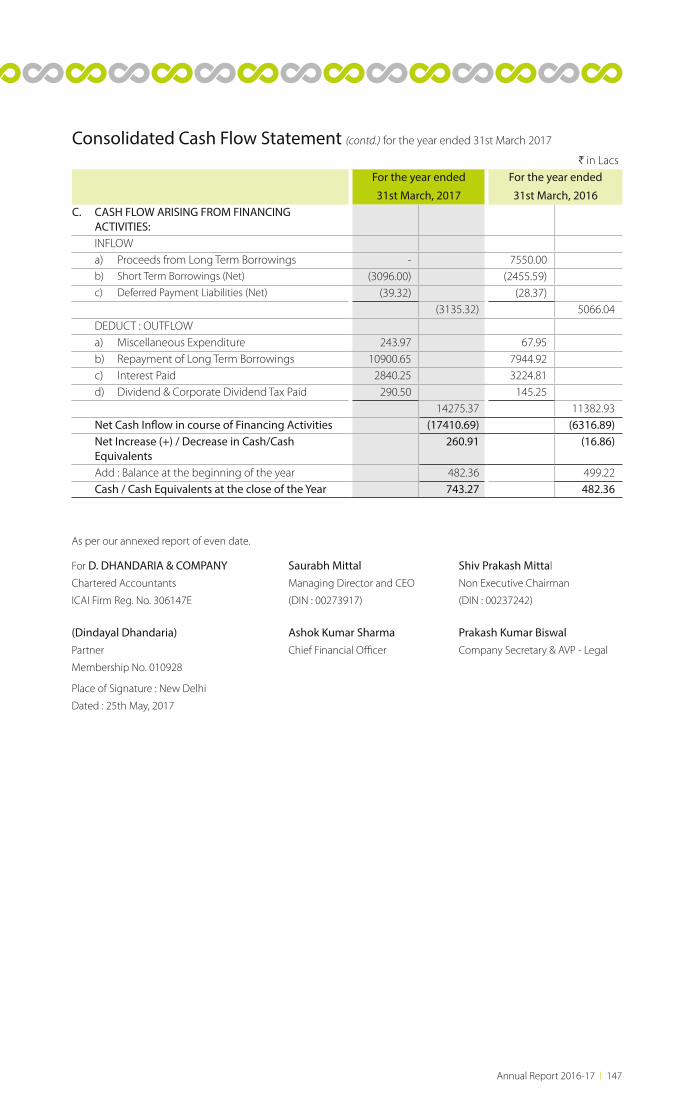
Annual Report 2016-17 l 147
H in LacsFor the year ended
31st March, 2017
For the year ended
31st March, 2016C. CASH FLOW ARISING FROM FINANCING ACTIVITIES: INFLOW a) Proceeds from Long Term Borrowings - 7550.00 b) Short Term Borrowings (Net) (3096.00) (2455.59) c) Deferred Payment Liabilities (Net) (39.32) (28.37)
(3135.32) 5066.04 DEDUCT : OUTFLOW a) Miscellaneous Expenditure 243.97 67.95 b) Repayment of Long Term Borrowings 10900.65 7944.92 c) Interest Paid 2840.25 3224.81 d) Dividend & Corporate Dividend Tax Paid 290.50 145.25
14275.37 11382.93 Net Cash Inflow in course of Financing Activities (17410.69) (6316.89) Net Increase (+) / Decrease in Cash/Cash Equivalents
260.91 (16.86)
Add : Balance at the beginning of the year 482.36 499.22 Cash / Cash Equivalents at the close of the Year 743.27 482.36
Consolidated Cash Flow Statement (contd.) for the year ended 31st March 2017
As per our annexed report of even date.
For D. DHANDARIA & COMPANY Saurabh Mittal Shiv Prakash Mittal
Chartered Accountants Managing Director and CEO Non Executive Chairman
ICAI Firm Reg. No. 306147E (DIN : 00273917) (DIN : 00237242)
(Dindayal Dhandaria) Ashok Kumar Sharma Prakash Kumar BiswalPartner Chief Financial Officer Company Secretary & AVP - Legal
Membership No. 010928
Place of Signature : New Delhi
Dated : 25th May, 2017
148 l Greenlam Industries Limited
1.00 SIGNIFICANT ACCOUNTING POLICIES:
1.01 DISCLOSURE OF ACCOUNTING POLICIES (AS-1):
1.01.01 Nature of Operation Company is engaged in the business of manufacturing laminates, decorative veneers and allied
products through its factories at various locations and branches and dealers’ network spread all
over the country. It imports raw materials for manufacturing. Manufactured goods are sold both
in domestic and overseas markets. It has two wholly owned subsidiary companies operating
in overseas countries which are mainly engaged in marketing and distribution of Company’s
products.
1.01.02 Accounting Concepts & Basis of Presentation
The financial Statements are prepared in accordance with the Indian Generally Accepted
Accounting Principles (GAAP) under the historical cost convention on the accrual basis. GAAP
comprises mandatory accounting standards as specified in the Company (Accounting Standards)
Rules 2006 read with Rule 7(1) of the Companies (Accounts) Rules, 2014 and the provisions of
the Companies Act, 2013. Accounting policies have been consistently applied except where
a newly issued accounting standard is initially adopted or a revision to an existing accounting
standard requires a change in the accounting policy hitherto in use. The Company’s management
evaluates all recently issued or revised accounting standards on an on-going basis.
The Normal Operating Cycle for the Company has been assumed to be of twelve months for
classification of its various assets and liabilities into “Current” and “Non-current”.
Where changes are made in presentation, the comparative figures of the previous year are
regrouped and re-arranged accordingly.
1.01.03 Use of Estimates:
The preparation of financial statements in conformity with Generally Accepted Accounting
Principles requires management to make estimates and assumptions that affect the reported
amounts of assets and liabilities and disclosure of contingent liabilities at the date of the financial
statements and the results of operations during the reporting period end. Although these
estimates are based upon management’s best knowledge of current events and actions, actual
results could differ from these estimates.
1.01.04 Companies Included In Consolidation:
Greenlam Asia Pacific Pte Ltd. (Formerly: Gil Intercontinental Pte. Ltd.), Singapore and its four step
down subsidiaries viz. Greenlam Asia Pacific (Thailand) Co. Ltd., Thailand, Greenlam Holding Co.
Ltd., Thailand, PT. Greenlam Asia Pacific, Indonesia and Greenlam Europe (UK) Ltd, United Kingdom
and Greenlam America Inc., Florida (U.S.A), continued to be the wholly-owned subsidiaries of the
Company, Greenlam Europe(UK) Ltd is an wholly owned subsidiary of Greenlam Asia Pacific Pte
Ltd and minority interest in the step-down subsidiaries viz. Greenlam Asia Pacific (Thailand) Co.
Ltd., Greenlam Holding Co. Ltd. and PT. Greenlam Asia Pacific. is 2.5%, 1% and 1% respectively.
The financial statements of the Subsidiaries for the entire year have been included in the Group’s
Consolidated Financial Statements.
1.02 VALUATION OF INVENTORIES (AS-2): 1.02.01 Stock of Raw Materials, Stores and spare parts are valued at lower of cost or net realisable value;
and of those in transit related to these items are valued at lower of cost to date or net realisable
value.
1.02.02 Goods-in-process is valued at lower of cost or net realisable value.
1.02.03 Stock of Finished goods is valued at lower of cost or net realisable value.
1.02.04 Stock-in-trade is valued at lower of cost or net realisable value.
Significant Accounting Policies and notes forming part of Consolidated Financial Statements
Annual Report 2016-17 l 149
1.02.05 Waste and scraps are accounted at estimated realisable value.
1.02.06 Cost of inventories is ascertained on the ‘weighted average’ basis. Goods-in-process and finished
goods are valued on absorption cost basis.
1.02.07 The self-generated Certified Emission Reductions (CERs) are recognized as asset on certification
by UNFCCC and are valued at lower of cost or net realisable value.
1.03 CASH FLOW STATEMENT (AS – 3): Cash flows are reported using indirect method, whereby profit before tax is adjusted for the effects of
transactions of a non-cash nature and any deferrals or accruals of past or future cash receipts or payments.
The cash flow from regular revenue generating, financing and investing activities of the Company is
segregated. Cash and cash equivalents in the balance sheet comprise cash at bank, cash/cheques in hand
and short term investments (excluding pledged term deposits) with an original maturity of three months
or less.
1.04 CONTINGENCIES AND EVENTS OCCURRING AFTER BALANCE SHEET DATE (AS -4): Disclosure of contingencies as required by the accounting standard is furnished in the Notes on accounts.
1.05 DEPRECIATION (AS – 6): 1.05.01 Tangible assets are depreciated and/or amortised on the basis of their useful lives as notified in
Schedule II to the Companies Act, 2013. Depreciation in respect of additions to assets has been
charged on pro rata basis with reference to the period when the assets are ready for use. The
provision for depreciation for multiple shifts has been made in respect of eligible assets on the
basis of operation of respective units. Where the historical cost of a depreciable asset undergoes
a change due to increase or decrease in long term liability on account of exchange fluctuations,
the depreciation on the revised unamortised depreciable amount is provided prospectively over
the residual useful life of the asset.
1.05.02 Leasehold lands are amortised over the period of lease.
1.05.03 Intangible assets are amortised on straight-line method as follows :
Trademarks - 10 years
Computer Software - 5 years
Technical Know-how - 2 years
Relating to Greenlam Asia Pacific Pte. Ltd.
1.05.04 Depreciation on fixed assets is calculated to write off the cost of the assets on a straight-line
method over its estimated period of use.
Relating to Greenlam America Inc.
1.05.05 Depreciation on fixed assets is provided for on Straight Line Method as used for Federal Income
Tax purposes.
PT. Greenlam Asia Pacific
1.05.06 Depreciation is provided to write off the cost or valuation, less estimated residual value, of tangible
assets over their expected useful economic lives, as follows:
Office Equipment - 25% reducing balance
1.06 REVENUE RECOGNITION (AS -9): Revenue is recognized to the extent that it is probable that the economic benefits will flow to the Company
and the revenue can be reliably measured.
1.06.01 Sale of Goods: Revenue from sales of goods is recognised on transfer of significant risks and
rewards of ownership to the customers. Gross sales shown in the Statement of Profit & Loss are
inclusive of Excise Duty but excludes Trade discounts, CST and VAT. Net sales are shown after
deducting Excise duty which is disclosed at appropriate places.
Significant Accounting Policies and notes forming part of Consolidated Financial Statements
150 l Greenlam Industries Limited
1.06.02 Interest: Interest income is recognized on a time proportion basis taking into account the amount
outstanding and rate applicable.
1.06.03 Dividends: Dividend from investment is recognized when the Company in which they are held
declares the dividend and when the right to receive the same is established.
1.06.04 Insurance Claims: Insurance Claims are accounted for on acceptance and when there is a
reasonable certainty of receiving the same, on grounds of prudence.
1.06.05 Export Incentives: Benefit on account of entitlement to import goods free of duty under the
Advance Authorisation Scheme, Merchandise Export Incentives Scheme (MEIS), Duty Free Import
Authorisation (DFIA) Scheme, and Focus Market Scheme (FMS), are accounted for on accrual basis
at estimated realisable value, as and when exports are made i.e., in the year of export. Profit or loss
arising on utilisation of the same and/or sale thereof are accounted for in the year in which either
the imports are made against the said Advance License, MEIS, DFIA, FMS and/or the same are
sold.
1.07 ACCOUNTING FOR TANGIBLE AND INTANGIBLE ASSETS (AS – 10): 1.07.01 Tangible assets are stated at original cost (net of tax/duty credit availed) less accumulated
depreciation, amortisation and impairment losses except freehold land which is carried at
cost. Cost includes cost of acquisition, construction and installation, taxes, duties, freight, other
incidental expenses related to the acquisition, trial run expenses (net of revenue) and pre-operative
expenses including attributable borrowing costs incurred during pre-operational period.
1.07.02 Tangible assets which are not ready for their intended use on reporting date are carried as capital
work-in-progress at cost, comprising direct cost and related incidental expenses.
1.07.03 The Company has exercised the option available to it under Rule 46A of the Companies (Accounting
Standards) (Second Amendment) Rules, 2011 in respect of accounting for fluctuations in foreign
exchange relating to “Long Term Foreign Currency Monetary Items”.
1.07.04 Intangible assets are carried at cost, net of accumulated amortization and impairment loss, if any.
1.08 ACCOUNTING FOR THE EFFECTS IN FOREIGN EXCHANGE RATES (AS – 11): 1.08.01 Initial Recognition: Transactions denominated in foreign currencies are normally recorded at the
exchange rates prevailing at the time of the transactions.
1.08.02 Conversion: Foreign currency monetary items are reported using the closing rate. Non-monetary
items which are carried in terms of historical cost denominated in a foreign currency are reported
using the exchange rate at the date of the transaction.
1.08.03 Exchange Differences: Exchange differences arising on the settlement of monetary items or on
reporting company’s monetary items at rates different from those at which they were initially
recorded during the year, or reported in previous financial statements, are recognized as income
or expenses in the year in which they arise.
1.08.04 Forward exchange contracts entered into to hedge foreign currency risk of an existing asset/liability: The premium or discount arising at the inception of forward exchange contract
is recognized as an expense/income on the date of transaction. Any profit or loss arising on
cancellation or renewal of such forward exchange contract is also recognized as income or
expense for the period. However, in case of long term liabilities, where they relate to acquisition of
fixed assets, the income or expense on account of exchange difference is adjusted to the carrying
cost of such assets.
1.08.05 Non-Integral Foreign Operations: In case of its wholly owned subsidiary company, being
non-integral foreign operations, the items are translated by applying (a) actual rates for items
of income and expenses in the Statement of Profit and Loss and (b) closing rate in respect of
both monetary and non-monetary items in the Balance Sheet. The resulting exchange differences
Significant Accounting Policies and notes forming part of Consolidated Financial Statements
Annual Report 2016-17 l 151
relating to long-term monetary items are accumulated in a separate account, rather than being
recognised in the Statement of Profit and Loss. Such difference is ultimately dealt with when the
net investment in the related foreign operation is disposed off.
1.09 ACCOUNTING FOR INVESTMENTS (AS – 13): Investments that are readily realisable and intended to be held for not more than a year are classified as
Current investments. All other investments are classified as Non-Current/Long-term Investments. Current
investments are carried at lower of cost and market value on individual investment basis. Non-Current/
Long term Investments are considered at cost, unless there is an “other than temporary” decline in value, in
which case adequate provision is made for the diminution in the value of Investments.
1.10 EMPLOYEE BENEFITS (AS – 15): 1.10.01 Short-term employee benefits are recognized as an expense at the undiscounted amount in the
Statement of Profit and Loss of the year in which the related service is rendered.
1.10.02 Past employment and other long term employee benefits are charged off in the year in which the
employee has rendered services. The amount charged off is recognized at the present value of
the amounts payable determined using actuarial valuation techniques. Actuarial gains and losses
in respect of post-employment and other long term benefits are charged to the Statement of
Profit and Loss.
1.11 BORROWING COSTS (AS – 16): Borrowing costs that are attributable to the acquisition or construction of qualifying assets are capitalised
as part of the cost of such assets. A qualifying asset is one that takes necessarily substantial period of time
to get ready for its intended use. All other borrowing costs are charged to revenue.
1.12 SEGMENT REPORTING (AS – 17): 1.12.01 Identification of Segments:
Primary Segment
Business Segment:
The Company’s operating businesses are organized and managed separately according to the nature of
products, with each segment representing a strategic business unit that offers different products and serves
different markets. The identified segments are Manufacturing & Sale of (a) Laminate & Allied products; and (b)
Veneer & Alllied products.
Secondary Segment
Geographical Segment:
The analysis of geographical segment is based on the geographical location of the customers.
The geographical segments considered for disclosure are as follows:
• Sales within India include sales to customers located within India.
• Sales outside India include sales to customers located outside India.
1.12.02 Allocation of Common costs:
Common allocable costs are allocated to each segment according to the ratio of their respective
turnover to the total turnover.
1.12.03 Unallocated items:
The Unallocated Segment includes general corporate income and expense items, which are not
allocated to any business segment.
1.13 RELATED PARTY DISCLOSURES (AS – 18): Disclosure of related parties as required by the accounting standard is furnished in the Notes on accounts.
Significant Accounting Policies and notes forming part of Consolidated Financial Statements
152 l Greenlam Industries Limited
1.14 LEASES (AS – 19):
In accordance with Accounting Standard 19 “Accounting for leases”, lease arrangements, where the risks and
rewards incidental to ownership of an asset substantially vests with the lessor, are recognised as operating
leases. Lease payments under operating lease are recognised as an expense in the profit and loss account.
1.15 EARNINGS PER SHARE (AS – 20): Basic earnings (loss) per share are calculated by dividing the net profit or loss for the year attributable to
equity shareholders by the weighted average number of equity shares outstanding during the year.
For the purpose of calculating diluted earnings per share, the net profit or loss for the period attributable
to equity shareholders and the weighted average number of shares outstanding during the period are
adjusted for the effects of all dilutive potential equity shares.
1.16 ACCOUNTING FOR TAXES ON INCOME (AS-22): The consolidated financial statements of the parent and its subsidiaries are combined on a line by line
basis by adding together like items of assets, liabilities, income and expenses. Intragroup balances and
intragroup transactions and resulting unrealized profits (losses) are eliminated in full. Consolidated financial
statements are prepared using uniform accounting policies for the like transactions and other events in
similar circumstances to the extent practicable and in case of difference, the same is disclosed.
1.17 INTANGIBLE ASSETS (AS – 26): 1.17.01 Tax expenses comprise of current tax and deferred tax including applicable surcharge and cess.
1.17.02 Current Income tax is computed using the tax effect accounting method, where taxes are accrued
in the same period in which the related revenue and expenses arise. A provision is made for
income tax annually, based on the tax liability computed, after considering tax allowances and
exemptions. Provisions are recorded when it is estimated that a liability due to disallowances or
other matters is probable.
1.17.03 The differences that result between the profit considered for income taxes and the profit as per
the financial statements are identified, and thereafter a deferred tax asset or deferred tax liability
is recorded for timing differences, namely the differences that originate in one accounting period
and reverse in another, based on the tax effect of the aggregate amount being considered. The
tax effect is calculated on the accumulated timing differences at the end of an accounting period
based on prevailing enacted or substantially enacted regulations.
Deferred Tax Assets and Deferred Tax Liabilities are offset, if a legally enforceable right exists to set
off current tax assets against current tax liabilities and the Deferred Tax Assets and Deferred Tax
Liabilities relate to taxes on income levied by same governing taxation laws. Deferred Tax Assets
are recognized only if there is reasonable certainty that they will be realized and are reviewed for
the appropriateness of their respective carrying values at each balance sheet date.
1.17.04 MAT (Minimum Alternate Tax) credit is recognised as an asset only when and to the extent there
is convincing evidence that the Company will pay normal income tax during the specified period.
In the year in which the MAT credit becomes eligible to be recognized as an asset in accordance
with the recommendations contained in guidance Note issued by the Institute of Chartered
Accountants of India, the said asset is created by way of a credit to the Statement of Profit and
Loss and shown as MAT Credit Entitlement. The Company reviews the same at each balance sheet
date and writes down the carrying amount of MAT Credit Entitlement to the extent there is no
longer convincing evidence to the effect that Company will pay normal Income Tax during the
specified period.
1.18 INTANGIBLE ASSETS (AS-28) 1.18.01 Internally generated intangible asset under development stage is recognized when it is
demonstrated that it is technically feasible to use the same and the cost incurred for developing
Significant Accounting Policies and notes forming part of Consolidated Financial Statements
Annual Report 2016-17 l 153
the same is ascertained. Technical Know-how so developed internally is amortised on a straight-
line basis over its estimated useful life.
1.18.02 Intangible assets acquired by payment e.g., Goodwill, Trademarks, Computer Software and
Technical Know-how are disclosed at cost less amortization on a straight-line basis over its
estimated useful life.
1.19 IMPAIRMENT OF TANGIBLE AND INTANGIBLE ASSETS (AS - 28) At each balance sheet date, the Company reviews the carrying amount of tangible and intangible assets to
determine whether there is any indication of impairment loss. If any such indication exists, the recoverable
amount of the assets is estimated in order to determine the extent of impairment loss. The recoverable
amount is higher of the net selling price and the value in use, determined by discounting the estimated
future cash flows expected from the continuing use of the asset to their present value
1.20 PROVISIONS, CONTINGENT LIABILITIES AND CONTINGENT ASSETS (AS – 29): 1.20.01 Provisions are made when (a) the Company has a present obligation as a result of past events;
(b) it is probable that an outflow of resources embodying economic benefits will be required to
settle the obligation; and (c) a reliable estimate is made of the amount of the obligation.
1.20.02 Contingent liabilities are not provided for but are disclosed by way of Notes on Accounts.
1.20.03 Contingent assets are neither accounted for nor disclosed by way of Notes on Accounts.
1.21 EXCISE DUTY AND CUSTOM DUTY: Excise Duty on finished goods stock lying at the factories is accounted for at the point of manufacture of
goods and accordingly, is considered for valuation of finished goods lying in the factories as on the Balance
Sheet date. Similarly, Custom Duty on imported material in transit/lying in bonded warehouse is accounted
for at the time of import/bonding of materials.
1.22 CONSUMPTION OF RAW MATERIALS, STORES & SPARE PARTS ETC.: The costs of Raw Materials, Stores and spare parts etc., consumed consist of purchase price including duties
and taxes (other than those subsequently recoverable by the enterprise from the taxing authorities), freight
inwards and other expenditure directly attributable to the procurement.
1.23 SERVICE TAX & CESS: IVarious expenses are accounted for after deducting the input tax credit available in respect of Service Tax,
Education Cess and Secondary & Higher Education Cess.
1.24 EXPENSES FOR CORPORATE SOCIAL RESPONSIBILITY: In case of CSR activities undertaken by the Company, if any expenditure of revenue nature is incurred or an
irrevocable contribution is made to any agency to be spent by the later on any of the activities mentioned
in Schedule VII to the Companies Act, 2013, the same is charged as an expense to its Statement of Profit
and Loss. In case, the expenditure incurred by the Company is of such a nature which gives rise to an asset,
such an asset is recognised where the Company retains the control of the asset and any future economic
benefit accrues to it. A liability incurred by entering into a contractual obligation is recognised to the extent
to which CSR activity is completed during the year.
1.25 MISCELLANEOUS EXPENDITURE WRITTEN OFF: Expenses related to Scheme of Arrangement, Fee for increase in Authorised Share Capital and Preliminary
Expenses are written off in five equal annual installments in accordance with the provisions of Section 35DD
of the Income Tax Act, 1961.
Significant Accounting Policies and notes forming part of Consolidated Financial Statements
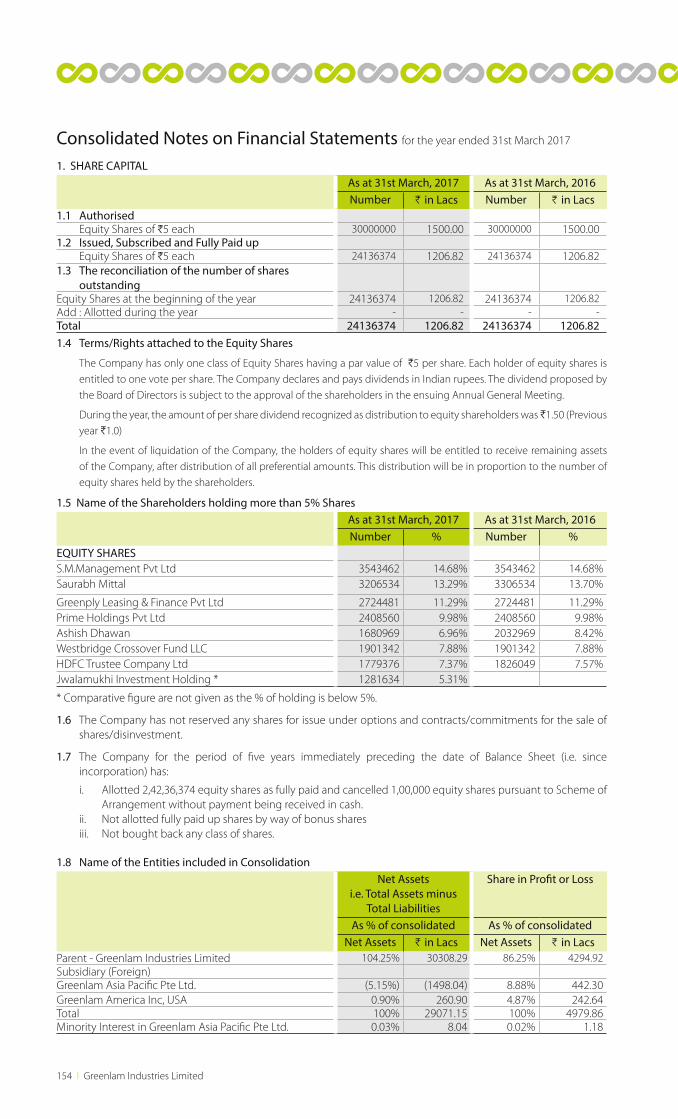
154 l Greenlam Industries Limited
1. SHARE CAPITALAs at 31st March, 2017 As at 31st March, 2016Number H in Lacs Number H in Lacs
1.1 Authorised Equity Shares of H5 each 30000000 1500.00 30000000 1500.00 1.2 Issued, Subscribed and Fully Paid up Equity Shares of H5 each 24136374 1206.82 24136374 1206.82 1.3 The reconciliation of the number of shares outstandingEquity Shares at the beginning of the year 24136374 1206.82 24136374 1206.82 Add : Allotted during the year - - - - Total 24136374 1206.82 24136374 1206.82 1.4 Terms/Rights attached to the Equity Shares
The Company has only one class of Equity Shares having a par value of H5 per share. Each holder of equity shares is entitled to one vote per share. The Company declares and pays dividends in Indian rupees. The dividend proposed by the Board of Directors is subject to the approval of the shareholders in the ensuing Annual General Meeting.
During the year, the amount of per share dividend recognized as distribution to equity shareholders was H1.50 (Previous year H1.0)
In the event of liquidation of the Company, the holders of equity shares will be entitled to receive remaining assets of the Company, after distribution of all preferential amounts. This distribution will be in proportion to the number of equity shares held by the shareholders.
1.5 Name of the Shareholders holding more than 5% SharesAs at 31st March, 2017 As at 31st March, 2016Number % Number %
EQUITY SHARESS.M.Management Pvt Ltd 3543462 14.68% 3543462 14.68%Saurabh Mittal 3206534 13.29% 3306534 13.70%
Greenply Leasing & Finance Pvt Ltd 2724481 11.29% 2724481 11.29%Prime Holdings Pvt Ltd 2408560 9.98% 2408560 9.98%Ashish Dhawan 1680969 6.96% 2032969 8.42%Westbridge Crossover Fund LLC 1901342 7.88% 1901342 7.88%HDFC Trustee Company Ltd 1779376 7.37% 1826049 7.57%Jwalamukhi Investment Holding * 1281634 5.31%
* Comparative figure are not given as the % of holding is below 5%.
1.6 The Company has not reserved any shares for issue under options and contracts/commitments for the sale of shares/disinvestment.
1.7 The Company for the period of five years immediately preceding the date of Balance Sheet (i.e. since incorporation) has:
i. Allotted 2,42,36,374 equity shares as fully paid and cancelled 1,00,000 equity shares pursuant to Scheme of Arrangement without payment being received in cash.
ii. Not allotted fully paid up shares by way of bonus shares iii. Not bought back any class of shares.
Consolidated Notes on Financial Statements for the year ended 31st March 2017
1.8 Name of the Entities included in Consolidation Net Assets
i.e. Total Assets minus Total Liabilities
Share in Profit or Loss
As % of consolidated As % of consolidated Net Assets H in Lacs Net Assets H in Lacs
Parent - Greenlam Industries Limited 104.25% 30308.29 86.25% 4294.92Subsidiary (Foreign)Greenlam Asia Pacific Pte Ltd. (5.15%) (1498.04) 8.88% 442.30Greenlam America Inc, USA 0.90% 260.90 4.87% 242.64Total 100% 29071.15 100% 4979.86Minority Interest in Greenlam Asia Pacific Pte Ltd. 0.03% 8.04 0.02% 1.18
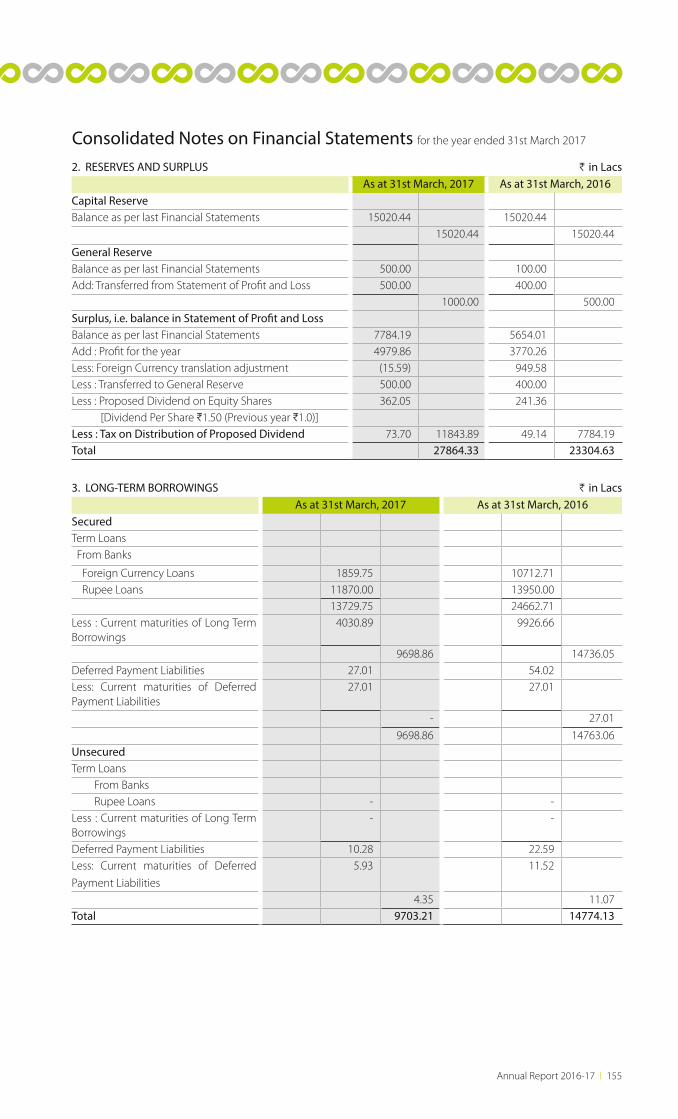
Annual Report 2016-17 l 155
Consolidated Notes on Financial Statements for the year ended 31st March 2017
2. RESERVES AND SURPLUS H in LacsAs at 31st March, 2017 As at 31st March, 2016
Capital ReserveBalance as per last Financial Statements 15020.44 15020.44
15020.44 15020.44
General ReserveBalance as per last Financial Statements 500.00 100.00Add: Transferred from Statement of Profit and Loss 500.00 400.00
1000.00 500.00Surplus, i.e. balance in Statement of Profit and LossBalance as per last Financial Statements 7784.19 5654.01 Add : Profit for the year 4979.86 3770.26Less: Foreign Currency translation adjustment (15.59) 949.58 Less : Transferred to General Reserve 500.00 400.00 Less : Proposed Dividend on Equity Shares 362.05 241.36 [Dividend Per Share H1.50 (Previous year H1.0)]Less : Tax on Distribution of Proposed Dividend 73.70 11843.89 49.14 7784.19Total 27864.33 23304.63
3. LONG-TERM BORROWINGS H in LacsAs at 31st March, 2017 As at 31st March, 2016
SecuredTerm Loans From Banks
Foreign Currency Loans 1859.75 10712.71 Rupee Loans 11870.00 13950.00
13729.75 24662.71Less : Current maturities of Long Term Borrowings
4030.89 9926.66
9698.86 14736.05Deferred Payment Liabilities 27.01 54.02 Less: Current maturities of Deferred Payment Liabilities
27.01 27.01
- 27.01
9698.86 14763.06UnsecuredTerm Loans From Banks Rupee Loans - -Less : Current maturities of Long Term Borrowings
- -
Deferred Payment Liabilities 10.28 22.59Less: Current maturities of Deferred
Payment Liabilities
5.93 11.52
4.35 11.07 Total 9703.21 14774.13
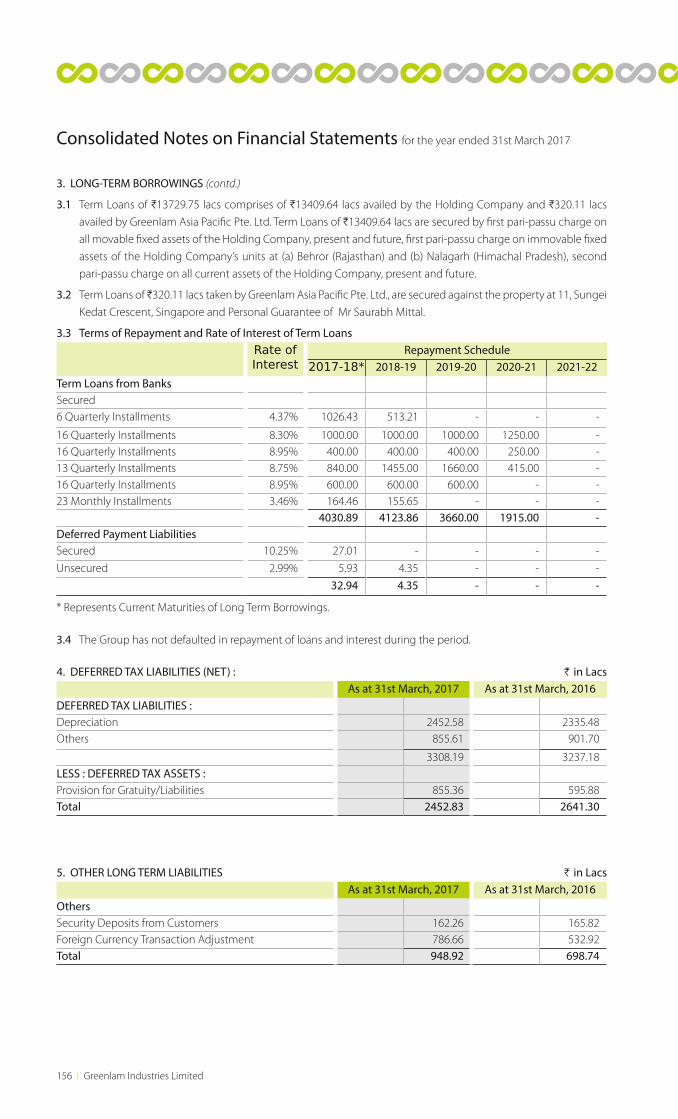
156 l Greenlam Industries Limited
3. LONG-TERM BORROWINGS (contd.)
3.1 Term Loans of H13729.75 lacs comprises of H13409.64 lacs availed by the Holding Company and H320.11 lacs
availed by Greenlam Asia Pacific Pte. Ltd. Term Loans of H13409.64 lacs are secured by first pari-passu charge on
all movable fixed assets of the Holding Company, present and future, first pari-passu charge on immovable fixed
assets of the Holding Company’s units at (a) Behror (Rajasthan) and (b) Nalagarh (Himachal Pradesh), second
pari-passu charge on all current assets of the Holding Company, present and future.
3.2 Term Loans of H320.11 lacs taken by Greenlam Asia Pacific Pte. Ltd., are secured against the property at 11, Sungei
Kedat Crescent, Singapore and Personal Guarantee of Mr Saurabh Mittal.
3.3 Terms of Repayment and Rate of Interest of Term Loans Rate ofInterest
Repayment Schedule2017-18* 2018-19 2019-20 2020-21 2021-22
Term Loans from BanksSecured6 Quarterly Installments 4.37% 1026.43 513.21 - - -
16 Quarterly Installments 8.30% 1000.00 1000.00 1000.00 1250.00 - 16 Quarterly Installments 8.95% 400.00 400.00 400.00 250.00 - 13 Quarterly Installments 8.75% 840.00 1455.00 1660.00 415.00 - 16 Quarterly Installments 8.95% 600.00 600.00 600.00 - - 23 Monthly Installments 3.46% 164.46 155.65 - - -
4030.89 4123.86 3660.00 1915.00 - Deferred Payment LiabilitiesSecured 10.25% 27.01 - - - -
Unsecured 2.99% 5.93 4.35 - - -
32.94 4.35 - - -
* Represents Current Maturities of Long Term Borrowings.
3.4 The Group has not defaulted in repayment of loans and interest during the period.
4. DEFERRED TAX LIABILITIES (NET) : H in LacsAs at 31st March, 2017 As at 31st March, 2016
DEFERRED TAX LIABILITIES :Depreciation 2452.58 2335.48Others 855.61 901.70
3308.19 3237.18LESS : DEFERRED TAX ASSETS :Provision for Gratuity/Liabilities 855.36 595.88Total 2452.83 2641.30
Consolidated Notes on Financial Statements for the year ended 31st March 2017
5. OTHER LONG TERM LIABILITIES H in LacsAs at 31st March, 2017 As at 31st March, 2016
OthersSecurity Deposits from Customers 162.26 165.82Foreign Currency Transaction Adjustment 786.66 532.92Total 948.92 698.74
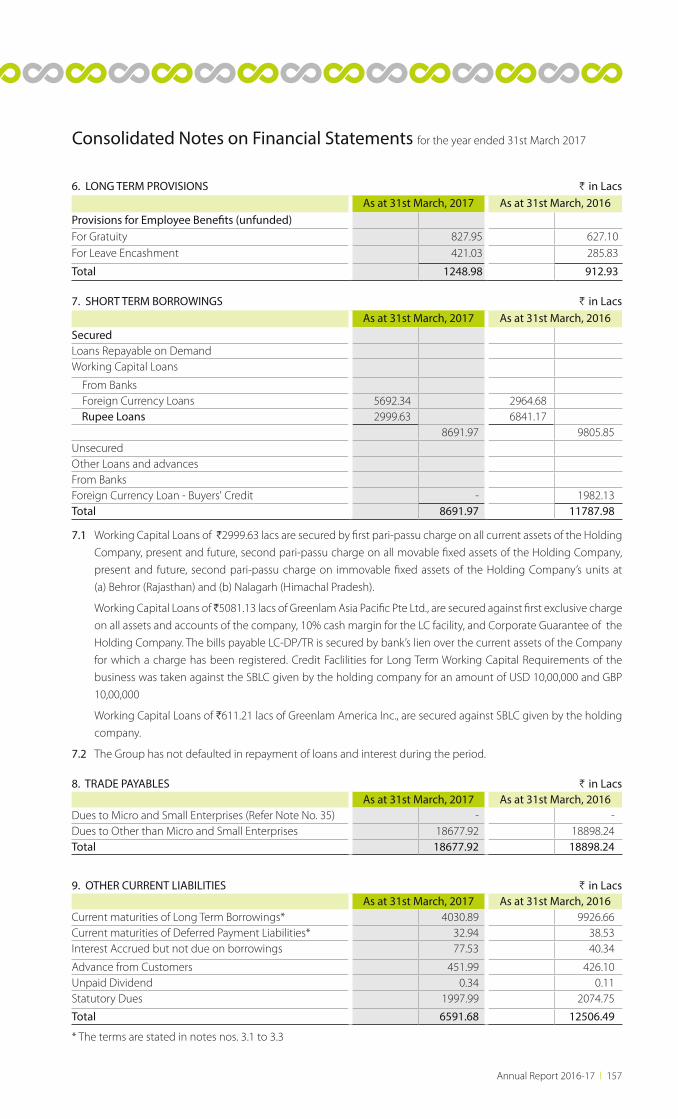
Annual Report 2016-17 l 157
Consolidated Notes on Financial Statements for the year ended 31st March 2017
6. LONG TERM PROVISIONS H in LacsAs at 31st March, 2017 As at 31st March, 2016
Provisions for Employee Benefits (unfunded)For Gratuity 827.95 627.10For Leave Encashment 421.03 285.83
Total 1248.98 912.93
7. SHORT TERM BORROWINGS H in LacsAs at 31st March, 2017 As at 31st March, 2016
SecuredLoans Repayable on DemandWorking Capital Loans
From Banks Foreign Currency Loans 5692.34 2964.68 Rupee Loans 2999.63 6841.17
8691.97 9805.85UnsecuredOther Loans and advancesFrom BanksForeign Currency Loan - Buyers' Credit - 1982.13Total 8691.97 11787.98
7.1 Working Capital Loans of H2999.63 lacs are secured by first pari-passu charge on all current assets of the Holding
Company, present and future, second pari-passu charge on all movable fixed assets of the Holding Company,
present and future, second pari-passu charge on immovable fixed assets of the Holding Company’s units at
(a) Behror (Rajasthan) and (b) Nalagarh (Himachal Pradesh).
Working Capital Loans of H5081.13 lacs of Greenlam Asia Pacific Pte Ltd., are secured against first exclusive charge
on all assets and accounts of the company, 10% cash margin for the LC facility, and Corporate Guarantee of the
Holding Company. The bills payable LC-DP/TR is secured by bank’s lien over the current assets of the Company
for which a charge has been registered. Credit Faclilities for Long Term Working Capital Requirements of the
business was taken against the SBLC given by the holding company for an amount of USD 10,00,000 and GBP
10,00,000
Working Capital Loans of H611.21 lacs of Greenlam America Inc., are secured against SBLC given by the holding
company.
7.2 The Group has not defaulted in repayment of loans and interest during the period.
8. TRADE PAYABLES H in LacsAs at 31st March, 2017 As at 31st March, 2016
Dues to Micro and Small Enterprises (Refer Note No. 35) - -
Dues to Other than Micro and Small Enterprises 18677.92 18898.24 Total 18677.92 18898.24
9. OTHER CURRENT LIABILITIES H in LacsAs at 31st March, 2017 As at 31st March, 2016
Current maturities of Long Term Borrowings* 4030.89 9926.66Current maturities of Deferred Payment Liabilities* 32.94 38.53Interest Accrued but not due on borrowings 77.53 40.34
Advance from Customers 451.99 426.10Unpaid Dividend 0.34 0.11Statutory Dues 1997.99 2074.75
Total 6591.68 12506.49
* The terms are stated in notes nos. 3.1 to 3.3
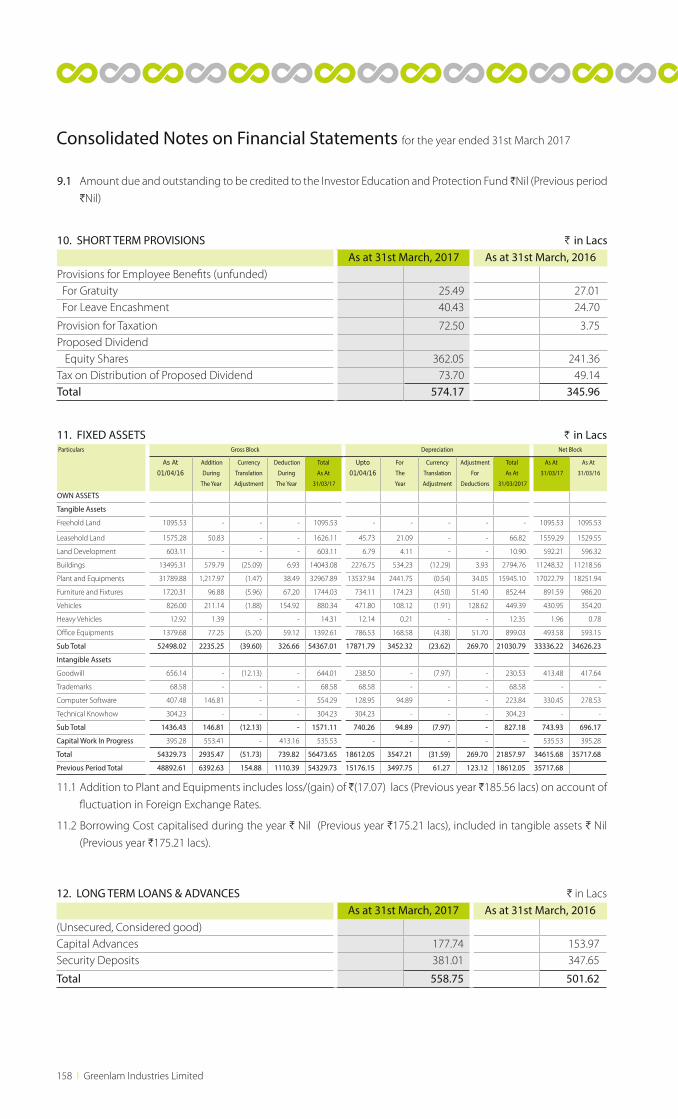
158 l Greenlam Industries Limited
Consolidated Notes on Financial Statements for the year ended 31st March 2017
9.1 Amount due and outstanding to be credited to the Investor Education and Protection Fund HNil (Previous period
HNil)
10. SHORT TERM PROVISIONS H in LacsAs at 31st March, 2017 As at 31st March, 2016
Provisions for Employee Benefits (unfunded) For Gratuity 25.49 27.01 For Leave Encashment 40.43 24.70
Provision for Taxation 72.50 3.75Proposed Dividend Equity Shares 362.05 241.36Tax on Distribution of Proposed Dividend 73.70 49.14Total 574.17 345.96
11. FIXED ASSETS H in Lacs Particulars Gross Block Depreciation Net Block
As At
01/04/16
Addition
During
The Year
Currency
Translation
Adjustment
Deduction
During
The Year
Total
As At
31/03/17
Upto
01/04/16
For
The
Year
Currency
Translation
Adjustment
Adjustment
For
Deductions
Total
As At
31/03/2017
As At
31/03/17
As At
31/03/16
OWN ASSETS
Tangible Assets
Freehold Land 1095.53 - - - 1095.53 - - - - - 1095.53 1095.53
Leasehold Land 1575.28 50.83 - - 1626.11 45.73 21.09 - - 66.82 1559.29 1529.55
Land Development 603.11 - - - 603.11 6.79 4.11 - - 10.90 592.21 596.32
Buildings 13495.31 579.79 (25.09) 6.93 14043.08 2276.75 534.23 (12.29) 3.93 2794.76 11248.32 11218.56
Plant and Equipments 31789.88 1,217.97 (1.47) 38.49 32967.89 13537.94 2441.75 (0.54) 34.05 15945.10 17022.79 18251.94
Furniture and Fixtures 1720.31 96.88 (5.96) 67.20 1744.03 734.11 174.23 (4.50) 51.40 852.44 891.59 986.20
Vehicles 826.00 211.14 (1.88) 154.92 880.34 471.80 108.12 (1.91) 128.62 449.39 430.95 354.20
Heavy Vehicles 12.92 1.39 - - 14.31 12.14 0.21 - - 12.35 1.96 0.78
Office Equipments 1379.68 77.25 (5.20) 59.12 1392.61 786.53 168.58 (4.38) 51.70 899.03 493.58 593.15
Sub Total 52498.02 2235.25 (39.60) 326.66 54367.01 17871.79 3452.32 (23.62) 269.70 21030.79 33336.22 34626.23
Intangible Assets
Goodwill 656.14 - (12.13) - 644.01 238.50 - (7.97) - 230.53 413.48 417.64
Trademarks 68.58 - - - 68.58 68.58 - - - 68.58 - -
Computer Software 407.48 146.81 - - 554.29 128.95 94.89 - - 223.84 330.45 278.53
Technical Knowhow 304.23 - - - 304.23 304.23 - - - 304.23 - -
Sub Total 1436.43 146.81 (12.13) - 1571.11 740.26 94.89 (7.97) - 827.18 743.93 696.17
Capital Work In Progress 395.28 553.41 - 413.16 535.53 - - - - - 535.53 395.28
Total 54329.73 2935.47 (51.73) 739.82 56473.65 18612.05 3547.21 (31.59) 269.70 21857.97 34615.68 35717.68
Previous Period Total 48892.61 6392.63 154.88 1110.39 54329.73 15176.15 3497.75 61.27 123.12 18612.05 35717.68
11.1 Addition to Plant and Equipments includes loss/(gain) of H(17.07) lacs (Previous year H185.56 lacs) on account of
fluctuation in Foreign Exchange Rates.
11.2 Borrowing Cost capitalised during the year H Nil (Previous year H175.21 lacs), included in tangible assets H Nil
(Previous year H175.21 lacs).
12. LONG TERM LOANS & ADVANCES H in LacsAs at 31st March, 2017 As at 31st March, 2016
(Unsecured, Considered good)Capital Advances 177.74 153.97Security Deposits 381.01 347.65
Total 558.75 501.62
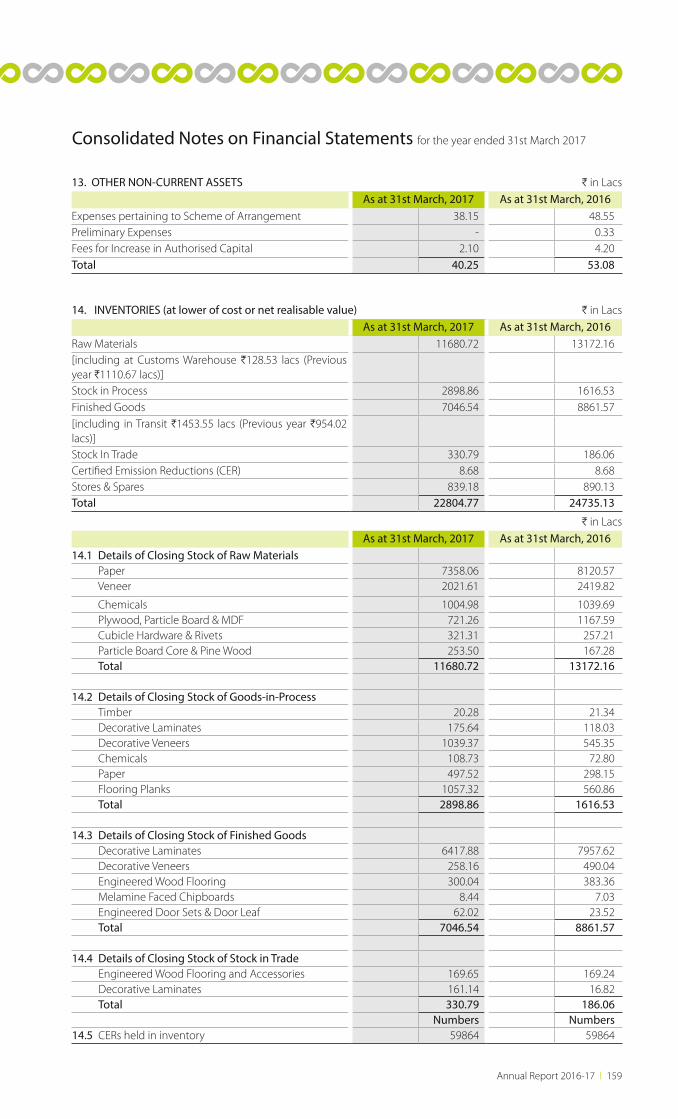
Annual Report 2016-17 l 159
Consolidated Notes on Financial Statements for the year ended 31st March 2017
H in LacsAs at 31st March, 2017 As at 31st March, 2016
14.1 Details of Closing Stock of Raw Materials Paper 7358.06 8120.57 Veneer 2021.61 2419.82
Chemicals 1004.98 1039.69 Plywood, Particle Board & MDF 721.26 1167.59 Cubicle Hardware & Rivets 321.31 257.21 Particle Board Core & Pine Wood 253.50 167.28 Total 11680.72 13172.16
14.2 Details of Closing Stock of Goods-in-Process Timber 20.28 21.34 Decorative Laminates 175.64 118.03 Decorative Veneers 1039.37 545.35 Chemicals 108.73 72.80 Paper 497.52 298.15 Flooring Planks 1057.32 560.86 Total 2898.86 1616.53
14.3 Details of Closing Stock of Finished Goods Decorative Laminates 6417.88 7957.62 Decorative Veneers 258.16 490.04 Engineered Wood Flooring 300.04 383.36 Melamine Faced Chipboards 8.44 7.03 Engineered Door Sets & Door Leaf 62.02 23.52 Total 7046.54 8861.57
14.4 Details of Closing Stock of Stock in Trade Engineered Wood Flooring and Accessories 169.65 169.24 Decorative Laminates 161.14 16.82 Total 330.79 186.06
Numbers Numbers14.5 CERs held in inventory 59864 59864
13. OTHER NON-CURRENT ASSETS H in LacsAs at 31st March, 2017 As at 31st March, 2016
Expenses pertaining to Scheme of Arrangement 38.15 48.55Preliminary Expenses - 0.33Fees for Increase in Authorised Capital 2.10 4.20Total 40.25 53.08
14. INVENTORIES (at lower of cost or net realisable value) H in LacsAs at 31st March, 2017 As at 31st March, 2016
Raw Materials 11680.72 13172.16[including at Customs Warehouse H128.53 lacs (Previous year H1110.67 lacs)]Stock in Process 2898.86 1616.53Finished Goods 7046.54 8861.57[including in Transit H1453.55 lacs (Previous year H954.02 lacs)]Stock In Trade 330.79 186.06Certified Emission Reductions (CER) 8.68 8.68Stores & Spares 839.18 890.13Total 22804.77 24735.13
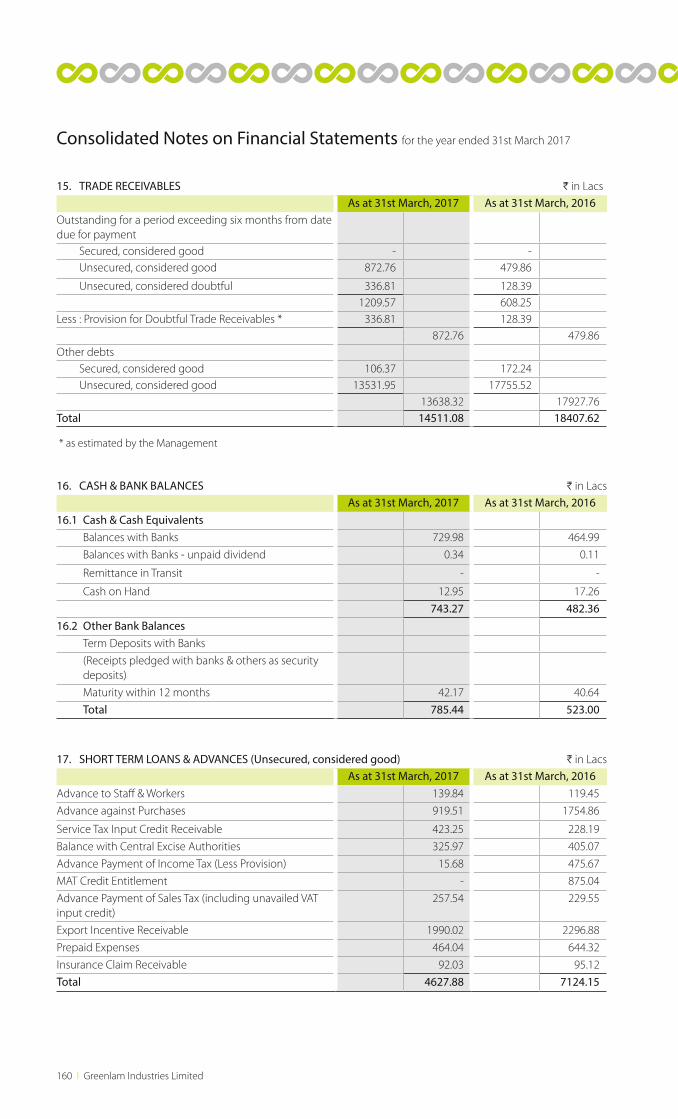
160 l Greenlam Industries Limited
15. TRADE RECEIVABLES H in LacsAs at 31st March, 2017 As at 31st March, 2016
Outstanding for a period exceeding six months from date due for payment Secured, considered good - - Unsecured, considered good 872.76 479.86
Unsecured, considered doubtful 336.81 128.39 1209.57 608.25
Less : Provision for Doubtful Trade Receivables * 336.81 128.39872.76 479.86
Other debts Secured, considered good 106.37 172.24 Unsecured, considered good 13531.95 17755.52
13638.32 17927.76Total 14511.08 18407.62
* as estimated by the Management
Consolidated Notes on Financial Statements for the year ended 31st March 2017
16. CASH & BANK BALANCES H in LacsAs at 31st March, 2017 As at 31st March, 2016
16.1 Cash & Cash Equivalents Balances with Banks 729.98 464.99
Balances with Banks - unpaid dividend 0.34 0.11
Remittance in Transit - -
Cash on Hand 12.95 17.26
743.27 482.3616.2 Other Bank Balances Term Deposits with Banks
(Receipts pledged with banks & others as security deposits)
Maturity within 12 months 42.17 40.64
Total 785.44 523.00
17. SHORT TERM LOANS & ADVANCES (Unsecured, considered good) H in LacsAs at 31st March, 2017 As at 31st March, 2016
Advance to Staff & Workers 139.84 119.45
Advance against Purchases 919.51 1754.86
Service Tax Input Credit Receivable 423.25 228.19
Balance with Central Excise Authorities 325.97 405.07
Advance Payment of Income Tax (Less Provision) 15.68 475.67
MAT Credit Entitlement - 875.04
Advance Payment of Sales Tax (including unavailed VAT input credit)
257.54 229.55
Export Incentive Receivable 1990.02 2296.88
Prepaid Expenses 464.04 644.32
Insurance Claim Receivable 92.03 95.12
Total 4627.88 7124.15
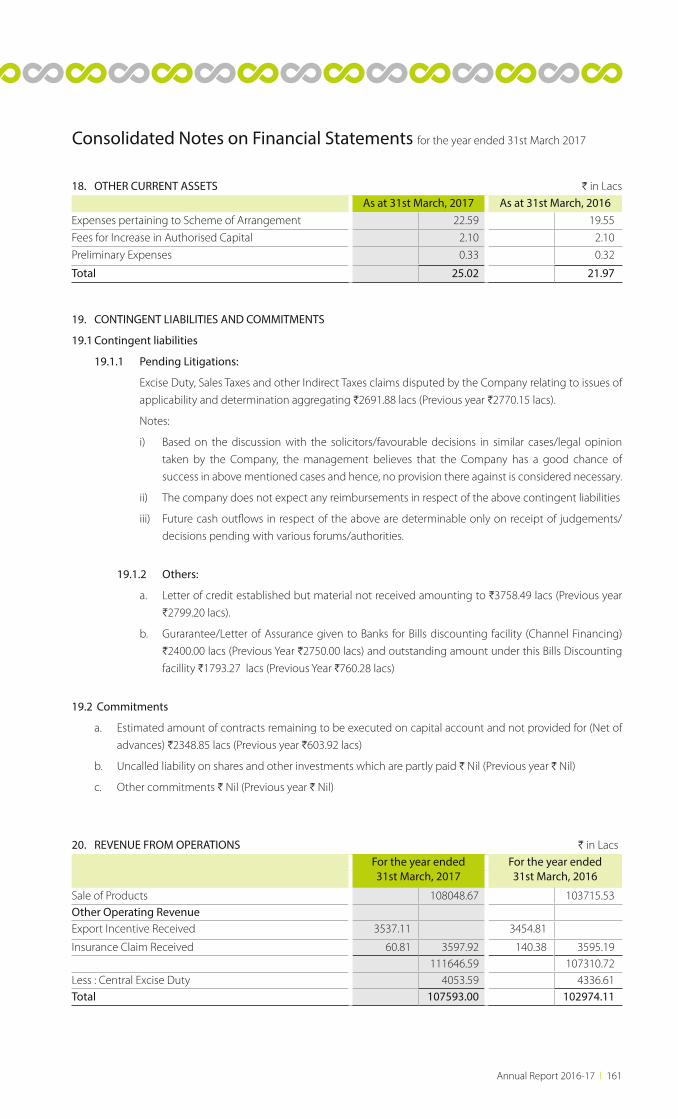
Annual Report 2016-17 l 161
Consolidated Notes on Financial Statements for the year ended 31st March 2017
18. OTHER CURRENT ASSETS H in LacsAs at 31st March, 2017 As at 31st March, 2016
Expenses pertaining to Scheme of Arrangement 22.59 19.55
Fees for Increase in Authorised Capital 2.10 2.10
Preliminary Expenses 0.33 0.32
Total 25.02 21.97
19. CONTINGENT LIABILITIES AND COMMITMENTS
19.1 Contingent liabilities
19.1.1 Pending Litigations:
Excise Duty, Sales Taxes and other Indirect Taxes claims disputed by the Company relating to issues of
applicability and determination aggregating H2691.88 lacs (Previous year H2770.15 lacs).
Notes:
i) Based on the discussion with the solicitors/favourable decisions in similar cases/legal opinion
taken by the Company, the management believes that the Company has a good chance of
success in above mentioned cases and hence, no provision there against is considered necessary.
ii) The company does not expect any reimbursements in respect of the above contingent liabilities
iii) Future cash outflows in respect of the above are determinable only on receipt of judgements/
decisions pending with various forums/authorities.
19.1.2 Others:
a. Letter of credit established but material not received amounting to H3758.49 lacs (Previous year
H2799.20 lacs).
b. Gurarantee/Letter of Assurance given to Banks for Bills discounting facility (Channel Financing)
H2400.00 lacs (Previous Year H2750.00 lacs) and outstanding amount under this Bills Discounting
facillity H1793.27 lacs (Previous Year H760.28 lacs)
19.2 Commitments
a. Estimated amount of contracts remaining to be executed on capital account and not provided for (Net of
advances) H2348.85 lacs (Previous year H603.92 lacs)
b. Uncalled liability on shares and other investments which are partly paid H Nil (Previous year H Nil)
c. Other commitments H Nil (Previous year H Nil)
20. REVENUE FROM OPERATIONS H in LacsFor the year ended31st March, 2017
For the year ended31st March, 2016
Sale of Products 108048.67 103715.53Other Operating RevenueExport Incentive Received 3537.11 3454.81
Insurance Claim Received 60.81 3597.92 140.38 3595.19111646.59 107310.72
Less : Central Excise Duty 4053.59 4336.61Total 107593.00 102974.11
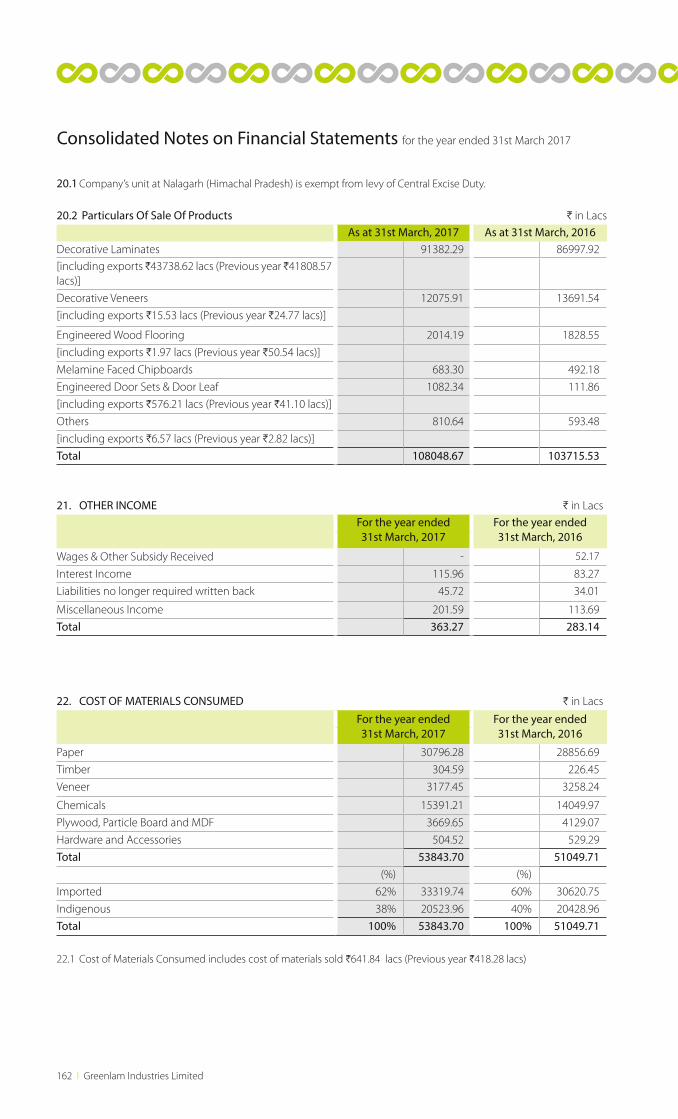
162 l Greenlam Industries Limited
Consolidated Notes on Financial Statements for the year ended 31st March 2017
20.1 Company’s unit at Nalagarh (Himachal Pradesh) is exempt from levy of Central Excise Duty.
20.2 Particulars Of Sale Of Products H in LacsAs at 31st March, 2017 As at 31st March, 2016
Decorative Laminates 91382.29 86997.92[including exports H43738.62 lacs (Previous year H41808.57 lacs)]
Decorative Veneers 12075.91 13691.54
[including exports H15.53 lacs (Previous year H24.77 lacs)]
Engineered Wood Flooring 2014.19 1828.55
[including exports H1.97 lacs (Previous year H50.54 lacs)]
Melamine Faced Chipboards 683.30 492.18
Engineered Door Sets & Door Leaf 1082.34 111.86
[including exports H576.21 lacs (Previous year H41.10 lacs)]
Others 810.64 593.48
[including exports H6.57 lacs (Previous year H2.82 lacs)]
Total 108048.67 103715.53
21. OTHER INCOME H in LacsFor the year ended31st March, 2017
For the year ended31st March, 2016
Wages & Other Subsidy Received - 52.17
Interest Income 115.96 83.27
Liabilities no longer required written back 45.72 34.01
Miscellaneous Income 201.59 113.69
Total 363.27 283.14
22. COST OF MATERIALS CONSUMED H in Lacs
For the year ended31st March, 2017
For the year ended31st March, 2016
Paper 30796.28 28856.69
Timber 304.59 226.45
Veneer 3177.45 3258.24
Chemicals 15391.21 14049.97
Plywood, Particle Board and MDF 3669.65 4129.07
Hardware and Accessories 504.52 529.29
Total 53843.70 51049.71(%) (%)
Imported 62% 33319.74 60% 30620.75
Indigenous 38% 20523.96 40% 20428.96
Total 100% 53843.70 100% 51049.71
22.1 Cost of Materials Consumed includes cost of materials sold H641.84 lacs (Previous year H418.28 lacs)
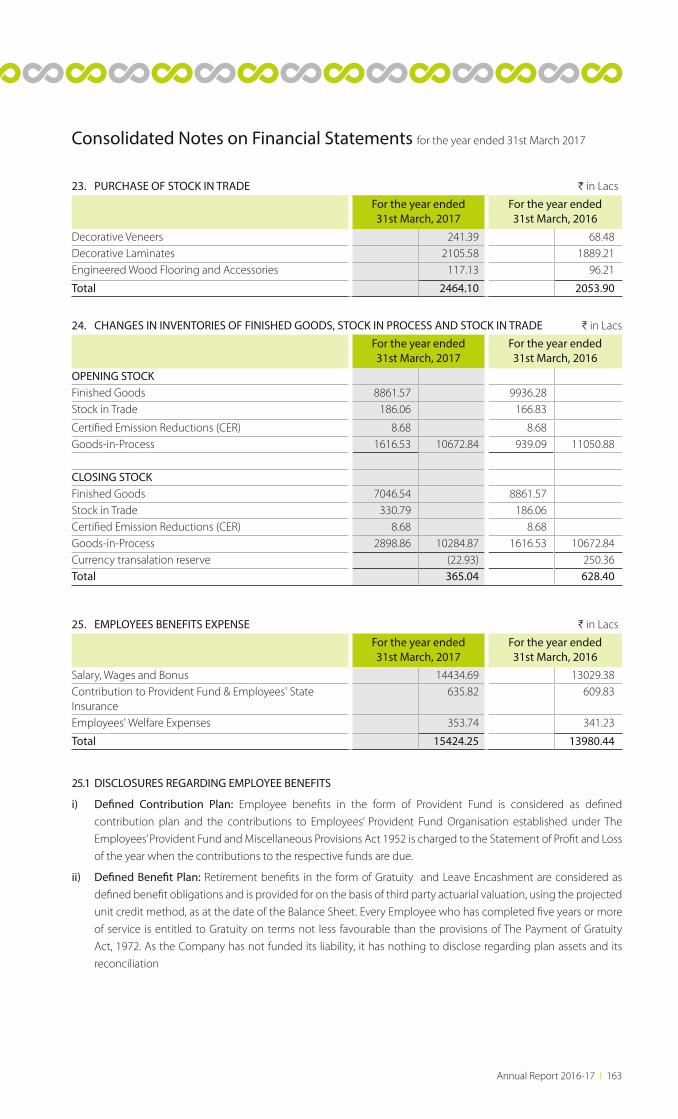
Annual Report 2016-17 l 163
25. EMPLOYEES BENEFITS EXPENSE H in Lacs
For the year ended31st March, 2017
For the year ended31st March, 2016
Salary, Wages and Bonus 14434.69 13029.38Contribution to Provident Fund & Employees' State Insurance
635.82 609.83
Employees' Welfare Expenses 353.74 341.23
Total 15424.25 13980.44
25.1 DISCLOSURES REGARDING EMPLOYEE BENEFITS
i) Defined Contribution Plan: Employee benefits in the form of Provident Fund is considered as defined
contribution plan and the contributions to Employees’ Provident Fund Organisation established under The
Employees’ Provident Fund and Miscellaneous Provisions Act 1952 is charged to the Statement of Profit and Loss
of the year when the contributions to the respective funds are due.
ii) Defined Benefit Plan: Retirement benefits in the form of Gratuity and Leave Encashment are considered as
defined benefit obligations and is provided for on the basis of third party actuarial valuation, using the projected
unit credit method, as at the date of the Balance Sheet. Every Employee who has completed five years or more
of service is entitled to Gratuity on terms not less favourable than the provisions of The Payment of Gratuity
Act, 1972. As the Company has not funded its liability, it has nothing to disclose regarding plan assets and its
reconciliation
23. PURCHASE OF STOCK IN TRADE H in Lacs
For the year ended31st March, 2017
For the year ended31st March, 2016
Decorative Veneers 241.39 68.48Decorative Laminates 2105.58 1889.21Engineered Wood Flooring and Accessories 117.13 96.21
Total 2464.10 2053.90
24. CHANGES IN INVENTORIES OF FINISHED GOODS, STOCK IN PROCESS AND STOCK IN TRADE H in Lacs
For the year ended31st March, 2017
For the year ended31st March, 2016
OPENING STOCKFinished Goods 8861.57 9936.28Stock in Trade 186.06 166.83
Certified Emission Reductions (CER) 8.68 8.68Goods-in-Process 1616.53 10672.84 939.09 11050.88
CLOSING STOCKFinished Goods 7046.54 8861.57Stock in Trade 330.79 186.06Certified Emission Reductions (CER) 8.68 8.68Goods-in-Process 2898.86 10284.87 1616.53 10672.84Currency transalation reserve (22.93) 250.36 Total 365.04 628.40
Consolidated Notes on Financial Statements for the year ended 31st March 2017
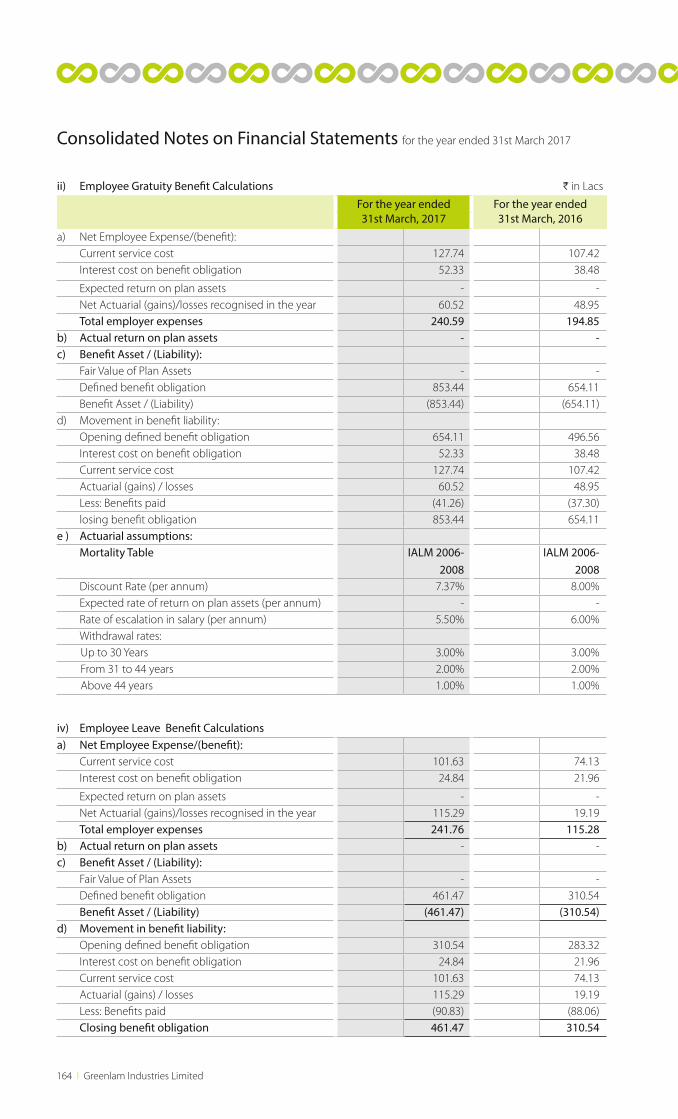
164 l Greenlam Industries Limited
ii) Employee Gratuity Benefit Calculations H in Lacs
For the year ended31st March, 2017
For the year ended31st March, 2016
a) Net Employee Expense/(benefit): Current service cost 127.74 107.42 Interest cost on benefit obligation 52.33 38.48
Expected return on plan assets - - Net Actuarial (gains)/losses recognised in the year 60.52 48.95 Total employer expenses 240.59 194.85b) Actual return on plan assets - - c) Benefit Asset / (Liability): Fair Value of Plan Assets - - Defined benefit obligation 853.44 654.11 Benefit Asset / (Liability) (853.44) (654.11)d) Movement in benefit liability: Opening defined benefit obligation 654.11 496.56 Interest cost on benefit obligation 52.33 38.48 Current service cost 127.74 107.42 Actuarial (gains) / losses 60.52 48.95 Less: Benefits paid (41.26) (37.30) losing benefit obligation 853.44 654.11e ) Actuarial assumptions: Mortality Table IALM 2006-
2008IALM 2006-
2008 Discount Rate (per annum) 7.37% 8.00% Expected rate of return on plan assets (per annum) - - Rate of escalation in salary (per annum) 5.50% 6.00% Withdrawal rates: Up to 30 Years 3.00% 3.00% From 31 to 44 years 2.00% 2.00% Above 44 years 1.00% 1.00%
Consolidated Notes on Financial Statements for the year ended 31st March 2017
iv) Employee Leave Benefit Calculationsa) Net Employee Expense/(benefit): Current service cost 101.63 74.13 Interest cost on benefit obligation 24.84 21.96
Expected return on plan assets - - Net Actuarial (gains)/losses recognised in the year 115.29 19.19 Total employer expenses 241.76 115.28 b) Actual return on plan assets - -c) Benefit Asset / (Liability): Fair Value of Plan Assets - - Defined benefit obligation 461.47 310.54 Benefit Asset / (Liability) (461.47) (310.54)d) Movement in benefit liability: Opening defined benefit obligation 310.54 283.32 Interest cost on benefit obligation 24.84 21.96 Current service cost 101.63 74.13 Actuarial (gains) / losses 115.29 19.19 Less: Benefits paid (90.83) (88.06) Closing benefit obligation 461.47 310.54
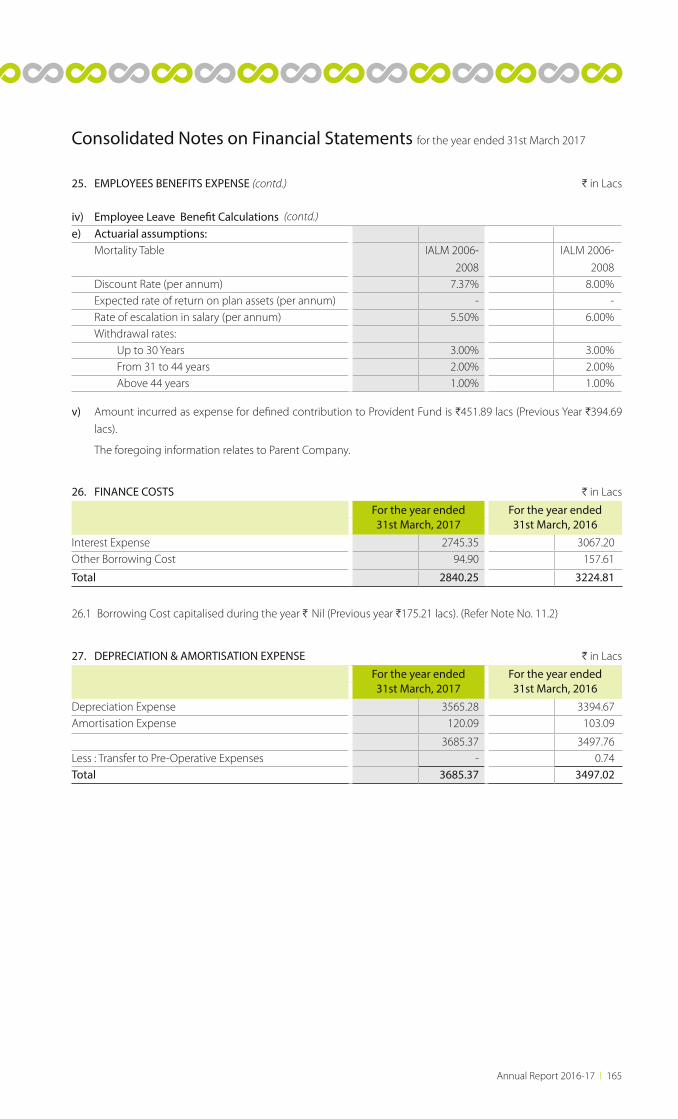
Annual Report 2016-17 l 165
Consolidated Notes on Financial Statements for the year ended 31st March 2017
25. EMPLOYEES BENEFITS EXPENSE (contd.) H in Lacs
iv) Employee Leave Benefit Calculationse) Actuarial assumptions: Mortality Table IALM 2006-
2008
IALM 2006-
2008 Discount Rate (per annum) 7.37% 8.00% Expected rate of return on plan assets (per annum) - - Rate of escalation in salary (per annum) 5.50% 6.00% Withdrawal rates: Up to 30 Years 3.00% 3.00% From 31 to 44 years 2.00% 2.00% Above 44 years 1.00% 1.00%
v) Amount incurred as expense for defined contribution to Provident Fund is H451.89 lacs (Previous Year H394.69
lacs).
The foregoing information relates to Parent Company.
26. FINANCE COSTS H in Lacs
For the year ended31st March, 2017
For the year ended31st March, 2016
Interest Expense 2745.35 3067.20Other Borrowing Cost 94.90 157.61
Total 2840.25 3224.81
26.1 Borrowing Cost capitalised during the year H Nil (Previous year H175.21 lacs). (Refer Note No. 11.2)
(contd.)
27. DEPRECIATION & AMORTISATION EXPENSE H in Lacs
For the year ended31st March, 2017
For the year ended31st March, 2016
Depreciation Expense 3565.28 3394.67Amortisation Expense 120.09 103.09
3685.37 3497.76Less : Transfer to Pre-Operative Expenses - 0.74Total 3685.37 3497.02
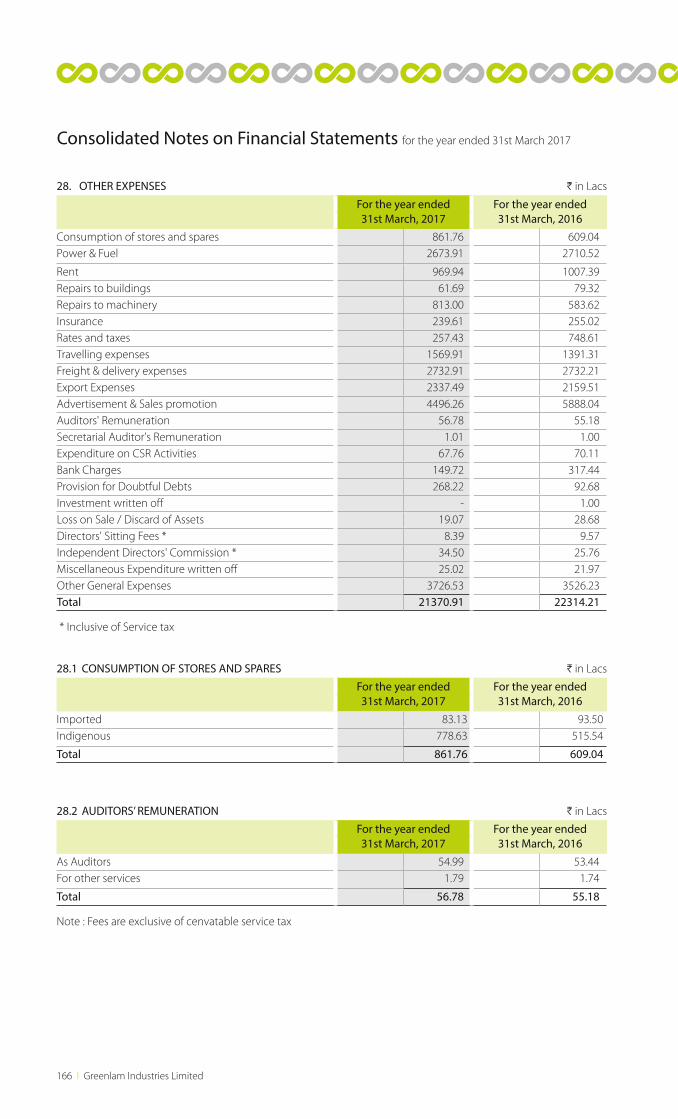
166 l Greenlam Industries Limited
28. OTHER EXPENSES H in Lacs
For the year ended31st March, 2017
For the year ended31st March, 2016
Consumption of stores and spares 861.76 609.04Power & Fuel 2673.91 2710.52
Rent 969.94 1007.39Repairs to buildings 61.69 79.32Repairs to machinery 813.00 583.62Insurance 239.61 255.02Rates and taxes 257.43 748.61Travelling expenses 1569.91 1391.31Freight & delivery expenses 2732.91 2732.21Export Expenses 2337.49 2159.51Advertisement & Sales promotion 4496.26 5888.04Auditors' Remuneration 56.78 55.18Secretarial Auditor's Remuneration 1.01 1.00Expenditure on CSR Activities 67.76 70.11Bank Charges 149.72 317.44Provision for Doubtful Debts 268.22 92.68Investment written off - 1.00Loss on Sale / Discard of Assets 19.07 28.68Directors' Sitting Fees * 8.39 9.57Independent Directors' Commission * 34.50 25.76Miscellaneous Expenditure written off 25.02 21.97Other General Expenses 3726.53 3526.23Total 21370.91 22314.21
* Inclusive of Service tax
28.1 CONSUMPTION OF STORES AND SPARES H in Lacs
For the year ended31st March, 2017
For the year ended31st March, 2016
Imported 83.13 93.50Indigenous 778.63 515.54
Total 861.76 609.04
28.2 AUDITORS’ REMUNERATION H in Lacs
For the year ended31st March, 2017
For the year ended31st March, 2016
As Auditors 54.99 53.44For other services 1.79 1.74
Total 56.78 55.18
Note : Fees are exclusive of cenvatable service tax
Consolidated Notes on Financial Statements for the year ended 31st March 2017
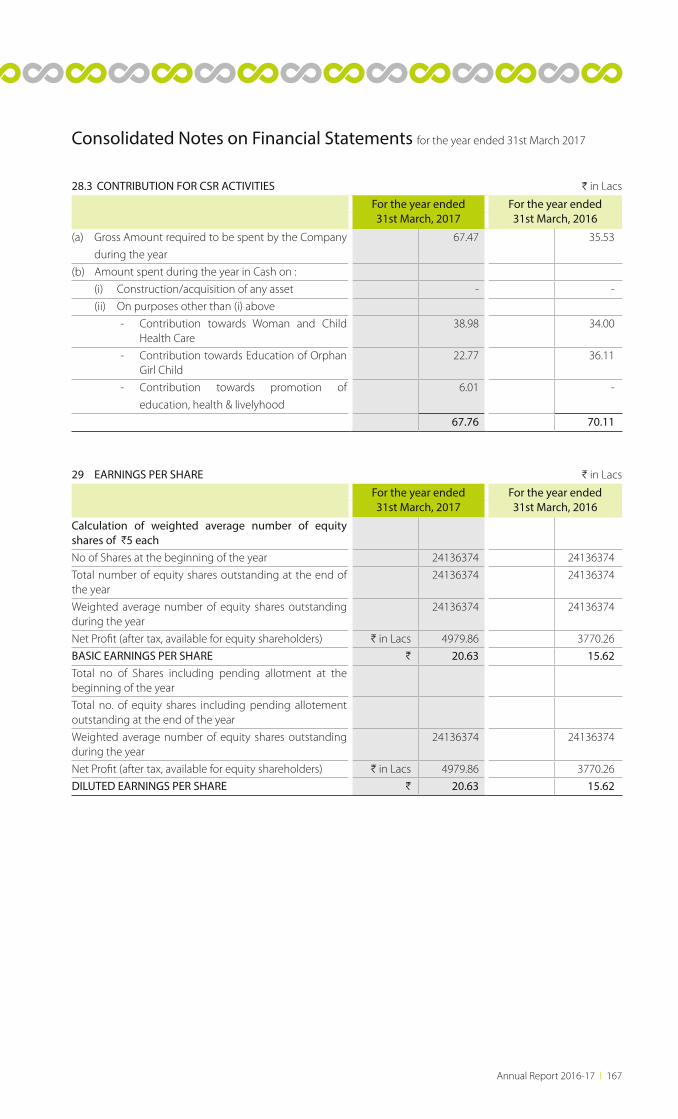
Annual Report 2016-17 l 167
Consolidated Notes on Financial Statements for the year ended 31st March 2017
28.3 CONTRIBUTION FOR CSR ACTIVITIES H in Lacs
For the year ended31st March, 2017
For the year ended31st March, 2016
(a) Gross Amount required to be spent by the Company
during the year
67.47 35.53
(b) Amount spent during the year in Cash on :
(i) Construction/acquisition of any asset - -
(ii) On purposes other than (i) above
- Contribution towards Woman and Child Health Care
38.98 34.00
- Contribution towards Education of Orphan Girl Child
22.77 36.11
- Contribution towards promotion of
education, health & livelyhood
6.01 -
67.76 70.11
29 EARNINGS PER SHARE H in Lacs
For the year ended31st March, 2017
For the year ended31st March, 2016
Calculation of weighted average number of equity shares of H5 eachNo of Shares at the beginning of the year 24136374 24136374
Total number of equity shares outstanding at the end of the year
24136374 24136374
Weighted average number of equity shares outstanding during the year
24136374 24136374
Net Profit (after tax, available for equity shareholders) H in Lacs 4979.86 3770.26
BASIC EARNINGS PER SHARE H 20.63 15.62Total no of Shares including pending allotment at the beginning of the year
Total no. of equity shares including pending allotement outstanding at the end of the year
Weighted average number of equity shares outstanding during the year
24136374 24136374
Net Profit (after tax, available for equity shareholders) H in Lacs 4979.86 3770.26
DILUTED EARNINGS PER SHARE H 20.63 15.62
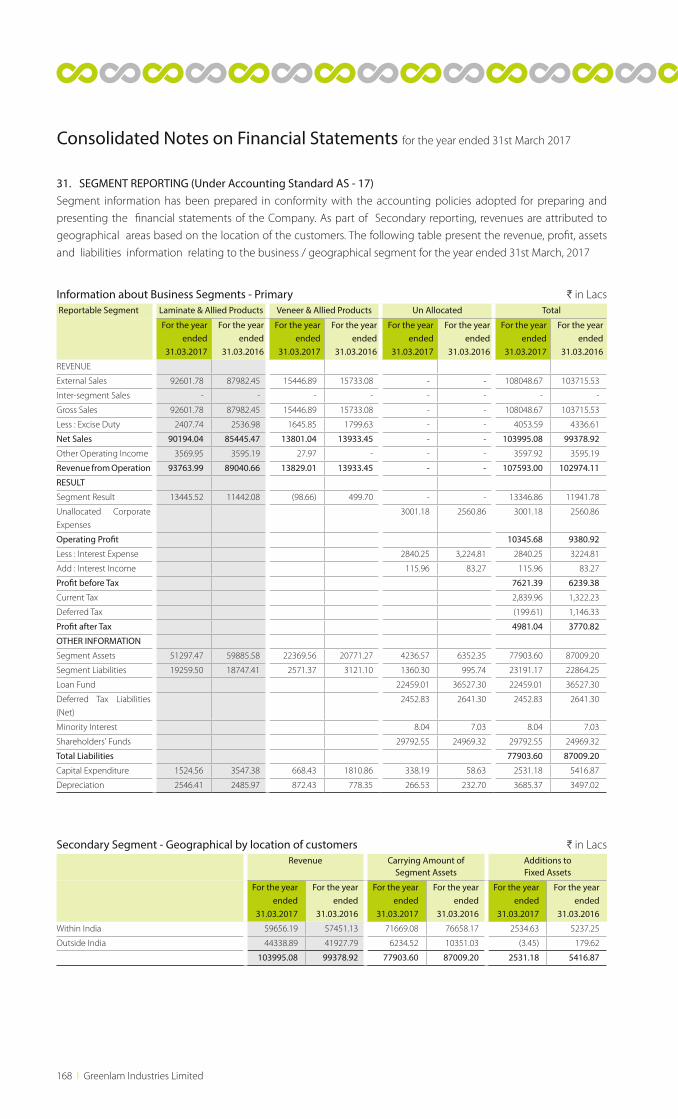
168 l Greenlam Industries Limited
Consolidated Notes on Financial Statements for the year ended 31st March 2017
31. SEGMENT REPORTING (Under Accounting Standard AS - 17) Segment information has been prepared in conformity with the accounting policies adopted for preparing and
presenting the financial statements of the Company. As part of Secondary reporting, revenues are attributed to
geographical areas based on the location of the customers. The following table present the revenue, profit, assets
and liabilities information relating to the business / geographical segment for the year ended 31st March, 2017
Information about Business Segments - Primary H in Lacs Reportable Segment Laminate & Allied Products Veneer & Allied Products Un Allocated Total
For the year ended
31.03.2017
For the year ended
31.03.2016
For the year ended
31.03.2017
For the year ended
31.03.2016
For the year ended
31.03.2017
For the year ended
31.03.2016
For the year ended
31.03.2017
For the year ended
31.03.2016
REVENUE
External Sales 92601.78 87982.45 15446.89 15733.08 - - 108048.67 103715.53
Inter-segment Sales - - - - - - - -
Gross Sales 92601.78 87982.45 15446.89 15733.08 - - 108048.67 103715.53
Less : Excise Duty 2407.74 2536.98 1645.85 1799.63 - - 4053.59 4336.61
Net Sales 90194.04 85445.47 13801.04 13933.45 - - 103995.08 99378.92
Other Operating Income 3569.95 3595.19 27.97 - - - 3597.92 3595.19
Revenue from Operation 93763.99 89040.66 13829.01 13933.45 - - 107593.00 102974.11
RESULT
Segment Result 13445.52 11442.08 (98.66) 499.70 - - 13346.86 11941.78
Unallocated Corporate
Expenses
3001.18 2560.86 3001.18 2560.86
Operating Profit 10345.68 9380.92
Less : Interest Expense 2840.25 3,224.81 2840.25 3224.81
Add : Interest Income 115.96 83.27 115.96 83.27
Profit before Tax 7621.39 6239.38
Current Tax 2,839.96 1,322.23
Deferred Tax (199.61) 1,146.33
Profit after Tax 4981.04 3770.82
OTHER INFORMATION
Segment Assets 51297.47 59885.58 22369.56 20771.27 4236.57 6352.35 77903.60 87009.20
Segment Liabilities 19259.50 18747.41 2571.37 3121.10 1360.30 995.74 23191.17 22864.25
Loan Fund 22459.01 36527.30 22459.01 36527.30
Deferred Tax Liabilities
(Net)
2452.83 2641.30 2452.83 2641.30
Minority Interest 8.04 7.03 8.04 7.03
Shareholders' Funds 29792.55 24969.32 29792.55 24969.32
Total Liabilities 77903.60 87009.20
Capital Expenditure 1524.56 3547.38 668.43 1810.86 338.19 58.63 2531.18 5416.87
Depreciation 2546.41 2485.97 872.43 778.35 266.53 232.70 3685.37 3497.02
Secondary Segment - Geographical by location of customers H in LacsRevenue Carrying Amount of
Segment AssetsAdditions toFixed Assets
For the year ended
31.03.2017
For the year ended
31.03.2016
For the year ended
31.03.2017
For the year ended
31.03.2016
For the year ended
31.03.2017
For the year ended
31.03.2016
Within India 59656.19 57451.13 71669.08 76658.17 2534.63 5237.25
Outside India 44338.89 41927.79 6234.52 10351.03 (3.45) 179.62
103995.08 99378.92 77903.60 87009.20 2531.18 5416.87
Annual Report 2016-17 l 169
30. SEGMENT REPORTING (UNDER ACCOUNTING STANDARD AS - 17) (contd.)
NOTES:
a) Business Segments :
A description of the types of products and services provided by each reportable segment is as follows:
Laminate & Allied Products: The Segment is engaged in the business of manufacturing of Laminates, compact
laminates and other allied products through its wholesale and retail network.
Veneered & Allied Products: The Segment is engaged in the business of manufacturing of Decorative veneers,
Engineered Wood Flooring and other allied products through its wholesale and retail network.
b) Segment Assets and Liabilities :
All Segment Assets and liabilities are directly attributable to the segment. Segment assets include all operating
assets used by the segment and consist principally of fixed assets, inventories, sundry debtors, advances
and operating cash and bank balances. Segment assets and liabilities do not include share capital, reserves
and surplus, borrowings, proposed dividend and income tax (both current and deferred).
c) Segment Revenue and Expenses :
Segment revenue and expenses are directly attributable to the segment. It does not include dividend income,
profit on sale of investments, interest income, interest expense, other expenses which cannot be allocated on
a reasonable basis and provision for income tax (both current and deferred).
31. RELATED PARTY DISCLOSURES AS PER ACCOUNTING STANDARD AS - 18
31.1 List of related parties and relationship:
a) Related parties with whom transactions have taken place during the year.-
Key Management Personnel
i) Mr. Saurabh Mittal, Managing Director & CEO
ii) Mrs. Parul Mittal, Whole-Time Director
iii) Mr. Vijay Kumar Chopra, Independent Director
iv) Mrs. Urvashi Saxena, Independent Director
v) Ms. Sonali Bhagwati Dalal, Independent Director
vi) Mr. Ashok Kumar Sharma, Chief Financial Officer
vii) Mr. Prakash Kumar Biswal, Company Secretary
Enterprises Owned/Influenced by Key Management Personnel or their relatives
i) Himalaya Granites Ltd.
ii) Greenply Industries Ltd.
Relatives of Key Management Personnel
i) Mrs. Parul Mittal (Wife of Mr. Saurabh Mittal)
ii) Seema Realcon Pvt Ltd (Brother of Mrs Parul Mittal is a Director in Seema Realcon Pvt Ltd.)
Consolidated Notes on Financial Statements for the year ended 31st March 2017
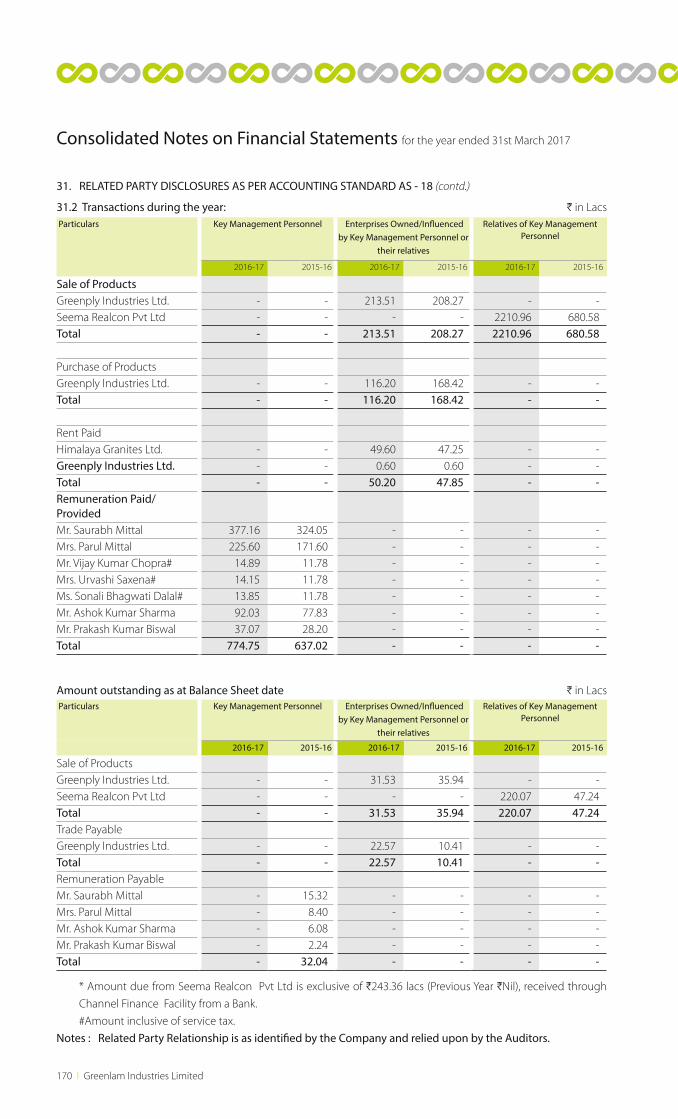
170 l Greenlam Industries Limited
Consolidated Notes on Financial Statements for the year ended 31st March 2017
31. RELATED PARTY DISCLOSURES AS PER ACCOUNTING STANDARD AS - 18 (contd.)
31.2 Transactions during the year: H in Lacs Particulars Key Management Personnel Enterprises Owned/Influenced
by Key Management Personnel or their relatives
Relatives of Key Management Personnel
2016-17 2015-16 2016-17 2015-16 2016-17 2015-16
Sale of ProductsGreenply Industries Ltd. - - 213.51 208.27 - - Seema Realcon Pvt Ltd - - - - 2210.96 680.58 Total - - 213.51 208.27 2210.96 680.58
Purchase of ProductsGreenply Industries Ltd. - - 116.20 168.42 - - Total - - 116.20 168.42 - -
Rent PaidHimalaya Granites Ltd. - - 49.60 47.25 - - Greenply Industries Ltd. - - 0.60 0.60 - - Total - - 50.20 47.85 - - Remuneration Paid/ProvidedMr. Saurabh Mittal 377.16 324.05 - - - - Mrs. Parul Mittal 225.60 171.60 - - - - Mr. Vijay Kumar Chopra# 14.89 11.78 - - - - Mrs. Urvashi Saxena# 14.15 11.78 - - - - Ms. Sonali Bhagwati Dalal# 13.85 11.78 - - - - Mr. Ashok Kumar Sharma 92.03 77.83 - - - - Mr. Prakash Kumar Biswal 37.07 28.20 - - - - Total 774.75 637.02 - - - -
Amount outstanding as at Balance Sheet date H in Lacs Particulars Key Management Personnel Enterprises Owned/Influenced
by Key Management Personnel or their relatives
Relatives of Key Management Personnel
2016-17 2015-16 2016-17 2015-16 2016-17 2015-16
Sale of ProductsGreenply Industries Ltd. - - 31.53 35.94 - - Seema Realcon Pvt Ltd - - - - 220.07 47.24 Total - - 31.53 35.94 220.07 47.24 Trade PayableGreenply Industries Ltd. - - 22.57 10.41 - - Total - - 22.57 10.41 - - Remuneration PayableMr. Saurabh Mittal - 15.32 - - - - Mrs. Parul Mittal - 8.40 - - - - Mr. Ashok Kumar Sharma - 6.08 - - - - Mr. Prakash Kumar Biswal - 2.24 - - - - Total - 32.04 - - - -
* Amount due from Seema Realcon Pvt Ltd is exclusive of H243.36 lacs (Previous Year HNil), received through
Channel Finance Facility from a Bank.
#Amount inclusive of service tax.
Notes : Related Party Relationship is as identified by the Company and relied upon by the Auditors.
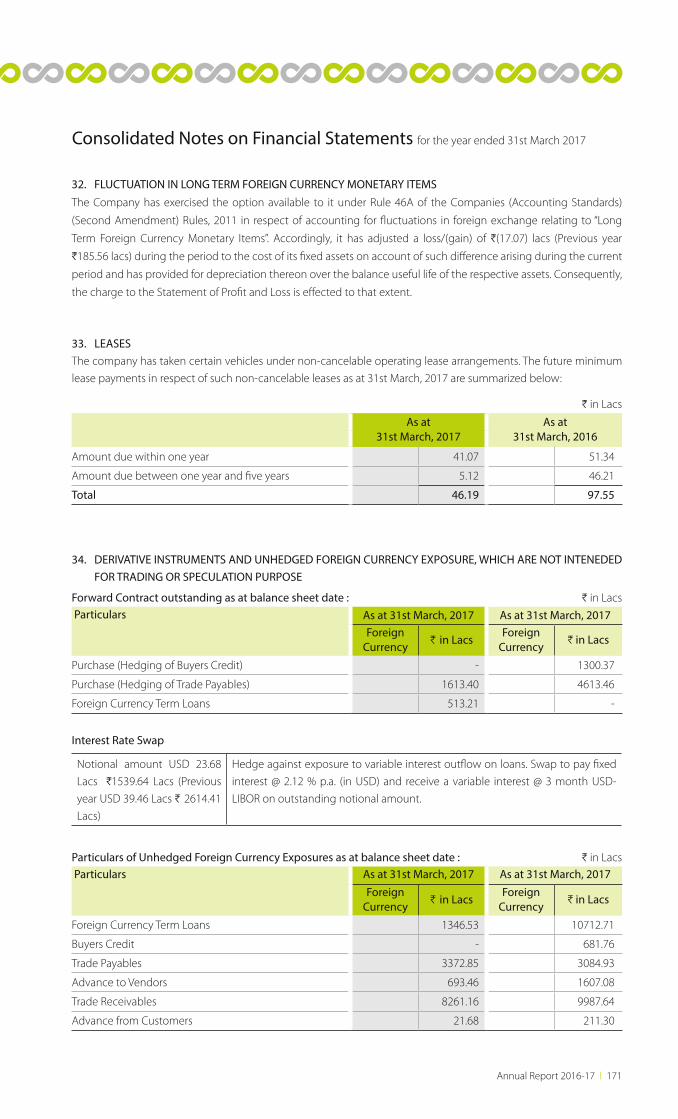
Annual Report 2016-17 l 171
Consolidated Notes on Financial Statements for the year ended 31st March 2017
32. FLUCTUATION IN LONG TERM FOREIGN CURRENCY MONETARY ITEMSThe Company has exercised the option available to it under Rule 46A of the Companies (Accounting Standards)
(Second Amendment) Rules, 2011 in respect of accounting for fluctuations in foreign exchange relating to “Long
Term Foreign Currency Monetary Items”. Accordingly, it has adjusted a loss/(gain) of H(17.07) lacs (Previous year
H185.56 lacs) during the period to the cost of its fixed assets on account of such difference arising during the current
period and has provided for depreciation thereon over the balance useful life of the respective assets. Consequently,
the charge to the Statement of Profit and Loss is effected to that extent.
H in Lacs
As at31st March, 2017
As at31st March, 2016
Amount due within one year 41.07 51.34
Amount due between one year and five years 5.12 46.21
Total 46.19 97.55
34. DERIVATIVE INSTRUMENTS AND UNHEDGED FOREIGN CURRENCY EXPOSURE, WHICH ARE NOT INTENEDED FOR TRADING OR SPECULATION PURPOSE
Forward Contract outstanding as at balance sheet date : H in Lacs Particulars As at 31st March, 2017 As at 31st March, 2017
Foreign Currency
H in LacsForeign
CurrencyH in Lacs
Purchase (Hedging of Buyers Credit) - 1300.37
Purchase (Hedging of Trade Payables) 1613.40 4613.46
Foreign Currency Term Loans 513.21 -
Interest Rate Swap
Notional amount USD 23.68
Lacs H1539.64 Lacs (Previous
year USD 39.46 Lacs H 2614.41
Lacs)
Hedge against exposure to variable interest outflow on loans. Swap to pay fixed
interest @ 2.12 % p.a. (in USD) and receive a variable interest @ 3 month USD-
LIBOR on outstanding notional amount.
Particulars of Unhedged Foreign Currency Exposures as at balance sheet date : H in Lacs Particulars As at 31st March, 2017 As at 31st March, 2017
Foreign Currency
H in LacsForeign
CurrencyH in Lacs
Foreign Currency Term Loans 1346.53 10712.71
Buyers Credit - 681.76
Trade Payables 3372.85 3084.93
Advance to Vendors 693.46 1607.08
Trade Receivables 8261.16 9987.64
Advance from Customers 21.68 211.30
33. LEASES The company has taken certain vehicles under non-cancelable operating lease arrangements. The future minimum
lease payments in respect of such non-cancelable leases as at 31st March, 2017 are summarized below:

172 l Greenlam Industries Limited
Consolidated Notes on Financial Statements for the year ended 31st March 2017
35. INFORMATION REGARDING MICRO, SMALL AND MEDIUM ENTERPRISESBased on the information /documents available with the Company, information as per the requirements of Section 22 of The Micro, Small and Medium Enterprises Development Act, 2006 are as under:
H in Lacs
For the year ended31st March, 2017
For the year ended31st March, 2016
i) Principal amount remaining unpaid to any supplier at the end of accounting year (including retention money against performance).
- -
ii) Interest due on above - -
Total of (i) & (ii) - - iii) Amount of interest paid by the Company to the
suppliers in terms of section 16 of the Act. - -
iv) Amount paid to the suppliers beyond due date during the year
- -
v) Amount of interest due and payable for the period of delay in payments (which have been paid but beyond the due date during the year) but without adding the interest specified under the Act.
- -
vi) Amount of interest accrued and remaining unpaid at the end of accounting year
- -
vii) Amount of further interest remaining due and payable even in the succeeding years, until such date when the interest dues as above are actually paid to the small enterprise, for the purpose of disallowance as a deductible expenditure under section 23 of this Act.
- -
36. INFORMATION REGARDING SPECIFIED BANK NOTES (SBN): H in LacsSpecified Bank Notes Other Bank
NotesTotal
Closing cash in hand as on 8 November 2016 9.13 5.96 15.09(+) Permitted receipts - 16.56 16.56
(-) Permitted payments - 14.72 14.72(-) Amount deposited in banks 9.13 - 9.13Closing cash in hand as on 30 December 2016 - 7.80 7.80
37. Balances under Trade receivables, Trade Payables, Loans and Advances payable or receivable are subject to confirmation to be received from some of the parties.
38. The figures for the previous period are re-classified / re-arranged / re -grouped, wherever necessary so as to be in conformity with the figures of the current period’s classification/disclosure.
As per our annexed report of even date.
For D. DHANDARIA & COMPANY Saurabh Mittal Shiv Prakash Mittal
Chartered Accountants Managing Director and CEO Non Executive Chairman
ICAI Firm Reg. No. 306147E (DIN : 00273917) (DIN : 00237242)
(Dindayal Dhandaria) Ashok Kumar Sharma Prakash Kumar BiswalPartner Chief Financial Officer Company Secretary & AVP - Legal
Membership No. 010928
Place of Signature : New Delhi
Dated : 25th May, 2017
Caution regarding forward-looking statementsThis document contains statements about expected future events and financial and operating results of Greenlam Industries Limited, which are
forward-looking. By their nature, forward-looking statements require the Company to make assumptions and are subject to inherent risks and
uncertainties. There is significant risk that the assumptions, predictions and other forward-looking statements will not prove to be accurate. Readers
are cautioned not to place undue reliance on forward-looking statements as a number of factors could cause assumptions, actual future results
and events to differ materially from those expressed in the forward-looking statements. Accordingly, this document is subject to the disclaimer and
qualified in its entirety by the assumptions, qualifications and risk factors referred to in the management’s discussion and analysis of the Greenlam
Industries Limited annual report 2016-17.
A PRODUCT

www.greenlamindustries.com